International Journal of Scientific & Engineering Research, Volume 6, Issue 1, January-2015 1669
ISSN 2229-5518
IJSER © 2015
http://www.ijser.org
The Performance analysis of an OFDM signal in PAPR by using Signal Clipping
Md. Khalid Hossen1, J.M. Abu Raihan
2, Rajendra Nath Sarkar
3, Md. Shahriar uzzal
4
Abstract— In Orthogonal frequency division multiplexing (OFDM) technique the 3rd and 4th generation network is also introduced. So many ad-
vantages are still in a OFDM technique. There are some disadvantages also. Pick to average power ratio (PAPR) is one of the disadvantages in a
OFDM. There are two types in which called Signal distortion techniques, Symbol-scrambling techniques In this paper we will discuss about signal clip-
ping which under signal distortion technique. In signal clipping we will see PAPR performance and BER performance. By changing the threshold level
the proper PAPR and BER is observed
Index Terms— BER, IDFT, FDM, OFDM, PSK, QAM
1.Introduction
ITH the rapid growth of digital communication in recent years, the
need for high-speed data transmission has increased. New multi-
carrier modulation techniques such as OFDM (Orthogonal frequency-
division multiplexing) are currently being implemented to meet ever in-
creasing demand for more communication capacity [1] [5] [6]. In an OFDM
system, a high-rate serial information-bearing Symbol stream is split into
many low-rate parallel streams [2].
Wireless communications has many advantages, such as speed, simplici-
ty, mobility and flexibility, but in the same time it suffers from, inter-symbol
interference (ISI) and multipath propagation (frequency selective fading).
Supporting high data rates channel of the conventional single carrier sys-
tem required various modulation techniques.OFDM is the most popular
one. The first OFDM scheme was proposed by Chang in 1966[1]. Even
though the concept of OFDM has been around for several years, but it has
not been recognized as a great method for high speed bi-directional wire-
less data communication until recent years. (DVB-T) and Asymmetric
Digital Subscriber Line (ADSL). These days the OFDM technique is con-
sidered as a strong candidate for the fourth generation (4G) of mobile
communication systems. OFDM has many advantages: such as, flexibility
to the channel conditions without the need of channel equalization, ro-
bustness to the fading, and resistance to multipath [1]. On the other hand,
OFDM suffers a high Peak to Average Power Ratio (PAPR). A high PAPR
makes the signal peaks move into the non-linear region of the RF power
amplifier which causes signal distortion. A large PAPR increases the com-
plexity of the analog-todigital and digital-to-analog converters and reduces
the efficiency of the RF power amplifier. Recently, researchers have dis-
covered many techniques on PAPR reduction, for instances, clipping,
peak windowing, tone reservation, tone injection, random phase updating,
coding, and selected mapping (SLM) [4].And we have shown about the
PAPR and BER performance of the reduction
2.1 Ofdm theory
Orthogonal Frequency Division Multiplexing is a special form of multicarri-
er modulation which is particularly suited for transmission over a disper-
sive channel. Here the different carrier’s areorthogonal to each other, that
is, they are totally independent of one another. This is achieved by placing
the carrier exactly at the nulls in the modulation spectra of each other.
Since the symbols are formed by rectangular windowing the carrier func-
tion, the spectrums of OFDM symbol are basically sinc functions [2]. The
comparative bandwidth requirements of FDM and OFDM subcarriers are
shown in figure 1.1. Performing OFDM modulation is same as performing
IFFT (Inverse Fast Fourier Transform) or IDFT (Inverse Discrete Fourier
Transform) on a signal. That’s why IFFT block is used to analyze OFDM
modulation techniques. The equation of IDFT as shown below
1x(k)1
)( /21-L
0k
LknjeL
nx
Here Lknje /2
are the subcarriers that modulate the parallel
bols . Once modulated, these subcarriers shift the bandwidth of the
symbol to a frequency apart. Successive modulation of the subcarriers
with the L parallel symbols takes the whole bandwidth reserved for the
transmission.
2.2 Operational block diagram of OFDM:
Figure 1.1 shows the operational block diagram of OFDM system.First the
data bits are PSK modulated. PSK or QAM modulations are mostly im-
plemented in OFDM as baseband modulation techniques. Their choice
depends on various factors like the bit rate and sensitivity to errors. Then
the signal is serial to parallel converted into L parallel symbols. The output
is fed to the L-point IDFT block with required number of zero padding, if
required any. Based on the delay spread of the multi-path channel, an
adequate guard-interval must be chosen.
Orthogonality of OFDM subcarriers is critical since it prevents inter chan-
nel interference. As such, OFDM is highly sensitive to frequency disper-
sion caused by Doppler shifts [12]. If an OFDM receiver is mobile and
moving towards the transmitter, the Doppler shift can cause a correspond-
ing shift in the OFDM spectrum. This frequency shift causes a subcarrier
to be sampled at a frequency other than the one corresponding to its
peak. As a result, orthogonality is lost and there is a reduction in the signal
amplitude as well as intercarrier interference. The solution for this is the
cyclic prefix.
W
IJSER
International Journal of Scientific & Engineering Research, Volume 6, Issue 1, January-2015 1670
ISSN 2229-5518
IJSER © 2015
http://www.ijser.org
Figure 1.1 also shows the operational block diagram of OFDM receiver. At
the receiver, first the received signals are demodulated by the channel carrier and low pass filtered. These are parallel to serial converted and then PSK demodulated [1]..
The PAPR effect is shown in figure 1.2. And it can be seen that the peak power is about 17 times the average power [4]. The peak to average power ratio (PAPR) of a continuous time signal is
given by [4],
[ ] [ ]
[ ]
And for the discrete time signal PAPR And for the discrete time signal
PAPR
[ ] [ ]
[ ] ----------3
Here X is the symbol streams coming from the IDFT block. Max[X]2 is the
maximum value in the modulated stream in the power form. E[X]2 is the
average power of that stream. The high PAPR is a problem. The main
reason is as shown in the figure 1.2. This happens linearly till the output is
smaller than the saturation power level. As soon as the output crosses
that level, the output varies non-linearly with the input power. That is the
output power of the signal will no longer follow that of input [1]. This results
in signal distortion at the transmitting end. At the receiving end, the bit
error rate achieved will increase. Bit error rate will be intolerable when the
PAPR of the signal is too large.
Fig1.2: For High PAPR problem in OFDM
The input signal to the amplifier in the OFDM system is an analog signal
and the time domain samples of the output from the inverse fast Fourier
transform (IFFT) is [4]
[ ]
√ ∑ [ ]
If the number of subcarriers (N) is large are zero mean Gaussian random
variables. And for complex Gaussian the OFDM signal is Rayleigh distrib-
uted with variance and the phase of the signal is uniform.Thus the proba-
bility of the PAPR of the discrete signal exceeds a threshold is given by
[4]:
Let us show how PAPR increases by increasing the number of subcarriers
N. Assume N Gaussian independent and identically distribute random
variables x(n ) with zero mean and unit power. The average signal power -
-
[
√ | |
]
| |
|
|
| |
| |
The maximum value occurs when all the add coherently, which is
[
√ | |
] [|
√ |]
Thus, the maximum PAPR is N for N subcarriers. One of the major disadvantages of OFDM systems is that the OFDM
signal has high Peak to Average Power Ratio (PAPR), and to deal with
this problem many typical techniques have been proposed. Each one is
different from others in complexity and performance, and can be divided
into three major categories [6]:
3.1 Signal distortion techniques
Signal Clipping
Peak windowing Peak cancellation
3. 2 Coding Schemes
3. 3 Symbol-scrambling techniques .
Signal Clipping:
Fig: 1.1 Block diagram of OFDM system
Non-linear region
Saturation
point
Linear
region
Po
ut
Pi
n
•
IJSER
International Journal of Scientific & Engineering Research, Volume 6, Issue 1, January-2015 1671
ISSN 2229-5518
IJSER © 2015
http://www.ijser.org
Clipping is the simplest technique that is used to reduce PAPR in OFDM
system. The basic idea of this technique is to clip the parts of the signals
that have high peak outside of the allowed region. The following equation
shows the amplitude clipping [5],
| | -------------------------------7
Where A is a positive real number and it presents the clipping level.
The data can transmit from one step to the other data transmission is
shown in the figure. On this figure we can observe that data transmit at
first serial to parallel. Then it modulated PSK modulation. After the PSK
modulated the data signal OFDM modulated. Then scaling the peak power
data will be IFFT. After the completion of IFFT the signal is clipped from
the threshold level. From the threshold level signal is clipped.
4. Mathematical Expression
2 4 6 8 10 12 14 16 18 20
10-4
10-3
10-2
10-1
100
SNR
BE
R
BER vs SNR for 256-point PSK-OFDM
PSK
8-PSK
OFDM
Peak Detector
| |
| |
(Clipped OFDM)
)Signal)
Concatenation
PAPR
Calculation of
Clipped signal
Clipp
ed
Sig-
nal
(OF
DM
Sig
nal)
Yes
No
Fig 1.3 Flow Chart for Signal Clipping
Fig 1.4 Block Diagram for Signal Clipping
Fig 1.5: BER vs SNR for 256 point PSK-OFDM
IJSER
International Journal of Scientific & Engineering Research, Volume 6, Issue 1, January-2015 1672
ISSN 2229-5518
IJSER © 2015
http://www.ijser.org
5. Conclusion:
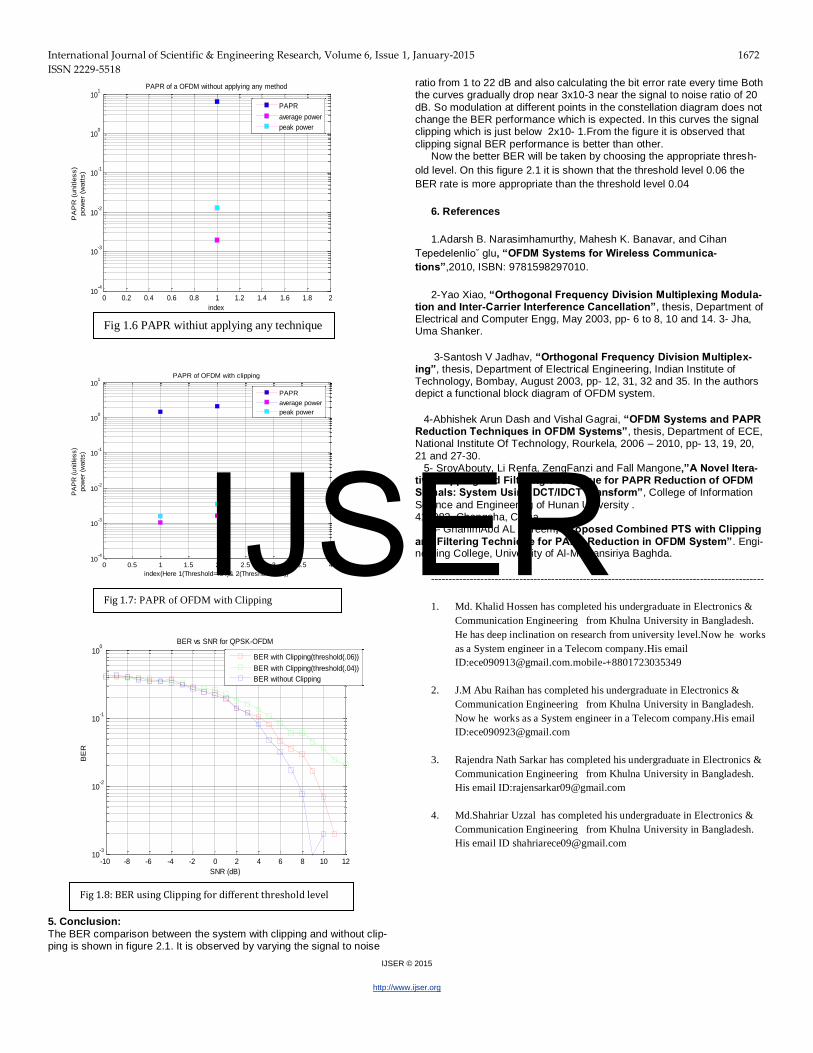
The BER comparison between the system with clipping and without clip-ping is shown in figure 2.1. It is observed by varying the signal to noise
ratio from 1 to 22 dB and also calculating the bit error rate every time Both the curves gradually drop near 3x10⁻³ near the signal to noise ratio of 20
dB. So modulation at different points in the constellation diagram does not change the BER performance which is expected. In this curves the signal clipping which is just below 2x10- 1.From the figure it is observed that
clipping signal BER performance is better than other. Now the better BER will be taken by choosing the appropriate thresh-
old level. On this figure 2.1 it is shown that the threshold level 0.06 the
BER rate is more appropriate than the threshold level 0.04
6. References
1.Adarsh B. Narasimhamurthy, Mahesh K. Banavar, and Cihan
Tepedelenlio˘ glu, “OFDM Systems for Wireless Communica-
tions”,2010, ISBN: 9781598297010.
2-Yao Xiao, “Orthogonal Frequency Division Multiplexing Modula-tion and Inter-Carrier Interference Cancellation”, thesis, Department of Electrical and Computer Engg, May 2003, pp- 6 to 8, 10 and 14. 3- Jha, Uma Shanker.
3-Santosh V Jadhav, “Orthogonal Frequency Division Multiplex-ing”, thesis, Department of Electrical Engineering, Indian Institute of Technology, Bombay, August 2003, pp- 12, 31, 32 and 35. In the authors depict a functional block diagram of OFDM system.
4-Abhishek Arun Dash and Vishal Gagrai, “OFDM Systems and PAPR Reduction Techniques in OFDM Systems”, thesis, Department of ECE, National Institute Of Technology, Rourkela, 2006 – 2010, pp- 13, 19, 20,
21 and 27-30. 5- SroyAbouty, Li Renfa, ZengFanzi and Fall Mangone,”A Novel Itera-tive Clipping and Filtering Technique for PAPR Reduction of OFDM Signals: System Using DCT/IDCT Transform”, College of Information
Science and Engineering of Hunan University . 410082, Changsha, China.
6- GhanimAbd AL Kareem,”Proposed Combined PTS with Clipping
and Filtering Technique for PAPR Reduction in OFDM System”. Engi-neering College, University of Al-Mustansiriya Baghda.
----------------------------------------------------------------------------------------------
1. Md. Khalid Hossen has completed his undergraduate in Electronics &
Communication Engineering from Khulna University in Bangladesh.
He has deep inclination on research from university level.Now he works
as a System engineer in a Telecom company.His email
ID:[email protected]+8801723035349
2. J.M Abu Raihan has completed his undergraduate in Electronics &
Communication Engineering from Khulna University in Bangladesh.
Now he works as a System engineer in a Telecom company.His email
3. Rajendra Nath Sarkar has completed his undergraduate in Electronics &
Communication Engineering from Khulna University in Bangladesh.
His email ID:[email protected]
4. Md.Shahriar Uzzal has completed his undergraduate in Electronics &
Communication Engineering from Khulna University in Bangladesh.
His email ID [email protected]
0 0.2 0.4 0.6 0.8 1 1.2 1.4 1.6 1.8 210
-4
10-3
10-2
10-1
100
101
index
PA
PR
(unitle
ss)
pow
er
(watt
s)
PAPR of a OFDM without applying any method
PAPR
average power
peak power
0 0.5 1 1.5 2 2.5 3 3.5 410
-4
10-3
10-2
10-1
100
101
index(Here 1(Threshold=.04)& 2(Threshold=.06))
PA
PR
(unitle
ss)
pow
er
(watt
s)
PAPR of OFDM with clipping
PAPR
average power
peak power
-10 -8 -6 -4 -2 0 2 4 6 8 10 1210
-3
10-2
10-1
100
SNR (dB)
BE
R
BER vs SNR for QPSK-OFDM
BER with Clipping(threshold(.06))
BER with Clipping(threshold(.04))
BER without Clipping
Fig 1.6 PAPR withiut applying any technique
Fig 1.8: BER using Clipping for different threshold level
Fig 1.7: PAPR of OFDM with Clipping
IJSER