34
The Performance of Canada’s Grain Supply Chains: A Quantitative Analysis Grain Supply Chain Study: Technical Document Grain Monitoring Program Supplemental Study September 2014

The Performance of Canada’s
Grain Supply Chains:
A Quantitative Analysis
Grain Supply Chain Study:
Technical Document
Grain Monitoring Program Supplemental Study
September 2014

2 | Quorum Corporation: The Performance of Canada’s Grain Supply Chain: A Quantitative Analysis

Quorum Corporation: Grain Supply Chain Study | 3
Foreword
On March 18, 2011 the Government of Canada announced its response to the Rail Freight Service Review that was undertaken in 2008 to address the ongoing issues with rail freight service raised by users of the rail freight supply chain.
In December 2011 Quorum Corporation was contracted by Agriculture and Agri-Food Canada (AAFC) and Transport Canada (TC) as part of its mandate as the Grain Monitor, to undertake a supplemental program study to analyze the grain supply chain.
This document was prepared as part of the technical, analytical and research component of the study and is presented as a supplemental work item for the Grain Monitoring Program.

4 | Quorum Corporation: The Performance of Canada’s Grain Supply Chain: A Quantitative Analysis

Quorum Corporation: Grain Supply Chain Study | 5
Contents
FOREWORD ........................................................................................................................................................... 3
INTRODUCTION ..................................................................................................................................................... 7
SCOPE AND APPROACH ......................................................................................................................................... 8
STAKEHOLDER WORKING GROUPS AND THE FORMULATIONS OF THE ANALYSIS APPROACH .................................. 9
Bulk logistics working group ..................................................................................................................................... 9
Containerized Supply Chains .................................................................................................................................. 14
QUANTITATIVE ANALYSIS .................................................................................................................................... 18
Vessel Loading Demand and Operations ................................................................................................................ 18
Grain Stocks ............................................................................................................................................................ 19
Railway Pipeline ..................................................................................................................................................... 19
QUANTITATIVE ANALYSIS KEY FINDINGS .............................................................................................................................. 20
Elevator and port operations ................................................................................................................................. 20
ANALYSIS OF OCEAN VESSEL TRANSIT .................................................................................................................................. 31
CONSIDERATIONS ............................................................................................................................................................ 33
SUMMARY ..................................................................................................................................................................... 34

6 | Quorum Corporation: The Performance of Canada’s Grain Supply Chain: A Quantitative Analysis

Quorum Corporation: Grain Supply Chain Study | 7
Introduction
As noted in the Grain Supply Chain report, a qualitative and quantitative analysis was undertaken as part of
the overall study.
This document provides a thorough discussion of the findings of the analysis with respect to ocean vessel
loading demand and operations; port terminal grain stocks, the railway pipeline and ocean vessel transit
times as well as a discussion of the results of consultative discussions and group meetings that were
undertaken. The analysis looks to determine when the logistics system exhibited signs of stress, what the
apparent causes of that stress were and how the various elements of the grain handling system reacted and
managed that stress.
Important findings from the analysis of the system’s performance during the two year period in question
include the following:
The Vancouver logistics pipeline experienced significant stress during the 2010-2011 grain year as
compared to the prior year. This was evidenced by a substantial backlog of vessels in port waiting
to load grain beginning in October 2010 and lasting until late May 2011;
The majority of the backlog in demand was attributable to Canadian Wheat Board managed grains;
Despite the rising backlog of demand experienced during this time period and the increasing delays
incurred by vessels in port, vessel loading rates and productivity were very similar to those
experienced in the prior year suggesting that terminals did not increase loading performance in
response to the increased vessel delays;
The factors that contributed to this delay in vessel loading at Vancouver were:
o A diversion of approximately 250,000 tonnes of Board grain traffic from Prince Rupert to
Vancouver in the early weeks of the grain year.
o Somewhat higher than normal delays in loading vessels due to more frequent heavy rainfall
events in Vancouver, particularly between January and March of 2011.
o Severe weather events in the railway mountain corridors of British Columbia, particularly on
CP.
o Poor communication from the railways, particularly CP, on their expected ability to recover
from their operating challenges.
The ocean vessel transit times were found to be consistent and reliable, a fact which corresponded to the
industry’s feedback to Quorum.

8 | Quorum Corporation: The Performance of Canada’s Grain Supply Chain: A Quantitative Analysis
ScopeandApproach
Quorum’s approach to the quantitative analysis of supply chain performance was directed by the input
received from industry stakeholders in the bulk and container logistics working sessions and during bilateral
discussions. The complex nature of the Canadian grain supply chain system results in numerous potential
points of failure whether as a result of the failure of a single participant or the inability of multiple participants
to coordinate their respective activities.
In the interest of identifying the areas where performance was most likely an issue, a structured approach to
solicit the input and perspective of the industry participants was employed. Industry working groups for the
bulk and container supply chains were brought together with the objective of identifying the existing system
problems, prioritizing them, identifying potential solutions and perceived barriers to implementing such
solutions. This input defined the framework for the quantitative analysis and the areas of performance to be
examined that would provide the best insight into the supply chain’s performance.
This technical report describes how stakeholder working group sessions were conducted, the key findings
from each session and how these were used to define the analysis. Our discussion of the quantitative
analysis describes the data sources and methodology employed to construct a detailed daily view of all grain
logistics activities from country origins through to the loading of ocean vessels at Vancouver.
The quantitative analysis of the supply chain was performed using data from the 2009-2010 and 2010-2011
period1 and some analysis looks at the period post-CWB. The data for this analysis was graciously provided
by both Class 1 railways, grain companies, the CWB and the Canadian Port Clearance Association. We are
appreciative of their assistance in this regard.
1 This study was begun in 2011 and the quantitative analysis undertaken in early 2012. The period examined was the most current data available at that time.
Quorum Corporation: Grain Supply Chain Study | 9
StakeholderworkinggroupsandtheFormulations
oftheAnalysisApproach
In order to obtain a preliminary assessment of the critical issues affecting supply chain reliability, Quorum
engaged a wide range of grain and logistics industry stakeholders to discuss the performance of the system
and to discuss potential solutions to perceived problems. One of the objectives of the consultative sessions
was to provide direction to the study group on what areas of performance in the system should be examined
and measured. In doing so, issues were identified and their relative importance was ranked by the
participants. This input allowed Quorum to conduct the quantitative analysis of the grain supply chain
performance focused on those areas of greatest concern to stakeholders. The following discussion describes
the results of these discussions, the prioritization of the issues and how the areas of examination were
identified.
Bulklogisticsworkinggroup
The bulk logistics working group included fourteen representatives from eleven different organizations with
many years of experience in transportation and grain logistics. Participants were chosen based on a
combination of their individual experience and their company’s position in the industry with the objective of
achieving representation from each industry sector. Representation from grain companies included five major
companies as well as Inland Terminal Association of Canada (ITAC) members, CN and CP, five grain
terminal operators and representatives from a vessel chartering firm and the Canadian Grain Commission.
In advance of the working group meeting and in consultation with industry, Quorum developed process maps
of the grain logistics systems and shared these maps with the working group participants along with the
meeting agenda. The study team’s objective was to compare the current grain logistics system to a model of
an idealized system and to identify where the current grain supply chains are performing well and where
problems exist. The impact of individual issues was then discussed and the issues were prioritized by the
group. The group then discussed potential solutions and the possible barriers to change. In addition the
group discussed how the planned changes to the Canadian Wheat Board would be expected to affect the
logistics process.
As a guide to discussion, the following principles for effective supply chain operation were presented to the
group.
There should be well developed mechanisms to communicate demand and capacity for planning operations
Partners should have processes that support integrated day to day operations and communication
The system should seek to optimize the output and profitability of the entire supply chain

10 | Quorum Corporation: The Performance of Canada’s Grain Supply Chain: A Quantitative Analysis
This model was not meant to restrict the group’s analysis nor was it suggested that all members of the group
needed to accept this model – it was only a mechanism to foster discussion. With the process maps and
supply chain model as a guide, the team members then participated in a brainstorming process that identified
over 30 specific areas of concern in the current system. The group consolidated the list down to 14 more
general areas and then prioritized the list based upon the participants’ views with respect to the relative
impact of each issue on logistics performance. Seven issues were prioritized much higher than the others
and there was a strong consensus amongst the group as to which issues were most important on six of the
seven issues.2 The issues are presented below in a random order, as the prioritization process was designed
to group issues at a general level but not to provide a more precise ranking of importance.
Issue Description Perceived Impact
Need for supply chain visibility
Stakeholders need to have transparent view of on‐going performance of the system in areas such as:
Railway grain run and spotting plans and performance by local area and by railway corridor
Expected demand for railway and terminal capacity
Daily terminal capacity
Daily terminal unload performance
Vessel line‐up
Lack of current and comprehensive near real time data leads to poor decision making in country sourcing, rail operations and port planning operations.
Use of historical or outdated data inhibits collaboration and innovation.
Labour flexibility
Lack of flexibility in labour agreements
High shift differentials and other restrictions inhibit use of labour in off peak hours to accomplish: rail car unloading, grain sampling and inspection, and ship loading.
Inflexibility in cost effective use of labour resources results in amplification of performance variability and a loss of effective capacity.
Railway labour agreements restrict flexibility to respond to short term demand at primary elevators.
Leads to reduced responsiveness to supply chain needs.
2 The railway representatives did not rank the issue: “structure of rail transportation market” as having an important impact on system performance. All other groups ranked this issue amongst the top issues.
Table 1: Key Issues affecting the performance of bulk grain logistics

Quorum Corporation: Grain Supply Chain Study | 11
Issue Description Perceived Impact
Need for accountability in supply chain
Many parts of the supply chain share common assets – railways, primary and terminal elevators.
Participants are not always responsible for the costs they impose on the system. Congestion caused by an individual stakeholder’s behaviour is not always borne by that stakeholder.
Congestion caused by grain, or other shippers at destination terminals restricts capacity for all users and overall cost of congestion not captured in demurrage charges.
Interline received traffic on a railway cannot be easily controlled by railway and lack of visibility of inbound pipelines compounds problem.
Planned Board demand not known far enough in advance to effectively plan non‐Board sales and logistics through primary and terminal elevators.
Asymmetric effect of congestion increases variability of performance.
Leads to decision making which does not reflect underlying economics and can reduce stakeholders’ incentive to invest due to presence of “free riders”
System recoverability
High utilization of Vancouver port capacity limits ability of system to recover from shocks.
Disruption events have an amplified impact and a longer duration.
Recovery complicated by the lack of complete control of a player over the use of the shared assets of railway and terminal – inhibits effective planning.
Players inhibited from exchanging trading positions at port due to lack of confidence in their ability to balance with future trades.
Structure of rail transportation market
Access to rail capacity is regulated due to the duopoly/monopoly structure of rail transportation market
Transportation market concentration creates pricing power and allows for capacity allocation that is not based on market mechanisms.
Railway market power partially off‐set by current regulatory regime in Canada Transportation Act.
MRE may not deliver commercial accountability and responsiveness but no consensus on alternatives.
Short term demand and capacity issues
Lack of certainty with respect to local rail capacity on week to week basis and lack of medium‐term view of CWB demand at local level.
Some areas seem be chronically waitlisted by railways – lack of available rail capacity
Creates complexity in trading generally and in making local marketing decisions for grain companies at their primary elevators
Results in mismatched local rail capacity and demand
World commodity market variability
Canadian grain marketers must respond to world demand which creates volume peaks from October – December as sellers fit Canadian harvest into cycle of other global harvest times
Idle capacity exists off peak
Missed market opportunities due to congestion during peak months
Peaking and congestion amplify disruptions
Volatility of markets makes it hard to plan for capacity

12 | Quorum Corporation: The Performance of Canada’s Grain Supply Chain: A Quantitative Analysis
Following the discussion of the impact of these issues, the group engaged in a discussion of potential
solutions to the perceived problems, and talked about what the “desired future state” where the problems did
not exist would look like. The group then ranked each of the potential solutions in terms of the expected
likelihood that the solution could be implemented within 5 years, given the current barriers to doing so. Table
2 below summarizes this discussion.
Issue Desired Future State Barriers Possible solutions Likelihood of
implementation within 5 years
Need for supply chain visibility
Accurate demand, capacity and performance information available to stakeholders in real time
‐ credible and granular information
Confidentiality issues due to concentration in the industry
some partners may risk revealing commercial information
Development of shared management metrics from country to vessel
Service level agreements
Confidential, commercial agreements
Grain system performance metrics for benchmarking
HIGH
Labour performance
Collective agreements that ensure that:
Rail cars unloaded as soon as they arrive
Empties pulled as soon as they are unloaded
Ship loading not delayed unnecessarily for rain
No disruptions to supply chain due to labour disputes
Collective bargaining has not produced agreements that are both flexible and cost effective
Regulations affecting hours of service for railway employees
1. Collective agreements with cost effective flexibility of labour
2. Solutions which yield better visibility will increase partners willingness to schedule off‐shift labour as there will be more certainty it will be used effectively
1. LOW
2. HIGH
Need for accountability in supply chain
Balanced accountability for the costs imposed by stakeholders
Cars not shipped to ports without terminal authorization
Clear causality for congestion issues
Greater logistics discipline
Common carrier obligations of railways to accept traffic as it is provided
Interline relationships on received traffic by railways
Difficulty of identifying causality in a network industry
1. Terminal authorization processes at port terminals
2. Commercial take or pay type relationships with marketing agencies using terminals
HIGH
Table 2: Desired future state, barriers and solutions

Quorum Corporation: Grain Supply Chain Study | 13
Issue Desired Future State Barriers Possible solutions Likelihood of
implementation within 5 years
System recoverability
Collaborative responses to variability in demand or capacity (disruptions)
Less variability of performance by key asset owners: railways and port terminals
Adequate capacity to allow for recovery on railways and at terminals
Ability of terminals to be responsive – labour and physical limitations
Risk of loss of existing railway contingent capacity
Competitive and commercial barriers to collaboration
ocean, terminal and railway partners have different commercial priorities
1. Better rain protection for ship loading to increase effective capacity
2. Improved transparency of rail, port and vessel performance could improve willingness of partners to optimize resource use.
3. Additional investments in port terminal capacity and port rail capacity
HIGH
Structure of rail transportation market
A balanced commercial environment where railways and shippers have the leverage they feel they require to negotiate balanced commercial agreements
Existing regulatory framework limits railways & shippers
Shippers may not have leverage to negotiate satisfactory service agreements
Railways may not have incentive to provide premium services
Common carrier obligations limit carriers options to provide contract carriage
1. Commercially based open access for rail competition
2. Regulatory environment that allows railways and shippers to negotiate commercially balanced service agreements
3. Increased rail and terminal competition via Longview, Seattle, New Orleans
1 & 2. LOW
3. MEDIUM
Short term demand and capacity issues
Short term match between demand and capacity for local railway services
Railways have more flexibility to respond to variation in local demand
Uncertainty of near term Board demand at primary elevators
Uncertainty of underlying demand in commodity markets
Capacity planning timelines longer than demand timelines
Forward demand signals in primary elevator network may be clearer without the Board in their current role
Will provide longer view to railways and grain elevators to react to demand fluctuations
HIGH
World commodity market variability
Minimal seasonal peaking of demand
Negotiated service agreements allowing for better management of peaks
Underlying market fundamentals will not change as peaks determined by competing harvest cycles in other regions of the world
Cost of investment to manage peaks including: capital, storage and inventory costs are prohibitive
1. Forward positioning of inventory
2. Better utilization of on‐farm storage
3. On farm grain purchasing
4. Reduced market peaking due to clear market signals post‐Board monopoly.
HIGH Likelihood
Low Expected Impact

14 | Quorum Corporation: The Performance of Canada’s Grain Supply Chain: A Quantitative Analysis
ContainerizedSupplyChains
As with the bulk supply chain process, a working group provided input to the analysis of problems and
solutions in the containerized grain supply chain. Stakeholders in this group represented the largest shippers
in the pulse and special crops industry who are some of the major users of the containerized grain supply
chain. In addition, representatives of the railways, transload operators, container shipping lines and freight
forwarders participated in the session.
The group’s discussion focused on the key container logistics processes including container booking, rail car
ordering, railway transportation, transloading and port operations. These processes were structured to reflect
the three different logistics patterns in use today for the movement of these grain products namely: source
loading of ocean containers, hopper and boxcar movement to port transload operations, and use of domestic
railway intermodal equipment to port transload operations.
The group that was assembled to review container shipping issues was convened under the sponsorship of
Pulse Canada’s Transportation Technical Working Group. This group which represents interests from the
stakeholder groups listed above, has been working on issues related to containerized grain transportation
(as well as transportation issues generally) for over three years. As the group had previously engaged in
various prioritization discussions, the list of issues that were currently under discussion by the group were
the focus of discussion, without the need for further prioritization. Table 3 summarizes these issues.
Issue Description Perceived Impact
Unreliable rail car demand and rail car supply performance and communication
(affects rail car to container transload)
Lack of accurate and timely information flow from railways to shippers regarding car supply / allocation / spotting times
Insufficient box car supply to meet shipper demand
Railway supply planning complicated by a perception of inaccuracy in car orders/phantom orders
Increase in order lead times to as much as 60 days to compensate for uncertainty in car supply performance
Loss of reputation for reliability in shippers’ final markets
Increased cost to shippers to arrange alternate transportation to satisfy sales requirements.
Table 3: Key issues affecting the performance of containerized grain logistics

Quorum Corporation: Grain Supply Chain Study | 15
Issue Description Perceived Impact
Lack of accountability in container booking process
Generally, there are no direct financial consequences to shippers for failing to utilize a container booking and there are no direct consequences to shipping lines for failing to provide a container against a booking.
Uncertainty in capacity planning for both shippers and shipping lines leads to uncertainty in planning affecting shipper marketing decisions, transloader workload planning and shipping line vessel planning and marketing.
Evidence of this is found in:
Vessels departing “light” due to no shows on confirmed bookings
No containers available for shippers at port or at inland container terminals despite having valid booking with shipping line
Lack of advance notice by shipping lines of rolled or split cargo
Last minute cuts of container allocation at port
Overbooking of containers by shipping lines
Periodic congestion at transload facilities
During times of peak transportation demand, transload facilities, particularly near ports of Vancouver and Montreal may be come congested with inbound rail and intermodal traffic.
This is due to a combination of bunching of traffic in transit to transloaders and due to shipments being directed to transloaders without either terminal authorization or valid container bookings.
Increased costs for transloaders in rail car and container demurrage/detention.
Increased operating costs.
Potential lost sales or penalties if containers do not meet booking cut‐offs.
Unfair/ineffective port reservation systems
Systems and processes for reservations for gate appointments at Vancouver port container terminals do not result in a fair allocation of appointment slots to users with legitimate container bookings
Reservations must be made 3 days in advance for Deltaport and 24 hours in advance for inner harbour terminals. Systems and processes may not reflect actual business processes and needs.
As container supply and delivery requirements cannot always be made as far in advance as reservation system requires, penalties are applied to transloader/drayage operator who has not caused problem.
Block reservations made without accurate booking references allow carriers to pick up more containers than exist on bookings leading to shortages for operators with legitimate needs
Lottery type approach to making reservations places burdens on drayage operators and encourages gaming the system.
As with the bulk working group, the Pulse Canada Transportation Technical Working Group also reviewed
potential solutions, barriers and discussed the feasibility of change in the medium term and Table 4
summarizes that discussion.

16 | Quorum Corporation: The Performance of Canada’s Grain Supply Chain: A Quantitative Analysis
Issue Desired Future State Barriers Possible solutions Likelihood of
implementation within 5 years
Unreliable rail car demand and supply performance and communication
(affects rail car to container transload)
Railway Perspective
More uptake by shippers on ability to order cars up to 16 weeks out (CN) and for even longer periods on CP
Longer term car demand forecast provided by shippers to railways
All cars loaded within tariff conditions
Elimination of phantom orders
Visibility of the shipper’s ocean commitment (booking) that matches with car order
Shipper Perspective
Feedback loop to shippers from all service providers with respect to the service commitment
Predictability of car supply by day for shippers
All cars delivered to shippers suitable for loading (condition)
Unpredictable unloading performance at destination
Fixed railcar fleets (capacity) in short term
Product (crop) sourcing issues related to weather, spring road bans affect predictability of demand.
Rail performance variability encourages gaming system, and switching modes and sources
Price competition between modes is variable within lead times (60 days) leading to mode switching
1. Proactive communication from railways in advance of spotting failures
2. Increased use of domestic intermodal and 40 foot ocean containers in domestic repositioning service for grain transload at ports
3. More consistent railway transit times on small lot shipments in boxcars and hopper cars.
1. MEDIUM
2. HIGH
3. Unknown
Lack of accountability in container booking process
Shipping Line Perspective
Cargo shows up for vessel Clarity of expectations for timing, quantity on both sides No block bookings No unused bookings Shipper perspective
Shipping line provides containers consistent with contract terms
Shippers’ commitments for delivery windows at port reflect reasonable flexibility and reflect the capability of the rail and transload systems to deliver
Transparency of communication
Proactive communication of expected failure to arrive 7 days prior to documentation cut‐off times
No consequences for poor performance
Existing market signals not changing behaviours
Competitive risk to first mover that tries to implement booking fees
1. Timely notification of container availability or booking cancellation by shipping line.
2. Cancellation fees imposed by shipping lines and rolled booking penalties paid by booking lines
1. MEDIUM
2. Unknown
Table 4: Containerized logistics - desired future state, barriers, and solutions

Quorum Corporation: Grain Supply Chain Study | 17
Periodic congestion at transload facilities
Predictability (reliability of transit times)
Transloaders empowered by reliable information to communicate with partners and plan workload
Predictability (reliability of transit times) supports planning for transloaders and shipping lines
Container availability predictable 48 hours prior to railcar placement
No traffic directed towards transloaders without a commercial agreement/terminal authorization
Fixed short term throughput capacity
ST inflexibility in rail service (number of switches per day)
Performance variability of arrival doesn’t match switching services
VCR region co‐production – creates barriers to effective communication from RR to RR to shipper
Lack of harmonization (standardization) in trans‐loader processes for booking
No terminal authorization process for intermodal / over the road truck traffic destined to trans‐loaders
1. Standardized transloader terminal authorization processes
2. Increased discipline by transloaders of their and their customers’ business processes, in response to competitive pressures
1. LOW
2. HIGH
Unfair & ineffective port reservation systems
Empty containers not released without valid booking within cut‐off period
Reservation process not onerous and not subject to gaming or improper use
Entrenched interests resisting change
Block reservations still allowed
1. More effective and fair terminal gate reservations systems
1. MEDIUM

18 | Quorum Corporation: The Performance of Canada’s Grain Supply Chain: A Quantitative Analysis
QuantitativeAnalysis
The quantitative analysis of supply chain performance was guided by the issues identified by stakeholders
during consultations and in particular, the availability of data from individual stakeholders. While it would
have been desirable to conduct a comprehensive analysis of all grain supply chain corridors; time, resource,
data and financial constraints dictated that the analysis would be focused on the export corridor where the
most significant constraints were identified. As a result, the quantitative analysis discussed below focuses
on the movement of grains to and through the Port of Vancouver during the 2009-10 and 2010-11 grain year
study period.
The analysis examines the performance of the grain logistics system during this two year period and attempts
to determine the following:
1. When during the study period did the logistics system exhibit signs of stress?
2. What were the apparent causes of stress?
3. How did the different elements of the grain handling system react during periods of stress?
These issues have been assessed using comprehensive data for each component of the logistics chain
including railway movement, railcar unloading, terminal inventory, vessel demand and vessel loading
activities.
VesselLoadingDemandandOperations
A daily view of demand for grain at the Port of Vancouver for each grain and grade was constructed using
marine vessel line up information produced by the Canadian Ports Clearance Association (CPCA) in
combination with vessel shipment data3 detailing actual vessel loadings by commodity by grain terminal. The
“demand” for loading grain at port, was calculated by taking the total grain volume by grain and grade loaded
to each vessel at the port, and assigning that volume to the day each vessel passed inspection and was
ready for loading. The demand for an individual vessel remained in each subsequent day’s demand after
vessel inspection, until the grain was loaded to the vessel.
In order to determine how well the supply chain was performing, some overall measure of supply chain
success was required. As stakeholders had indicated that a key constraint was throughput at the Port of
Vancouver, delays to loading of bulk grain vessels were taken as the indicator of overall supply chain
performance. As the identified bottleneck in the system, the performance of this indicator would reveal
whether or not there were problems overall in the supply chain. As a result, this analysis begins with the
performance of vessel loading at Vancouver, and having identified periods of stress in that process, looks to
understand how the performance of other components of the supply chain may have contributed to problems
at the port.
3 This data is produced by the Canadian Grain Commission and provided to Quorum Corporation as part of the ongoing Grain Monitoring Program.

Quorum Corporation: Grain Supply Chain Study | 19
Key areas of examination included:
The magnitude and timing of demand for grain at the port;
Total time spent in port by marine vessels and delays incurred by vessels waiting for grain;
Supply – demand balances for individual grains over time and;
Productivity of loading operations over time.
Vessel loading performance at grain terminals was examined from two perspectives. Canadian Grain
Commission vessel shipment data was used to determine the overall performance for all vessels loading at
the port during the study period and to identify the time required for vessels to be loaded.
In addition, a detailed analysis of vessel loading performance was also undertaken using a subset of total
vessel loading activity. This analysis used detailed loading records for individual vessels provided by two of
the major Vancouver grain terminal owners consisting of 421 complete or partial vessel trips representing
552 individual vessel loading events4 accounting for a total of 11.3 million tonnes of grain.
This sample represents 36% of total vessel loading events and 38% of total grain loaded at the Port of
Vancouver during the study period. While this data included information about some vessel activity at all
major Vancouver grain terminals, it represented 100% of the vessels that loaded at one of the Vancouver
terminals and 93% of vessels at another terminal. During the study period, one of the terminals was almost
exclusively involved in the movement of non-Board grains and the other was almost entirely focused on
Board grains.
The objective of this analysis was to examine vessel loading productivity at grain terminals and the factors
negatively impacting these activities.
GrainStocks
A daily inventory of available stocks was developed by individual grain and grade for each grain terminal at
the Port of Vancouver using daily stocks data provided by the CPCA. Stock information consisted of tonnage
of individual grain and grades available for shipment reported to the CPCA by each grain terminal on a daily
basis throughout the study period.
RailwayPipeline
A daily view of all railcar shipments from country origins to the Port of Vancouver was constructed for all grain
movements using individual car movement data supplied by Canadian National and Canadian Pacific
railways.5 Using individual car location events all railcars were assigned a daily location in one of four
designated geographic zones within the pipeline including:
4 A vessel loading event is defined as an individual vessel loading at a specific grain terminal berth in the course of a specific visit to the Port. A single vessel can represent one or more loading events depending on the number of individual terminal berths it uses to load its cargo during the course of its time at the Port. 5 Total railcar movements and railcar unloads at the Port of Vancouver for the study period were approximately 324,000

20 | Quorum Corporation: The Performance of Canada’s Grain Supply Chain: A Quantitative Analysis
Country – east of the Rocky Mountains
Mountain – west of the Rocky Mountains not yet arrived at Vancouver
Rail Terminal – arrived at the CN or CP Vancouver terminal but not delivered to the port terminal
Grain terminal – physically delivered to the port terminals and available for unloading
The railway movement data was matched at the individual railcar trip level with railcar unloading data6 at
each of the port terminals providing a daily view of all inbound grain by grain type and grade destined to each
individual grain terminal including the proximity of supply to the Port based on its location in the pipeline.
QuantitativeAnalysisKeyFindings
Elevatorandportoperations
Stakeholders indicated that congestion at the heavily utilized Port of Vancouver was a major source of sub-
optimal performance of the grain logistics system. The quantitative analysis was conducted in order to obtain
greater insight into the underlying
causes of congestion and to study the
way the system responded to periods of
congestion. Data provided by the
Canadian Ports Clearance
Association and the Canadian Grain
Commission was used to identify the
number of vessels that were available
for loading at the port of Vancouver on
a daily basis.7 In addition, total
demand for grain represented by the
vessels waiting loading, or partially
loaded at the port was also analyzed.8
This review identified periods of
congestion that could then be studied
in more detail. Figure 1 shows both
the total number of grain vessels in
port that had passed inspection and that were awaiting completion of loading and the cumulative number of
6 This data is produced by the Canadian Grain Commission and provided to Quorum Corporation as part of the ongoing Grain Monitoring Program. 7 Vessels were determined to be available for loading after they had passed safety and phytosanitary inspection by Transport Canada and the Canadian Food Inspection Agency at the Port of Vancouver. 8 The “demand” for grain as represented by a vessel arriving at the port was determined by looking at the grain that the vessel ultimately loaded at Vancouver terminal elevators. In calculating the demand for grain loading on a given day, the total volume by grain and grade of all grains that were loaded by the vessels waiting at the port was ascribed to the first day that a vessel arrived at the port. That daily demand was then applied to each subsequent day until the grain was actually loaded to the vessel. For vessels that were partially loaded on a given day, the grain that was actually loaded to the vessel was removed from the outstanding demand on the day it was loaded.
0
5
10
15
20
25
30
0
50
100
150
200
250
300
350
400
450
Vessel delay days left axis Vessel count ‐ right axis
Figure 1: Vessel Delays at port of Vancouver (7 day moving average)

Quorum Corporation: Grain Supply Chain Study | 21
vessel delay days represented by those vessels.9 As can be seen in the graph, the average weekly vessel
count and the total days vessels were delayed climbed quite steadily from the fall of 2010 and did not decline
until the spring of 2011.
The data show that overall during the period under study, the time taken for a vessel to clear the port
increases with the number of vessels in port. This is also illustrated in Figure 2 below which shows the direct
relationship between the number of days in port and the total vessel delay days.
This data suggests that the port terminals were not able to keep up with the increasing number of vessels
waiting to load. As the number of vessels waiting increased, average loading time grew. When only 10
vessels were in port it took an average of approximately 8 days for the vessel to complete loading however,
when there were 25 vessels in port it
took an average of approximately 13
days to complete loading – an increase
in time in port of 63%. To determine the
potential causes of delay, particularly
during the period from October 2010 to
May 2011 further review and analysis
was undertaken.
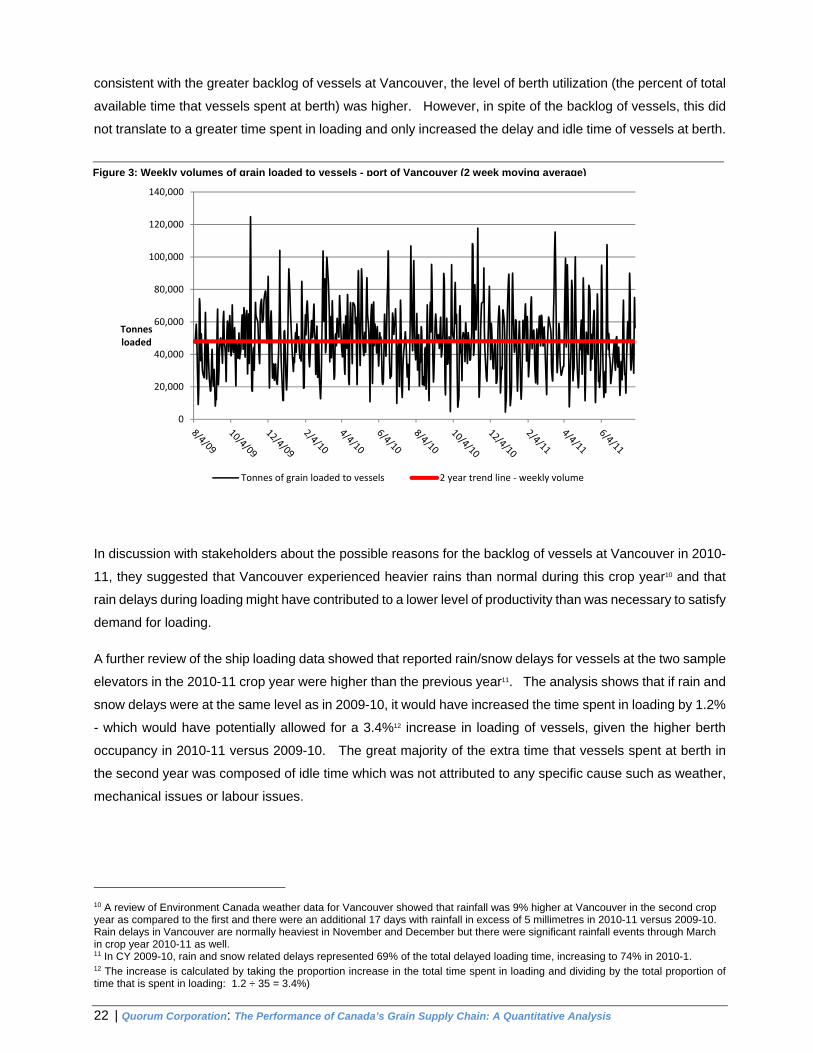
The first step was to examine the weekly
port terminal loading performance.
Figure 3 shows the total volume of grain
loaded to vessels on a weekly basis at
the Port of Vancouver during the study
period.
It shows that while loading volumes vary
widely on a week to week basis, the trend in overall weekly volume across the two years was flat, suggesting
that through this period the port saw neither improvements nor degradation in the actual loading of vessels.
As noted earlier, detailed data on ship loading activity was provided for two of the five terminals in Vancouver.
One of the terminals was almost exclusively involved in handling non-Board grains and the other handled
mostly Board grains. The data provided a detailed view of port terminal berth utilization during the study
period for these sample terminals. Figure 4 summarizes this examination of the detailed records on the
activity at these terminals for each of the two years and depicts the percentage of time that vessels spent
loading, were idle at berth, and were delayed. The analysis showed that the total time spent loading vessels
was virtually unchanged from one year to the next, which is consistent with the data in Figure 3 above that
showed no material increase in average loading rates between the two crop years. In the second year,
9 Vessel delay days are calculated by adding up the multiple of each vessel’s total days spent waiting in port, for a given day. So if 10 vessels are in port and all vessels have been in port for 10 days, the total vessel delay days would be 100.
R² = 0.7742
0
50
100
150
200
250
300
350
400
450
0 5 10 15 20 25 30
Number of vessels in port
Figure 2: Cumulative vessel delay days vs. number of grain vessels in port (scatter plot)
22 | Quorum Corporation: The Performance of Canada’s Grain Supply Chain: A Quantitative Analysis
consistent with the greater backlog of vessels at Vancouver, the level of berth utilization (the percent of total
available time that vessels spent at berth) was higher. However, in spite of the backlog of vessels, this did
not translate to a greater time spent in loading and only increased the delay and idle time of vessels at berth.
In discussion with stakeholders about the possible reasons for the backlog of vessels at Vancouver in 2010-
11, they suggested that Vancouver experienced heavier rains than normal during this crop year10 and that
rain delays during loading might have contributed to a lower level of productivity than was necessary to satisfy
demand for loading.
A further review of the ship loading data showed that reported rain/snow delays for vessels at the two sample
elevators in the 2010-11 crop year were higher than the previous year11. The analysis shows that if rain and
snow delays were at the same level as in 2009-10, it would have increased the time spent in loading by 1.2%
- which would have potentially allowed for a 3.4%12 increase in loading of vessels, given the higher berth
occupancy in 2010-11 versus 2009-10. The great majority of the extra time that vessels spent at berth in
the second year was composed of idle time which was not attributed to any specific cause such as weather,
mechanical issues or labour issues.
10 A review of Environment Canada weather data for Vancouver showed that rainfall was 9% higher at Vancouver in the second crop year as compared to the first and there were an additional 17 days with rainfall in excess of 5 millimetres in 2010-11 versus 2009-10. Rain delays in Vancouver are normally heaviest in November and December but there were significant rainfall events through March in crop year 2010-11 as well. 11 In CY 2009-10, rain and snow related delays represented 69% of the total delayed loading time, increasing to 74% in 2010-1. 12 The increase is calculated by taking the proportion increase in the total time spent in loading and dividing by the total proportion of time that is spent in loading: 1.2 ÷ 35 = 3.4%)
Figure 3: Weekly volumes of grain loaded to vessels - port of Vancouver (2 week moving average)
0
20,000
40,000
60,000
80,000
100,000
120,000
140,000
Tonnes loaded
Tonnes of grain loaded to vessels 2 year trend line ‐ weekly volume

Quorum Corporation: Grain Supply Chain Study | 23
The challenge faced by industry
during the period in question was
the backlog of demand, as
reflected in the increasing
amount of grain vessels waiting
at the port through that period.
Figure 5 below shows the total
backlog at Vancouver over the
course of the two crop years. As
can be seen from the graph, the
majority of increased demand, or
backlogged loading, was for
Board grains. This backlog
began to increase in October
2010 and was not cleared until
the spring – mirroring the graph
displayed earlier showing vessel
delays in port. The average
backlog or queue of vessels in
the peak months between
October and March of the first
crop year amounted to 409,000
tonnes of grain representing
loading demand of 10.5 vessels.
In the second year, during this
same peak period, the average
queue of vessels represented
Figure 5: Demand for loading of grain at the port of Vancouver - 2009 - 2011 (4 week rolling average)
38%
11%
35%
16%
Idle Delayed loading Loading Berth unoccupied
Grain Year2009‐2010
42%
12%
35%
11%
Idle Delayed loading Loading Berth unoccupied
Grain
Year
Figure 4: Sample Vancouver grain terminal elevators: berth utilization data
24 | Quorum Corporation: The Performance of Canada’s Grain Supply Chain: A Quantitative Analysis
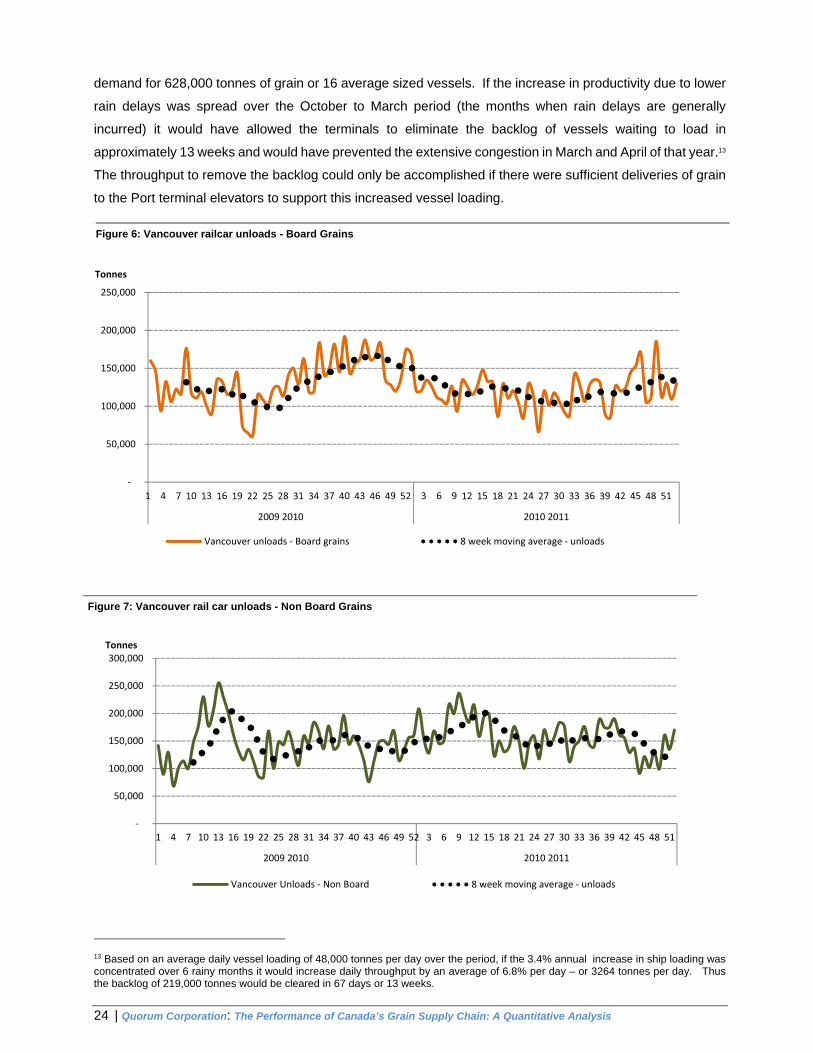
demand for 628,000 tonnes of grain or 16 average sized vessels. If the increase in productivity due to lower
rain delays was spread over the October to March period (the months when rain delays are generally
incurred) it would have allowed the terminals to eliminate the backlog of vessels waiting to load in
approximately 13 weeks and would have prevented the extensive congestion in March and April of that year.13
The throughput to remove the backlog could only be accomplished if there were sufficient deliveries of grain
to the Port terminal elevators to support this increased vessel loading.
13 Based on an average daily vessel loading of 48,000 tonnes per day over the period, if the 3.4% annual increase in ship loading was concentrated over 6 rainy months it would increase daily throughput by an average of 6.8% per day – or 3264 tonnes per day. Thus the backlog of 219,000 tonnes would be cleared in 67 days or 13 weeks.
Figure 7: Vancouver rail car unloads - Non Board Grains
‐
50,000
100,000
150,000
200,000
250,000
2009 2010 2010 2011
Tonnes
Vancouver unloads ‐ Board grains 8 week moving average ‐ unloads
‐
50,000
100,000
150,000
200,000
250,000
300,000
1 4 7 10 13 16 19 22 25 28 31 34 37 40 43 46 49 52 3 6 9 12 15 18 21 24 27 30 33 36 39 42 45 48 51
2009 2010 2010 2011
Tonnes
Vancouver Unloads ‐ Non Board 8 week moving average ‐ unloads
Figure 6: Vancouver railcar unloads - Board Grains
Quorum Corporation: Grain Supply Chain Study | 25
Figures 6 and 7 shows the total volume in tonnes of grain unloaded from railcars at Vancouver port terminals
by week for the two crop years. The data show that the unload pattern for non-Board grains was similar
across the two crop years with volume peaks in receipts shown post harvest and then again in the spring.
For Board grains however, a strong peak in receipts was not experienced post harvest and the spring peak
much lower in 2011 than in the previous year.
The arrival of ships at Vancouver for loading of Board grains and the subsequent delays to loading of these
vessels that is seen in the earlier data suggest that the Board had the expectation to ship higher volumes of
grain through the Port of Vancouver than was achieved through most of crop year 2010-2011. A review of
the make-up of the pent up demand at Vancouver for Board grains and the performance of the rail logistics
system provides further insight into the causes of this congestion.
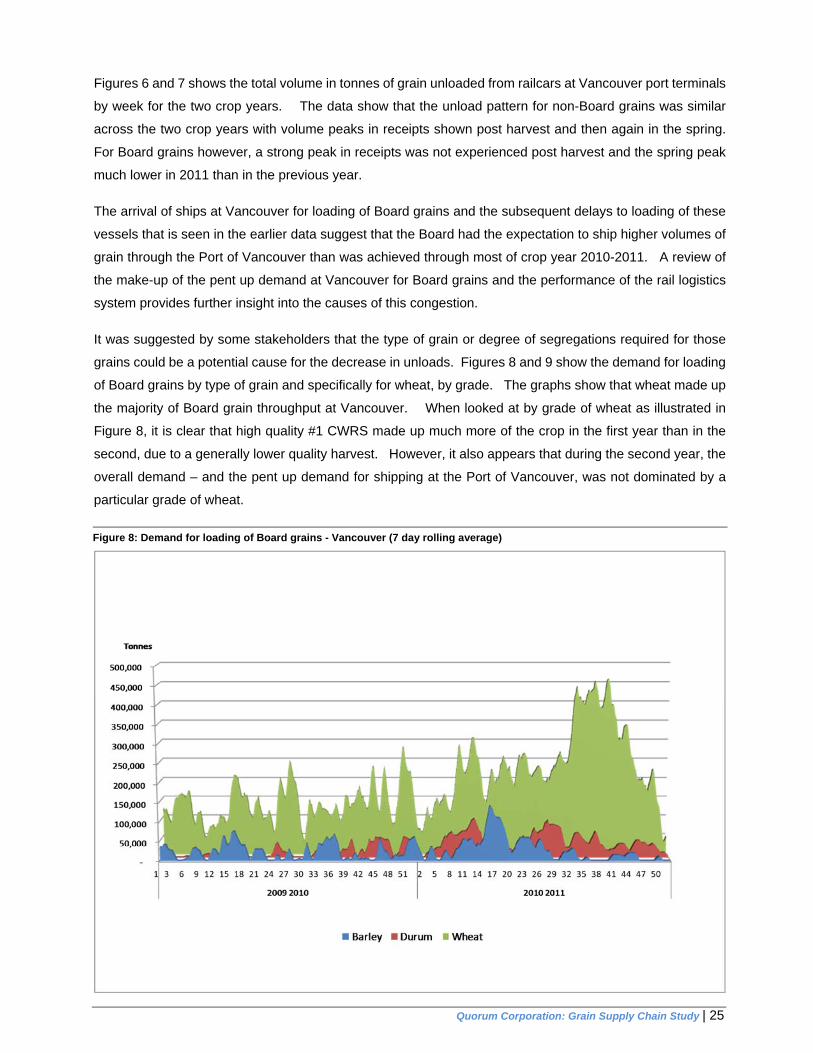
It was suggested by some stakeholders that the type of grain or degree of segregations required for those
grains could be a potential cause for the decrease in unloads. Figures 8 and 9 show the demand for loading
of Board grains by type of grain and specifically for wheat, by grade. The graphs show that wheat made up
the majority of Board grain throughput at Vancouver. When looked at by grade of wheat as illustrated in
Figure 8, it is clear that high quality #1 CWRS made up much more of the crop in the first year than in the
second, due to a generally lower quality harvest. However, it also appears that during the second year, the
overall demand – and the pent up demand for shipping at the Port of Vancouver, was not dominated by a
particular grade of wheat.
Figure 8: Demand for loading of Board grains - Vancouver (7 day rolling average)

26 | Quorum Corporation: The Performance of Canada’s Grain Supply Chain: A Quantitative Analysis
In addition, in order to determine if a wheat of a particular specific grade and protein content was in short
supply at Vancouver – contributing to the backlog – a vessel by vessel review was conducted for all Board
grain shipments from the port of Vancouver in November and February of 2010, 2011 respectively. For this
review, each vessel was examined to see if the required grain for the vessel was available in inventory in
port grain terminals or in the rail pipeline en route from primary elevators on the Prairies. The results of this
review showed that while there was an overall shortage of most types of wheat – there was no pattern to the
shortage of grains by grade or protein level during the period of congestion.
Another possible reason for the backlog at Vancouver may have been that the wrong types of grain were
being held in store due to pre-positioning of grain at the port by the Board, and that this resulted in reduced
elevator flexibility and throughput due to overly high levels of capacity utilization.
Figure 10 shows the average levels of working capacity utilization of Vancouver terminal elevators during the
study period.14 The elevators are broken into two groups, one group of elevators was focused primarily on
the movement of non-Board grains during this period and the other elevators handled a mix of Board grains
and non-Board grains. The graphs show that average levels of capacity utilization are higher at the group
14 “working capacity” refers to the proportion of the total licensed storage capacity of the elevator that can be used up before practical additional throughput is not feasible. This usually represents approximately 70% of an elevator’s licensed capacity and is specific to the configuration and operations of an elevator. For example, if an elevator’s working capacity is 70% of licensed capacity and it is at 80% of that working capacity – it is 0.7 x 0.8 = 56% full.
Figure 9: Demand for loading Wheat Grades - Vancouver (7 day rolling avg.)

Quorum Corporation: Grain Supply Chain Study | 27
that handled both Board and non-Board grains. This is to be expected due to the need to hold additional
segregations of wheat, barley and durum to be available for blending to meet customer specific sales
requirements as opposed to non-Board grains which require many fewer segregations and less blending to
meet requirements, as described earlier in this report.
However, while average working capacity utilization was higher at the elevators handling non-Board grains,
we do not see a significantly higher average utilization of these elevators in 2010-11 as compared to the
previous year suggesting that while congestion may have occurred from time to time at the elevators – with
spikes in working capacity utilization, there was generally available capacity to support throughput if the grain
required for loading was delivered by rail to the elevators.
20.0%
30.0%
40.0%
50.0%
60.0%
70.0%
80.0%
90.0%
2009 2010 2010 2011
Board/Non Board Group Non Board Group
Figure 10: Working capacity utilization - Vancouver terminals (weighted average by elevator capacity - 7 day rolling average)

28 | Quorum Corporation: The Performance of Canada’s Grain Supply Chain: A Quantitative Analysis
Railwayoperations
Figures 11 through 13 show the volume of grain shipments to Vancouver, changes in average railway transit
time over the study period and the volume of grain moving through each major component of the rail logistics
pipeline from country elevator to port. It can be seen that total shipments of grain from the Prairies to the
port declined steadily through November and December of 2010, during the period when demand for vessel
shipments was increasing at the port of Vancouver. This corresponds with the data presented earlier which
showed the level of unloads, particularly for Board grains, declining through this period.
Figure 12, shows that overall transit time increased
over the two year period and was particularly
volatile during the winter of 2010-11.
Figure 11: Bulk rail car shipments to Vancouver (weekly)
50
100
150
200
250
1 6 11 16 21 26 31 36 41 46 51 4 9 14 19 24 29 34 39 44 49
2009 2010 2010 2011
Average railway transit time Trendline
Figure 12: Average railway transit time (hours) from releaseorigin to placement at Vancouver port terminals (weeklyaverage)
0
500
1000
1500
2000
2500
3000
3500
4000
4500
1 3 5 7 9 111315171921232527293133353739414345474951 1 3 5 7 9 111315171921232527293133353739414345474951
2009 2010 2010 2011
Railcars
Railway 1 Railway 2 Total cars ‐ 4 week rolling average

Quorum Corporation: Grain Supply Chain Study | 29
Figure 13 shows the volume of grain in the Vancouver pipeline showing the relative volumes in the country,
mountain, destination rail terminals and on site in rail cars at the grain elevators. This graph shows that
while grain was presented at a fairly steady rate to grain elevators in Vancouver, there was significant
variability in the movement of the grain through the railway pipeline, with large swings in the volume of grain
moving through the system to the coast.
In discussions with stakeholders including railways and grain companies, both groups commented on the
challenges encountered by the railways in meeting demand for empty car supply and in movement of loaded
traffic during the winter of 2010-11. CP Railway representatives pointed out that they were required to halt
operations through the mountains for avalanche mitigation 25 times during Q1 of 2011, which according to
CP was far in excess of normal winter operations.15 It is important to point out that problems with rail customer
service were not experienced symmetrically across the railways. In general, shippers pointed out that the
problems were more severe on CP than on CN. One major shipper provided Quorum with copies of railway
grain service reports for their traffic over the two year period. This data showed that CN though challenged
during 2010-11 to meet shipper demands, was able to provide approximately 70% - 80% of the cars that
were allocated to the shipper on their grain service plans – in the week for which they were allocated. This
15 According to Environment Canada data, snowfall at Revelstoke, the location of major CP rail facility in the mountain corridor in BC, snowfall in 2011 was 85% higher than it had been on average in the previous two years – supporting CP’s claim that delays due to uncontrollable weather events were more significant than normal in 2011.
Figure 13: Grain in Vancouver railway pipeline (cars released loaded enroute to Vancouver weekly by pipeline region)

30 | Quorum Corporation: The Performance of Canada’s Grain Supply Chain: A Quantitative Analysis
performance was achieved during the most difficult winter months, and their performance in the fall and
spring periods was between 80% and 100%. CP however, struggled to deliver over 40% of the cars that
they had allocated on their own grain service plans to this customer during the winter months. Numerous
customers indicated that they were in constant contact with CP during this period and the message being
given by CP to its customers at this time was that they expected to recover from the accumulated shortfall,
and that resources were being put in place to return service to more normal levels.
PrinceRupert
Another factor that contributed to the ship loading
delays at Vancouver was a drop off of shipments to
Prince Rupert, BC; which diverted some traffic to
Vancouver. This was seen as creating extra
demand at Vancouver and contributing to the
backlog of vessels at that port.
Figure 14 shows the volume of grain unloaded from
rail cars at Prince Rupert, BC for the two crop years.
There is a notable drop in the volume of Board
grains delivered to the port in the first 12 weeks of
crop year 2010-11. According to system
stakeholders, this diversion of grain away from the
port was due to a dispute between the Board and
Prince Rupert Grain over the terms of their
operating agreement at the port. The volume of
Board grains that appear to have been diverted from
the port is approximately equal to the surplus demand experienced at Vancouver (approximately 250,000
tonnes).
However, it is too simplistic to say that the apparent diversion of Board grains from Prince Rupert to
Vancouver was the cause of the backlog of vessels at Vancouver that was not resolved until the spring of
the following calendar year.
If the rail system had been able to keep up the average level of volume in the second half of 2010-11 that it
was able to deliver in 2009-10, the backlog of vessel loading at Vancouver would have been much less
severe, if significant at all.16 So, while the diversion of Board grains from Prince Rupert contributed to the
creation of excess loading demand at Vancouver, it was the failure of the system to respond to this increased
16 In 2010 11, the average weekly delivery of grain via rail to Vancouver in the last 30 weeks of the crop year was 289,000 tonnes or approximately 3140 railcars. In 2011 12, the average was only 265,000 tonnes or 2880 rail cars. If the 2009 10 level had been maintained in the last half of 2010 11, sufficient grain would have been delivered to reduce the approximately 250,000 tonne backlog in 10.5 weeks.
‐
20,000
40,000
60,000
80,000
100,000
120,000
1 6 11 16 21 26 31 36 41 46 51 4 9 14 19 24 29 34 39 44
2009 2010 2010 2011
Tonnes
Board Non Board
Figure 14: Volume of rail car unloads at Prince Rupert (weekly 4 period average)

Quorum Corporation: Grain Supply Chain Study | 31
demand that ultimately caused the more significant congestion at the port that occurred in the second half of
the crop year.
AnalysisofOceanVesselTransit
While the principal focus of this analysis has been on the performance of the logistics chain up to the port
position, the Canadian grain supply chain extends to end users located in destination markets around the
world. As such, an analysis was undertaken to examine the transit times of ocean vessels carrying grain that
departed from Vancouver during the analysis period. The objective was to examine the performance of
ocean service and how it related to the overall performance of the Canadian grain supply chain. Specifically
we looked for consistency in transit time and the impact that seasonality may have on the reliability of ocean
transit.
Transport Canada’s Economics and Analysis group provided Quorum with loaded vessel ocean transit times
for 585 of 880 vessels that departed Vancouver with grain during the study period. These vessels included
movements to 119 ports in 34 countries. This sample was deemed representative as it included 66% of grain
vessel departures from Vancouver and 70% of grain volume shipped from Vancouver. The remaining 295
vessels were excluded from the analysis as transit data was either unavailable or had transit times that were
deemed to be excessively long or short so as to bring their validity into question. It is Quorum’s opinion that
the 585 trip sample is suitably representative of total ocean transit activity for the purpose of this analysis.
The analysis calculates ocean transit performance between the port of Vancouver and each trip’s destination
port and summarizes this data to a country level. Our analysis has looked at the average transit time in each
ocean corridor and measured the reliability or variation of transit using a calculation of coefficient of variation
(CV). For the sample as a whole the analysis revealed that total average transit was 21.2 days with a
weighted coefficient of variation of 0.23. This of course reflects a disparate average as the length of trip in
the data set can vary from 4 to 59 days.
Table 5 shows the top nine countries receiving Canadian grain shipped from Vancouver through the study
period ranked in descending order based on actual tonnage moved. The remaining countries in the sample
are grouped into the category called “other”. The top 9 destination countries represent 69% of trips in the
sample and 55% of total movements. In terms of a comparison to the actual tonnage moved, the sample
sets of transit times in those same top ten countries generally fell within a range of 1-2% with the exception
of China, Ecuador and India which were marginally under represented. Despite this, it is our belief that the
sample set provides a reasonable representation of the movement to these countries.
32 | Quorum Corporation: The Performance of Canada’s Grain Supply Chain: A Quantitative Analysis
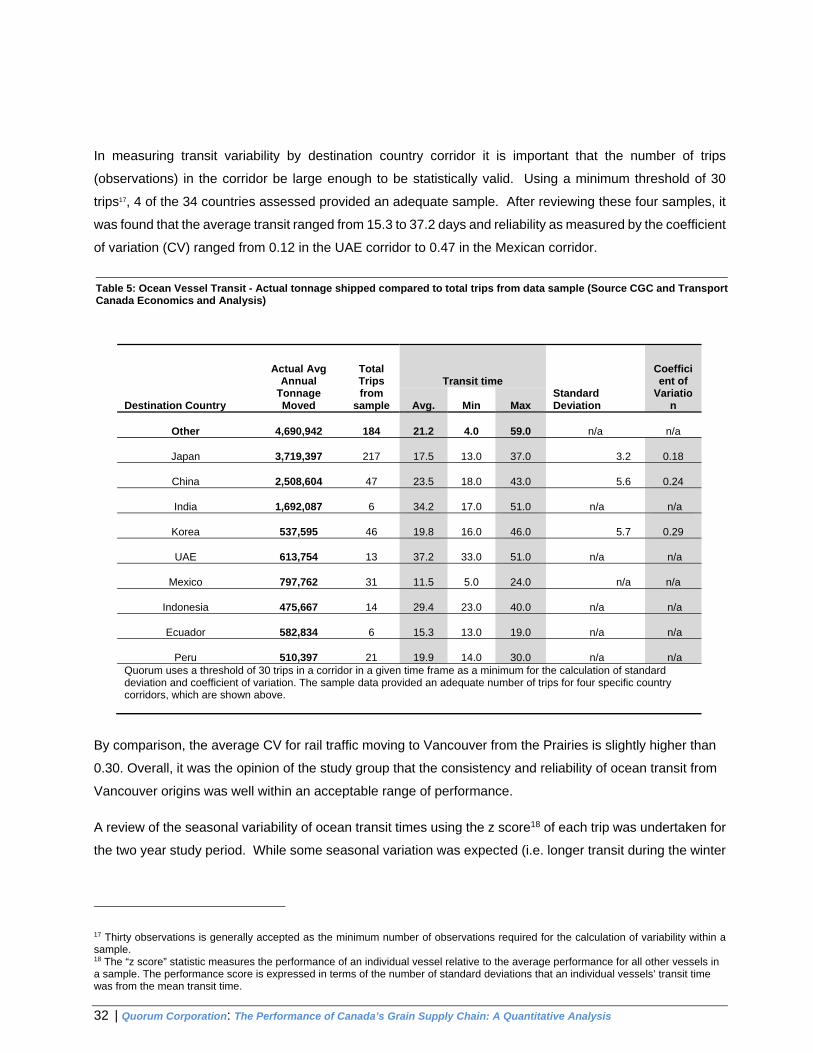
In measuring transit variability by destination country corridor it is important that the number of trips
(observations) in the corridor be large enough to be statistically valid. Using a minimum threshold of 30
trips17, 4 of the 34 countries assessed provided an adequate sample. After reviewing these four samples, it
was found that the average transit ranged from 15.3 to 37.2 days and reliability as measured by the coefficient
of variation (CV) ranged from 0.12 in the UAE corridor to 0.47 in the Mexican corridor.
By comparison, the average CV for rail traffic moving to Vancouver from the Prairies is slightly higher than
0.30. Overall, it was the opinion of the study group that the consistency and reliability of ocean transit from
Vancouver origins was well within an acceptable range of performance.
A review of the seasonal variability of ocean transit times using the z score18 of each trip was undertaken for
the two year study period. While some seasonal variation was expected (i.e. longer transit during the winter
17 Thirty observations is generally accepted as the minimum number of observations required for the calculation of variability within a sample. 18 The “z score” statistic measures the performance of an individual vessel relative to the average performance for all other vessels in a sample. The performance score is expressed in terms of the number of standard deviations that an individual vessels’ transit time was from the mean transit time.
Table 5: Ocean Vessel Transit - Actual tonnage shipped compared to total trips from data sample (Source CGC and Transport Canada Economics and Analysis)
Actual Avg
Annual Tonnage Moved
Total Trips from
sample
Transit time Standard Deviation
Coefficient of
Variation Destination Country Avg. Min Max
Other
4,690,942 184
21.2
4.0
59.0 n/a n/a
Japan
3,719,397 217
17.5
13.0
37.0 3.2
0.18
China
2,508,604 47
23.5
18.0
43.0 5.6
0.24
India
1,692,087 6
34.2
17.0
51.0 n/a n/a
Korea
537,595 46
19.8
16.0
46.0 5.7
0.29
UAE
613,754 13
37.2
33.0
51.0 n/a n/a
Mexico
797,762 31
11.5
5.0
24.0 n/a n/a
Indonesia
475,667 14
29.4
23.0
40.0 n/a n/a
Ecuador
582,834 6
15.3
13.0
19.0 n/a n/a
Peru
510,397 21
19.9
14.0
30.0 n/a n/a Quorum uses a threshold of 30 trips in a corridor in a given time frame as a minimum for the calculation of standard deviation and coefficient of variation. The sample data provided an adequate number of trips for four specific country corridors, which are shown above.

Quorum Corporation: Grain Supply Chain Study | 33
months) the analysis showed few major fluctuations from the mean, and therefore very little seasonal
variability in the transit times of vessels. The results are shown in Figure 15.
Considerations
The analysis provides insight into the loaded transit time performance of ocean vessels that transported grain
from Vancouver to various destination countries during the study period. Based on the transit variability
analysis conducted on the four largest corridors we conclude that average transit was consistent and reliable
in these major corridors. Each of these corridors experienced lower variability, as measured by coefficient
of variation, than did rail traffic in the Vancouver corridor during the 2010-11 grain year. This finding
corresponds with the insight provided by shippers in both the workshops as well as follow-up discussion
where they had indicated that buyers of Canadian grain are generally satisfied with the loaded ocean vessel
transit times on grain movements from Canada.
Shippers have expressed concerns with the performance of empty vessels and the occasional diversion from
planned arrival times that some vessel charters incur. The data for the arrival of empty ocean vessels at the
loading port is much more difficult to acquire and the actual causes of delay or diversion from the original
vessel charter plan can be challenging to confirm. Based on input from stakeholders causes for performance
variability on these movements can range from mechanical problems with the vessel to the buyer switching
vessel charters either through an attempt to arbitrage freight rates or because they redirected a vessel to a
higher priority movement. As this analysis does not examine the consistency and reliability of empty inbound
movements, the actual impact of those diversions cannot be quantified or validated, however, anecdotal
Figure 15: Seasonal variation in transit (z scores of all transit)
-6
-4
-2
0
2
4
6

34 | Quorum Corporation: The Performance of Canada’s Grain Supply Chain: A Quantitative Analysis
evidence as provided by some of the port terminal operators indicates that the lack of consistency in empty
vessel arrivals can challenge the planning cycles of terminals. This can result in extended storage times of
some grain as it waits the proper vessel to arrive at port. The impact on the supply chain can include delays
in railcar unloading (as terminal storage space becomes limited, thereby impacting the loading of other
vessels in port as product is held back), putting vessel loading out of planned order and ultimately causing
product to back up into the country.
While buyers do not complain about the variability of loaded ocean transit time, they do comment frequently
on the challenges of coordinating grain products to Canadian port position to meet vessel loading
requirements. This likely is related to type of vessel charter used – whether the buyer is controlling and
paying for ocean freight. As more buyers look to control the ocean freight they become more sensitive to
events that cause vessel demurrage. Most often the late arrival of grain/rail cars is seen as the cause of
these delays and as such Canada's reputation as a reliable supplier can be damaged.
Summary
The quantitative analysis focused on issues associated with the movement of bulk grains through the port of
Vancouver as stakeholders identified this corridor as their major concern. A review of vessel loading through
the port identified the period between October of 2010 and spring of 2011 as a time of major congestion at
the port with vessel delays at the port climbing significantly during this period. The factors that contributed
to this delay in vessel loading at Vancouver were:
A diversion of approximately 250,000 tonnes of Board grain traffic from Prince Rupert to Vancouver in the early weeks of the grain year.
Somewhat higher than normal delays in loading vessels due to more frequent heavy rainfall events in Vancouver, particularly between January and March of 2011.
Severe weather events in the railway mountain corridors of British Columbia, particularly on CP.
Poor communication from the railways, particularly CP, on their expected ability to recover from their operating challenges.
The quantitative analysis confirmed many of the important themes raised by stakeholders during
consultations. Grain traffic is seasonal, with a large peak that follows directly after the harvest period. Grain
companies will have a portion of their sales contracted as much as 90 days in advance, requiring them to
make predictions about the future supply of grain, the capacity of the country elevator network, the rail
network and the port terminal network to handle future sales. During periods of disruption, reductions in
capacity can happen more quickly than the ability of the system to react. In order to address this weakness,
a stronger focus will be required on mechanisms to identify as quickly as possible when the grain logistics
system is moving towards a period of congestion, to allow all partners to implement mitigation strategies.


