Page 1
The Performance of Daylighting with Shading Device
in Architecture Design
Chia-Peng Chou
Department of Architecture
Tamkang University
Tamsui, Taiwan 251, R.O.C.
E-mail: [email protected]
ABSTRACT
This paper presents the relationship between daylighting performance
and shading device design in the perimeter area of buildings. In the area of
tropic and sub-tropic, designers always face with the contradiction between
solar heat gain and daylighting using. Factors such as different type of
shading device, material reflectance, fenestration design, opening ratio, and
daylight distribution will be considered in this study. Models study will base
on horizontal, vertical, and eggrate types of shading device and tested under
an artificial sky in the hemisphere daylight skydome. This paper discusses
and analyzes certain aspects critical to develop regression models to predict
the daylight distribution of a room with different shading device design.
Key Words: Daylighting, Shading Device, Energy Conservation, Solar Ra-
diation
1. Introduction
1.1. Energy Context
Fenestration is a significant factor affecting architec-
ture, whether from the viewpoint of aesthetics, function,
or economy. Most building designers are well trained in
aesthetics and building function in architectural design.
International events and the resultant energy crisis in the
70’s and 90’s forced a reexamination of energy use pat-
terns in building design. Conseque ntly, the concerns of
energy consciousness also apply to the design profes-
sion. The building design professions need to examine
their current curriculums and available resources to de-
termine the extent of the need for adaptation of energy-
related training for assisting in their decision making on
energy related design.
Buildings accounts for 16 percent of the total energy
consumption in Taiwan, or 8.16 million Kiloliters of oil
equivalent [1].Taiwan is not endowed with indigenous
energy in total energy supply, the ratio of imported en-
ergy to the total energy supply in Taiwan is 93 percent.
Base on the statistical information of Taiwan Power
Company [2], lighting accounts for 30.3% consumption
in total electricity sales. Which means lighting take about
22.5 billion KWH per year. Besides lighting, air-condi-
tioning also take about 40% electricity in the season of
summer. Therefore, effective use of fenestration design
is considered one of most promising energy conservation
strategies in building design.
1.2. Perimeter Concern
The climate of a given region, such as Taiwan, which
critically affects the energy related performance of build-
ings. Taiwan is located in the hot-humid zone. Humidity
is fairly high constant during most of the year. Relative
humidity above 80% for most of the time, but may vary
from 75 to 90%. Cooling degree hours base 22 degree
centigrade in this island is vary from 28,000 to 40,000
CDH. Most part of this area is greater than 32,000 CDH.
The climatic condition, mainly the humidity and cooling
Tamkang Journal of Science and Engineering, Vol. 7, No 4, pp. 205�212 (2004) 205
Page 2
degree hours, give an index for outlining hot periods that
need air-conditioning. The energy consumed for air-
conditioning is mainly for the perimeter area of build-
ings. Therefore, shading devices are needed to prevent
solar radiation penetrate through the openings directly
and to save energy consumption in air-conditioning.
Building designers should pay attention to available
daylighting use in perimeter area for compensating light-
ing and its electricity saving. Designers always face with
the contradiction between solar heat gain and perimeter
daylighting. This paper will analyze the solar heat pre-
vent by shading device and their effect to the daylighting
performance in the perimeter area. The perimeter zone,
which may defined vary from 3.5 to 6.0 meters away
from window wall. Daylighting study shows that five-
meter zone is significant area for daylighting use [3].This
studies will base on the five-meter zone to represent the
perimeter area of buildings. Factors such as different
type of shading device, material reflectance, fenestration
type, opening ratio, and daylighting distribution will be
considered in this study.
1.3. Daylighting and Shading Devices
Daylight, like other natural resources, is free. Many
reasons have been offered for admitting daylight into
buildings such as energy conservation, the promotion of
health, the psychological response, and the belief that
daylight is inexhaustible. Many researchers have con-
tributed results to the definition and measurement or pre-
diction of both quantity and quality of the daylighting
conditions in architecture. Existing methods for predic-
tion of daylight can be analytic or computational or
graphic; they can be in the form of graphic tables and
computer programs or protractors and physical models.
Fifty-eight recognized daylight design methods are listed
in the CIE publication [4]. Most were originated in Euro-
pean countries where cloudy skies are the typical mini-
mum brightness condition, and few are well suited to
tropical area where clear skies prevail and strong direct
sunlight is involved. This means that daylight design is
impractical for tropical area with no shading devices
concern to resist the penetration of direct solar radiation.
In other words, the influence of shading devices in
daylighting performance of buildings’ perimeter area is
very important for fenestration design.
Design is not a one-way, linear problem defining, de-
cision-making, and solution-finding process. Building
designers move back and forth between defining prob-
lems, making decisions, finding solutions, and some
other elements of this iterative design process until an ac-
ceptable configuration has been reached. It is also proba-
ble that the criteria and conditions of design problems
change constantly and cannot be well defined. The de-
sign process requires an analytical tool has the ability to
interact with the designers at different levels of specific-
ity. Therefore, there is a need for a mathematical model
with a microcomputer appropriate for the process of de-
signing. The mathematical model, developed in theoreti-
cal from the viewpoint of the physics of light and pro-
cessed with mathematical relations, should provide the
reliability, accuracy, and generalization in daylight anal-
ysis that will sufficiently assist designers in their dy-
namic design process.
2. Methods
2.1. Physical Scale Models Studies
Of all methods used for studying daylight perfor-
mance, The use of physical models studies is probably
the most reliable evaluation tool. The most difficult
problem in studying daylight with the use of models is
simulating the sky. This study is made with the model un-
der an artificial sky. The studies of scale models, include
model building, measuring positions, and data collecting
under the hemispherical artificial sky in the Daylight
Simulator Laboratory at Tamkang University. Figure 1
shows the vault, which is a grid hemisphere, 7 meters in
diameter. Several instrument have been employed for
scale model experiments. These include 16 Minolta NT�1
luminance meter, a gloss-meter and reflectance meter,
and two TEAC DR�F1 digital recorders. Figures 2 and 3
illustrated the section diagram of the simulator and the
experimental condition under the simulator.
In theory, the scale of model intended for photomet-
ric measurements is of no significance. In practice, scale
is limited by the size of the photocell that is to be used for
measurements. This determines the scale of the physical
model. A designed model was built for stability of exper-
iments in the scale of 1 to 20. This model is designed by
the moveable right wall, back wall and expanded ceiling
area. It will ensures the dimension of testing room
changeable via those moving parts of model. This model
has the advantage of fixing experimental variables such
as reflectance of interior wall, stabilizing the photocell
206 Chia-Peng Chou
Page 3
position and model building. The only testing part of
scale model is the window wall with the changing of
shading device and its material reflectance, fenestration
design, opening ratio. Figure 4 illustrated the scale model
testing and the 15 points of photocell.
For the purpose of analysis for the influence of shad-
ing device in daylighting performance of buildings’ per-
imeter area. 278 scale models have been tested with the
variables changing in this study. Figures 5 and 6 shows
the concept of testing models. There are three prototypes
of shading device being divided for experiments. They
are horizontal, vertical, and eggrate shapes. The opening
ratio for scale model is ranging from 15% to 45%. Fenes-
tration design is tested via one, two, and three openings
with the base of same opening ratio and shading devices.
Material reflectance of shading device is divided into
seven levels of reflectance by painting the shading de-
vice from dark to white color. Testing variable are sys-
The Performance of Daylighting with Shading Device in Architecture Design 207
Figure 2. Section diagram of the simulator.
Figure 3. Experiment studies in the sky simulator.
Figure 4. Physical scale model under testing condition.
Figure 5. Horizontal shading device models testing.
Figure 6. All 3-type shading device models.
Figure 1. General view of the skydome at Tamkang University.
Page 4
tematic multi-combined to reform the testing condition.
The testing data acquisition procedure employs a computer
interface system to collect data simultaneously from the
16 photocells. Sixty observations were collected and re-
corded for each photocell in each case. Figure 7 presents
the original data plotting of physical scale model experi-
ment in one case. All the data were convert from illu-
minance to daylight factor for representing consistency.
The multivariate analysis test under the Statistical Anal-
ysis System (SAS) were executed. The regression mod-
els are well established for comparing and validating the
theoretical development.
2.2. Theoretical Development
The only and the original source of daylight is the
Sun. The relative contributions of direct daylight and of
diffuse daylight in interior lighting depend on, the latitude
and longitude of the place, and on the local climate with
respect to the distributed sky. These two natural factors
determine the building tradition in relation to windows
and fenestration design in architecture. Hence, the theoret-
ical development can be divided into three parts. One is
the relationship between the Sun’s rhythm and the geome-
try of a room. The theory and the mathematical formula in
this part is very popular. Most studies are well developed
to compute these relationships for any specific time and
day between Sun’s ray and window. There is no need to
repeat explanation herein. The second is the relationship
between diffuse daylight and distribution of interior illu-
minance. The third is the relationship between the pene-
tration of direct sunlight and the performance of shading
device. These three sections of the theoretical develop-
ment then be combined for calculating the total quantity of
daylight distribution and performance in a room. It is the
purpose of this study to deal with.
The window is the only opening to let daylight come
in and to light the interior space. It is the bas assumption
that no window means no daylight available in the room.
The major concern is the diffuse daylight coming from
the sky vault and the exterior ground; other factors, Ba-
sically, the diffuse daylight received via the window at
any measuring points can be divided into two parts: light
directly from sky vault, and light indirectly and reflec-
tively from the exterior ground. Both kinds of diffuse
daylight coming from exterior to interior can be termed
the first order of diffuse daylight. This first order of dif-
fuse daylight must transit through the window to the inte-
rior reference points or surfaces. Once the surfaces re-
ceive the diffuse daylight from the exterior, a certain
amount of diffuse light will be reflected to the other sur-
faces or reference points which depend on the reflectance
of the surfaces. Therefore, this illuminance passing
through the window is the key point for discussing the
distribution of diffuse daylight in a room. In other words,
the window is the only source of diffuse daylight for inte-
rior space as the sky vault is the only source of diffuse
daylight for the earth. Hence, the intensity of illuminance
for an interior point depends on solid angle [5], the
source of diffuse daylight outside the window, and how
the diffuse daylight is transferred among surfaces and be-
tween surfaces and reference points inside a room. The
solid angle can be defined as the area intercepted on the
surface of a unit sphere by a conical angle originating at
the sphere center.
3. Results and Discussion
278 physical scale models have been tested under the
sky simulator for understanding the influence of shading
device in daylighting performance of perimeter area.
There are five variables were been concerned, they are
shading device type, depth of the shading device,
reflectance of material, opening ratio, and fenestration
design. Shading device types include horizontal (86
cases), vertical (94 cases), and eggrate (98 cases) shape.
The depth of shading device is tested under 0, 15, 30, 45,
60, 75, and 90 centimeter conditions. The reflectance of
208 Chia-Peng Chou
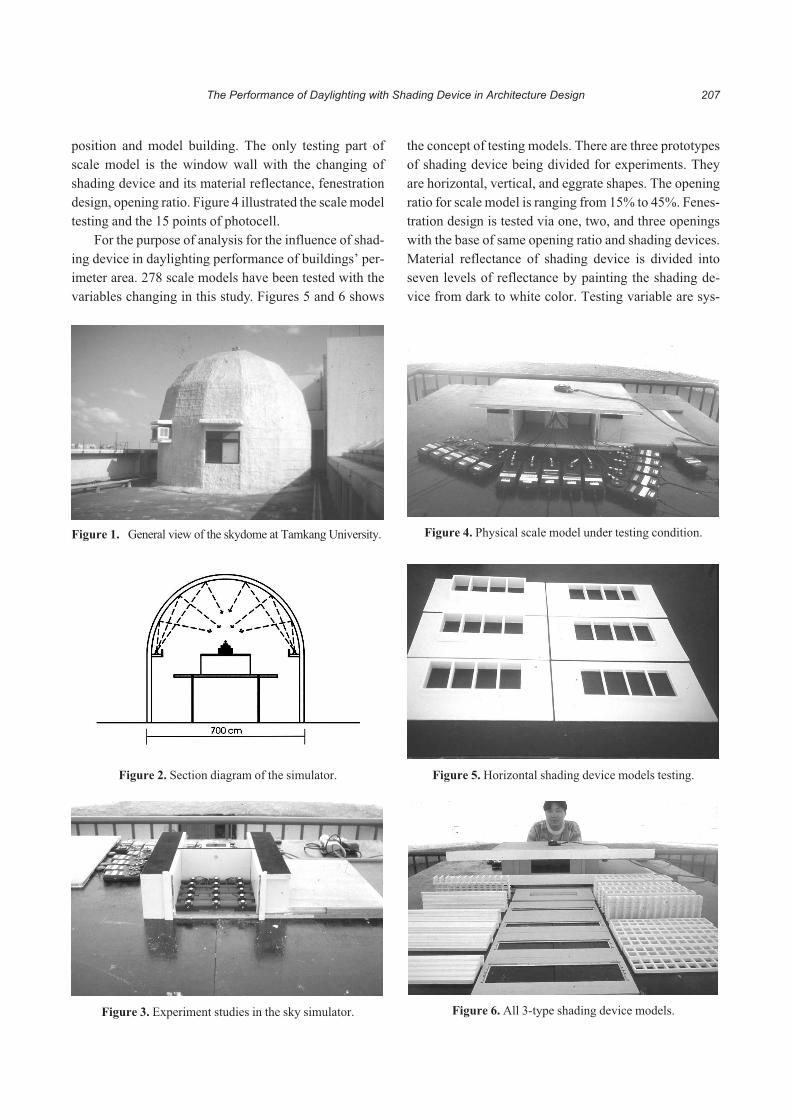
Figure 7. Original data plotting of physical scale model ex-periments.
Page 5
shading material is tested with six levels. Opening ratio
are tested from 15% to 40%. Fenestration design test are
divide the opening into 1, 2, 3,and 4 windows with the
same opening ratio. Figure 8 shows the points inside the
3 meters perimeter area are higher than 3.0% daylight
factor mostly. It appears that 3 meters perimeter zone can
use the daylight normally. Points between 3 to 5 meters
perimeter zone should use the artificial lighting for sup-
plement.
3.1. Opening Ratio
Opening ratio stand for the area of opening to the
area of the window wall. The larger opening will get the
higher daylight factor is understandable. But larger open-
ing ratio do not ensures the better daylight penetration.
Figure 8 illustrates the daylighting distribution from the
ratio of 15% to 40% with the step of 5% increased. The
opening ratio of fenestration does affect the daylight dis-
tribution in the perimeter area. The points close to the
window wall influenced by the opening ratio fewer than
the points away from window wall. Both the daylight
factor and opening ratio will increase together, but not
proportionally. Especially, the points located at 4 and
5-meter-depth. This means that the opening ratio in-
creased will not make the daylight penetration deeper.
3.2. Shading Device Type
Solar control devices may affect the daylight distri-
bution positively or negatively. This section intends to
use the experiment data to compare different type of
shading device in the aspect of daylighting. The effect of
horizontal devices on daylighting has been well docu-
mented. Usually, A horizontal device in effect reduces
the amount of daylight in a room by acting as a larger
room and changing the light levels by interpolation. This
predicting method can give designers a very rough idea
of the influence of daylighting. The better method still is
using the physical scale models to examine and compare
the difference of effect.
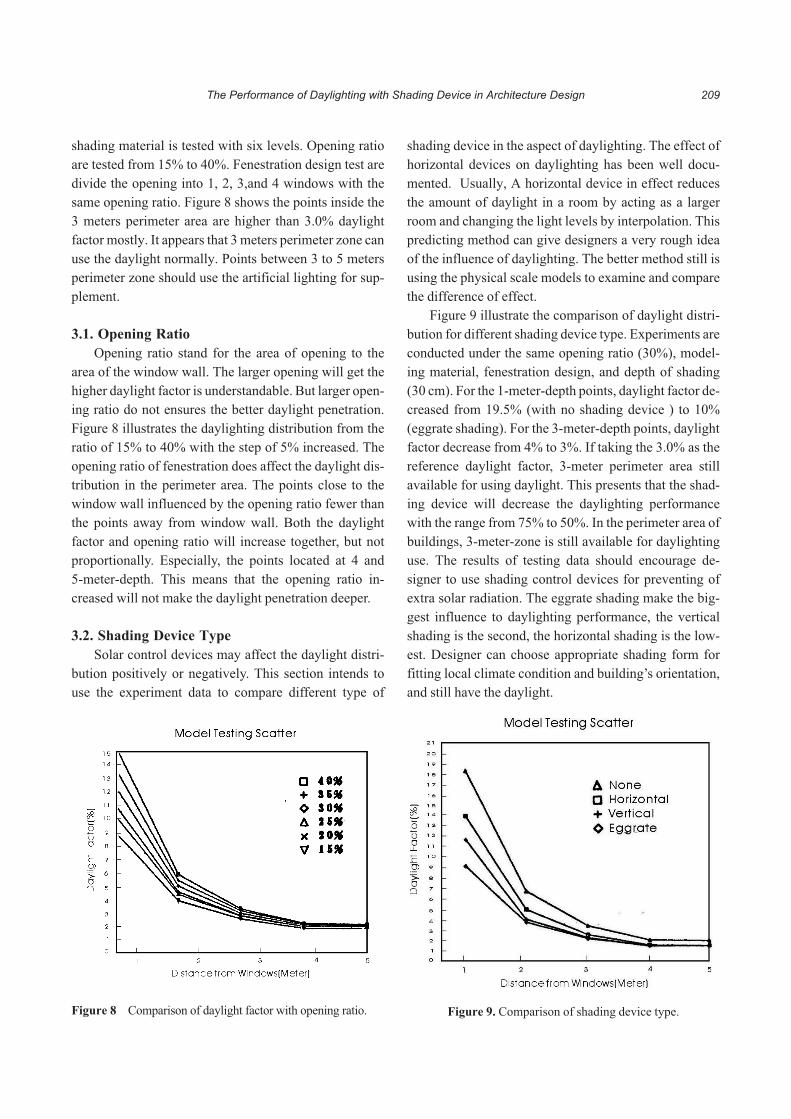
Figure 9 illustrate the comparison of daylight distri-
bution for different shading device type. Experiments are
conducted under the same opening ratio (30%), model-
ing material, fenestration design, and depth of shading
(30 cm). For the 1-meter-depth points, daylight factor de-
creased from 19.5% (with no shading device ) to 10%
(eggrate shading). For the 3-meter-depth points, daylight
factor decrease from 4% to 3%. If taking the 3.0% as the
reference daylight factor, 3-meter perimeter area still
available for using daylight. This presents that the shad-
ing device will decrease the daylighting performance
with the range from 75% to 50%. In the perimeter area of
buildings, 3-meter-zone is still available for daylighting
use. The results of testing data should encourage de-
signer to use shading control devices for preventing of
extra solar radiation. The eggrate shading make the big-
gest influence to daylighting performance, the vertical
shading is the second, the horizontal shading is the low-
est. Designer can choose appropriate shading form for
fitting local climate condition and building’s orientation,
and still have the daylight.
The Performance of Daylighting with Shading Device in Architecture Design 209
Figure 8 Comparison of daylight factor with opening ratio. Figure 9. Comparison of shading device type.
Page 6
3.3. Depth of Shading Devices
Besides the influence of shading device type to
daylighting performance, testing data of the different
depth of shadings in different types also prove that the in-
fluence does exist. The different depth of shading was
represent with the shading ratio in Figure 10 (Shading
Ratio = D/H). All the physical models were designed
with the height of window is 150 cm. Thus, the depth of
shading devices which under tested is ranging from 15
cm to 90 cm. With the concept of shading ratio, the shad-
ing ratio under tested is ranging form 0.1 to 0.6 with the
step of 0.1.
The same phenomenon in influence level, like the
shading types, has been observed. Figure 11 shows the
deeper of the shadings, the lower of daylight factor inside
the room. This decrease phenomenon with the depth of
shadings is especially obvious in eggrate shading form.
Experimental results suggest that the depth of shading
devices have the influence to the distribution of daylight.
In the horizontal (Figure 12) and vertical (Figure 13)
shading form, the influence level is not very serious. But
in the eggrate shading form, the influence level changed
very rapid with depth increased. For the purpose of us-
ing daylight, designer design the eggrate shading device
210 Chia�Peng Chou
Figure 10. The concept of shading ratio.
Figure 11. Comparison of depth in eggrate form shading de-vice.
Figure 12. Comparison of depth in horizontal form shadingdevice.
Figure 13. Comparison of depth in vertical form shading de-vice.
Page 7
should avoid the depth of shading more than 45 centi-
meter.
3.4. Fenestration Design
Fenestration design might be changed with the pref-
erence of the designer. Since design is a very hard control
variable, the scale model study only test the number of
window under the same opening ratio. Figure14 shows
the result of testing data plotting. It is clear that the num-
ber of window will influence the daylight distribution.
Especially in the 4 and 5-meter-perimeter, the number of
window increased will make the higher daylight factor.
This result will give better daylighting design for its dis-
tribution.
3.5 Multivariable Analysis and Validation
The statistical multivariable model has been estab-
lished for predicting daylight distribution. The scale
model study was selected because it represents the sim-
plest, most acceptable, and most reliable technique for
simulating daylight distribution, as mentioned earlier.
This statistical model will also employed for validating
the theorical model in the future. The major concern in
validation of the multivariable model was how accu-
rately the daylighting distribution might be predicted as
compared to the scale model studies. Statistics analysis
includes four major variables. These variables are open-
ing ratio(OR,%), depth of predicting point(DP, meter),
depth of shading devices(SR, shading ratio), and num-
ber of windows(NW, number). The shading ratio is the
depth of shading device divided by the height of win-
dow. The multi-variable regression models were estab-
lished under the Statistical Analysis System (SAS)
computer program. Table 1 shows the regression model.
Table 2 illustrates the correlation coefficients of these
models.
Most designer predicts daylight distribution using
methods such as the Lumen method, the Daylight Factor
method, and charts and tables in IES handbook. Others
use scale model studies under a daylight simulator and
real sky. Still others use sophisticated computer pro-
grams based on correlation coefficient functions gener-
ated mainly via scale model studies. The multi-variable
regression model proposed in this study is intended to
provide a more convenient design methods for designers
and to encourage them to consider daylight in their de-
signs. Figures 15 and 16 are examples to show the com-
parison of the physical scale models experimental study
and the regression models from SAS program. Both the
Figures 15 and 16 were under the conditions of the eggrate
shading device with the 30% opening ratio and two-win-
dow opening. The comparisons were made the shading
The Performance of Daylighting with Shading Device in Architecture Design 211
Figure 14. Comparison of fenestration design in windows.
Table 1. The multivariable regression models of different shading types
Shading Devices Type DF (daylight factor/%); DP (depth of predicting point/m); NW (number of windows); OR (opening ratio/%);
SR (shading ratio/%)
No Shading DF = 3.06 * 10-3 + 2.38 * 10 -3DP + 1.44 * 10 -3OR
Horizontal DF = 3.51 * 10 -3 + 1.8667 * 10 -3 DP + 1.1683 * 10 -3OR – 0.0119 SR
Vertical DF = 6.7913 * 10 -3 + 2.6438 * 10 -3 DP + 8.7036 * 10 -3NW + 1.1173 * 10-3OR – 8.5548 * 10 -3SR
Eggrate DF = 0.0126 + 1.925 * 10 -3 DP – 1.1438 * 10 -3NW + 1.0211 * 10-3OR – 7.2902* 10 -3SR
Table 2. Correlation coefficients of multivariate analysis for
shading devices
Shading Opening Ratio
Devices Type 20% 25% 30% 35% 40%
Horizontal 0.989 0.971 0.912 0.978 0.987
Vertical 0.947 0.925 0.958 0.943 0.968
Eggrate 0.968 0.964 0.969 0.972 0.978
Page 8
ration changing from 0.1 (15 cm) to 0.6 (90 cm). It is
clear that those curves of data are quite similar. This will
more encourage designers use daylight as one of the is-
sues in their design for energy conservation.
4. Conclusion
This paper presents the idea of physical scale models
studies under the Skydome for daylighting performance
measurements. Many affecting variable of fenestration
design had been tested, such as opening ratio, type of
shading device, and the number of opening. Those exper-
iments data validate within the statistics program and
show the results are very reliable for daylight predicting.
Architecture designers in their schematic design process
can use the results. The regression model is very helpful
for the purpose of daylight prediction.
References
1. Energy Commission, Ministry of Economic Affairs,
The Energy Situation in Taiwan, Republic of China,
ECMEA Feb., p. 8, (2002).
2. “TAIPOWER Annual Report 2001,” Taiwan Power
Company, p. 13, (2002).
3. Chou, Chia-Peng, “A Study of Daylighting Criterion
in Building Code,” Building Research Institute, Minis-
try of Interior Affairs, June, p. 86 (1992).
4. “International Recommendations for the Calculation
of Natural Daylight,” Commission International de l’
Eclairage, Publication No. 16 (E-3.2), (2000).
5. Grum, F. and Beecher, R. J., Optical Radiation Measure-
ments, Academic Press, NY, U.S.A., pp. 33�36 (1979).
6. Siegel, R. and Howell, J. R., Thermal Radiation Heat
Transfer, Hemisphere Publishing Corporation, McGraw
Hill Book Company, NY, U.S.A., p. 175 (1981).
7. Chou, Chia-Peng, “A Mathematical Model of Build-
ing Daylighting Based on First Principles of Astrometry,
Solid Geometry And Optical Radiation Transfer,”
VPI&SU, pp. 45�50 (1987).
Manuscript Received: Apr. 20, 2004
Revision Received: Jun. 29, 2004
Accepted: Aug. 17, 2004
212 Chia�Peng Chou
Figure 16. Data of regression model.
Figure 15. Data of experiment.


![Journal of Daylighting - Solarlitssolarlits.com/jd/pdf/5-1.pdf · buildings through reflecting or shading solar 11]. Indoor light ... the physical surfaces and masses may considerably](https://static.documents.pub/doc/80x56/5f02ed057e708231d406b164/journal-of-daylighting-buildings-through-reflecting-or-shading-solar-11-indoor.jpg)


