University of Rhode Island DigitalCommons@URI eses and Major Papers Marine Affairs 4-11-1974 e Perplexities of the U. S. Marine Transportation System Stewart B. Nelson University of Rhode Island Follow this and additional works at: hp://digitalcommons.uri.edu/ma_etds Part of the Oceanography and Atmospheric Sciences and Meteorology Commons is Major Paper is brought to you for free and open access by the Marine Affairs at DigitalCommons@URI. It has been accepted for inclusion in eses and Major Papers by an authorized administrator of DigitalCommons@URI. For more information, please contact [email protected]. Recommended Citation Nelson, Stewart B., "e Perplexities of the U. S. Marine Transportation System" (1974). eses and Major Papers. Paper 134.
Transcript
University of Rhode IslandDigitalCommons@URI
Theses and Major Papers Marine Affairs
4-11-1974
The Perplexities of the U. S. Marine TransportationSystemStewart B. NelsonUniversity of Rhode Island
Follow this and additional works at: http://digitalcommons.uri.edu/ma_etds
Part of the Oceanography and Atmospheric Sciences and Meteorology Commons
This Major Paper is brought to you for free and open access by the Marine Affairs at DigitalCommons@URI. It has been accepted for inclusion inTheses and Major Papers by an authorized administrator of DigitalCommons@URI. For more information, please [email protected].
Recommended CitationNelson, Stewart B., "The Perplexities of the U. S. Marine Transportation System" (1974). Theses and Major Papers. Paper 134.
THE PERPLEXITIES OF THE U. S. }lARINE TRA~~SPORTATION SYSTEH
Submitted in partial fulfillmentof the requirements of the
}furine Affairs Program
MASTER OF MARINE AFFAIRSUNIV. OF RHODE ISLAND
Stewart B. Nelson11 April 1974
==#======--=====1L--.IIII
I!- -- --- --;' ~,--.......~"':""--
Ackno,,,ledgementfl
While this writer t during 1972, was a staff member for the National
Advisory Committee on Oceans and Atmosphere t the opportunity to work with
such NACOA members as Dr. John P. Craven provided the motivation for de-
veloping this paper.
For their interest, as well as critique of this paper's first draft t
special thanks are due to:
Paul A. Amundsen t The American Association of Port Authorities
James G. Gross t l1aritime Administration
Edwin H. Hood t Shipbuilders Council of America
Robert S. Hope, Federal Haritime Commission
Albert J. Klingel t Jr., Federal Haritime Commission
John H. Leeper, Haritime Transportation Research Board tNational Research Council
Henry S. Marcus t Hassachusetts Institute of Technology
George H. Hiller t RADH, USN (Ret.)t Haritime Administration
Marvin Pitkin t ~furitime Administration
James J. Reynolds t American Institute of Herchant Shipping
William Jarrel Smith t Jr' t Federal llaritime Commission
It is emphasized that the statements and opinions are the writer's
own and are not necessarily those of the aforementioned individuals.
For her understanding t thoroughness, and infinite patience, I am
indebted to a great individual and secretary -- Elaine Thomas.
11
Table of Contents
Introduction
The Multiplier Effect of l~rine Transportationand Related Industry
Review of Specific Areas of Concern
Transport of Oil •
Unitized Cargos
Specialty Carriers and Offshore Platforms
~arine-llased Transit Systems •
Shipbuilding and Ship Repair •
Effective U. S. Control (EUSC) Ships.
The Economic Impact
Summary
Appendix: New Ship Type Designations •
Bibliography
iii
1
4
6
7
20
32
35
40
46
51
57
61
63
List of Figures
1. Oil Transportation Cost versus Vessel Sizeand Route Length
2. Total Port Cost per Ton for Break-Bulkand Unitized Ships
3. U. S. Flag Merchant Ships -- Privately Owned -Decline in Number of Vessels: 1969 - PreRent •
4. U. S. Oceanborne Foreign Trade: CommercialCargo Carried (Tonnage)
5. U. S. Oceanborne Foreign Trade: CommercialCargo Carried (Dollar Value)
6. Decline in Naritiroe Employment Shipboard Jobs,U. S. Flag Fleet
7. Nuclear/Fossil Fuel Ship Breakeven Comparisons
8. vlorldvide Nuclear Propulsion Activity
9. Existing and Proposed Repair Drydocks forVessels over 300,000 DWT
10. Merchandise Exports as a Percent of GrossDomestic Product, 1970
11. Port Cargo Volume versus GNP and the Index ofMining and Manufacturing (Japan)
iv
8
21
24
25
26
27
29
31
44
52
54
List of Tables
1. Cost of Oil per Ton Delivered to the East Coastfrom Oceanic Services
2. National Gross Domestic Product Structure (1969) •
v
10
55
Introduction
Following World '!-lar II, the United States Merchant marine possessed un-
challenged hegemony at sea, but this wa r-d.nduc ed phenomenon was short lived.
The U. S. merchant marine, today, is struggling to attain physical and eco-
nomic health. but it is a formidable undertaking since approximately 95 per-
cent of U. S. ocean-borne trade is currently being carried by foreign flag
vessels.
The diminution of the American maritime posture is a perplexing matter
since it can be regarded, intuitively, as both unnatural and untimely. The
U. S. has a heritage of the sea that predates the founding of the Republic.
The oceans, and the ships that sail them, have been a prominent factor in
shaping virtually every crucial moment in our Nation's history.
Recent Presidentially-appointed national committees and commissions con-
~erned with development of a national ocean program have been cognizant of
~his inextricable link. Yet, in the course of their deliberations they con-
~ciously chose to exclude serious discussion of the marine transportation
1~ystem.
1"••• the problems of the U. S. merchant marine ••• are extremelycomplex and deserve more careful, concentrated thought than thepanel was able to contribute in light of the broad scope of the~larine Resources and Engineering Development Act." [U. S.,Commission on Harine Science, Engineering and Resources. Industr~
and Technology, Panel Report, vol , 2 (IJashington, D.C.: GovernmentPrinting Office. January 1969). p. 45.]
"Of all the fundamental and pressing issues whfch HACOA wanted toinclude in this Report, but did not. ~larine Transportation standsout. However ••• it was next to impossible to examine the issuesand choices from an adequate perspective in the absence of a detailed analysis of the maritime transportation system as it interrelates with problems of economic growth, social costs and benefits,and environmental goals." [U.S •• National Advisory Committee onOr .... "'" .,.",,1 " • A R~~--" f-n .. l:~ n_~_~A~~ .. ~~.1 "h~ r . _
~Washington~ D.C.: Government Printing Office. June 1~72), pp. v-vi(Foreword). J
2-:-=====i1I=============================jIi====
At this point. an interpretation of ~lrine transportation system is
warranted. The Herchant 11arine Act of 1936 (as amended). through the use
of its regulatory and promotional powers. remains the principal mechanism
for maritime policy. Designed to "further the development. and maintenance
of an adequate and well-balanced American merchant marine. to promote the
commerce of the United States. to aid in the national defense." the Act
called for a strong merchant marine that woul d be:
sufficient to carry its domestic water-borne commerceand a substantial portion of the water-borne exportand import foreign commerce of the United States • • •
capable of serving as a naval and military auxiliaryin time of war or national emergency.
owned and operated under the United States flag bycitizens of the United States insofar as may bepracticaL
composed of the best-equipped. safest. and mostsuitable types of vessels. constructed in theUnited States and manned with a trained and efficient citizen personnel.
supplemented by efficient facilities for shipbuildingand ship repair ••• 1
As used in this paper. the marine transportation system will focus
upon the "well-balanced" aspects of maritime activities. Emphasis '''ill
be placed on the carriage of uater-borne conunerce and related supportive
activities and industries. Although the ability of the merchant marine to
function as a naval and military auxiliary will not be specifically exam-
ined in this paper. a related aspect will be reviewed concerning the
foreign-flag vessels under so-called "Effective U. S. Control (EUSC)."
lSee Charles D. Baker. "Water Transportation and National Policy -A Study in Success and Failure." Proceedings of the I1arine TechnoloS,l,Society (September 1973). pp. 579-585.
3
Hany factors have deterred national ocean-policy commlttees from
examining the issues associated with the U. S. marine transportation
system. The rationale for omission includes the embedment of the trans
portation system in a complex and established legislative and bureau
cratic framework; the extensive interaction of this industry with complex
international, political, economic and legal issues; and the enormity of
the developmental, investment, labor and international competitive prob
lems which beset the industry.
This paper, with only the broadest of perspectives, attempts to make
some general comments concerning the economies of the marine transporta
tion system and the interrelationships between marine transportation modes
and related industry.
---
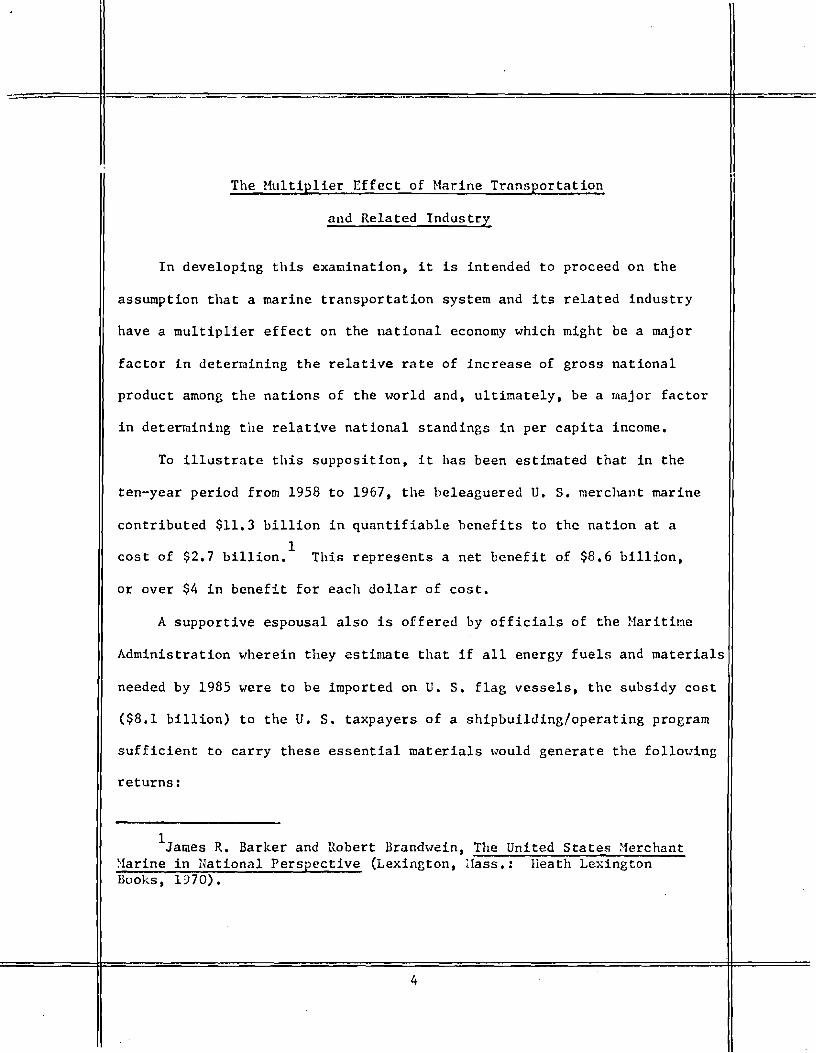
The Multiplier Effect of Marine Transportation
and Related Industry
In developing this examination, it is intended to proceed on the
assumption that a marine transportation system and its related industry
have a multiplier effect on the national economy which might be a major
factor in determining the relative rate of increase of gross national
product among the nations of the world and, ultimately, be a major factor
in determining the relative national standings in per capita income.
To illustrate this supposition, it has been esti~ated that in the
ten-year period from 1958 to 1967, the beleaguered U. S. merchant marine
contributed $11.3 billion in quantifiable benefits to the nation at a
1cost of $2.7 billion. This represents a net benefit of $8.6 billion,
or over $4 in benefit for each dollar of cost.
A supportive espousal also is offered by officials of the Maritime
Administration wherein they estimate that if all energy fuels and materials
needed by 1985 were to be imported on U. S. flag vessels, the subsidy cost
($8.1 billion) to the U. S. taxpayers of a shipbuilding/operating program
sufficient to carry these essential materials would generate the follo\ving
returns:
Ijames R. Barker and Robert BrundweLn, The United States ;·ferchantHarine in National Perspective (Lexington, lIass.: Heath LexingtonBooks, 1970).
4
II
5
2.1 million raan-years of employment wouLd begenerated to build and operate the vessels
$20.3 blll1c. •. in wUb-<'> voul.d be paid to shIpyard and shipboard employees
$11.3 billion woul<1 be paid in income taxes
A $57 billion expansion in gross nationalproduct (GNP) would be generated
$9.3 billion in balance-of-payments gainwould result.l
If this hypothesis is even partially correct, then there is cause
for grave national concern, for by any objective analysis, our progress
in the development of a marine transportation system is lagging behind
that of many other nations. This concern also must be extended to those
activities which are directly associated with marine transportation
the development of deep water ports and offshore oil terminals, the
establishment of integrated through services for unitized cargos, the
construction and repair of very-large and ultra-large tankers and
nuclear-powered merchant ships, the development of offshore commercial
and industrial facilities, the development of marine-based rapid transit
systems for the movement of goods and people, and the utility of Effective
U. S. Control (EUSC) ships in time of war or national emergency.
1J. Kasputys and J. B. Young, "Subsidies, Seed ~·10ney, and
National Security," Sea Pm-ler (Washington. D. C.: Navy Leagueof the United States. September 1973). pp. 23-30. (Hereafterreferred to as Subsidies -- Sea Power.)
Review of Specific Areas of Concern
The aforementioned generalizations are made evident by a review
of specific areas of concern for a marine transportation system:
Transport of Oil
Unitized Cargos
Specialty Carriers and Offshore Platforms
Marine-Based Transit Systems
Shipbuilding and Ship Repair
Effective U. S. Control (EDSC) Ships
6
Transport of Oil
On a worldwide bn s Ls the trend in oil transportation has been t owar d
1the use of ships of increasing size and draft. Figure (1) clearly de-
rnonstrates the economy of scale associated "lith supertankers. The trend
to size must, however, be accompanied by deepwater port capabilities, and,
because no existing U. S. port has the requisite draft accommodations, the
supertanker has to date bypassed the United States. In advocating the
development of deepwater ports, President Nixon stated the following in
his Energy ~Iessage of 1973:
If W~ do not enlarge our deepwater port capacity,it is clear that both American and foreign companieswill expand oil transshipment terminals in the Bahamasand the Canadian Maritime Provinces. From these terminals, oil \·;111 be brought to our co nvent LonaL portsby growing numbers of sm~ll and medium size transshipment vessels, therehy increasing the risks ofpollution from shipping operations and accidents.At the same time, the United States will lose thejobs and capital that those foreign facilities provide.
Given these considerations, I believe we mustmove f orwa r d \"ith an ambitious program to createnew deepvater ports for receivinr, petroleum imports. 2
IU.S., Department of Commerca, iIaritime Administration,The Economics of Deep\"ater Terminals O.,rashington, D. C.:Government Printing Office, 1972), pp. 5-8.
2president's Energy Hessage of April 18, 1973 to theCongress of the United States.
7
l
OIL TRANSPORTATIOfJ COST VS. VESSEL SIZE &ROUTE LENGTH
COST PERBARREL OF 0IL TRANS PORTED
(DOLLARS)2.00 IT , , ,
1.50 ...:1 , I I
4.- ~
6, 000 NAUT. MILES
:,/t
c.e
10,000 NAUT. MILES - ONE WAY
.50 I ~e=~ ~'::-:7--+----1tt , < I ;of
1.OO.~ I 1,6 I
FIGURE (1)
SOURCE: . u. S. Department of Commerce, MaritimeAdministr~tion, Office of Research and Deve1opment,~
. I •
Offshore Terminal Development Project, Sept. 1971. I
II
100 200 300VES SEL DEADWE IGHT TONS
(THOUSANDS)
o' , · ,o
9
In hi6 Energy Nessage of 1974, the Arab oil embargo notwithstanding,
President Nixon, again, made a strong appeal for appropriate legislation
to "permit the development of neH deepHater port facilities offshore."
He explained:
Even though our policy is to achieve selfsufficiency, we will clearly continue to importoil as long as it is availaLle at reasonableprices. To enaLle us to import fuel more economically, I have proposed Federal Governmentlicensing of the construction and operation ofdeepwater port facilities three miles or moreat sea on the Outer Continental Shelf. Themain use of these facilities wouLd he to inportcrude oil in ships that nrc economically andenvironmentally desirable, but are too deep ofdraft to permit their entry into our port facilities on the East and Gulf Coasts.
This legislation would also eliminate manyof the legal uncertainties whf.ch nOH drive private investors away from l.nerican waters and toother nations of the Hestern Hemisphere. Thepresent system only serves to create investmentsand jobs abroad and raises our costs of importedoil, already high, even further • • • (the Araboil embargo) has opened our eyes to the shortsighted policy (of excessive dependency onforeign supplies of a vital good) 'ole had beenpursuing. l
Total tanker arrivals for the 48 contiguous states in 1971 numbered
67,700 \-lith 84 percent of these along the Eastern Seaboard. Hest Coast
arrivals amounted to 6.5 percent, and Gulf Coast arrivals were 9.5 percent
2of the total. The cost of transporting oil to the U. S. East Coast is
shown in Table (1). At the present time (prior to the AraL oil embargo)
1President's Energy ~[essage of January 23, 1974 to theCongress of the United States.
2Bureau of National Affairs, Inc., Environmental Reporter(Hashington, D. C.: Bureau of r.ational Affairs, Iric , , }!ay 1973),p. 19.
I
I
1
I!
TABLE 1
COST OF OIL PER TON DELIVERED TO THE EAST COAST FROH OCEANIC SERVICES(Foreign Flag Ships)
Existing Canadian Off- Off shore Island Offshore Island andSituation shore Terminal and Pipeline Feeder Vessels
Cost of Ocean Freight 5.30 5.30 5.30
Transfer Charges .35 .65 .80
Transport to Refinery 1.13 .40 .38I--'0
Cost of Unloading .15 .15 .15I
Cost of Pollution Control .15 .15 .15
Cost Oil Per Ton 10.85 7.08 6.65 6.78,
(326,000 ton ship) (326,000 ton ship) (250.000 ton ship)
SOURCE: U.S. Department of Commerce, Haritime Administration, Office of Researchand Development, Offshore Terrnin~l Development Project, September 1971.
I
:
I
II
11
more than 104.000.000 tons of oil per year are transported by ship to the
1East Coast. Considering the differentials indicated in Table (1). an
annual cost savings of approx~mately $425 million per year could be real-
ized through the implementation of a super carrier/offshore terminal
system. Such a differential would war rant; a multi-billion dollar invest-
ment at current expectations for return on capital and. indeed. this is
supported by the number of offshore terminal studies now being conducted
2by private and local interests. Significantly, the legislation submitted
to Congress pursuant to the President's energy messages includes states,
political subdivisions and public or municipal corporations among the
entities that could be authorized to construct or operate deepwater port
faciiities beyond the three mile limit. 3
Concerning the investment of U. S. private capital in the requisite
super carriers, the Herchant !farine Act of 1970 has gone far to encourage
the development of a U. S. flag bulk carrier fleet capable of transporting
a reasonable proportion of our growing imports of petroleum and other bulk
commodities. 4 Indeed, the current shipbuilding "boom" in the United
1U.S., Department of Commerce, l1aritime Administration, Officeof Research and DevelopIaent, Offshore TerIainal DevelopMent Project(tlashington, D. C.: Government Printing Office, Sep t ember 1971).
2Three deepwater terminals are presently under active consideration:Sea Dock, near Freeport, Texas; LOOP, near Grande Isle, Louisiana; andone off Delaware.
3For a general discussion of the various planning and arrangementsfor offshore port financing see Duncan C. Gray, "Sources of FundsRequired," Planning for Offshore Ports (llashinr,ton, D. C.: ~farine
Technology Society, 1974).
4U• S., Congress, House, Report of the Activities of the HerchantHarine and Fisheries Committee, 9~D Congress (Hashington, D. C.:Government Printing Office, 1972), p. 11.
12
1States is being fueled by the most liberal financing terms in history.
In contrast \vith the wo r Ldwd de financing available for ships, the credit- 0(.
worthy U. S. flag shipping transaction can merit 100 percent financing --
rather than the maximum 10 or 80 percent abroad; can be at a money cost
significantly lower -- by 3 to 5 percent; and, more important, can be a
fixed rate over a duration approximating the life of the ship (20 to 25
2years) rather than the 8 to 12 year term customary elsewhere.
By the mid-1980's, the United States will have to import between 50
to 60 percent of its petroleum products, as compared to the 26 percent
3we had currently imported prior to the oil embargo. In terms of balance
of payments, the United States imported $3.6 billion worth of energy fuels
in 1911 while exporting only $1.5 billion -- primarily coal. By 1985,
this balance-of-trade deficit for energy could rise to $25 billion
4annually.
It should be generally conceded that the construction of cleepwat er
ports (be they monobuoys, fixed structures, floating or artificial islands
makes both economical and environmental sense. The critical questions
however concern tanker moveoents. It is, of course, obvious that for at
least the next decade, even with the President's Project Independence for
energy self-sufficiency, we will continue to be dependent upon foreign
3U• S., Council on Environ~enta1 Quality, Energy and theEnvironment (\1ashington, D. C.: Government Printing Office,August 1913), p. 7.
4I b i d•
13
sources for our energy supplies. Shall we risk a dual dependency by
becoming dependent upon foreign bottoms to transport these fuels to our
shores? As of December 31, 1971 the U. S. flag tanker fleet consisted
of 291 ships (both private and government ovned) with an average tonnage
of 27,000 DHT. l To carry the projected crude imports it is envisioned
that 200 supertankers (VLCC's) \~ill be needed, supplemented by 300 to 500
small shuttle tankers (although in some cases pipelines could be used)
for transshipment from U. S. offshore port facilities to major refineries
and distribution centers. 2 If offshore facilities are not constructed,
it has been estimated that 2,600 tankers, averaging about 47,000 D\IT each
to conform with existing port limitations on the East and Gulf Coasts,
3would be required to meet future U. S. import requirements.
The crux of the problem is wha t should the "mix" be for the U. S.
flag tanker fleet, recognizing that the operating scenario lacks clear
definition. As of December 31, 1973, there were 49 tankers under con-
struction or on order. Of this total, 11 tankers are very large crude
carriers (VLeC's) ranging betueen 100,000 to 265,000 DHT; 13 are ap
proximat.ely 90,000 mIT and 25 are less than 40,000 mIT.4 About one-half
1U. s., Departnent of Commerce, Haritine Administration,
A ~i2\-l \-,ave in American Shipping (\lashington, D. C.: GovernmentPrinting Office, 1972), PI'. 72-73.
2Harine Engineering/Log (Hew York: Simmons BoardmanPublishing Corporation, April 1973), p. 5.
3aaritioe O-lasldngton, D. C.: AFL-ClO Naritime TradesDepartcent, Spring 1972), p. 5.
4U. S., Department of Commerce, ~1aritiT:le Administration
Tabulation, "Shipbuilding Contracts Under Xerchant Harine Actof 1970," (1973).
14
of these 49 tankers are covered by the Cost Differential Subsidy (CDS)
provision of the }ierchant Harine Act of 1970. CDS applications pending
before the ~Iaritime Administration' 6 Suhsidy Board include an additional. 1
98 tankers ranging in size from 00, 000 mIT to 400, 000 DWT.
These ships probably \"ill be ready for sea in the 1975 - 1978 time
frame, and they will be looking for both adequate cargos and port facil-
ities. To insure that there will be available cargos there is mounting
sentiment in the Congress to pass legislation allocating a certain per-
centage of U. S. oil imports for carriage in U. S. flag tankers. During
the first and second sessions of the 92nd Congress, 182 Congressmen (42
percent of the House membership) sponsored or co-sponsored 26 separate
bills for allocating a certain percentage of U. S. oil imports for U. S.
flag ships. One bill (u.a. 13324) wouLd have required that 50 percent
of all U. S. oil imports be transported by U. S. flag ships. The ex-
pressed purpose of the bill was to "assure that the United States does
not become wholly dependent on foreign vessels for its rapidly increasing
oil imports with resultant adverse implications for our national security,
balance of payments, domestic economy, and marine environment. 1t Although
there was widespread Congressional support for this bill, it was defeated
in the Senate -- but only by seven votes. Similar legislation is now
before the 93rd Congress and is being actively considered.
lU. S., Department of Commerce, tmritime AdministrationTabulation, Itpending Construction Differential SubsidyApplication,1t (1973).
15
Another factor which must be recognized concerning our tanker mix is
the eventual completion of the Trans-Alaskan Pipeline t~wse sea leg will
consist of 011 being transported from Valdez, Al.aska to I-Jest Coast r e-
fineries and to a Panama lstllmus transshipment point. Carrying oil be-
tween domestic ports (Valdez to West Coast ports) will be restricted tu
u. S. flag vessels as governed by the Herchant Ilarine Act of 1920 C'The
Jones Act"). Section 27 of that Act stipulates:
That no merchandise shall be transported by water, orby land and wa t er , on penalty of forfeiture thereof,between points in the United States, includingDistricts, Territories, and possessions thereof embraced Hi thin the coa s twfse laws, either directly orvia a foreign port, or for any part of the transportation, in any other vessel than a vessel built inand documented under the laws of the United Statesand Otmed by persons who are citizens of the UnitedStates • • •
The make-up of our tanker fleet is further complicated by the cur-
rent limitations associated with construction subsidies. The Merchant
t~rine Act of 1970 provides for a Construction Differential Subsidy (CDS)
to encourage U. S. built ships. Its success is evident with the order
backlog of U. S. shipyards at a peacetime high. In addition, pending CDS
applications, which totaled lSO ships (both tankers and non-tankers) as of
the first of this year, are far in excess of the 30 ships per year target
of the Act. llith CDS funding limited to $300 million annually, how should
1the dollars be apportioned among the various vessel applicants?
lYor a discussion of this particular problem see Henry S. Harcus,"The Need to Redefine the Objectives of the U. S. Ilar Lt Lme Subsidy Progran," Proceedings of the Harine Technology Society (September 1973),pp. 565-577.
16
The issue of government-subsidized tanker construction becomes more
perplexing when the environmental issue is introduced. Various environ-
mental groups, in 1~72, had obtained a court order to halt the contractinp,
for subsidized tanker construction until the :Iaritime Administration filed
1an environcental impact statement. An impact statement was eventually
filed, under protest, and in the Fall of 1973, the environmentalists,
somewhat satisfied that certain environmental protection equipment (such
as anti-collision radar and inert-gas tank blanketing systems) ,~ere being
2required, decided against further court action. The really expensive
requirements such as double bottoms and segregated ballast tanks are
still generally in abeyance. Although agreenent Has reached at the recent
Intergovernmental ~1aritime Consultative Organization for segregated bal-
last tanks in new tankers, the agreement does not become operative until
ratified by 15 or more countries representing 50 percent of world ton
3nage. Since CDS funding is limited by statute to a fixed percentage,
the imposition of environmental protection features either not required
or exceeding the standards of foreign ships could easily negate the value
of the CDS allowance. 4 The alternatives are then the establishment of
1Harine Engineering/Log (New York: Simcons Boardman PublishingCorporation, October 1973), p. 9.
2I bi d •
3shipyard l"eekly ('i-lashington, D. C.: Shipbuilders Council ofAmerica, llovember 8, 1973).
4The Herchant Harine Act of 1970 provides for diminishing levels
of the Construction Differential Subsidy starting with 45% of domesticbuilding cost in 1971 and declining 2% each year until a maximum of 35%is reached in 1976. The drop of the subsidy base will require a substantial reduction in the cost of ships constructed in U. S. shipyards.
17
uniform international standards, legislating an offsettinn adjustment in
the CDS percentage, or, all else failing, having tIle owner opt for the
less costly foreign flag vessel.
Let us consider one final facet of the oil transport picture --
refining capacity. In 1970. there were 268 refineries in the U. S. 'dth
an average daily capacity of about 50.000 barrels. To keep pace with the
projected demand, it has been deternined that we will require by 1980 the
equivalent of 58 new refineries with an average capacity of 160, 000 bar r eLs
1per day. To date, only one new refinery is under construction. Recog-
nizing the environmental pressures concerning refinery construction.
particularly since the preferred siting is generally in the already over-
burdened coastal zone, just how does the U. S. accor:unodate this needed
refining capacity. Perhaps offshore refineries offer the solution, par-
ticularly when it is desirable to have your refinery centers in proximity
to the areas of heaviest energy consumption. Consider the situation
today: the Gulf Coast currently has only 16 percent of the U. S. energy
demand. but has about 40 percent of the country's refining capacity.
The East Coast. on the other hand. has 40 percent of the demand but only
12 percent of the refining capacity.2 Although it has been estimated
that roughly a 50 percent expansion of refining capacity is possible at
existing sites. 3 perhaps the ultimate solution is the construction of
offshore refineries.
1Ocean Industry (Houston. Texas: The Gulf Publishing Company.August 1972). pp. 38-44.
2I b i d •
3u• S•• Council on Environmental Quality, Environmental QualityThe Fourth Annual Report of the Council on Environmental QualityOJashington. D. C.: Government Printing Office, 1973), pp. 207-203.
18
In any event, it is evident that oil transport offers tremendous
economic opportunities for the United States. How successful we \olill be
in realizing these economies depends upon our ability to treat our trans-
portation system in its totality -- a process which has yet to be ade-
quately demonstrated -- for. in summarizing. several issues remain to be
confronted and resolved. Specifically, ,",hat is needed includes the
fo l.l.owi.ng r
To enact appropriate lecislation to permit the constructionof deepwater, super tanker port facilities.
To assess U. S. flag tanker fleet requirenents (as well asoffshore port facility needs) in terms of Project Independence • . • achieving self-sufficiency in energy by 1980.
To determine the major sources of oil. These sources couldrange from the U. S. Outer Continental Shelf, the Arctic,or Middle ~ast. Each of these sources places a differentset of requirements on the shipping industry and the tankermix.
To enact oil cargo preference legislation to insure a fixedquota of the oil trade is reserved for U. S. flag tankers.As expressed by the President's Commission on AmericanShipbuilding:
Because of the increasing bilateral trade pressurefrom developing and oil-producing nations, becauseof the increasingly assertive participation ofstate-owned fleets in shipping, and because of thepast reluctance of U. S. oil companies to buildand operate U. S. flag tankers, it appears necessary that a quota of the petroleum and gas tradebe reserved for efficient and competitive U. S.built. U. S. manned ships if the United States isto l~ve a significant portion of this transportation under its control and to have the capabilityto build and repair the necessary vessels. l
lReport of the Commission on American Shipbuildin& (Hashington,D. C.: Government Printing Office, October 1973).
19
To develop a national position in the event of pressurefrom oil-producing nations to dictate oil carriaee requirements. Again, quoting from the Repo rt; of theCommission on American Shipbuilding:
The Department of State has pointed out, inCongressional hearings, that Iraq and theArab Federation of Egypt, Libya, and Syriahave announced plans to establish oil tankerfleets. Venezuela, KUHait, and Snudi Arabiahave also expressed similar goals. By virtueof their control of the oil itself, there islittle doubt that the oil-producing nationshave the power to require that their tonnagecarry a portion of their oil exports • • •The United States faces this world situationwithout the national objertives \lhich are soclear in other countries.
To review both the adequncy and apportionnent ofConstruction Differential Subsidy (CDS) funds particularly in relation to world shipbuilding activity.For example, at the end of 1973 there Here 3,359merchant ships under construction or on order in themajor shipbuilding countries and tankers represented75.7 percent of the tota1. Z As commented upon inthe Harine Engineering/Log:
H11ile nothing is certain in the shipping business,the present uncertainties of the oil situation\-lould se.em to indicate that this huge order bookof tankers is more than the \lor1d fleet Hould needin the foreseeable future. 3
The Arab oil embargo has produced a panoply of energy-related issues,
and the character and viability of the U. S. merchant marine Hill be de-
termined by the pursuant policies and planning actions of the U. S. govern'"
mente
2Harine Engineerin{}/Log (Nom York: Simmons Boardman PublishingCorporation, February 1974), p. 116.
Unitized Cargos
The techniques which have been pioneered by United States technology
include, initially, the pallet ship, the conta:l.ner ship, the barge-car rvf.ng
ship (LASH and SEABEE), and, ultimately, the nuc Lea r epower ed ba r ge-ica r ry t ng
ship. Figure (2) shows the economic advantages which accrue from imple-
mentation of each mode of unitization. The cost savings are large indeed.
The United States' experience with respect to the realization of the
economies of unitized cargos has again been one of bright promise accom-
panied by much frustration. The achievement of unitization brings with it
a substantially higher productivity per laborer on the docks and a blurrin!,
of distinction bet\leen teamster and longshoreman functions. As seen from
figure (2) this is not an incremental percentage gain in productivity but
a multiplication in prod~ctivity by factors as high as five.
As viewed by the unions, parsimony ,~ith respect to sharing the bene-
fits of such modernization with labor resulted in a costly national strike
in 1972 which affected the balance of trade and delayed the national real
1ization of the economics of unitization. Additional difficulties have
resulted from the manner in which container ships must operate. Specif-
ica11y, the economics of an efficient container ship operation dictate
lIn 1972, two longshore contract disputes caused a lJ5-day workstoppage at Pacific Coast ports and a 57-day stoppaee at Atlantic andGulf Coast ports. [See U. S•• Department of Commerce, naritimeAdministration, A Ne,~ \~ave in American Shipping (Hashington, D. C.:Government Printing Office, 1972), p. 37.]
20
--~
21
FIGURE (2)
TOTAL PORT COST PER TON FOR BREAK-BULK AND UNITIZED SHIPS
-Prcliminarv data subject to future revision.Note: Includes Covcrnmcru sponsored cargo; excludes Department of Defense cargo and U.S./Canada translakcs cargo.
SOURCE: U. S•• Department of Commerce. Haritime Administration.A New Wave in American Shipping. 1972.
Ii
27
-DECLUm IN tIARIT HIE EHPLOY~mNT SHIPBOARD JOBS
U. s. FLAG FLEET
(Foreign and Domestic Trades)
60
55 54.8...a....... 53 9
~......K50~
50 LI o "
47.547~
V '\.•45 ,
\\;740
"I
i35
30 "25
'~l
20
15
10
5
0
1964 1965 1966 1967 1968 1969 1970 1971 1972
FIGURE (6)
SOURCE: U. S., Department of Commerce, Haritime Administration.
'I
28
Herchant Harine Act of 1970. Although American shipbuilding is at a rec-
ord peacetime high, nothing has yet transpired to indicate that the new
capabUity \"Ul do more than maintain current relative world ranking of
the fleet.
from utilization of large size, nuclear-powered ships in commercial ser-
$2.50 a barrel, and it is expected that costs will shortly hit $9.00 a
Bunker fuel prices are now 200% more than the 1972 price of
Recognizing that this comparative analysis \-I8S prepared before the
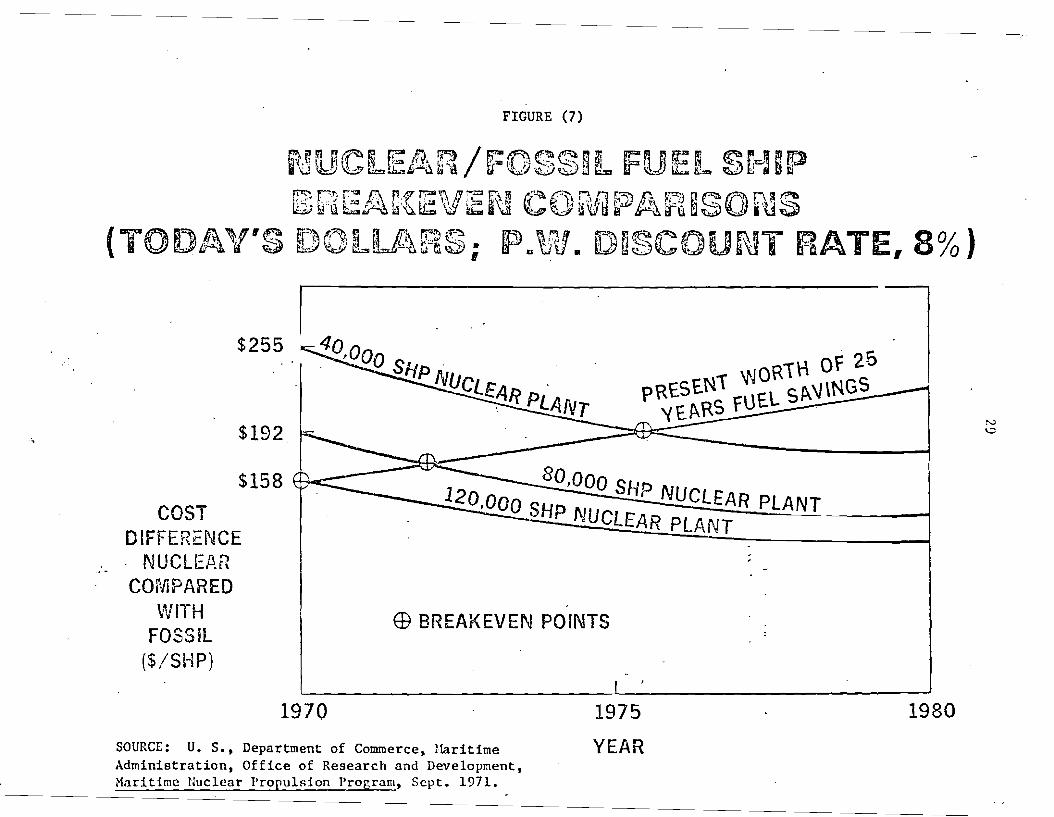
IOf additional concern is the trend of events wi t h respect to nuclear 11
merchant ships. As shown in figure (7), short-term economic gain accrues \
II
\current oil shortage, circumstances nov appear to be combining to make more:
at tractive the poss iL ility of eonst rue t ing nucLea r-powered U. S. f Lag mer-I!
IIchant ships.
vice.
1barrel.
The Federal Haritime Cor:unission is currently seeking to hammer out a
formula which will permit steamship lines and carrier groups to impose
bunker fuel surcharges to offset the skyrocketing cost of operating mer-
chant ships. These escalating bunker fuel prices are also causing ship
operators, as an economy measure, to limit the number of U. S. ports ser-
viced at a time when the devaluation of our dollar is increasing the amount
of U. S. exports, particularly to Western Europe.
Legislation is now before Congress (H.R. 7694) that would establish
a nuclear merchant ship incentive support program by providing federal
support payments to cover "such portion of the construction cost difference
arising from the use of nuclear propulsion units • • • necessary for the
purpose of fostering the advance of U. S. flag maritime technology. "
lLarry C. Hanning, "Atoms at Sea," Sealift (\-lashington, D. C.:!'Iilitar S~alift COIllI!l~nd. Januar
FIGURE (7)
fi~~ ~ H~~ p: Al ~ / f:~~~:~~"' ~ m EE ~ G7 ~ ~ ~ i~~ lfl DU\j ~~~~~'""Ul:l4 tf ~~ ~~U Ii:.:I:J lrU 64.. ~ ~t:; g ti J:j
PRESEN1" '/'JOR1"H of 25'{EI\.RS fUEL SI\.\IINGS--
~HP NUCLEAR PLANT120,000 SHP NUCLEAR PLANT
EB BREAKEVEN POINTS
I 40,000 SHp .
NUCLEAR PLANT:--..:...-
$192 .-
$255
$158~
COSTDIFFERENCE. NUCLE.8.RCOMPARED
VvlTHFOSSIL
($/SHP)
1970
SOURCE: U. S., Department of Commerce, HaritimeAdministration, Office of Research and Development,Maritime Nuclear Propulsion Pr~grom, Sept. 1971.
1975
YEAR
1980
]0.....=.===:ft============================tt====
Such p<lyments tvou1d be repayed by the recipients throueh recapture of 20
percent of the nuclear ship's annual net operating income until tile full
1amount of incentive pa}~ents are recovered.
Although the prospects for building nuclear merchant ships appear
brighter, the Administration does not support the program envisioned by
H.R. 7694 because of lingering questions as to economic feasibility,
licensing and regulation, safety, financial responsibility, third party
?liability, indemnification Lfmf t s and international reactions. ~
Neam"hi1e, the foreign trend t ovard nuc Lea r-epower ed ships, as ill us-
trated by figure (8), continues. Unless the United States shortly over-
comes its current cautious approach, it will lead to domination in this
area by Japan, \-lest Germany, and !lussia. If this occurs, it will serve
as another example of \vhere the U. S. failed to exploit its technological
lead, thus allo\1ing others to acquire the doninant positions. (For added
emphasis, it should be noted that the nuclear pouer plant of the West
German ship Otto Hahn is a U. S. designed system.)
IIhe cost estimates vary for construction of a nuclear-poweredmerchant ship, as compared to a conventionally-powered ship. Forexample, a 400,000 D~~ conventionally-po~1ered tanker costs approximately $125 million. Estimates for a comparable nuclear-poweredship range from $40 to $100 million more.
2Shipyard Heekly (Hashington, D. C.: Shipbuilders Council ofAmerica, ~Iovember 8, 1973).
carriers, mobile offshore drilling rigs, oceangoing tug-supply vessels,
workover units and pipe burying barges. The full panoply of industrial
ships of massive scale has resulted in the movement of heavy industry to
the coastal zone in order to minimize transportation costs and optimize
on ocean transport. This has been particularly true in Japan, the
1Uetherlands, Sweden, and Germany. In major sllipyard modernization alone,
future investment plans are expected to total more than $350 million be-
cause of the interest of American shipyards in entering the world market
for the construction of LNG ships and the requirements of the Alaskan oil
2trade.
Such developments have not been without effect beyond purely economic
tenus. Each new and expanded industry has resulted in a consumptive use
of the already crowded coastline and has. added to the pollution problem of
bays and estuaries. The logical step beyond coastal location is that
of outward movement to fixed or floating stable platforms or artificial
IV. S., Department of the Army, Corps of Engineers, Institutefur \~ater Resources, Foreign j)eep \later Port Developments, 3 vols(December 1971).
2U• S., Department of Conunerce, :laritime Adrad.n Ls t r a t ion, A newHave in Ar.lerican Shipping (\.Jashington, D. C.: Government PrintingOffice, 1972), p. 13.
32
JJ
Lo l.ancla Loc a t cd uell beyond interference \J:!.th other competing uses of the
zone. Accompany Lng this industrial novcmen t has been the development of
platform and island designs for a multitude of functions.
An analysis of both stahle platforms and artificial islands in marine
enterprises has demonstrated their cost effectiveness in such applications
as offshore petroleum drilling, oil refineries and storage, ocean mining
and dredging, fishing and fis11 processinz, energy generation, harbors, air-
ports, oceanographic research stations, and even urban living and recreatioT
1centers. Integration of these functions, Hhere feasible, on single plat-
forms or in platform complexes could achieve the full economic benefit and
enhance the investment.
United States development in this total set of industrial complexes
is presently liI:lited to the offshore oil platform and offshore oil storage,
and a few specific projects, such as offshore deepwa t e r port facilities
2for VLCC's and floating nuclear power plants. Aside from these, a coheren
and total national program for ocean platform development does not now ex I s •
In evaluating the significance of this deficiency, it should be reempha~ize
that offshore facilities locate industries for which pollution control on
land is difficult, if not \lell nigh impossible, in a controllable environ-
ment, and provide structures in vater s whLc h , wLt ho ut dredging, are deep
1H. R. Talkington, "Transfer of Navy Platform Technology to Solution
of Societal Problems," Journal of the :!arine Technology Society (January February 1973), pp. 56-60; G. Schreuder and C. Stigter, Sea Island Project(N.V. Holland: Bos Kalis Westminster Dredging Group, ~~rch 1972).
2u. S., National Advisory Committee on Oceans and Atmosphere, SecondAnnual Report of the ~':ational Advisory COr.u:littee on Oceans and Atmosphe.re(Washington, D. C.: Government Printing Office, June 1973), pp. 16-23.
34--
enough to qualify as deep",ater harbors. The cost of .:.uch facilities nppeClrs
to be competitive if not super Lor to coastal counterparts, and they can be
built \-lithout uprooting and Lnt er r erLng Hith existing enjoyment of the land
and coastal zone. A further advantaee of floating facilities is their
ability to be relocated in response to demographic change.
-"====»=========================-==1F==--·
Marine-Based Transit Systems
No discussion of marine transportation would be complete without some
reference made to the movement of goods and people to the coastal zone and
to the inland.
There are more than 25,000 miles of navigable i.n1and waterways
serving almost every concentration of the nation's heavy industry and
its most efficient farming areas. It has been cstiI'l8ted that on the
river one dollar will produce 300 miles of service; by rail, the same
amount will produce 66 miles and by truck, 15 miles. l These economies
can best be seen in the fact that inland barges perform ten percent of
the inter-city ton miles and receive in revenues half of one percent of?
the nation's freight bill. ~ lHth a national annual inter-city freight
bill of approximately $80 billion, there is an inherent national poten-
tial for savings whLch is measured in billions of dollars if substantial
increments of inter-city freight are shifted from land to water. The
trend has been for industries to move to the river bank wher e they can
take direct advantage of the economies of barge transportation for their
raw materials and products. But, almost as important, they can play the
lJ. A. Cr eedy , "The Potential of Our Inland ~"aterway,"Proceedings of the ~~rine Technology Society (September 1973),pp. 401-408.
2Ibid.
35
36
barge lines against the railroads and achieve so-called "wa t cr-ecompe l.Lcd"
rail rate reductions. Such reductions ranee up to 60 percent and have
1tended to accelerate the movement of industry to the river banks.
The advent of the container sh:l.p and harge/1ighter ship have hrought
a net" international dimension in international trade to the river system.
For containerized cargos, ocean carriers and inland transportation com-
ponies have developed facilities and procedures for handling intermoda1
movements to and fron the ports. But intermoda1ism has not developed as
rapidly as has been hoped for in the United States. The principal prob-
1em is caused by the conflicting standards of our rer,ulatory laws. Thus
far, carriers have only extended through services under single factor
rate-making to so-called landbridge and ninihridge services hetween ports
Truly integrated services are not yet offered to and from inland points
under through rate and through route arrangeMents. The greatest cha1-
lenge facing our ocean shipping system is to begin to accept general
cargo ocean transportation as a link in an integrated "origin-to
2destination" system. If containerization is to approach its true
potential, regulatory impedinents must he resolved.
Correspondingly, the barge carrying ships (LASH and SEABEE) have
served to extend shipping services to river ports or other ocean ports
which could not accommodate the deep-draft "nother ship". Like the
container ship, these vessels open a neu means of through transportation.
IJ. A. Creedy, "The Potential of Our Inland H'atertJay,"Proceedings of the Harine Technology Society (September 1973),pp. 401-408.
2R• P. lIolubowicz, "The Challenge Facing the Ocean ShippingIndustry, II Haritime Reporter/Engineering Neto1S (~ray 15, 1972),pp. 19-21.
37
Eighty percent of the metropolitan areas in the UnitedStates are located near a body of water -- an ocean.lake. river. estuary. sound. or bay. Some 90 millionpeople live and work close to water. In view of thesefacts it is not surprising that it appears feasible toexpect that by 1980 one-half million urbanites in some30 cities could utilize over-the-water craft daily astheir primary mode of transportation. Stich a turn ofevents would result in 200.000 fewer private cars indownt.own business areas daily. 12.000 new jobs inmanufacturing and operatin~ the system. a higherquality of life for many city dwellers. and a numberof secondary benefits not yet clearly perceived. l
The reality of the situation. however , 11'1 that the movement of people has
undergone the same characteristic development dilemna that has been seen
in the other forms of maritime COmr:lerce. U. S. technology has developed
hydrofoil craft. air-cushion vehicles. surface-effect vehicles. and
captured-bubble craft. At present. though. few if any of these advancedI
marine craft are in commercial service in the United States. In contrast~I
the Soviet Union has more than JOO regularly scheduled commercial hydro-
foil services operatin~ on its inland waterways and canals. Cities of
the United States are similarly linked. and the development of marine
2mass transit should be developed as a viable transportation mode. It
1U. S •• Department of Transportation. Urban Nass Transportation
Administration. Over-the-Water Program Design. by P... Krzyczkows kf ,Report No. UHTA-r;~T-RDC-8-71-l (December 1971).
2public Law 92-374 ("Hydrofoil Ships"). enacted in 1972. acknowledges the perfection of the hydrofoil concept to the point where large.high speed (over 40 knots) ships may be built for the carriage of freightand passengers. The Act. therefore. permits favorable Federal shipnortgage insurance for hydrofoils and other surface-effect ships whLchmeet nininum speed and horsepower requi.rements wi t hou t regard to tonnage.
38
\
o=L=should be noted that the benefits whLch could accrue from the development Iof such a system have drawn the notice of industry and various cities.
Hawa I f , for example, is studying the Il3\vC\ii Environmental Area tk1SS
Transi t (HEART) System whLch \,ri1l utilize the ocean as the expres svay
with bO.:lts operating on the existing canals and streams for the local
1loops.
An integrated marine-based transit system contains the seeds of
promise for energy .conservation and for the solution of a large number
of coastal energy consumptive and environmental coastal zone problems
less energy per ton-mile than any other method of freight distribution.
of our society.1
For example, water transportation harge service requires I
If
Water freight requires 500 BTU's of energy for every ton-mile of freight
moved; rail freight requires 750 BTU's per ton-mile; pipelines 1,850
BTU's per ton-mile; trucks 2,400 BTU's of energy per ton-mile; and air
cargo 6,300 BTU's per ton-mile. 2 Several studies have also demonstrated
the efficacy of a water-oriented mass transit system. 3
Coupled wLt h the movement of freight and people is the advent of
offshore oil terminals and a projected (by the end of the century)
1,000 nuclear power plants, the ~ajority of which, in all probability,
~1. A. Lucas, "l-Iarine Hass Transit for Hawa Ld, A Case Study,"Proceedings of the }~rine Technology Societ~ (September 1973),pp. 377-383.
2Big Load Afloat (Washington, D. C.: American WaterwaysOperators, 1973).
3See William H. Shultz, "Status of Domestic High-Speed :IarineVehicles for Hass Transit," Proceedings of the :1arine TechnologySocietl (September 1973), pp. 409-419.
on Oceans and Atmosphere,Government Printing Office,
\1
::::::::==~;::==============~====================.c====.=::== = _=1\.ri11 be locatcd offshorc on floating platforms. What is therefore
suggested. is that the surface of the ocean. the coastal zone. and the
coastal canals and waterwaya be reserved for rapid marine transit of
goods, s.e.rviccs and people be tween offshore facilities, from offshore
facilities to the shore. and between coastal, riverine, and canal
2coramunities.
If the marine transit system could be developed on a national
scale, it could help solve many urban and industrial problems of the
coastal zone.
lU. S., National Advisory Corr~itteeSecond Annual Report (1Jashington. D. C.:June 1973).
2John P. Craven, "Offshore Platforms and Superports: Technical
Considerations," The Oceans and National Economic Development(~'lashin8ton, D. C.: Government Printing Office, December 1973),pp. 230-232.
Shipbuilding and Ship Repair
In reviewing the shipbuilding and ship repair capabilities of the
United States, which, of course, are major components of the maritime
industry, discussion will be focused on tankers since they represent the
cOn1ncrcial behemoths.
\vhereas, in recent history, with fet-! exc ep t Loris , Amer i can shipyards
were building small tankers in the range of 30,000 - 50,000 DHT, the
orderbook today for the U. S. shipbuilding industry includes tankers up
to and including 265,000 m:T. Additionally, there nrc app l Lca t Ions
pending for tankers in the ultra-large category (400, 000+ m~T).
T\-1O shipyards -- Bethlehem Steel Corporation, Spar r ows Point,
:~ryland and Seatrain Shipbuildine Corporation. Brooklyn, New York
are currently engaged in the construction of 265,000 mrr and 225,000 mIT
VLCC's, respectively •. Bethlehem has recently indicated that 350,000 D1IT,
1or slightly larger, VLCC's may be built at Spa r r ows Point.
The new facilities in three other yards \.,ill be able to accommodate
even larger vessels. llewport Ne\"s Sh Lpbu LldLng Corporation, l':e\-!port NeHS
Virginia will be able to build VLCC's as large as 600, 000 mIT. Avondale
Shipyards, Incorporated, He\" Orleans, Louisiana and Sun Shipbuilding and
Dry Dock Company, Chester, Pennsylvania could construct 1.00, 000 mIT
VLCC's.2
lEdwin H. Hood, Speech delivered before the Propeller Clubof Newpo r t News , Virginia, 12 December 1973.
I!IIIIdry." In addition, classification societies require that, for maintenance I
of class, vessels be surveyed in drydock at specified intervals. On these
IIII1'1
plating are cleaned and examined with propellers, streets, and sea chests,I,II[The stern bearing clearance
III
Because of Ith is. t h e sLz es of a repair yard's drYdo:ks and the cranes serving them arellthe measures of their yard's "capacity." II
bUiltI:oa:c:::::d:::t:::p:O::::i:::.:::s::n:.:::~::of:::~it::Sp:::e::~ng I
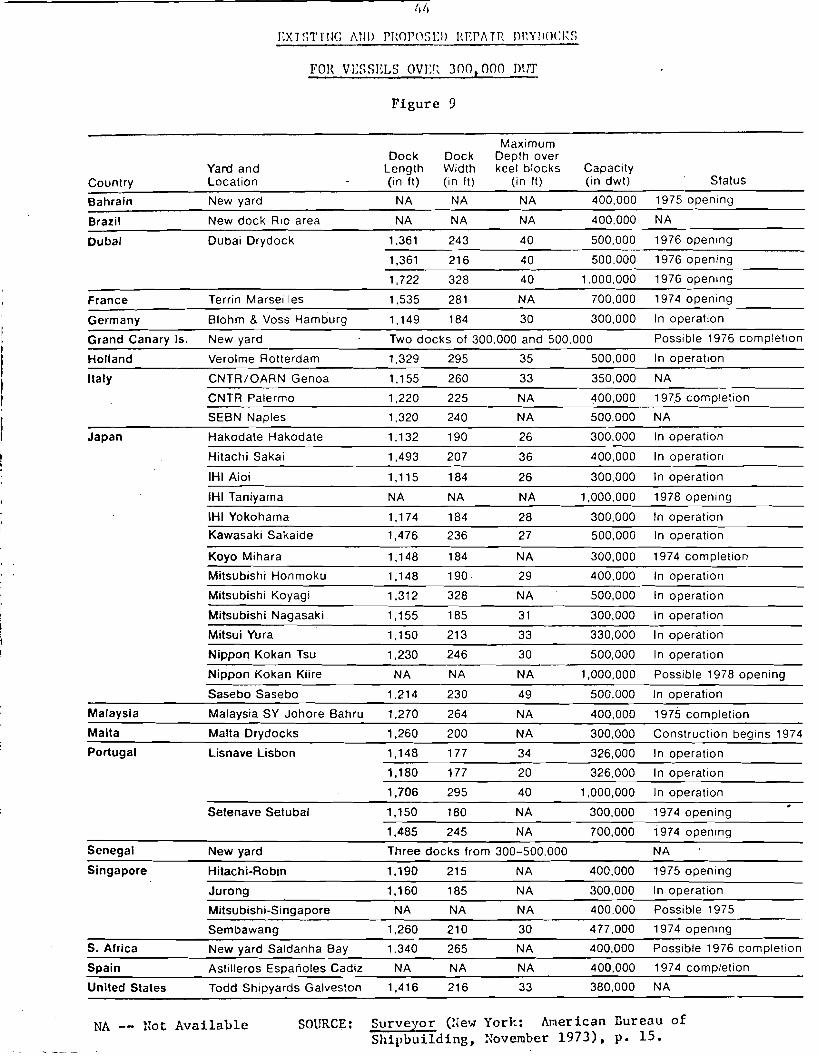
(See figure 9) JIUnfortunately, the capacity of U. S. private ship repair yards to dry
dock VLCC's/ULCC's is presently limited. No commercial facilities are
available on the East Coast, though a drydock capable of lifting 120,000
lSurveyor (HeH York: American Bureau of Shipping, November 1973),p. 8.
EXISTIHG !\i1D rltOPO~)ElJ HErA Tn nnYll()CIZ~;
FOR VESSELS OVEl~ JOO,OOO mIT
Figure 9
Country
Bahrain
Brazil
Dubal
France
Germany
Grand Canary Is.
Holland
Italy
Japan
Malaysia
Malta
Portugal
Senegal
Yard andLocation
New yard
New dock RIo area
Dubai Drydock
Terrin Marseilles
Blohm & Voss Hamburg
New yard
Verolme Rotterdam
CNTR/OARN Genoa
CNTR Palermo
SEBN Naples
Hakodate Hakodate
Hitachi Sakai
IHI Aioi
IHI Taniyama
IHI Yokohama
Kawasaki Sakaide
Koyo Mihara
Mitsubishi Honmoku
Mitsubishi Koyagi
Mitsubishi Nagasaki
Mitsui Yura
Nippon Kokan Tsu
Nippon Kokan Kiire
Sasebo Sasebo
Malaysia SY Johore Bahru
Malta Drydocks
Lisnave Lisbon
Setenave Setubal
New yard
MaximumDock Dock Depth over
Length Width keel blocks Capacity(in It) (in It) (in It) (in dwt)
NA NA NA 400,000
NA NA NA 400,000
1,361 243 40 500,000
1,361 216 40 500,000
1,722 328 40 1.000,000
1,535 281 NA 700,000
1,149 184 30 300,000
Two docks of 300.000 and 500.000
1,329 295 35 500.000
1,155 260 33 350,000
1,220 225 NA 400,000
1,320 240 NA 500.000
1,132 190 26 300,000
1,493 207 36 400,000
1,115 184 26 300,000
NA NA NA 1,000,000
1,174 184 28 300,000
1,476 236 27 500,000
1,148 184 NA 300,000
1.148 190 29 400,000
1.312 328 NA 500,000
1,155 185 31 300,000
1,150 213 33 330,000
1.230 246 30 500,000
NA NA NA 1,000,000
1.214 230 49 500,000
1,270 264 NA 400,000
1,260 200 NA 300,000
1,148 177 34 326,000
1,180 177 20 326,000
1,706 295 40 1,000,000
1,150 180 NA 300,000
1,485 245 NA 700,000
Three docks from 300-500,000
Status
1975 opening
NA
1976 opening
1976 opening
1976 opening
1974 opening
In operation
Possible 1976 completion
In operation
NA
1975 completion
NA
In operation
In operation
In operation
1978 opening
In operation
In operation
1974 completion
In operation
In operation
In operation
In operation
In operation
Possible 1978 opening
In operation
1975 completion
Construction begins 1974
In operation
In operation
In operation
1974 opening
i 974 opening
NA
Singapore
S. Africa
Spain
United States
Hitachi-Robin
Jurong
Mitsubishi-Singapore
Sembawang
New yard Saldanha Bay
Astilleros Esparioles Cadiz
Todd Shipyards Galveston
1,190
1,160
NA
1,260
1,340
NA
1,416
215
185
NA
210
265
NA
216
NA
NA
NA
30
NA
NA
33
400,000
300,000
400,000
477,000
400,000
400,000
380,000
1975 opening
In operation
Possible 1975
1974 opening
Possible 1976 completion
1974 completion
NA
NA -- Not Available SOURCE: Surveyor (rie'" York: American Bur eau ofShipbuilding, ~ovember 1973), p. 15.
\1
45
'I
1 _
II
DWT tankers is contemplated at Baltimore. ~~rylDnd. None are available on
the Gulf Coast. thour,h a repair dock. designed to handle VLCC's up to a
maximum of 380.000 DWT is planned at Galveston. Texas. On the West Coast
most tankers up to 150.000 D~IT and some as large as 230,000 DtIT can now be
1drydocked at San Francisco, California.
Advances in shipbuilding technology are only as valuable as comparable
gains in repair yard and drydocking facilities. illlile the revenue for an
active VLCC/ULCC can be considerable, so can its losses Hhen it is tied up
waiting for maintenance or repairs. OHners and operators want to be sure
that suitable drydocking and repair facilities Hill be available, when
required, for the supertankers they may contemplate ordering.
The U. S. shipbuilding industry has developed the capabilities to
build VLCC' sand ULCC' s , IJo\.,1 the ship repair industry must make its own
contribution to the development and operation of the new supertankers.
\-lith the increasing size of tankers and the prospect of U. S. offshore
terminals, it would be illogical if the ship repair facilities of the
United States, recognizing the economic implications, did not keep abreast
of these trends.
1Edwf.n N. Hood, Statement before Committee on Herchant Har Lne and
Fisheries, House of Representatives, 11 July 1973.
======---.-_._--:~.========
Eftective U. S. Control (EUSC) Ships
No discussion of the U, S. merchant marine ..zou Ld he complete wLthou t
mention of the "effective U. S. con t r o l," (EUSC) ships.
A major and unresolved controversy centers about whether it would be
possible to use, at least for oil imports, the group of ships often re-
ferred to as effective U. S. control vessels -- ships registered under
foreign flags by U. S. owners who have agreed to make the vessels avail-
able during times of emergency. The EUSC fleet exists because, in return
L=
for a modest registration fee, the vessel owner is virtually free from ,IU. S. taxation on ship's earnings and from government re~ulations con-
cerning operations, inspections, and crew-manning. EUSC shipping is also
often referred to as "flags of conven Lenc e'", but U. S. owner s of ships
under foreign registries prefer the term "flags of necessity."
Many traditional maritime nations -- the United States a notable
exception -- have domestic Laws that forbid their nationals to own and
operate ships under foreign registry. Under U. S. tax Laxrs , ship owner-s
do not have to pay taxes on earnings from foreign shipping subsidiaries
unless or until paid as dividends. This is an exception to the normal
treatment of a sales or service subsidiary and a major reason \-Jhy large
oil companies have found EUSC arrangements attractive.
The number of U. S. owned tankers under Liberian or Panamanian flags
is already significant, but the post \-Jar trend of the U. S. oil and rn~tals
industries to identify thenselves as multi-nationals or international
46
Ii11
47
companies has created a further development \Jhcrein U. S. owned vessels
are registered under the fl<lf,H of other traditionally maritime nations
and operate -- technically. at least. -- in the service of foreign sub
1sidiarics of American corporations.
The EUSC tanker fleet currently consists of 18 million DWT. and. withl
some 20 million DIIT under construction or on order. it is generally recog-
nized that these U. S. owned foreign flag ships have to be considered as
2a substantial mohilization planninr, factor.
The EUSC Itdoctrine of effective control lt is based upon contracts and
agreements between the U. S. gove.rnmen t and owner s of flag-of-convenience
vessels. The Itlegal" basis for such contracts or agreements is derived
solely from domestic law of the United States; specifically. Section 902
of the Herchant :tarine Act of 1936. vhich gives the government authority
to requisition or purchase for government service any vessels owned by
citizens of the United States. Requisitioning is permitted only in the
event of a national em~rgency proclaimed by the President.
Unanswered, and untested. however. is the question ",hether the Unite
States does, in fact. have the "right" to requisition and take control of
vessels owned by U. S. citizens but registered under foreign flags.
lSubsidies -- Sea Power.
2Report of the Commission on American Shipbuilding(Washington. D. C.: Government Printing Office, Octoher 1973).
.- _._-
There are also other factors to consider. The effective H. S. con-
trolled fleet has been dedicated by the maj or oil companies mostly to
supplying Europe and Japan. This in part is due to the size of the vcsselz
\/hich are too large to call at U. S. ports. This established trade pattern
whfch commits that fleet may not be disrupted easily without serious eco-
nomic and political repercussions should the U. S. attempt to requisition
the fleet in a transportation crisis. Further, any witl~rRwa1 of tankers
from Europe could have an adverse impact on the petroleum supplies vhLch
would support military and civilian needs of the European countries of the
1;1ATO Alliance.
The extent of this dedication can be most readily understood by con-
sidering that the Euse fleet carried only 20 percent of U. S. oil imports
f
Therefore, more than Iexclusive I
I
In addition to the U. S. oil imports carried by the EUSe fleet,
U. S. flag tonnage accounted for another 4 percent.
three-quarters of U. S. oil imports were carried by foreign ships
in 1971.
2of the EUSC fleet.
The security implications of reliance on EUSC and other foreign flag
ships are a particular concern to the U. S. Navy. Admiral E. R. ZumwaI t ,
Jr., Chief of Naval Operations, phrased the problem this way ;
lRobert J. B'l.ac kweLl , "Statement on EUSe Vessels," The Oceansand National Economic Development (Hashington, D. C.: GovernmentPrinting Office, December 197J), p. 254.
2Report of the Commission on Alnericnn Shipbuilding (Washington,D. C.: Government Printing Office, October, 1973).
The potential for coercion, v Lt h or wLt hout all Les ,• • • is ominous • • • Plnnninr, for the protectionof tankers _'t s c.; !.:~ th,-, event a threat d eveLopswou l d he g r ea t Ly enhanced by hav i ng Lar ge numbersof ships under the lJ. S. flag in time of pence.The Navy has a ~rf'ater requirement for merchantships than is eeneral1y recognized. For example,merchant sh Ip s a r e ab so l.u t c Iy required to providethe bulk of the DOD sealift and to augment ouramphibious forces. 1
To further emphas Lze the concern of Admiral Zumwa l t , it is evident
that \,fith risine Defense costs and constrained budgets, the U. S. combat
Navy has been forced to drastically reduce its number of active ships --
thus, with the compelling need to concentrate on improving its diminished
combat fleet, the Navy is nOH turning mo r e to the U. S. merchant marine 'I
for an increasing proportion of its logistic support. 2 To improve the
ability to perform these military support roles, U. S. f Ja g ships are built
with national defense features which increase their utility for military
cmplo)~ent and their self-defense capability. This includes such features
as extra speed, self-unloading capabilities, and strengthened decks.
In concluding, the following points should be considered when evalu-
ating the use of U. S. flag vessels versus EUSC and other foreign flag
} . 3sups:
lSee Subsidies -- Sea Power.
2p..ADM George H. Hiller, USN (Ret.), Remarks before The PropellerClub of Charleston, South Carolina, 21 November 1973.
3Subsidies -- Sea Power.
.'.
50
Indispntnble control of foreign-registered anelforeign-manned ships cannot be Bssured.
The changing profile of the EUSC fleet t .rLthemphasis on very Large and s pec Lnl.Lzed 011 andbulk cnrriers, does not include a sufficientinventor.y of "clean" tankers to carry the exoticaviation, vehicle, and ship fuels used by U. S.military forces.
Lack of national defense features in foreignbuilt ships denigrates the military potentialof the EUSC fleet.
Foreign cr ews might be umTilling to man EUSCships during wartime operations.
In the event of war in whi ch the flag of registryis not a participant, the alien n<lture of the shipand crew precludes immediate deployment to I;upportmilitary oper.ations even if strategically located.Such deplo)'l:lent is possible only when the ship becomes a belligerent, i.e., comes under U. S. orallied registry.
The disruption of EUSC fleet foreign tradepatterns might cause serious economic andpolitical repercussions for allied and nonaligned nations.
One fact is clear: the doctrine of "effective U. S. control" is an
untested concept. The changing military, political and economic orientation
of tooay's world requires, at the very least, a reevaluation of the EUSC
concept.
Ii
The Economic Ir,lpact
The f or ego Lng examples of the marine transportation system and rE'.-
lated industries, while cursory and incomplete, are sUBeestive of a
number of points:
That while the United States has been up to nowa leader in the development of marine commercialtechnolo~y, the net effect has heen primarily ~ne
of export of this technolo~y to other nations.
Tha t a failure to ImpLemerrt this technology underthe U. S. flag. and an exploitation of this technology by other nations, has \-larked to the cor.J.mercial detriment of the United States merchantmarine.
That a suhstantial total economy can be developedyhich is purely marine-oriented.
That the solution of a numher of coastal zone related problems may be inherent In such development.
Certainly many nations have moved extensively to the sea and the
coastal zone for bene f Lt of the economy , Fi~ure (10) bea r s out this
relationship. Belgium/Luxembourg, utilizing the deepwater harbor of
I Antwerp Imve nearly 50 percent of their gross national product involved
in export whLLe the ~:etherlands, \odtll its "Europort" at Rotterdam, has
nearly 40 percent of its gross national product so involved. As "ga t eway"
countries, this proportion is quite understandable.
1U. S. marine technology ,,,~dch has been exploited ahroadincludes the containership concept, barze-carrying ships, gasturbines, steam turbines and boilers, automation, modular construction and merchant ship nuclear propulsion. (See CongressionalRecord (February 1, 1973), pp. E588-539.)
i ij ij io ' .- ..... "1£«4 .-,.,..·Y<'a '.i!""Y<.l' ""''-A/ltd 'i'··';g£<u "~"4{'{' '-'_"M'!_ '±t'!...{~
10
co
IA 30
j~1S 20
SOURCE: U. S., Department of the Ar~y, Corps of Engineers, Institute for Water Resour~es.
Forei~n Deep Hater Port Developments, vo I , I. p. 4-2, (December 1971).
I'
53
Hore surprising is Japan. It is weLl, known t ha t Japan imports nearly
all of her raw materials and that her export/import balance is favorable.
~everthe1ess, her exports constitute only 10 percent of ller gross national
Iproduct. In addition, as shown in f Lgur e (11), her gross national product I
has for the past decade been linearly related to her exports. This cor- I
relation by itself woul.d not he significant except that its causality seems:
I'Ijustified since it has been the conscious effort and expectati.on of Japanes~
economists and Japanese government and industry that this \lould result froJ!
the economics of oc eanLc scale in their basic industries. 1 They recognize I
that efficiency in har dwar e production has its benefit in the release of I!
manpower and resources for sof tware productivity. The total is reflected
The disproportionate percentage in
in the make-up of the gross na t Lona L product and in its growth rate. I
dicti::t:::te:::::a::n:nt:f:::::n:C::r:::_::::~C::::5::;5::e:::5:nn::::n01 II
product, one cannot refrain from comrnent Lng on some obvious characteristics,1
Ii
of which table (2) is demonstrative.
utilities and commercial activity and government is such that the European
market \-lith only one half the total gross na.tional product of the United
States has two thirds as much manufacturing, a nearly equal volume of
construction, and a slightly larger volume (dollar value) in agriculture.
Recognizing the distortions that price and efficiency play in equating
these factors it must be concluded that here is a substantial difference
in the hardware versus software and services mix of the two societies.
l U• S., Department of the Army, Corps of Engineers, Institutefor Hater Resources, Foreign Deep Hater Port Devclopment~, vo l., 3,(Springfield, Virginia: National Technical Information Service,December 1971).
54
1500 r-----------------------_---------
iiieot-oo-o'"c.2
~cuE~
"0>8.~
1200
1000
800
500
300
19631962
•1961.
60 80 100 120 140IMM (Index)
160 180 200
fIGURE 11 PORT CARGO VOLUME VERSUS GNP AND THEINDEX OF MINING AND MANUFACTURING
JAPNJ
SOURCE: U. S., Department of the Army, Corps of Engineers,Institute for Water Resources, Foreign Deep Water PortDevelopments, voL 3, p , G-10, (December 1971).
,
!TABLE 2
NATIONAL GROSS DOHESTIC PRODUCT STRUCTURE -- 1969
France Belgium Netherlands Germany Italy U. K. U. S. A.
SOURCE; Arthur D. Little, Inc , , Orr,anization for Economic Cooperation and Devel opmcnt , I
II
56
RccognLz Lng further that the consumption of eneq~y and mat er Lal.s
cannot be met \.,rithout exogenous import wlrLch must in turn he paid for
by export of goods and services, then it is suggestive that our ability
to meet and expand our needs is a function not only of our nntional
ability to produce foods for export, but is also a function of the
relative efficiency and price at which these goods are produced. This
relative efficiency may in turn be related to the economies achieved
through the scale of marine industry.
The construction and expansion of the deepwater ports, primarily
for oil handling and storage and unitized cargo, at Rotterdam, AntHerp,
Amsterdam, LeHavre and Dunkirk attest to the idea that this conclusion
1has been reached by the European conmunLty , It is certainly the con-
c1usion of the Japanese.
I}Iarine Engineerin£{Loa (New York: Simmons Boardman PublishingCorporation, June 1973), pp. 153-226.
I'
Summary
Ii'\!
Even though this paper has employed a broad perspective, there
appears to be enough evidence to sugbest that \1e examine as a nation
the effect of sea-based commerce and industry on the total economy
1and the substance of the total economy. Certainly it has been the
clear policy of the Admini.stration to support and encourage such growth.
Yet this policy has been relatively frustrated by factors whLch have not
yet been brought into proper perspective. Although all tIle causes for
the failure of our marine transportation system to flourish on a world
scale are not yet fully understood, several factors can be cited as
contributory:
lIarine transportation systems do not operatein a free and conpet Lt Lvc situation in tileworld mark~t. P.estrictive carriage and cargopreference, as well as other national policiesHhich have historically been exercised by themore successful maritime nations, precludeU. S. flag competition for wor Ld cargo. ~1ore
and more countries, by some form of preferencesystem, ~re reserving cargo for their merchantmarines. Among the leading nations of today,
1The Second Annual Report (June 1973) of the National Advisory
Committee on Oceans and Atmosphere states (p. 5):liThe decline of the t;. S. merchant marine and our groHingdependence on foreign bottoms for shippinS, long deploredfrom the vi~~oint of national security, deserves also tobe looked at from the point of view of the impact on ourplace in the wo r Ld ec onomy ;"
2Report of the Commission on American Shipbui1dini:; (lJashington,D. C.: Government Printing Office, October 1973).
57
c. :
HerchantGovern-
58
Russia carries at least 50 percent of herforeign trade in her own flap,ship~; Japancarries 46.6 percent; France, 38.3 percent;Great Britian, 35 percent; Italy, 23.1 perrn~t;
Sweden, 22.3 percent; and the United States,without preference support, carries, by comparison, 5.6 percent of its foreign trade. l
Competing attitudes by various Pederal agenciesconcerning our domestic needs and foreign interests have tended to promote foreign marinetransport systems at the expense of our mID.The Cargo Preference Act of 1954 generally requires that at least 50 percent of governmentgenerated cargos be shipped on U. S. flagvessels. Unfortunately, while the ~~ritiMe
Administration is attempting to promote U. S.flag carriage, other agencies (such as Department of Agriculture, Agency for InternationalDevelopment, Inter-American Development Bank,etc.) have administratively interpreted the 50percent ~riteria as a maximum rather than aminimum. Horeover, cargo preference has notbeen effectively employed as a "policy" toolto stimulate domestic shipping.
Foreign affiliates of U. S. corporations usetheir foreign registered fleets to supporttheir oceanborne transportation needs. Therefore, a significant amount of wor Ld cargo,particularly energy fuels, is effectivelyremoved _from the competitive marketplace.The vested interests of the multi-nationalcorporations serve to inhibit the participation, and indeed the size, of the U. S.flag fleet in U. S. oceanborne commerce.
Restrictive, and conflicting, regulatorystatutes of Federal regulatory agencies(Federal MaritiQc Commission and Interstate Commerce Conmission) have inhibitedthe optimized movement of unitized cargos.
lRAD~1 George H. Miller, USN (Ret.), Remarks before The PropellerClub of Charleston, South Carolina, 21 November 1973.
2s ee U. S., Congress, House, Report of the Activities of theHarine and Fisheries Commi.ttee, 92d Corigr es s O-lashington, D. C.:ment Printing Office, 1972), pp. 33-34; Sea Power (Hashington, D.llavy League of the U. S., September 1973), pp. 16-17.
-I .--
S9
The benefits of industry-wide cooperation instandardization, research, and the exchanp.eof engineering and teclmicnl information aresignificant in other countries, particularlyJapan. Similar benefits are largely deniedto U. S. shipbuilders because of the possibility of antitrust action by the Government.
The environmental protective efforts have tendedto create a negative attitude inhibiting ourmaritime advancement. These efforts have failedto recognize that our gr owi.ng dependency uponforeign flags coupled with our increasing oceanborne traffic do not provide the environmentalcontrol inherent in U. S. carriage. The concernexpressed h;;!re relates to ship safety and environmentally designed and constructed transportsystems, including offshore terminals and offshore oil development.
In summary, the revitalization of our marine transportation system
is imperative wIlen measured in terms of the benefits to be derived by
our economic, political and military needs.
It is obvious that there are both competing and complementary
activities at wor k in the overall marine transportation system. It
is equally obvious that these many activities have not yet been ade-
quately defined or articulated, either quantitatively or qualitatively.
Also, it must be recognized that the U. S. as a mature technological
society, enjoying the highest standard of living in the world, has an
initial competitive disadvantage, vis-a-vis other nations. As is the
case with many other sectors of the economy, the marine transportation
sector has a higher operating cost than similar systems of otller nations.
But this disadvantage can be substantially reduced, if not altogether
removed, with increased maritime productivity -- and the U. S. maritime
industry possesses the requisite entrepreneuial and technological acumen.
60
However, this brings us full circle, for to increase productivity to agree
with operating costs and market requirements and competition requires an
If this market is to be realized,
Central to this policy is the resolution of the concerns
it must be, ss in other countries, the result of a sustained and positive ~
New ship type designations now in common use include:
ULCC and VLCC Ultra Large Crude Carriers (400,000 mIT and larger)and Very Large Crude Carriers (200,000 to 400,000mlT) • These liquid buLk supertankers provide veryeconomic transportation. Special areas of concerninclude the need for expensive port facilities, en- Ivironmental precautions and efficient management oflthe vehicle and its Lnt er Loc kcd distribution andprocessing system.
OBO
CUNTAIHER
LNG
Ore/Bulk/Ore, a versatile carrier of moderate size(about 100,000 g r os s tons), that can be rapidlyconverted to any liquid or dry bulk cargo. Theiroperations and routes are highly flexible and re- Iquire efficient schedulinp, and management. ,These ships carry large interlocked boxes (containe~s)
of pre-packaged cargo. Container ships are the ilmodern, fast packets, demanding rigid scheduling an~
high utilization. Port facilities are complex and IIexpensive. Loads vary from 300 to 1,000 containers Iiper ship with speeds typically 25 knots and on up t~
the middle 30' s , "
Liquified Natural Gas. These ships are the newest Itype, designed to transport natural gas in a super-Icooled liquid form. Costs of these ships may ap- Iproach 100 million dollars. They have all the Iaspects of liquid petroleum carriers (pollution I
potential, scheduling, port facilities) plus ITlanyspecialized needs of their own ,
LASH (or SEABEE) Lighter Aboard Ship Systems. (LASH is PrudentialLines' design; SEABEE is Lykes' entry.) Lighters(barges) are carried aboard these ships, beingloaded and unloaded by onboard elevators. Tugboatshandle the lJarges and deliver them to the destination user. Like containers, they are pre-packed.Ships have very high productive utilization (short Iin port or cargo handlin8 periods) and do not re- Iquire specialized port facilities. The USH system Iemploys barges of about 400 gross ton capacity II
viier eas t he SEABEE system uses barges of about; 750ton capacity (one half the size of standard riverbarges) •
61
APPENDIX
11
RO/RO
III
62
Roll-on/Roll-off. Truck trailers are driven on andoff ship. In this specialized form of container IR~~"fce. the cnr-go is pre-pncked and can be directl".delivered or picked up hy truck or hy train/truckcombination5. Scheduling is important and 50mespecialized port facilities are needed.
Arthur D. Little, Inc. Organization for Economic Cooperationand Development.
Baker, Charles D. "Water Transportation and National Policy -A Study in Success and Failure." Proceedings of the ~furine
Technology Society, September 1973, pp. 579-585.
Barker, James R. and Brandwein, Robert. The United States Herchant~1arine in r~ational Perspective. Lexington, tlass.: HeathLexington Books, 1970.
Big Load Afloat. Washington, D. C.: American Waterways Operators,1973.
Blackwell, Robert J. "Statement on EUSC Vessels."National Economic Development. Washington, D.Printing Office, December 1973.
The Oceans andC.: Government
Bureau of National Affairs, Inc. Environmental Reporter.Washington, D. C.: Bureau of National Affairs, Inc.,May 1973, p. 19.
Congressional Record. February 1, 1973, pp. E588-589.
Craven, John P. "Offshore Platforms and Superports: TechnicalConsiderations." The Oceans and National Economic Development.Washington, D. C.: Government Printing Office, December 1973,pp. 230-232.
Creedy, J. A. "The Potential of Our Inland Waterway." Proceedingsof the Marine Technology Society, September 1973, pp. 401-408.
Frankel, B. "Offshore Tanker Terminals: Study in Depth."Proceeding, U. S. Naval Institute, vol. 99, no. 3/841,}1arch 1973.
Gray, Duncan C. "Sources of Funds Required." Planning for OffshorePorts. Washington, D. C.: Marine Technology Society, 1974.
Holubot-1icz, R. P. "The Challenge Facing the Ocean Shipping Industry."~furitime Reporter/Engineering News, May 15, 1972, pp. 19-21.
Hood, Edwin M. Statement before Committee on Herchant Harine andFisheries, House of Representatives, 11 July 1973.
===~~========================#====--63
'I
\
64 -- -r::=======*=========================tt===
Hood. Edwin M. Speech delivered before The Propeller Club ofNewport News. Virginia. 12 December 1973.
Kasputys , J. and Young. J. B. "Subsidies. Seed honey , anaNational Security." Sea Power. September 1973. pp. 23-30.
Lucas. H. A. "Narine Mass Transit for HawaI L, A Case Study."Proceedtngs of the Marine Technology Society. September1973. pp. 377-383.
Hanning. Larry C. "Atoms at Sea." Sealift. Washington. D. C.:Military Sealift Command. January 1974.
Marcus. Henry S. "The Need to Redefine the Objectives of theU. S. Maritime Subsidy Program." Proceedings of the HarineTechnology Society. September 1973. pp. 565-577.
Narine Engineering/Log. New York: Simmons Boardman PublishingCorporation. April 1973.
~~rine Engineering/Lo~. New York: Simmons Boardman PublishingCorporation. June 1973.
Marine Engineering/Log. New York: Simmons Boardman PublishingCorporation. October 1973.
l1arine En&ineerinp,/Log. New York: Simmons Boardman PublishingCorporation. February 1974.
Maritime. Washington, D. C.: AFL-CIO }~ritime Trades Department.Spring 1972.
Hiller. RADM George H•• USN (Ret.). Remarks before The PropellerClub of Charleston. South Carolina. 21 November 1973.
National Academy of Engineering. }furine Board. Toward Fulfillmentof a National Ocean Commitment. Washington. D. C.: NationalAcademy of Engineering. 1972.
The Ocean Engineering Program of the U. S. Na~. Washington. D. C.:Office of the Oceanographer of the Navy. l'~rch 1973.
Ocean Industrl' Houston. Texas: The Gulf Publishing Company.August 1972.
"A Quick Turnabout on Hauling Grain." Business Week.September 8. 1973. p. 24.
Schreuder. G. and Stifter. C. Sea Island Project. N.V. Holland:Bos Kalis Westminster Dredging Group. ~~rch 1972.
Shultz, William M.Hass Transit."September 1973,
65
Sea Power. Washington, D. C.: Navy League of the United States,September 1973.
Shipbuilders Councii of Aw~(ica. Annual Report. Washington, D. C.:Shipbuilders Council of America, 1972.
Shipyard '~eekly. Washington, D. C.: Shipbuilders Council of America,8 November 1973.
"Status of Domestic High-Speed Harine Vehicles forProceedings of the }~rine Technology Society,pp. 409-419.
Surveyor. New York: American Bureau of Shipping, November 1973.
Talkington, H. R. t1Transfer of Navy Platform Technology to Solutionof Societal Problems." Journal of the ~~rine Technology Society,January - February 1973, pp. 56-60.
U. S. Commission on American Shipbuilding. Report of the Commissionon l\merican Shipbuilding. Washington, D. C.: Government PrintingOffice, October 1973.
U. S. Commission on Marine Science, Engineering and Resources. Industryand Techno~. Washington, D. C.: Government Printing Office,January 1969.
U. S. Commission on 11arine Science, Engineering and Resources. Ouri~at~on_anll the Sea. Hashington, D. C.: Government PrintingOffice, January 1969.
U. S. Congress. House. Report of the Activities of the ~lerchant
Marine and Fisheries Committee, 92d Con~ress. Washington,D. C.: Government Printing Office. 1972.
U. S. Council on Environmental Quality. Energy and the Environment.Washington, D.C.: Government Printing Office, August 1973.
U. S. Council on Environmental Quality. Environmental QualityThe Fourth Annual Report of the Council on EnvironmentalQuality. Washington, D. C.: Government Printing Office,1973.
u. S. Department of the Army. Corps of Engineers. Institute forWater Resources. Foreign Deep '~ater Port Development. 3 vols.Springfield, Virginia: National Technical Information Service,December 1971.
III
I
III
u. S. Department of Commerce.of Deepwater Terminals.Office, 1972.
Maritime Administration. The EconomicsWashington, D. C.: Government Printing
}i
11
U. S. Depar tmeut 'of Commerce. tlaritimein American Shipping. Washington,Office, 1972.
Admini=~:~-.--A-=:==~=t=-·_---D. c.: Government Printing
u. S. Department of Commerce. Haritime Administration. Tabulation:"Pending Construction Differential Subsidy Application." 1973.
U. S. Department of Commerce.~taritimeAdministration. Tabulation:"Shipbuilding Contracts Under lterchant !-tarine Act of 1970." 1973.
U. S. Department of Commerce. Haritime Administration. Office ofResearch and Development. Haritime Nuclear Propulsion Program.Washington, D. C.: Government Printing Office, September 1971.
U. S. Department of Commerce. Haritime Administration. Office ofResearch and Development. Offshore Terminal Development Project.Washington, D. C.: Government Printing Office, September 1971.
U. S. Department of Transportation. Urban Mass TransportationAdministration. Over-the-\-later Program Design, by R.Krzyczkowski. Report No , UHTA-en-RDC-8-7l-l, December 1971.
U. S. Federal Maritime Commission. Tenth Annual Report. \-lashington,D. C.: Government Printing Office, 1971.
U. S. National Advisory Committee on Oceans and Atmosphere. A Reportto the President and the Congress. \Jashington, D. C.:Government Printing Office, June 1972.
U. S. National Advisory Committee on Oceans and Atmosphere. SecondAnnual Report of the National Advisory Committee on Oceansand Atmosphere. Hashington, D. C.: Government Printing Office,June 1973.