The Persistence of Regional Entrepreneurship – Are all types of Self-Employment Equally Important?
Michael Fritsch & Michael Wyrwich
Friedrich Schiller University Jena, Germany
Chapter for Elizabeth Mack and Haifeng Qian (eds.): The Geography of Entrepreneurship. Abingdon: Routledge.
June 2015
Abstract
We explore the role of different types of self-employment for a persistence of the regional level of entrepreneurship over time. Our analysis for West German regions shows relatively strong effects for the historical self-employment rate in the non-agricultural sector, particularly in knowledge-intensive industries on current levels of new business formation. While self-employment by males shows a statistically significant relationship, the self-employment rate of females remains statistically insignificant. Also, no statistically significant effect can be found for the share of homeworkers that can be regarded a rather weak form of entrepreneurship. Keywords: Entrepreneurship, self-employment, new business formation,
Friedrich Schiller University Jena School of Economics and Business Administration Carl-Zeiss-Str. 3 D-07743 Germany [email protected]; [email protected]
Jena Economic Research Papers 2015 - 008
h5laan
Schreibmaschinentext
1
1. Introduction1
Empirical research on the persistence of regional entrepreneurship has
begun only recently.2 These analyses suggest that spatial differences in
the level of entrepreneurship are rather robust and long-lasting. In a recent
assessment of this phenomenon in Germany (Fritsch & Wyrwich, 2014),
we could show that there is persistence over the period from 1925 to 2005
despite several economic and political shocks such as the devastating
World War II, occupation by the Allied Forces and reconstruction of the
country. Moreover, the Eastern part of Germany was under a socialist
regime for forty years that made intensive attempts to extinguish private
sector economic initiative; after the socialist period, East Germany was
subject to a shock transformation into a market economic system (see
Fritsch et al., 2014, for a detailed analysis of the East German case).
Since these patterns can hardly be explained by a persistence of the
determinants of entrepreneurship, they may be regarded to indicate
different regional traditions or “cultures” of entrepreneurship.
In this contribution we investigate the role of different kinds of
historical self-employment in German regions on current levels of new
business formation. We find that not all categories of self-employment in
the year 1925 explain current regional levels of entrepreneurship equally
as well. While, for example, we find a relatively strong effect for self-
employment in non-agricultural private sector industries and in knowledge-
intensive industries on current entrepreneurship, this effect is rather small
or negligible for the self-employment rate that includes self-employed
farmers, for homeworkers producing on own accounts, as well as for self-
employed women. We derive hypotheses that may explain the diverging
importance of these types of self-employment for a persistent regional
entrepreneurship culture.
The remainder of this contribution is organized as follows. Section 2
provides an overview on recent work on the issue of persistence of
1 We are indebted to the editors for helpful comments on an earlier draft. 2 E.g. Fritsch & Mueller (2007), Andersson & Koster (2011), Fotopoulos (2014), Fritsch & Wyrwich (2014).
Jena Economic Research Papers 2015 - 008
2
regional entrepreneurship and sketches a basic mechanism that may
explain the persistence based on the level of self-employment. We then
derive hypotheses of why not all types of entrepreneurship may be equally
important for explaining the persistence phenomenon (Section 3) and
make the reader familiar with the data (Section 4). Section 5 presents the
results of the empirical analysis; the final section (Section 6) summarizes
the results and draws some conclusions.
2. Evidence on the persistence of regional entrepreneurship
A number of studies have found that the regional level of new business
formation tends to be rather constant over time (e.g. Fritsch & Mueller,
2014). One straightforward explanation for this pattern could be that
regional determinants of new business formation are only changing slightly
over time. Indeed, regional characteristics that are positively related to
entrepreneurship, such as the qualification of the regional workforce or the
employment share in small and young firms (e.g. Sutaria & Hicks 2004;
Fritsch & Falck, 2007; Wagner, 2004), tend to be relatively stable over
time periods of 10 to 20 years (Fotopoulos, 2014). Another explanation for
the pronounced persistence of regional entrepreneurship may be found in
different regional cultures (e.g. Andersson & Koster, 2011; Fritsch &
Wyrwich, 2014). Entrepreneurial culture may be particularly relevant for
explaining persistence of regional patterns in the case of Germany where
a considerable number of economic and political shocks took place over
the course of the 20th century (Fritsch & Wyrwich, 2014).
A number of different definitions of what an entrepreneurial culture
is can be found in the literature. It is, for example, described as a “positive
collective programming of the mind” (Beugelsdijk, 2007, 190) or an
“aggregate psychological trait” (Freytag & Thurik, 2007, 123) of the local
population. A further characteristic of regions with a well-developed
entrepreneurial culture could be that values such as individualism,
independence, and achievement (e.g. McClelland, 1961; Hofstede &
McCrae, 2008) are widespread among the inhabitants. A culture of
Jena Economic Research Papers 2015 - 008
3
entrepreneurship can be regarded as an informal institution that comprises
norms, values, and codes of conduct (Baumol, 1990; North, 1994).
Regions with a pronounced entrepreneurial culture should be
characterized by a high level of social acceptance or “legitimacy” of
entrepreneurship (Etzioni, 1987; Kibler et al., 2014). They should also
have a high share of persons with pronounced entrepreneurial personality
traits such as extraversion, openness to experience and
conscientiousness, as well as with a high ability to bear risk (Rauch &
Frese, 2007; Zhao & Seibert, 2006; Obschonka et al., 2013). A number of
studies provide evidence that a culture of entrepreneurship can vary
substantially across space within countries that have a uniform framework
of formal institutions.3
Given the observation that informal institutions only change very
slowly (North, 1994; Williamson, 2000), a culture of entrepreneurship
should be rather long-lasting. In contrast to the persistence of informal
institutions, formal institutions such as property rights, governance
structures and modes of resource allocation may change rather rapidly –
although they are embedded in the informal institutions.4 In a recent
investigation of entrepreneurship in Germany, we found compelling
evidence for the persistence of regional entrepreneurship over a period of
80 years from 1925 to 2005 (Fritsch & Wyrwich, 2014). Since this period
was characterized by a number of radical changes of the political-
economic environment, the persistence found cannot be caused by
stability of the determinants of entrepreneurship but may be regarded to
indicate the effect of an entrepreneurship culture.
The reasons for the persistence of a regional entrepreneurship
culture are still unclear. One possible explanation could be the presence of
entrepreneurial role models and the transmission of a positive
3 For example, Andersson (2012), Aoyama (2009), Beugelsdijk (2007), Davidsson (1995), Davidsson & Wiklund (1997), Etzioni (1987), Kibler, Kautonen & Fink (2014), Rentfrow, Gosling & Potter (2008), Westlund & Bolton (2003), Westlund & Adam (2010), and Westlund, Larsson & Olsson (2014). 4 East Germany is a good example of the differences between formal and informal institutions. With the reunification of Germany in 1990, the ready-made West German framework of formal institutions became effective practically overnight. However, more than two decades later a specific East German mentality can still be identified.
Jena Economic Research Papers 2015 - 008
4
entrepreneurial attitude in the regional population across generations
(Laspita et al., 2012). Entrepreneurial role models provide a non-pecuniary
externality that reduces ambiguity and influences the decision to pursue
an entrepreneurial career (Minniti, 2005). Furthermore, observing active
entrepreneurs, especially successful ones, may increase social
acceptance of entrepreneurship and self-confidence of people in regard to
their ability to successfully set up an own business (Stuart & Sorenson
2003; Bosma et al., 2012; Kibler et al., 2014). In this way, entrepreneurial
role models may establish and reinforce a regional culture of
entrepreneurship.
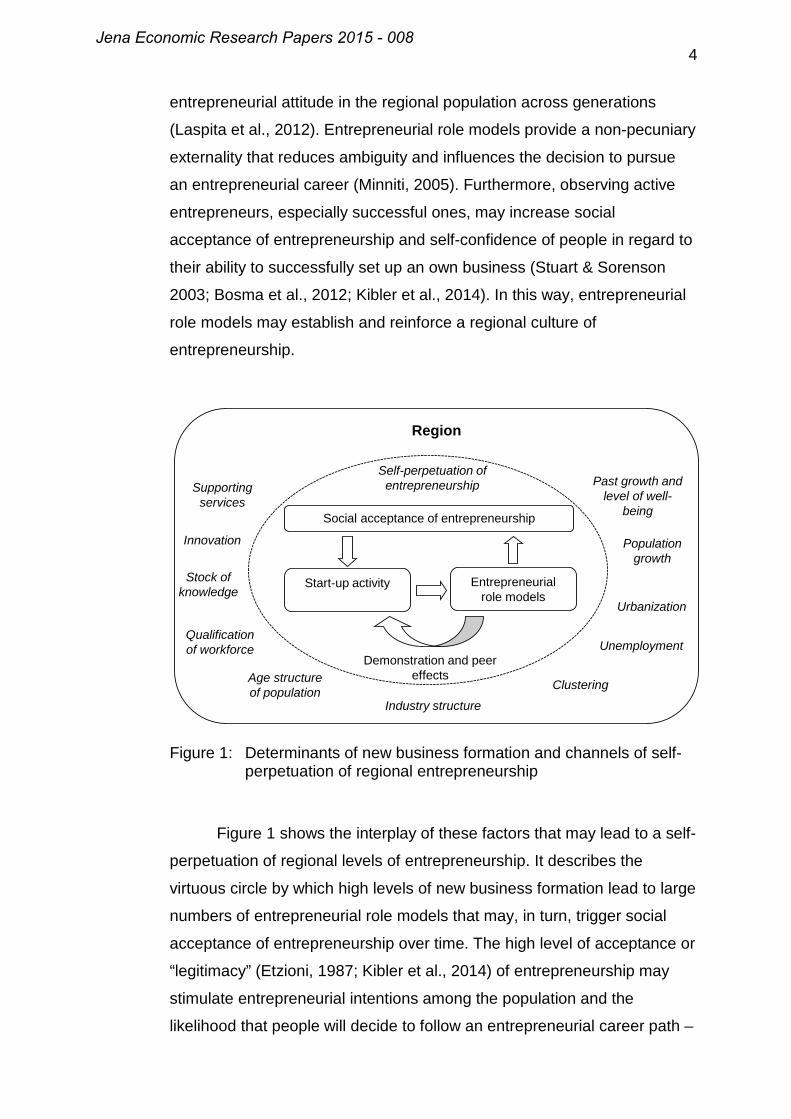
Figure 1: Determinants of new business formation and channels of self-perpetuation of regional entrepreneurship
Figure 1 shows the interplay of these factors that may lead to a self-
perpetuation of regional levels of entrepreneurship. It describes the
virtuous circle by which high levels of new business formation lead to large
numbers of entrepreneurial role models that may, in turn, trigger social
acceptance of entrepreneurship over time. The high level of acceptance or
“legitimacy” (Etzioni, 1987; Kibler et al., 2014) of entrepreneurship may
stimulate entrepreneurial intentions among the population and the
likelihood that people will decide to follow an entrepreneurial career path –
Social acceptance of entrepreneurship
Start-up activity Entrepreneurialrole models
Demonstration and peer effects
Self-perpetuation ofentrepreneurship
Region
Stock of knowledge
Urbanization
Industry structure
Population growth
Age structure of population
Unemployment
Clustering
Qualificationof workforce
Innovation
Past growth and level of well-
being
Supporting services
Jena Economic Research Papers 2015 - 008
5
again resulting in high start-up rates. Over time, the high levels of
entrepreneurial activity and the social acceptance of entrepreneurship can
also have an effect on the regional environment. A high demand for
finance and advice may, for example, induce the emergence of a
supporting infrastructure for entrepreneurship in fields such as finance and
consulting services for newly founded businesses. Moreover, because
most start-ups remain small, regions with high levels of new business
formation tend to have many small firms that that are well known for
functioning as a fruitful seedbed for start-ups (Parker, 2009).
3. Why should different forms of entrepreneurship matter for persistence?
While it appears plausible that historical rates of entrepreneurship indicate
the extent of a regional culture of entrepreneurship, there are a number of
arguments suggesting that not all types of entrepreneurship may represent
this entrepreneurship culture to the same degree. One may, for example,
claim that successful entrepreneurs whose ventures are opportunity based
are more likely to induce positive role model and peer effects in the sense
of “if they can do it, I can too” (Sorenson & Audia, 2000, 443) than
entrepreneurs who are in business mainly out of necessity. Furthermore,
self-employment in certain industries may be more significant for the
perpetuation of an entrepreneurial culture based on role models and social
acceptance of entrepreneurship than self-employment in other industries.
In order to throw more light on these issues we extend our earlier
analysis (Fritsch & Wyrwich, 2014) by distinguishing between different
forms of self-employment in the year 1925. One distinction is made
between general self-employment and self-employment in non-agricultural
private sector industries. The idea behind this categorization is that self-
employment in non-agricultural parts of the economy is related to
industrialization and economic development. It should therefore reflect
more positively perceived role models and should be more closely
associated with the generation of additional entrepreneurial opportunities
than general self-employment that includes entrepreneurship in agriculture
Jena Economic Research Papers 2015 - 008
6
and in semi-private industries.5 In a similar vein, entrepreneurship in
knowledge-intensive industries may particularly foster the prevalence of
positive entrepreneurial role models if entrepreneurial activities in these
industries spur regional development. Moreover, Entrepreneurship in
knowledge intensive industries may generate relatively large numbers of
further entrepreneurial opportunities. For these reasons we expect:
H1: Self-employment in non-agricultural private sector industries plays a more important role for the persistence of entrepreneurship than self-employment in general.
H2: Self-employment in knowledge-intensive industries plays a more important role for the persistence of entrepreneurship than in non-knowledge intensive industries.
There are two types of self-employment in our historical data that
can be assumed to include relatively large shares of necessity driven
entrepreneurship. These are self-employment by women and “domestic
self-employment” by home workers (Heimgewerbetreibende). The role of
women in the economic, political, and legal spheres of Imperial Germany,
(until 1918) and also in the Weimar Republic of the 1920s, was rather
marginal. The Code Civil that became effective in the 19th century is
especially revealing and stipulates that all important decisions within
marriage are made by the husband. Accordingly, women had the “legal
and economic status of social outsiders” (Schaser, 2008, 147). Women’s
legal position slowly improved in the 1920s, but nevertheless informal
gender roles were largely persistent. Accordingly, self-employment by
women did not reflect a socially well-accepted behavior around this time
and is quite likely to have been mainly driven by necessity. Becker (1937),
for instance, reports that many self-employed women in the 1920s were
widows whose husbands had died throughout World War I. Given that
self-employment by women reflects primarily necessity entrepreneurship,
5 In the semi-private industries it is not possible to clearly assign economic units to the private and the state based on the available historical dataset. One example is the sector “Transport and Communications” which comprises several private but also many public companies and employment. “Self-employed” in these industries can be true entrepreneurs but also managers of state-owned units.
Jena Economic Research Papers 2015 - 008
7
the prevalence of self-employed women in the early 20th century should be
only weakly or not at all related to persistence of entrepreneurship.
Another form of primarily necessity-driven entrepreneurship in a
historical perspective are self-employed home workers. This group
performed narrowly defined tasks at home for just one or for very few firms
and falls midway between an independent entrepreneur and a dependent
employee (Statistik des Deutschen Reichs, 1927, 11). In the
contemporaneous context, one can characterize this group as the
dependent self-employed (Roman et al., 2011). This pronounced
dependence is a distinguishing feature of home workers and reflects a
kind of necessity entrepreneurship. Accordingly, the prevalence of home
workers in the early 20th century should be only weakly or not at all related
to the persistence of entrepreneurship. Based on these considerations, the
following hypotheses regarding necessity driven entrepreneurship can be
formulated:
H3: The historical prevalence of self-employment by women plays a marginal role for persistence in entrepreneurship as compared to historical self-employment by men.
H4: The historical level of home working plays a marginal role for persistence in entrepreneurship as compared to historical non-domestic self-employment.
4. Data
Our empirical analysis is based on data on current start-up activity and
historical self-employment rates in German regions. The data on new
business formation are drawn from the Establishment History File of the
Institute of Employment Research (IAB, Nuremberg). This dataset
contains every establishment in Germany that employs at least one
person obliged to make social insurance contributions (Gruhl et al., 2012;
Hethey & Schmieder, 2010). Establishments without any employees, i.e.,
solo-self-employment ventures, are not included in this data. The currently
available information from the Establishment History Panel covers the
years 1975 to 2010 and includes identifying start-ups from 1976 onwards.
Information about the historical levels of entrepreneurship is taken from an
Jena Economic Research Papers 2015 - 008
8
extensive census of the year 1925 (Statistik des Deutschen Reichs, 1927).
This historical data includes detailed information on the number of
employees by gender, by 26 industries, as well as by “social status” at the
level of counties (kleinere Verwaltungsbezirke). The variable “social
status” distinguishes between blue collar workers, white collar employees,
self-employed, homeworkers, and helping family members.
Our indicator for current levels of entrepreneurship is the average
start-up rates for the time period of 1976 to 2010. We use three alternative
definitions of this rate. The first of these definitions is the number of newly
founded businesses over total employment in the region including
employees in the public sector. A second definition is the number of newly
founded businesses over the number of private sector employees. The
reason for using these two definitions is that the number of private sector
employees in the denominator may be influenced by a historically high
level of entrepreneurship which is to a lesser degree the case for total
employment. The third definition, the sector-adjusted start-up rate,
accounts for differences of the regional industry structures and respective
industry-specific entry conditions.6
Although the definition of administrative districts in the 1920s was
different from what is defined as a district today, it is nevertheless possible
to assign the historical districts to current planning regions which represent
functionally integrated spatial units comparable to labor market areas in
the United States. If a historical district is located in two or more current
planning regions, we assigned the employment to the respective planning
regions based on each region’s share of the geographical area. Thus, our
regression framework is based on the 70 planning regions of West
6 The sector-adjusted number of start-ups is defined as the number of new businesses in a region that would be expected if the composition of industries was identical across all regions. Thus, the measure adjusts the original data by making industry composition uniform across regions. The adjustment procedure is based on the regional distribution of 59 industries and follows a shift-share technique (Ashcroft et al., 1991 and the Appendix of Audretsch & Fritsch, 2002). We calculate the sector adjusted rates for every year of the 1976 to 2010 period and use the average values of these yearly rates.
Jena Economic Research Papers 2015 - 008
9
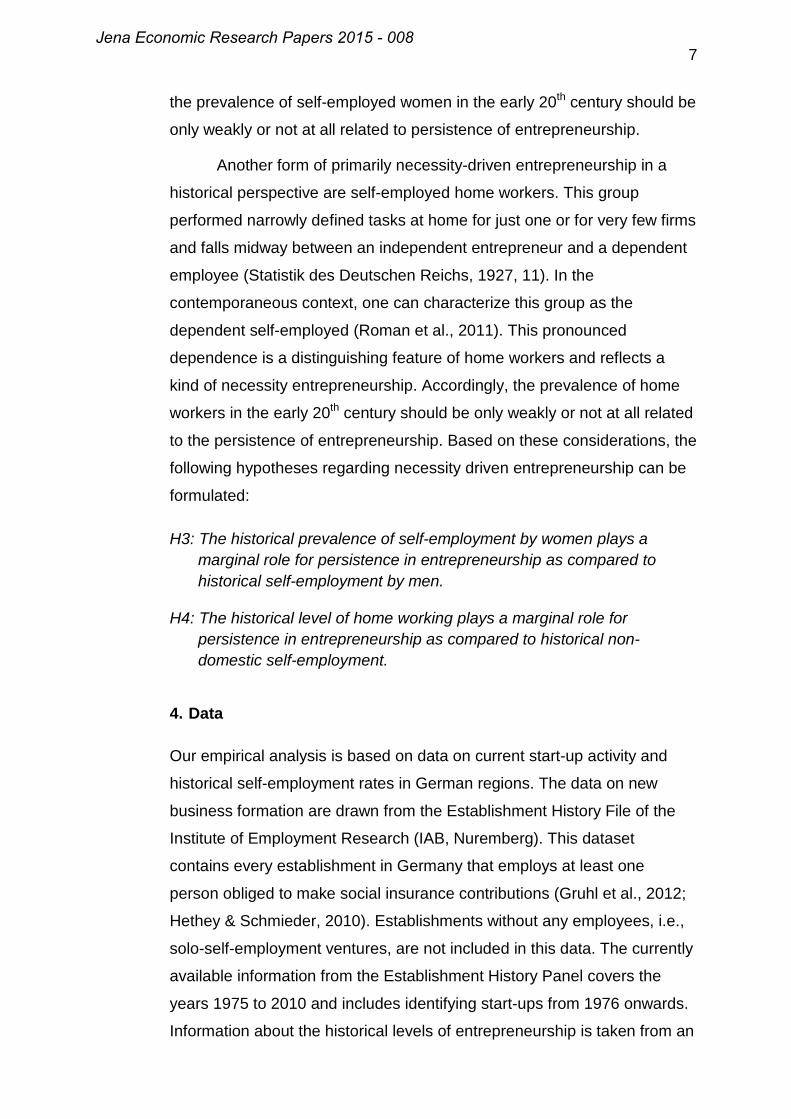
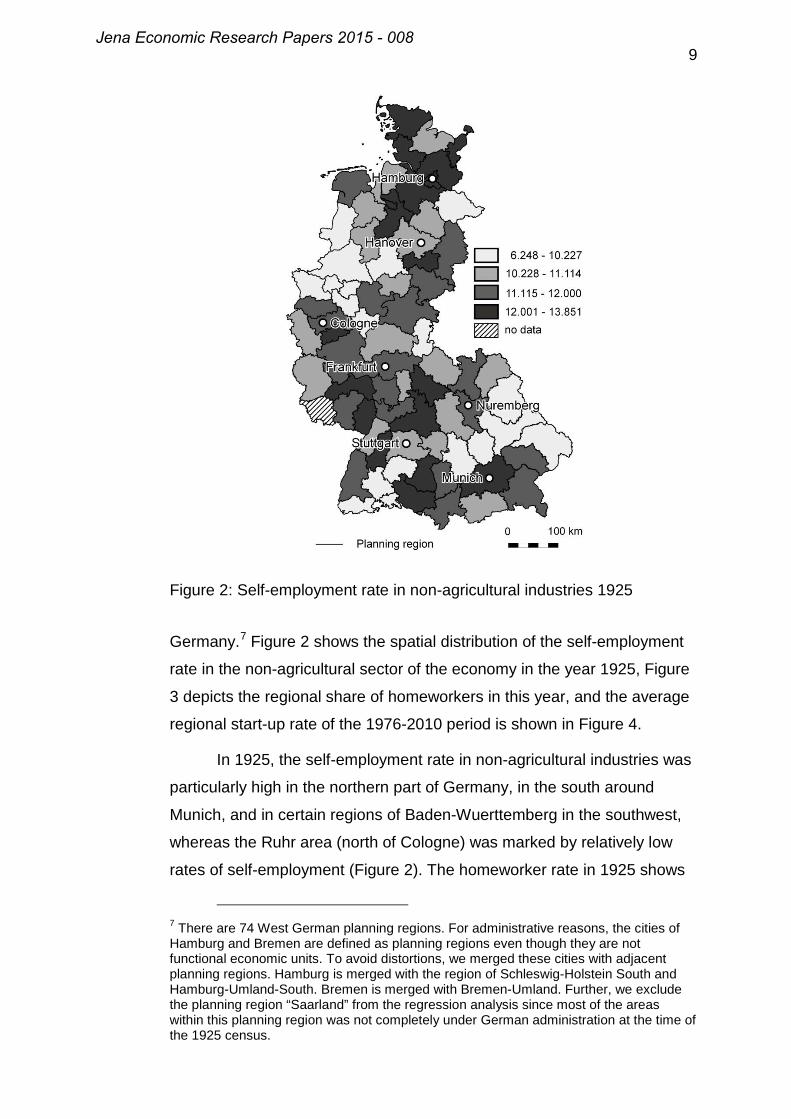
Figure 2: Self-employment rate in non-agricultural industries 1925
Germany.7 Figure 2 shows the spatial distribution of the self-employment
rate in the non-agricultural sector of the economy in the year 1925, Figure
3 depicts the regional share of homeworkers in this year, and the average
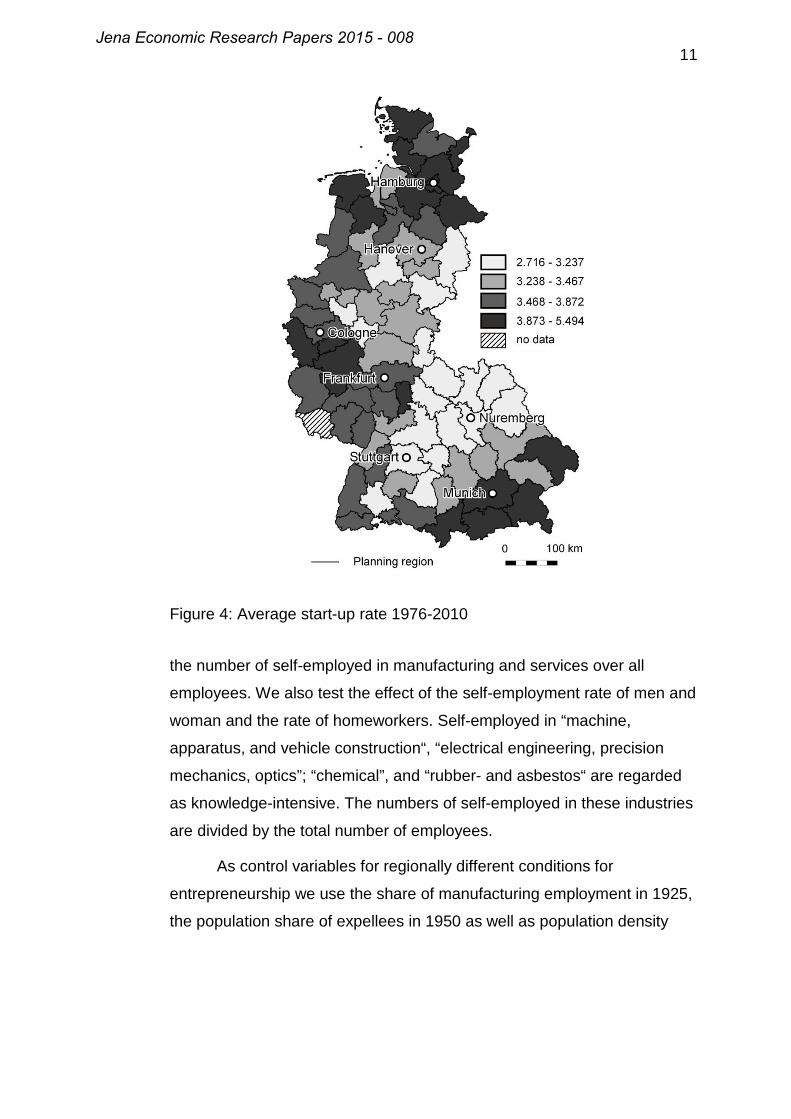
regional start-up rate of the 1976-2010 period is shown in Figure 4.
In 1925, the self-employment rate in non-agricultural industries was
particularly high in the northern part of Germany, in the south around
Munich, and in certain regions of Baden-Wuerttemberg in the southwest,
whereas the Ruhr area (north of Cologne) was marked by relatively low
rates of self-employment (Figure 2). The homeworker rate in 1925 shows
7 There are 74 West German planning regions. For administrative reasons, the cities of Hamburg and Bremen are defined as planning regions even though they are not functional economic units. To avoid distortions, we merged these cities with adjacent planning regions. Hamburg is merged with the region of Schleswig-Holstein South and Hamburg-Umland-South. Bremen is merged with Bremen-Umland. Further, we exclude the planning region “Saarland” from the regression analysis since most of the areas within this planning region was not completely under German administration at the time of the 1925 census.
Jena Economic Research Papers 2015 - 008
10
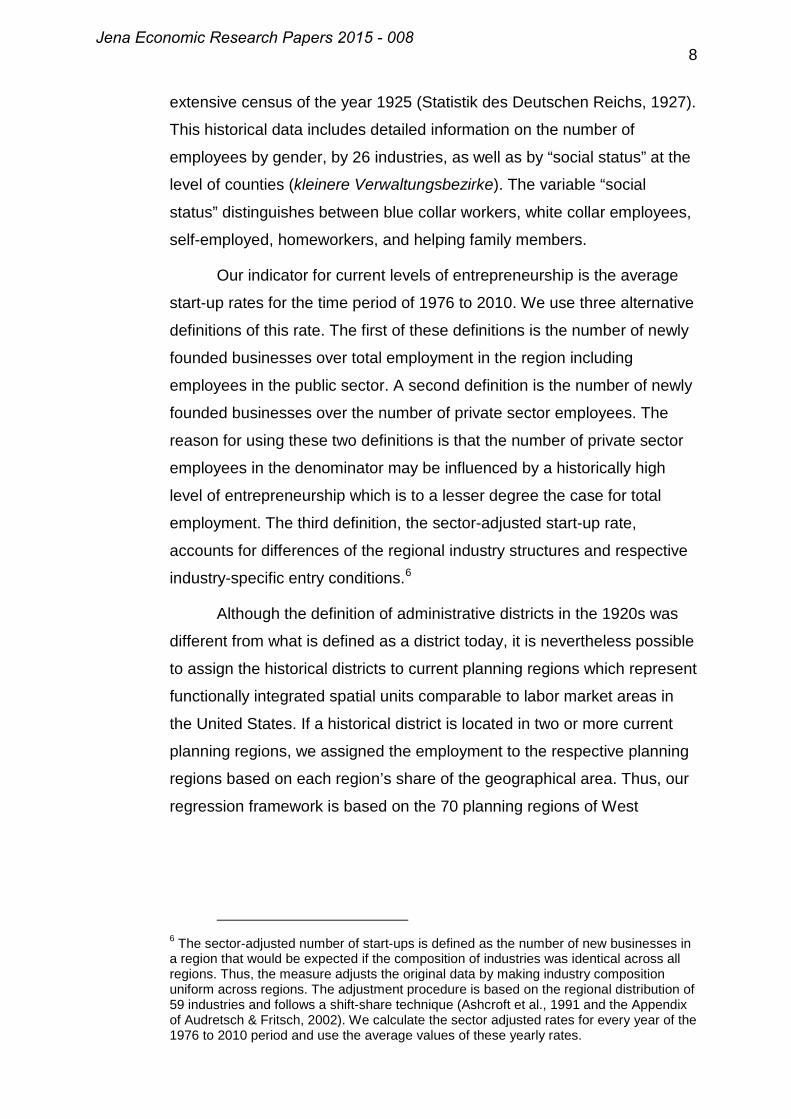
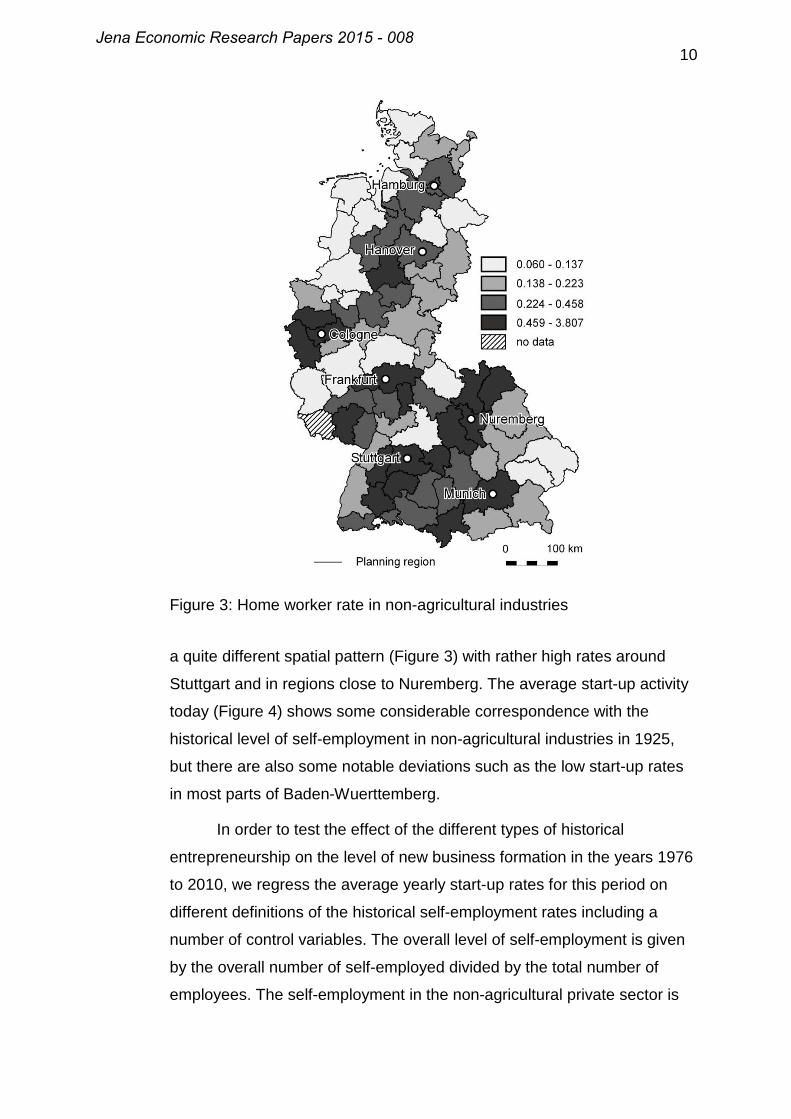
Figure 3: Home worker rate in non-agricultural industries
a quite different spatial pattern (Figure 3) with rather high rates around
Stuttgart and in regions close to Nuremberg. The average start-up activity
today (Figure 4) shows some considerable correspondence with the
historical level of self-employment in non-agricultural industries in 1925,
but there are also some notable deviations such as the low start-up rates
in most parts of Baden-Wuerttemberg.
In order to test the effect of the different types of historical
entrepreneurship on the level of new business formation in the years 1976
to 2010, we regress the average yearly start-up rates for this period on
different definitions of the historical self-employment rates including a
number of control variables. The overall level of self-employment is given
by the overall number of self-employed divided by the total number of
employees. The self-employment in the non-agricultural private sector is
Jena Economic Research Papers 2015 - 008
11
Figure 4: Average start-up rate 1976-2010
the number of self-employed in manufacturing and services over all
employees. We also test the effect of the self-employment rate of men and
woman and the rate of homeworkers. Self-employed in “machine,
apparatus, and vehicle construction“, “electrical engineering, precision
mechanics, optics”; “chemical”, and “rubber- and asbestos“ are regarded
as knowledge-intensive. The numbers of self-employed in these industries
are divided by the total number of employees.
As control variables for regionally different conditions for
entrepreneurship we use the share of manufacturing employment in 1925,
the population share of expellees in 1950 as well as population density
Jena Economic Research Papers 2015 - 008
12
Table 1: Definition of variables
Variable Definition Average start-up rate 1976-2010 (total employment)
Number of start-ups in a region per year over the total number of employees.b
Average start-up rate 1976-2010 (private sector employment)
Number of start-ups in a region per year over total private sector employment.b
Average sector adjusted start-up rate 1976-2010
Sector adjusted number of start-ups in a region over total employment.b
Self-employment rate 1925 Total number of self-employed persons divided by the total number of employees.a
Self-employment rate in non-agricultural industries 1925
Number of self-employed persons in non-agricultural private industries divided by the total number of employees.a
Self-employment rate females in non-agricultural industries 1925
Number of self-employed women in non-agricultural private industries divided by all working women.a
Self-employment rate males in non-agricultural industries 1925
Number of self-employed men in non-agricultural private industries divided by all working men.a
Home worker rate in non-agricultural industries 1925
Number of persons registered as home worker in non-agricultural private industries divided by the total number of employees.a
Share of self-employed women over total self-employment 1925
Number of self-employed women in in non-agricultural private industries over the total number of persons registered as self-employed in these industries a
Self-employment rate in non-agricultural industries (incl. home workers) 1925
Number of self-employed persons and number of home workers in non-agricultural private industries divided by the total number of employees.a
Share of home workers over total self-employment 1925
Number of home worker 1925 in non-agricultural private industries over all self-employed and homeworkers in non-agricultural private industries.
Self-employment rate in knowledge intensive industries 1925
Number of self-employed persons in knowledge-intensive industries (“machine, apparatus, and vehicle construction“, “electrical engineering, precision mechanics, optics”; “chemical”, and “rubber- and asbestos“) divided by the total number of employees.a
Self-employment rate in non-knowledge intensive industries 1925
Number of self-employed persons in non-knowledge-intensive industries divided by the total number of employees.a
Employment share in knowledge-intensive industries 1925
Number of employees in knowledge-intensive industries divided by the total number of employees.a
Employment share in non-knowledge-intensive industries 1925
Number of employees in non-knowledge-intensive industries divided by the total number of employees.a
Employment share in manufacturing 1925
Number of employees in manufacturing divided by the total number of employees.a
Population share of expellees 1950 Number of expellees over regional population.d Population density 1974 Number of inhabitants in per km2.c
Share of R&D employees 1976 Number of employees working as engineers and natural scientists divided by the total number of employees.c
Source: a) Statistik des Deutschen Reichs (1927); b) Social Insurance Statistics; c) Federal Statistical Office; d) Census 1950 (various volumes). All variables enter the models in log-form.
Jena Economic Research Papers 2015 - 008
13
and the share of R&D employees8 in the year 1976. The population share
of expellees is taken from the 1950 Census and is included to account for
the massive inflow of people from outside the region after World War II
that might have had an influence on the regional culture of
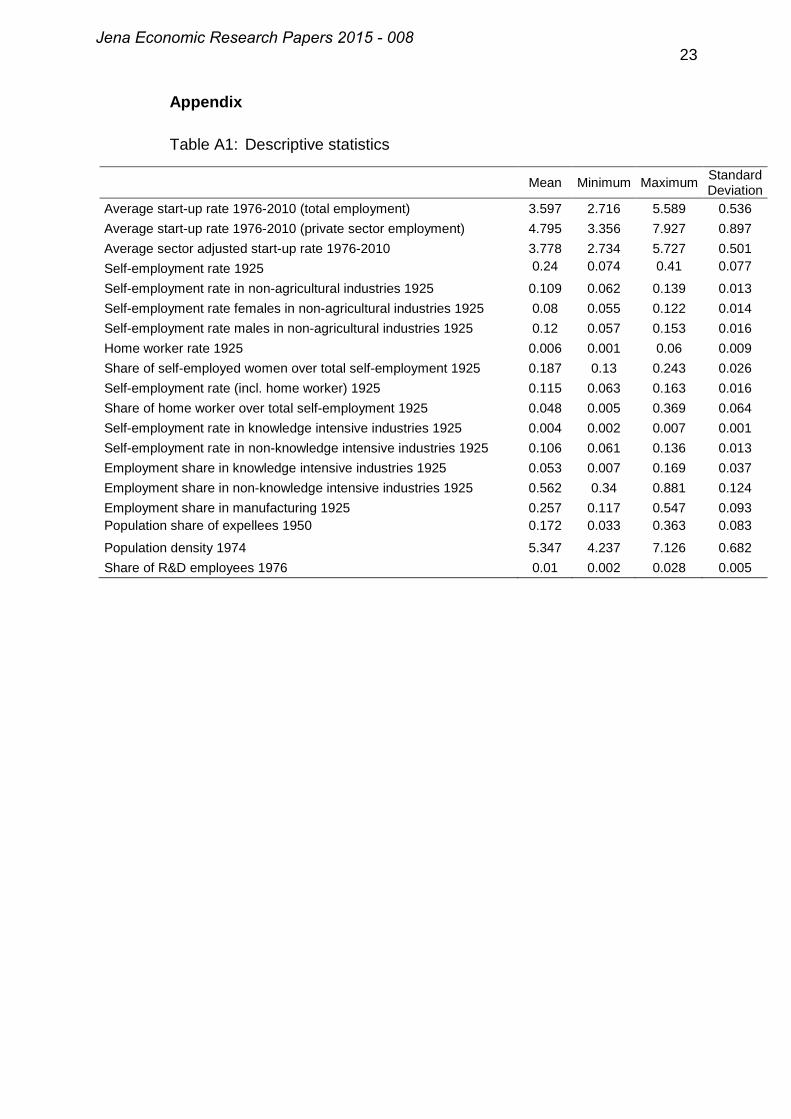
entrepreneurship. Table 1 provides an overview on the definition of the
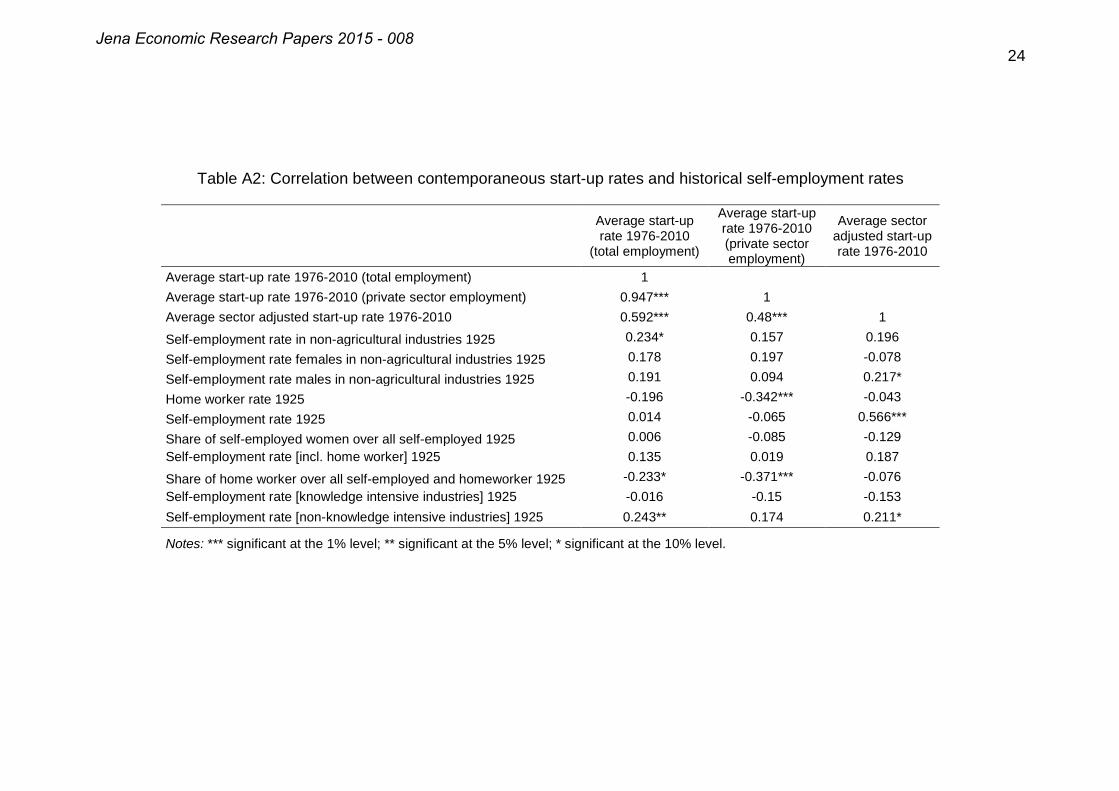
variables used in the analysis. Table A1 in the Appendix shows descriptive
statistics and Table A2 and A3 show correlations between the variables.
5. Empirical analysis
We begin our analysis with the 1925 overall self-employment rate (Table
2) and then move on to other definitions of self-employment (Tables 3 to
5). Regressing the entire share of people that have been counted as self-
employed in 1925 on the average start-up rate of the period from 1976 to
2010 (Table 2) shows no robust significant relationship. Restricting the
definition of entrepreneurship to the non-agricultural private sector, we find
a positive effect in all versions of the model, i.e. regardless of how far
regional differences in industry structures and entry conditions are
accounted for (Table 3). These results are in accordance with our
Hypotheses H1.9
In the models presented in Tables 2 and 3 the specialization in
manufacturing industries in 1925 that controls for sector-specific effects at
that time is negatively related to the level of start-up activity in the period
from 1976 to 2010. This effect is, however, only found to be statistically
significant in models II and III. An explanation could be that regions with a
high share of manufacturing employment in the year 1925 still have
relatively high levels of manufacturing activities that are characterized by
higher entry barriers than other sectors. There is indeed a high correlation
8 R&D employees are defined as those with tertiary degrees working as engineers or natural scientists. Population density is a “catch-all” variable for regional conditions that captures many of the region-specific conditions shown in Figure 1. 9 Running the models with the self-employment rate in agriculture (self-employed farmers divided by the total number of employees) reveals that there is no significant relationship with current start-up activity.
Jena Economic Research Papers 2015 - 008
14
Table 2: General self-employment rate 1925 and regional levels of start-up activity in the 1976-2010 period
Employment share in manufacturing 1925 - -0.158** -0.247*** -0.0222
(0.0633) (0.0650) (0.0416)
Population share of expellees 1950 - -0.108** -0.138** -0.0801**
(0.0455) (0.0535) (0.0326)
Population density 1974 - 0.0390 0.0253 -0.0796*
(0.0693) (0.0825) (0.0451)
Share of R&D employees 1976 - -0.00189 0.00337 -0.0890***
(0.0492) (0.0512) (0.0327)
Federal State dummies No Yes*** Yes*** Yes*** Constant 1.251*** 0.542 0.654 1.075*** (0.0581) (0.459) (0.504) (0.283) R2 0.000 0.333 0.486 0.577
Notes: N=70. Robust standard errors in parentheses; ***: statistically significant at the 1 percent level, **: statistically significant at the 5 percent level, *: statistically significant at the 10 percent level. The independent variables (except the Federal State dummies) are entered as log values.
Table 3: Self-employment rate in the non-agricultural private sector 1925 and persistence of regional entrepreneurship
I II III IV
Number of start-ups divided by … Sector-
adjusted start-up
rate total employment
private sector
employment
Self-employment rate in non-agricultural industries 1925
Employment share in manufacturing 1925 - -0.191*** -0.273*** -0.0441
(0.0523) (0.0633) (0.0365)
Population share of expellees 1950 - -0.118** -0.142** -0.0871**
(0.0475) (0.0547) (0.0344)
Population density 1974 - 0.0789* 0.0934* -0.0597**
(0.0416) (0.0503) (0.0232)
Share of R&D employees 1976 - -0.0376 -0.0306 -0.111***
(0.0494) (0.0533) (0.0325) Federal State dummies No Yes*** Yes*** Yes*** Constant 1.782*** 0.760* 0.812* 1.220*** (0.240) (0.384) (0.445) (0.261) R2 0.055 0.386 0.510 0.603
Notes: N=70. Robust standard errors in parentheses: ***: statistically significant at the 1 percent level, **: statistically significant at the 5 percent level, *: statistically significant at the 10 percent level. The independent variables (except the Federal State dummies) are entered as log values.
Jena Economic Research Papers 2015 - 008
15
between the share of employment in manufacturing in 1925 and the
respective share today (r = 0.43 for the mid-1970s and r = 0.23 on
average for the period from 1976 to 2010). That the effect becomes
insignificant when the current sector adjusted start-up rate is taken as the
dependent variable is not surprising since this version of the start-up rate
already accounts for sector-specific effects. The population share of
expellees shortly after World War II is negatively related to the start-up
rate regardless of the sector-adjustment. The reason might be that
expellees either had a relatively low propensity of starting an own
business or have typically settled in regions with low entrepreneurial
opportunities.10 Population density and the share of R&D employees are
only weakly or not at all related to the uncorrected start-up rate (model II),
whereas there is a negative relationship in the model for the sector-
adjusted rate (model IV).11
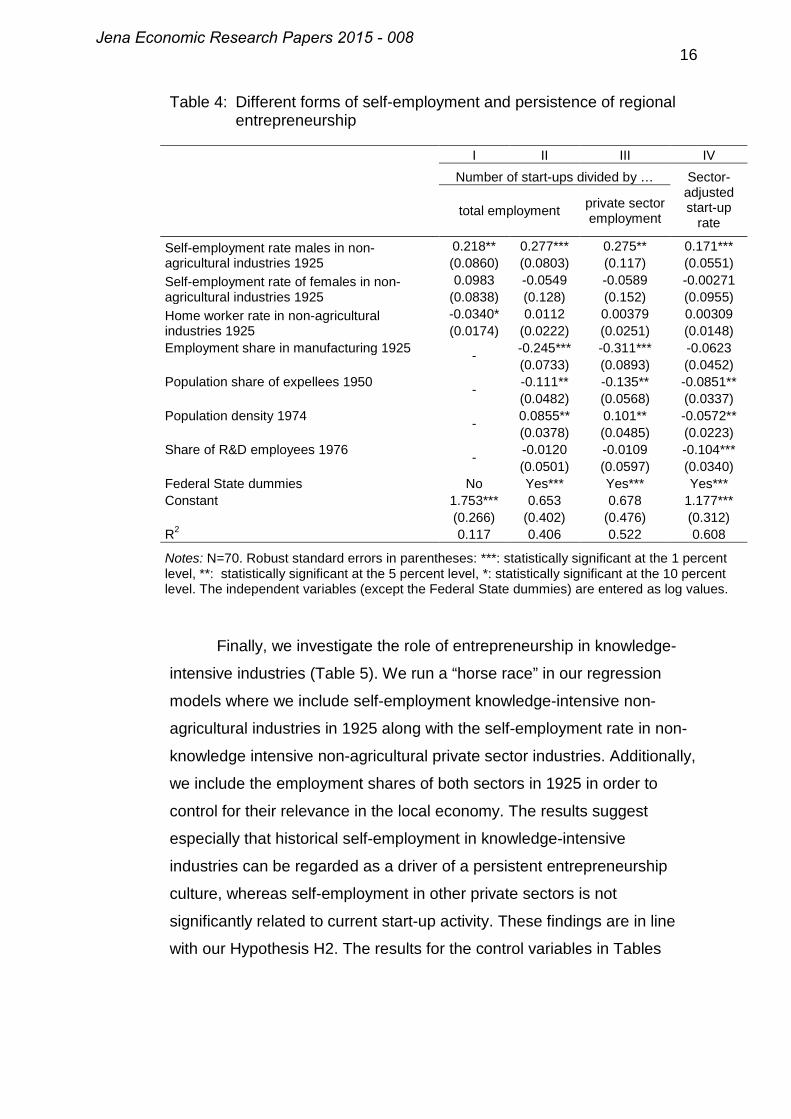
Distinguishing different types of self-employment in the non-
agricultural private sector shows a significantly positive effect only for self-
employed males (Table 4). Self-employment of females and homeworkers
that probably comprises a high share of necessity entrepreneurship are
not statistically significant. These results are in accordance with our
Hypotheses H3 and H4.12
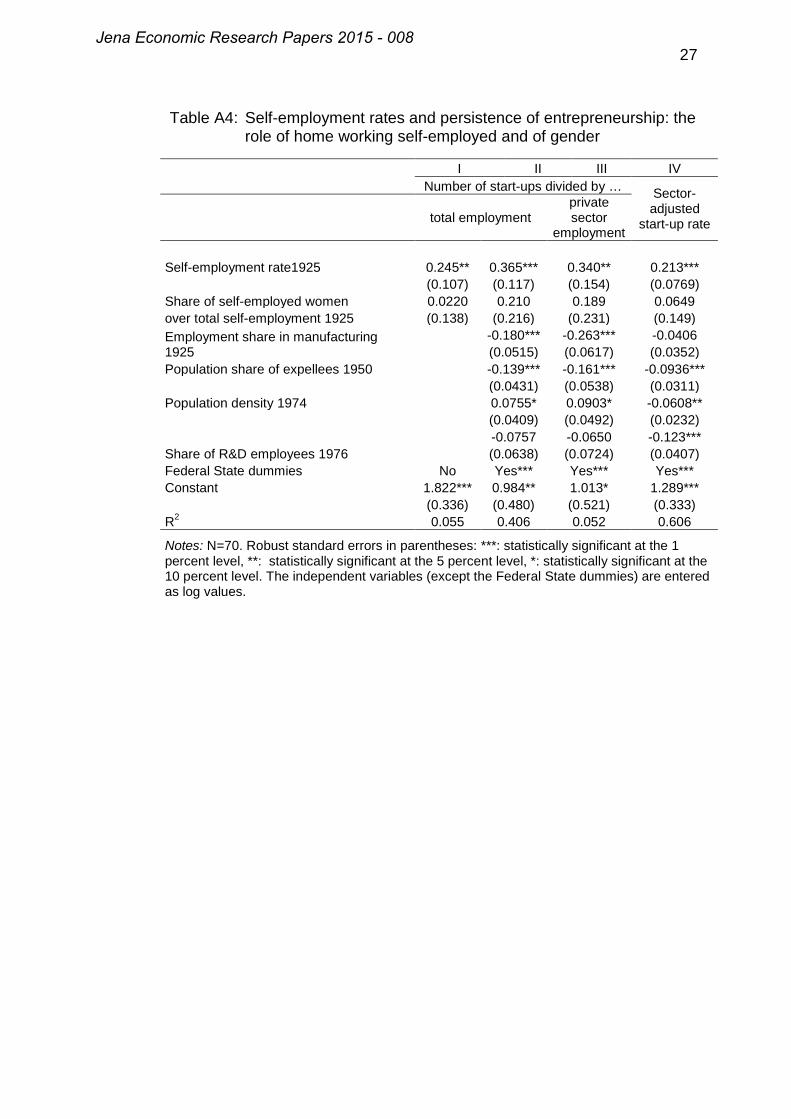
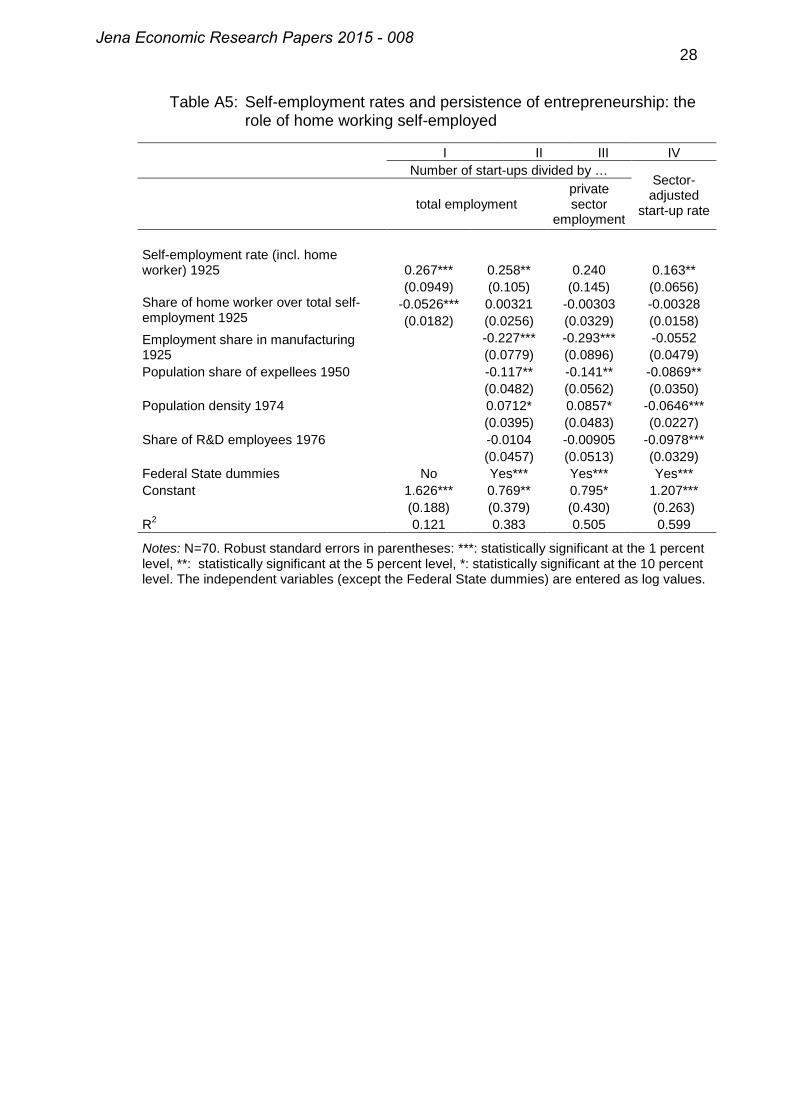
10 The average regional self-employment rate among expellees in 1950 was 4.1 percent whereas the self-employment rate of the original local population was about 14.2 percent. Thus, given that the entrepreneurial propensity of expellees was indeed considerably lower, a high population share of expellees accordingly feeds back into relatively low start-up activity. Furthermore, there is a positive correlation of r = 0.43 between the population share of expellees and the self-employment rate in 1950. This suggests that expellees were not particularly relocated in regions with below average levels of entrepreneurial activity 11 The insignificance of the share of R&D employees in the models for the start-up rate and the negative effect in the models for the sector-adjusted rate of new firm formation is somewhat surprising since we have quite stable and significant positive effects for this variable in earlier work (Fritsch and Wyrwich 2014). This positive effect is confirmed when restricting our analysis to the more recent sub-period 1992 to 2010 and applying pooled regression. A possible reason for the differences in the results may be an increase of R&D activities in smaller firms over the last decades that might be more likely to induce start-up activity as compared to R&D-activities in large firms. Unfortunately, we cannot test this conjecture with the dataset at hand. 12 We also run robustness check with the self-employment rate in non-agricultural industries 1925 and the share of homeworkers and self-employed women respectively that confirm the results of Table 4 (see Table A4 and A5 in the Appendix).
Jena Economic Research Papers 2015 - 008
16
Table 4: Different forms of self-employment and persistence of regional entrepreneurship
I II III IV
Number of start-ups divided by … Sector-
adjusted start-up
rate total employment private sector
employment
Self-employment rate males in non-agricultural industries 1925
Employment share in manufacturing 1925 - -0.245*** -0.311*** -0.0623
(0.0733) (0.0893) (0.0452)
Population share of expellees 1950 - -0.111** -0.135** -0.0851**
(0.0482) (0.0568) (0.0337)
Population density 1974 - 0.0855** 0.101** -0.0572**
(0.0378) (0.0485) (0.0223)
Share of R&D employees 1976 - -0.0120 -0.0109 -0.104***
(0.0501) (0.0597) (0.0340)
Federal State dummies No Yes*** Yes*** Yes*** Constant 1.753*** 0.653 0.678 1.177*** (0.266) (0.402) (0.476) (0.312) R2 0.117 0.406 0.522 0.608
Notes: N=70. Robust standard errors in parentheses: ***: statistically significant at the 1 percent level, **: statistically significant at the 5 percent level, *: statistically significant at the 10 percent level. The independent variables (except the Federal State dummies) are entered as log values.
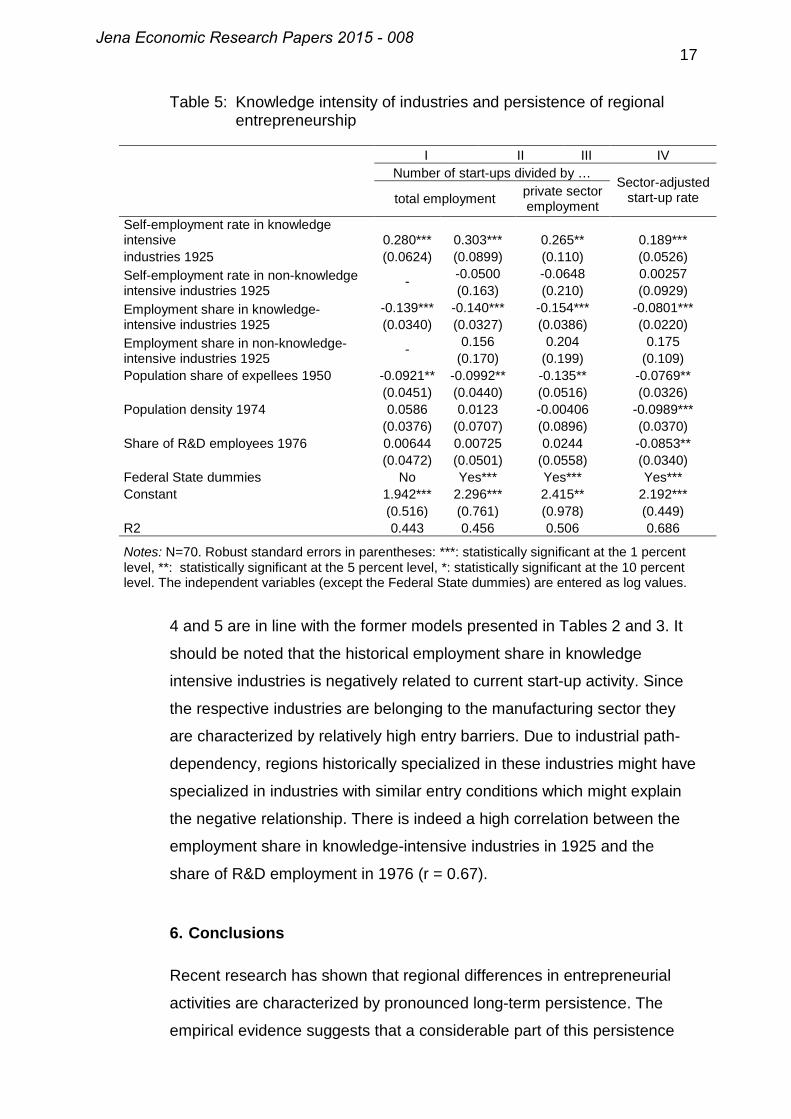
Finally, we investigate the role of entrepreneurship in knowledge-
intensive industries (Table 5). We run a “horse race” in our regression
models where we include self-employment knowledge-intensive non-
agricultural industries in 1925 along with the self-employment rate in non-
Employment share in non-knowledge-intensive industries 1925
- 0.156 0.204 0.175 (0.170) (0.199) (0.109)
Population share of expellees 1950 -0.0921** -0.0992** -0.135** -0.0769**
(0.0451) (0.0440) (0.0516) (0.0326)
Population density 1974 0.0586 0.0123 -0.00406 -0.0989***
(0.0376) (0.0707) (0.0896) (0.0370)
Share of R&D employees 1976 0.00644 0.00725 0.0244 -0.0853**
(0.0472) (0.0501) (0.0558) (0.0340)
Federal State dummies No Yes*** Yes*** Yes*** Constant 1.942*** 2.296*** 2.415** 2.192*** (0.516) (0.761) (0.978) (0.449) R2 0.443 0.456 0.506 0.686
Notes: N=70. Robust standard errors in parentheses: ***: statistically significant at the 1 percent level, **: statistically significant at the 5 percent level, *: statistically significant at the 10 percent level. The independent variables (except the Federal State dummies) are entered as log values.
4 and 5 are in line with the former models presented in Tables 2 and 3. It
should be noted that the historical employment share in knowledge
intensive industries is negatively related to current start-up activity. Since
the respective industries are belonging to the manufacturing sector they
are characterized by relatively high entry barriers. Due to industrial path-
dependency, regions historically specialized in these industries might have
specialized in industries with similar entry conditions which might explain
the negative relationship. There is indeed a high correlation between the
employment share in knowledge-intensive industries in 1925 and the
share of R&D employment in 1976 (r = 0.67).
6. Conclusions
Recent research has shown that regional differences in entrepreneurial
activities are characterized by pronounced long-term persistence. The
empirical evidence suggests that a considerable part of this persistence
Jena Economic Research Papers 2015 - 008
18
can be attributed to regional culture of entrepreneurship. Assuming that
demonstration and role-model effects are a key mechanism for the self-
perpetuating nature of such a culture, we have investigated the role of
different types of self-employment for the persistence of regional
entrepreneurship.
We find indeed that not all types of self-employment are equally
important for the long-term persistence of regional entrepreneurship. While
the overall level of self-employment that includes agriculture and semi-
public sectors is only weakly related to the current level of new business
formation, we find a rather pronounced positive effect for the share of self-
employed males in non-agricultural industries as well as for self-
employment in knowledge-intensive industries. Self-employment by
women and the share of homeworkers that may both include large shares
of necessity driven entrepreneurship do not contribute to an explanation of
persisting regional differences in the level of new business formation.
Our findings have a number of implications. First of all, not the
sheer number of start-ups and self-employed persons is important for the
persistence of a regional entrepreneurship culture, but particularly those
forms of entrepreneurship that can be assumed to be most relevant for
growth. Hence, policies that aim at fostering a persistent culture of
entrepreneurship may focus on those types of new businesses. Second,
attempts to measure a regional culture should account for such
differences and should therefore also focus on those types of
entrepreneurship that have a longer-lasting effect. Third, the persistence
of start-up activity shows that policy initiatives that aim at creating an
entrepreneurial culture need a long-term orientation. Effects of such
policies may become visible only after longer periods of time. However,
once these effects become manifest, they may be long-lasting.
One important question that we have not mentioned yet is that the
characteristics of historically-grown entrepreneurship cultures might differ
across regions, and there may also be differences in the importance of the
mechanisms by which such a culture persists over longer periods of time.
To identify and analyze such differences could considerably enhance our
Jena Economic Research Papers 2015 - 008
19
understanding of the phenomenon. In this paper we have attempted to
make a step in this direction.
Jena Economic Research Papers 2015 - 008
20
References
Ashcroft, Brian, James H. Love and E. Malloy (1991): New firm formation in the British counties with special reference to Scotland. Regional Studies, 25, 395–409.
Andersson, Martin (2012): Start-up rates, Entrepreneurship Culture and the Business Cycle – Swedish patterns from national and regional data. In Pontus Braunerhjelm (Ed.): Entrepreneurship, norms and the business cycle, Swedish Economic Forum Report 2012, Stockholm: Entreprenörskapsforum, 91-110.
Andersson, Martin and Sierdjan Koster (2011): Sources of persistence in regional start-up rates—Evidence from Sweden. Journal of Economic Geography, 11, 179–201.
Aoyama, Yuko (2009): Entrepreneurship and regional culture: The case of Hamamatsu and Kyoto, Japan. Regional Studies, 43, 495–512.
Audretsch, David B. and Michael Fritsch (2002): Growth Regimes over Time and Space. Regional Studies, 36, 113-124.
Baumol, William J. (1990): Entrepreneurship: Productive, Unproductive, and Destructive. Journal of Political Economy, 98, 893-921.
Becker, Ursula (1937): Die Entwicklung des Frauenerwerbs seit der Jahrhundertwende. Bleicherode am Harz: Carl Piest.
Beugelsdijk, Sjoerd (2007): Entrepreneurial culture, regional innovativeness and economic growth. Journal of Evolutionary Economics, 17, 187–210.
Bosma, Niels, et al. (2012): Entrepreneurship and role models. Journal of Economic Psychology, 33, 410–424.
Census (1950): Ergebnisse der Volks- und Berufszählung vom 13.September 1950 in den Ländern der Bundesrepublik Deutschland. Various volumes, Statistical Offices of the Federal States of Germany.
Davidsson, Per (1995): Culture, structure and regional levels of entrepreneurship. Entrepreneurship and Regional Development, 7, 41–62.
Davidsson, Per and Johan Wiklund (1997): Values, beliefs and regional variations in new firm formation rates. Journal of Economic Psychology, 18, 179–199.
Etzioni, Amitai (1987): Entrepreneurship, adaptation and legitimation. Journal of Economic Behavior and Organization, 8, 175–199.
Fotopoulos, Georgios (2014): On the spatial stickiness of UK new firm formation rates. Journal of Economic Geography, 14, 651–679.
Freytag, Andreas and Roy Thurik (2007): Entrepreneurship and its determinants in a cross-country setting. Journal of Evolutionary Economics, 17, 117–131.
Jena Economic Research Papers 2015 - 008
21
Fritsch, Michael and Oliver Falck (2007): New business formation by industry over space and time: A multi-dimensional analysis. Regional Studies, 41, 157–172.
Fritsch, Michael and Pamela Mueller (2007): The Persistence of Regional New Business Formation-Activity over Time – Assessing the Potential of Policy Promotion Programs. Journal of Evolutionary Economics, 17, 299-315.
Fritsch, Michael and Michael Wyrwich (2014): The Long Persistence of Regional Levels of Entrepreneurship: Germany 1925 to 2005. Regional Studies, 48, 939-954.
Fritsch, Michael, Elisabeth Bublitz, Alina Sorgner and Michael Wyrwich (2014): How Much of a Socialist Legacy? The Re-emergence of Entrepreneurship in the East German Transformation to a Market Economy. Small Business Economics, 43, 427-446.
Gruhl, Anja; Alexandra Schmucker and Stefan Seth (2012): The Establishment History Panel 1975-2010: Handbook version 2.2.1, FDZ-Datenreport, 04/2012, Nürnberg.
Hethey, Tanja and Johannes F. Schmieder (2010): Using Worker Flows in the Analysis of Establishment Turnover – Evidence from German Administrative Data. FDZ-Methodenreport 06-2010 EN, Research Data Centre of the Federal Employment Agency (BA) at the Institute for Employment Research (IAB): Nuremberg.
Hofstede, Geert and Robert R. McCrae (2008): Personality and culture revisited, linking traits and dimensions of culture. Cross-Cultural Research, 38, 52 – 87.
Kibler, Ewald, Teemu Kautonen and Matthias Fink (2014): Regional Social Legitimacy of Entrepreneurship: Implications for Entrepreneurial Intention and Start-Up Behaviour. Regional Studies, 48, 995-1015.
Laspita, Stavroula, Nicola Breugst, Stephan Heblich and Holger Patzelt (2012): Intergenerational transmission of entrepreneurial intentions. Journal of Business Venturing, 27, 414-435.
McClelland, David C. (1961): The Achieving Society. Princeton, NJ: Van Nostrand Reinhold.
Minniti, Maria (2005): Entrepreneurship and network externalities. Journal of Economic Behavior and Organization, 57, 1–27.
North, Douglass C. (1994): Economic performance through time. American Economic Review, 84, 359–368.
Obschonka, Martin, Eva Schmitt-Rodermund, Samuel D. Gosling and Rainer K. Silbereisen (2013): The Regional Distribution and Correlates of an Entrepreneurship-Prone Personality Profile in the United States, Germany, and the United Kingdom: A Socioecological Perspective. Journal of Personality and Social Psychology, 105, 104-122.
Parker, Simon (2009): Why do small firms produce the entrepreneurs? Journal of Socio-Economics, 38, 484-494.
Jena Economic Research Papers 2015 - 008
22
Rauch, Andreas and Michael Frese (2007): Let’s Put the Person Back into Entrepreneurship Research: A Meta-Analysis on the Relationship Between Business Owners’ Personality Traits, Business Creation, and Success. European Journal of Work and Organizational Psychology, 16, 353–385.
Rentfrow, Jason P., Samuel D. Gosling and Jeff Potter (2008): A theory of the emergence, persistence, and expression of geographic variation in psychological characteristics. Perspectives on Psychological Science, 3, 339-369.
Román, Concepcion, Emilio Congregado and Jose Maria Millán (2011), Dependent self-employment as a way to evade employment protection legislation. Small Business Economics, 37, p363-392.
Schaser, Angelika (2008), Gendered Germany, in: Retallack, James (Ed., Imperial Germany: 1871-1918. Oxford: Oxford University Press, 128-150.
Sorenson, Olav and Pino G. Audia (2000), The Social Structure of Entrepreneurial Activity, Geographic Concentration of Footwear Production in the United States, 1940–1989, American Journal of Sociology, 106, 424-462.
Statistik des Deutschen Reichs (1927): Volks-, Berufs- und Betriebszählung vom 16. Juni 1925: Die berufliche und soziale Gliederung der Bevölkerung in den Ländern und Landesteilen. Vol. 403–Vol. 405, Berlin: Reimar Hobbing.
Stuart, Toby E. and Olav Sorensen (2003): The geography of opportunity: spatial heterogeneity in founding rates and the performance of bio-technology firms. Research Policy, 32, 229-253.
Sutaria, Vinod and Donald A. Hicks (2004): New firm formation: dynamics and determinants. Annals of Regional Science, 38, 241–262.
Wagner, Joachim (2004): Are Young and Small Firms Hothouses for Nascent Entrepreneurship? Evidence from German Micro Data, Applied Economics Quarterly, 50, 379–391.
Westlund, Hans and Roger E. Bolton (2003): Local Social Capital and Entrepreneurship. Small Business Economics, 21, 77-113.
Westlund, Hans and Frane Adam (2010): Social Capital and Economic Performance: A Meta-analysis of 65 Studies. European Planning Studies, 18, 893-919.
Westlund Hans, Johan P. Larsson and Amy Rader Olsson (2014): Startups and Local Social Capital in Swedish Municipalities. Regional Studies, 48, 974-994.
Williamson, Oliver (2000): The New Institutional Economics: Taking Stock, Looking Ahead. Journal of Economic Literature, 38, 595–613.
Zhao, Hao and Scott E. Seibert (2006): The Big-Five Personality Dimensions and Entrepreneurial Status: A Meta-Analytical Review. Journal of Applied Psychology, 91, 259–271.
1 2 3 4 5 6 7 8 1 Self-employment rate in non-agricultural industries 1925 1 2 Self-employment rate females in non-agricultural industries 1925 0.376*** 1 3 Self-employment rate males in non-agricultural industries 1925 0.955*** 0.102*** 1 4 Home worker rate in non-agricultural industries 1925 0.153*** -0.251*** 0.279*** 1 5 General self-employment rate 1925 0.421*** 0.048*** 0.408*** -0.152*** 1 6 Share of self-employed women over all self-employed 1925 -0.032* 0.532*** -0.119*** 0.075*** -0.155*** 1 7 Self-employment rate [incl. home worker] 1925 0.868*** 0.154*** 0.895*** 0.557*** 0.303*** -0.072*** 1 8 Share of home worker over all self-employed and homeworker 1925 0.035* -0.293*** 0.167*** 0.992*** -0.208*** 0.092*** 0.451*** 1 9 Self-employment rate [knowledge intensive industries] 1925 0.467*** 0.064*** 0.523*** 0.369*** -0.058*** 0.240*** 0.456*** 0.329*** 10 Self-employment rate [non-knowledge intensive industries] 1925 0.998*** 0.385*** 0.947*** 0.130*** 0.437*** -0.048*** 0.862*** 0.011 11 Employment share in knowledge-intensive industries 1925 0.116*** 0.067*** 0.132*** 0.307*** -0.537*** 0.135*** 0.167*** 0.305*** 12 Employment share in non-knowledge-intensive industries 1925 -0.139*** 0.072*** -0.138*** 0.317*** -0.903*** 0.158*** 0.001 0.341*** 13 Population share of expellees 1950 0.083* -0.257*** 0.149*** -0.168*** 0.107*** -0.188*** 0.056*** -0.190*** 14 Employment share in manufacturing 1925 0.039** -0.074*** 0.107*** 0.666*** -0.542*** 0.173*** 0.280*** 0.675*** 15 Population density 1974 -0.237*** 0.155*** -0.265*** 0.230*** -0.835*** 0.233*** -0.160*** 0.273*** 16 Share of R&D employees 1976 0.096 0.284*** 0.057 0.083 -0.52*** 0.360*** 0.022 0.086
Notes: ***: statistically significant at the 1% level; **: statistically significant at the 5% level; *: statistically significant at the 10% level.
Jena Economic Research Papers 2015 - 008
26
Table A3 continued
9 10 11 12 13 14 15
1 Self-employment rate in non-agricultural industries 1925 2 Self-employment rate females in non-agricultural industries 1925 3 Self-employment rate males in non-agricultural industries] 1925 4 Home worker rate in non-agricultural industries 1925 5 Self-employment rate 1925 6 Share of self-employed women over all self-employed 1925 7 Self-employment rate [incl. home worker] 1925 8 Share of home worker over all self-employed and homeworker 1925 9 Self-employment rate [knowledge intensive industries] 1925 1
10 Self-employment rate [non-knowledge intensive industries] 1925 0.408*** 1 11 Employment share in knowledge-intensive industries 1925 0.628*** 0.074*** 1 12 Employment share in non-knowledge-intensive industries 1925 0.154*** -0.152*** 0.540*** 1 13 Population share of expellees 1950 -0.127*** 0.097*** -0.232*** -0.158*** 1 14 Employment share in manufacturing 1925 0.479*** 0.005 0.741*** 0.692*** -0.351*** 1 15 Population density 1974 0.289*** -0.263*** 0.655*** 0.832*** -0.390*** 0.691*** 1 16 Share of R&D employees 1976 0.507*** 0.065 0.721*** 0.522*** -0.256*** 0.560*** 0.681***
Jena Economic Research Papers 2015 - 008
27
Table A4: Self-employment rates and persistence of entrepreneurship: the
Share of self-employed women 0.0220 0.210 0.189 0.0649 over total self-employment 1925 (0.138) (0.216) (0.231) (0.149) Employment share in manufacturing 1925
-0.180*** -0.263*** -0.0406
(0.0515) (0.0617) (0.0352)
Population share of expellees 1950
-0.139*** -0.161*** -0.0936***
(0.0431) (0.0538) (0.0311)
Population density 1974
0.0755* 0.0903* -0.0608**
(0.0409) (0.0492) (0.0232)
Share of R&D employees 1976 -0.0757 -0.0650 -0.123***
(0.0638) (0.0724) (0.0407)
Federal State dummies No Yes*** Yes*** Yes*** Constant 1.822*** 0.984** 1.013* 1.289*** (0.336) (0.480) (0.521) (0.333) R2 0.055 0.406 0.052 0.606
Notes: N=70. Robust standard errors in parentheses: ***: statistically significant at the 1 percent level, **: statistically significant at the 5 percent level, *: statistically significant at the 10 percent level. The independent variables (except the Federal State dummies) are entered as log values.
Jena Economic Research Papers 2015 - 008
28
Table A5: Self-employment rates and persistence of entrepreneurship: the role of home working self-employed
Federal State dummies No Yes*** Yes*** Yes*** Constant 1.626*** 0.769** 0.795* 1.207*** (0.188) (0.379) (0.430) (0.263) R2 0.121 0.383 0.505 0.599
Notes: N=70. Robust standard errors in parentheses: ***: statistically significant at the 1 percent level, **: statistically significant at the 5 percent level, *: statistically significant at the 10 percent level. The independent variables (except the Federal State dummies) are entered as log values.