14
The Photobleaching Effect by Stephen Payne ?
| Date post: | 18-Dec-2015 |
| Category: |
Documents |
| Upload: | juliana-wilkerson |
| View: | 218 times |
| Download: | 1 times |

The Photobleaching Effect
byStephen Payne
?

SYBR Green
• Binds to double-stranded DNA and fluoresces
• Does not bind to single-stranded DNA

LED
Light
Fluorescent SYBR Green
Bleached SYBR Green
Double-Stranded DNA
The Problem

1.04 1.06 1.08 1.1 1.12 1.14 1.16 1.18 1.20.2
0.4
0.6
0.8
1
1.2Raw Data of Successive Runs of the Same 20 bp Sample
RTD Voltage (V)
Ph
oto
dio
de
Vo
ltag
e (
V)
First RunSecond Run
Suspicion of The Problem

0 200 400 600 800 1000 12000.4
0.5
0.6
0.7
0.8
0.9
1
Re
lativ
e F
luo
resc
en
ce
Time (seconds)
Cold Sample Run with 4.3 Ohm Resistor (20 bp, 5mM KCl)
Raw DataExponential Fit
Bleaching Function
Flu = e-.00078t
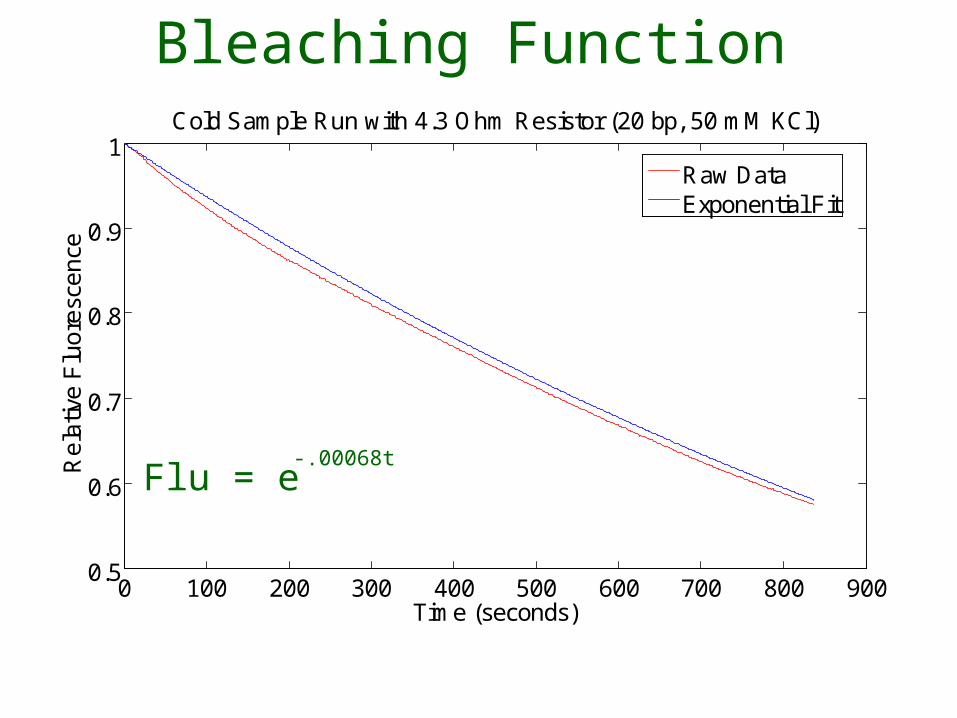
0 100 200 300 400 500 600 700 800 9000.5
0.6
0.7
0.8
0.9
1
Re
lativ
e F
luo
resc
en
ce
Time (seconds)
Cold Sample Run with 4.3 Ohm Resistor (20 bp, 50 mM KCl)
Raw DataExponential Fit
Bleaching Function
Flu = e-.00068t

30 40 50 60 70 800
0.5
1
1.5
2
Temperature (°C)
No
rma
lize
d P
ho
tod
iod
e V
olta
ge
Melting Curves for 20 bp, 5 mM KCl Sample
Uncorrected for BleachingCorrected for Bleaching
Correction by Bleaching Factor

0 200 400 600 800 1000 1200 1400 1600 18000.9975
0.998
0.9985
0.999
0.9995
1Cold Sample with 4.3 Ohm Resistor (20 bp, 100 mM KCl)
Time (seconds)
Re
lativ
e F
luo
resc
en
ceInsignificant Bleaching Effect?

The Solution• Change R1 in LED Driver from a
4.3 Ohm resistor to a 20 Ohm resistor

0 100 200 300 400 500 600 700 8000.84
0.86
0.88
0.9
0.92
0.94
0.96
0.98
1
1.02Cold Sample Run with 20 Ohm Resistor (20 bp, 5 mM KCl)
Time (seconds)
Re
lativ
e F
luo
resc
en
ceReduced Bleaching Effect

Resistance (Ohms)
Sig
nal
The Theory
OptimalSignal
R optimal
4.3 Ohms
20 Ohms

Conclusion• Photobleaching significantly affected
our system with the 4.3 Ohm resistor
• This effect was reduced via increasing the resistance in the LED driver
• Further optimization of the system is possible

AcknowledgementsCode• Danielle Carpenter, Co-author
• Steve Wasserman, Debugging
Images• http://distancelearning.ksi.edu/demo/bio378/DNA_files/
image023.jpg
• http://en.wikivisual.com/images/0/04/NA-comparedto-DNA_thymineAndUracilCorrected.png
• http://www.elixa.com/light/arrays2.jpg
• http://openwetware.org/wiki/20.309:Measuring_DNA_Melting_Curves

Questions?


