Page 1
The physiological effect of intermittent fasting (fasting the month of Ramadan) on
anthropometrics and blood variables.
By
Yahya R. Alayafi
©2014
B.A., King Saud University, Riyadh. KSA, 1998
M.S., University of Kansas, Lawrence, USA. 2007
Submitted to the graduate degree program in Health, Sport and Exercise Sciences
and the Graduate Faculty of the University of Kansas in partial fulfillment of the
requirements for the degree of Doctor of Philosophy.
Dissertation Committee:
Committee Chairperson
Committee Member
Committee Member
Committee Member
Committee Member
Date Approved:
Page 2
All rights reserved
INFORMATION TO ALL USERSThe quality of this reproduction is dependent upon the quality of the copy submitted.
In the unlikely event that the author did not send a complete manuscriptand there are missing pages, these will be noted. Also, if material had to be removed,
a note will indicate the deletion.
Microform Edition © ProQuest LLC.All rights reserved. This work is protected against
unauthorized copying under Title 17, United States Code
ProQuest LLC.789 East Eisenhower Parkway
P.O. Box 1346Ann Arbor, MI 48106 - 1346
UMI 3632926
Published by ProQuest LLC (2014). Copyright in the Dissertation held by the Author.
UMI Number: 3632926
Page 3
ii
ABSTRACT
Muslims fast one month each year during the month of Ramadan. Many studies
have been conducted on fasting during the month of Ramadan; however, their
results were varied. Furthermore, few studies have been conducted on hormones
levels during Ramadan and these studies had vastly inconsistent results. It is
important to note that none of these studies controlled or even monitored physical
activity and food intake. Purpose: The purpose of this study is to examine the
effect of fasting during the month of Ramadan on anthropometric and blood
variables. This study will determine if intermittent fasting will affect body
composition, blood lipid profile, glucose, blood proteins and hormones. Methods:
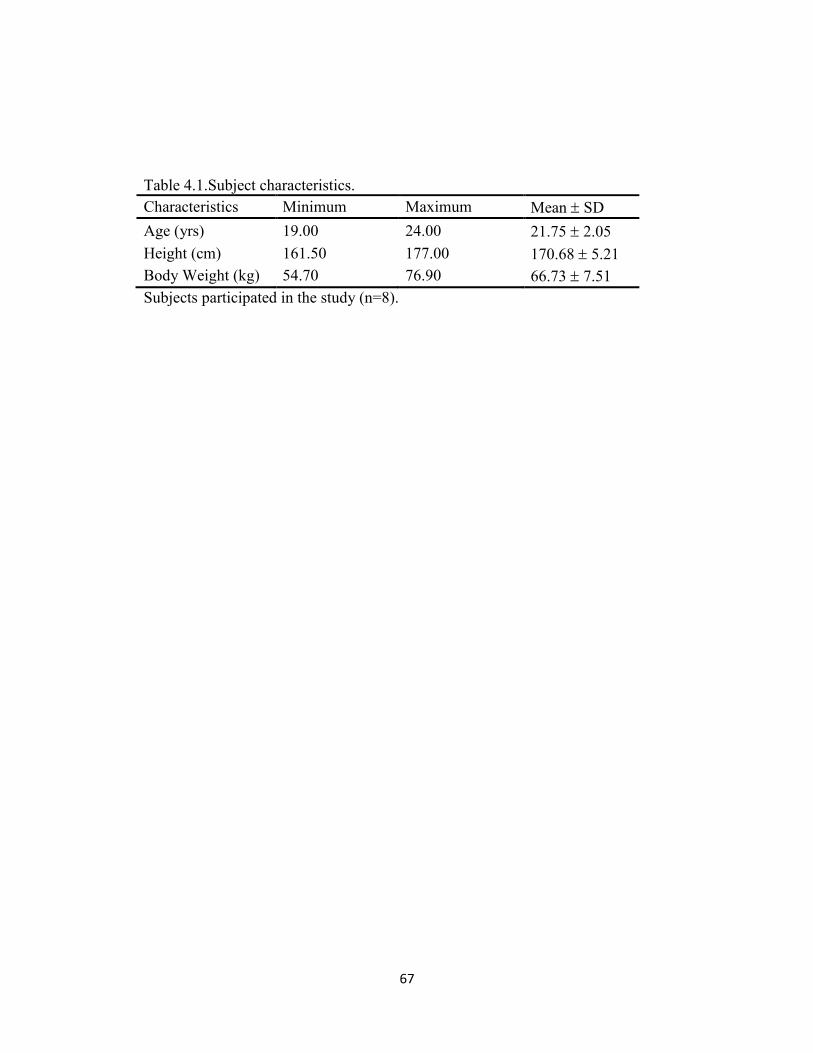
eight healthy athlete males aged (21.75± 2.05 years, 66.73±7.51 kg,
170.68±5.21cm) participated in this study. The subjects were randomly selected
from a first division Saudi Soccer League (Raka Soccer League). Weight, height
and body composition of all subjects were recorded at baseline one day before
Ramadan (D1), after ten days of fasting Ramadan (D10) and twenty-eight days of
fasting Ramadan (D28). Blood was collected and then analyzed. Physical
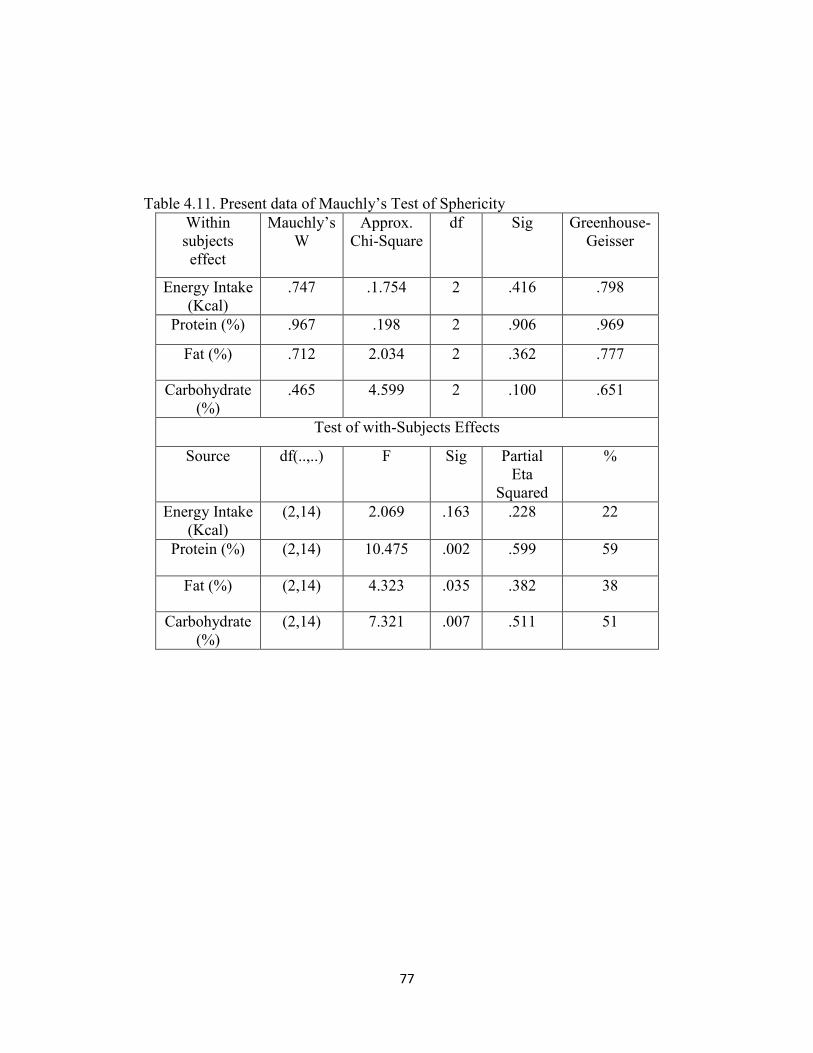
activities and food intake were measured. All data was analyzed using 1x3
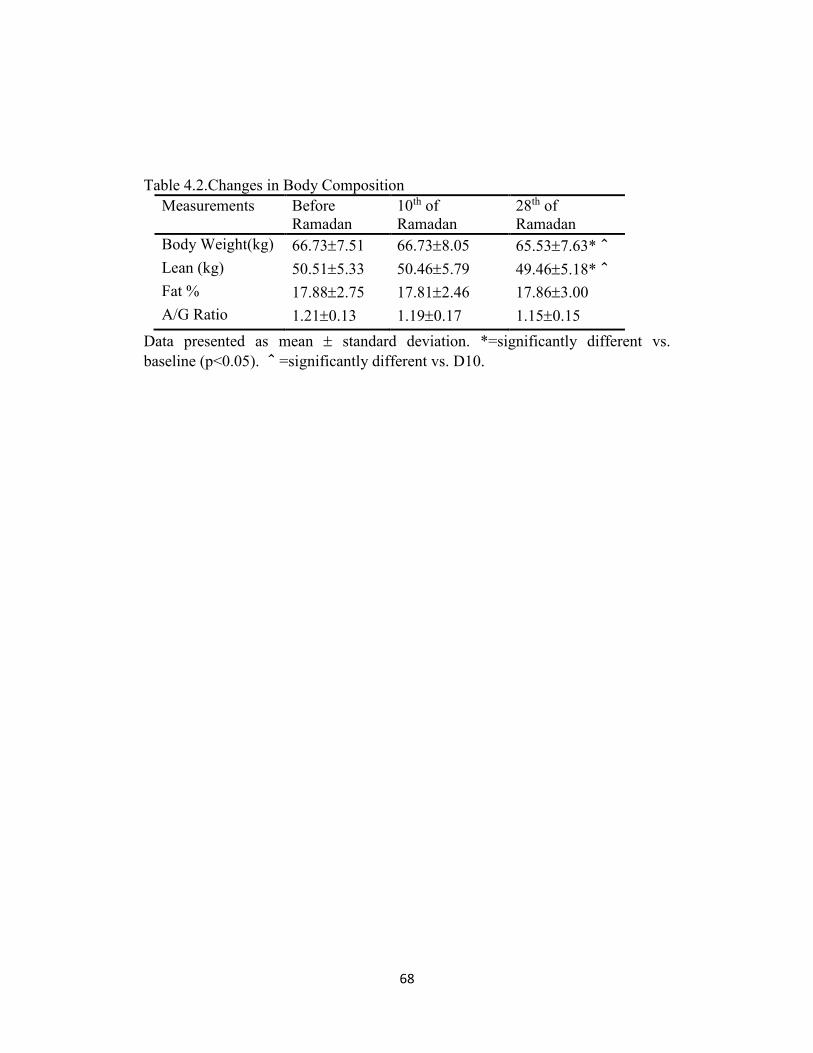
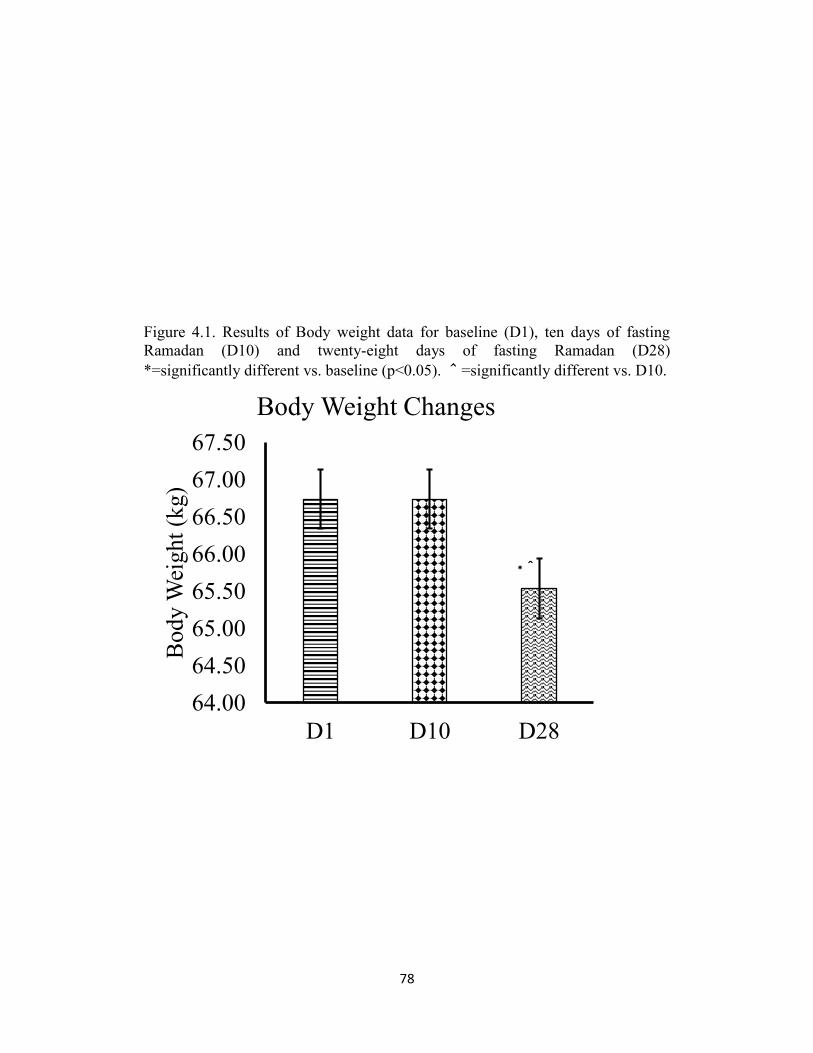
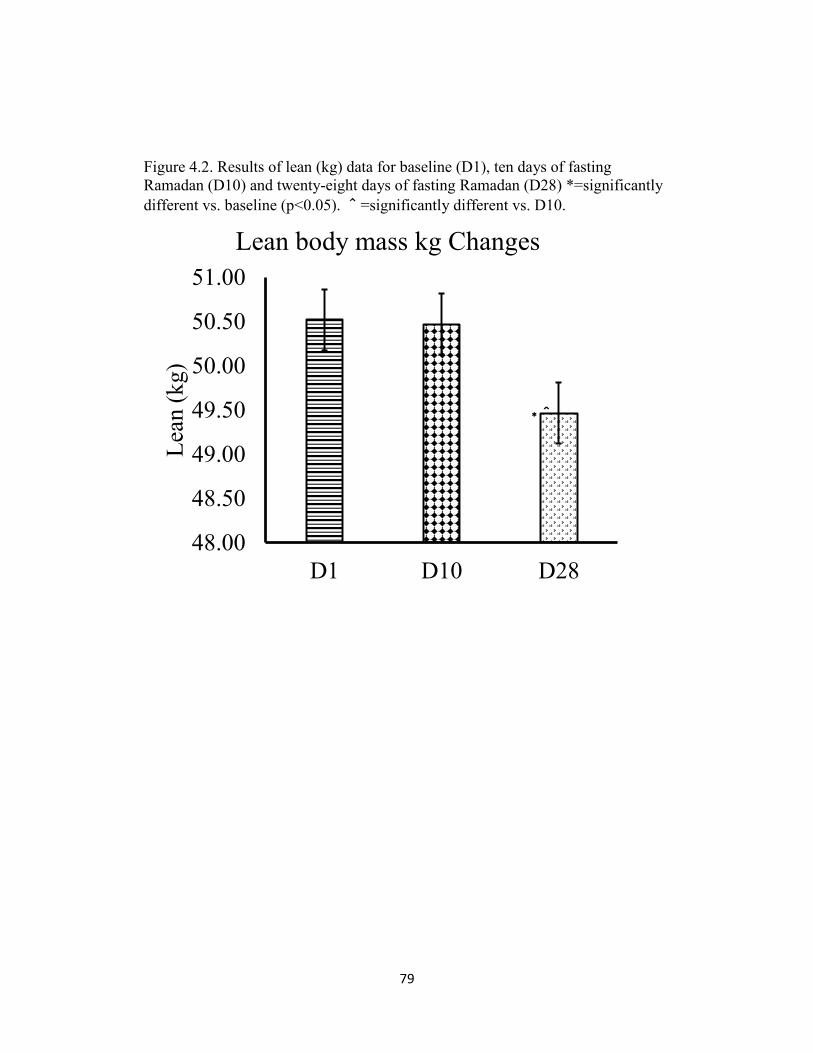
repeated measures ANOVA (p< .05). Results: There was significant decrease in
body mass (D1= 66.73 kg, D10= 66.73 kg and D28= 65.53 kg) and Lean body
mass (D1= 50.51 kg, D10= 50.46 kg and D28= 49.46 kg) comparing the end of
Ramadan with baseline and day 10 of intermittent fasting whereas they were
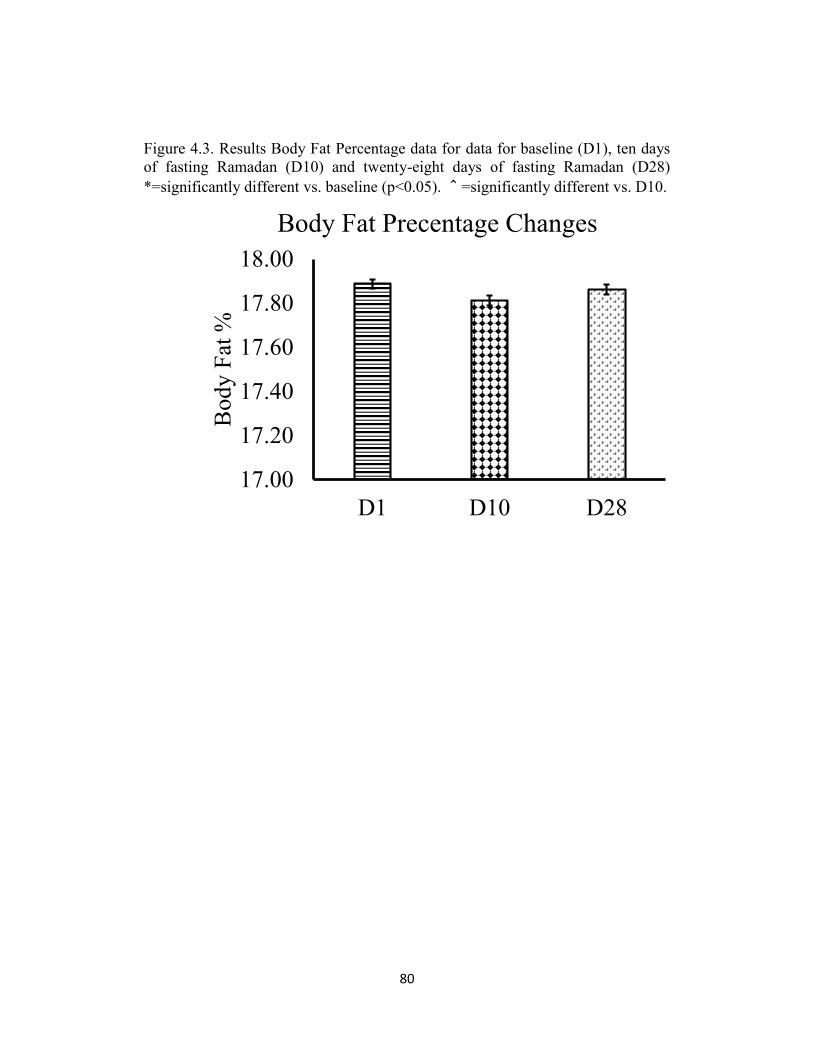
almost identical at the baseline and Day 10 of Ramadan. There was no significant
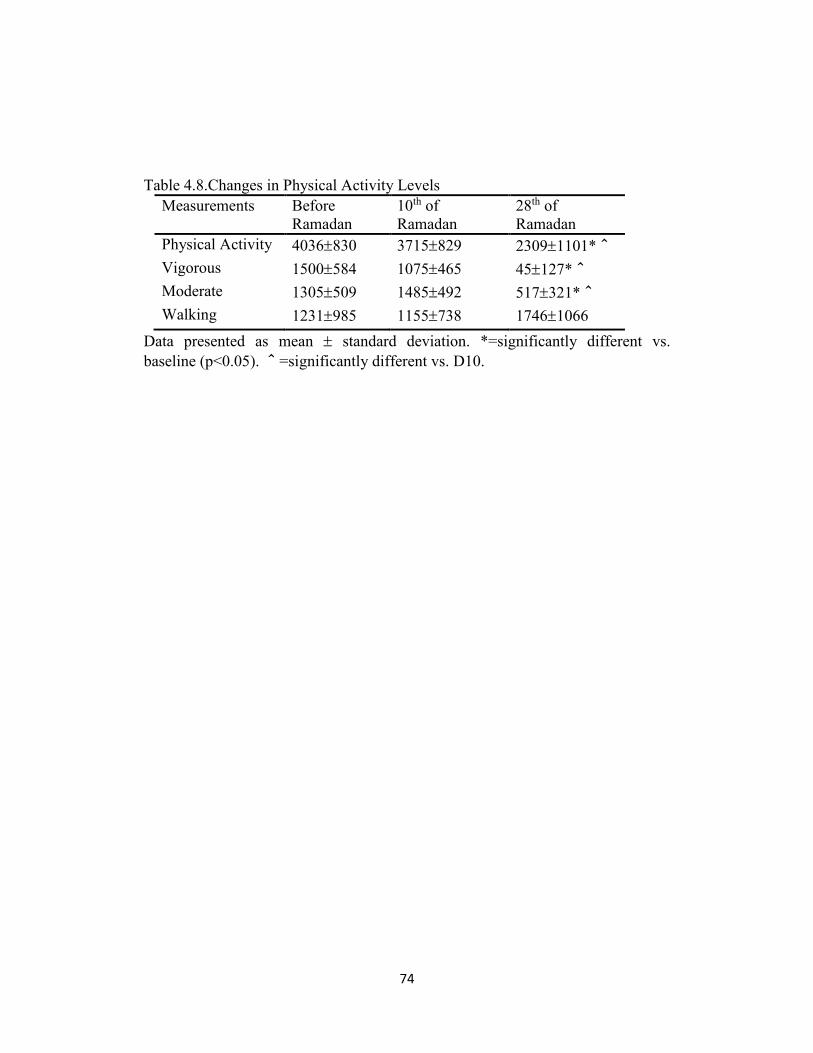
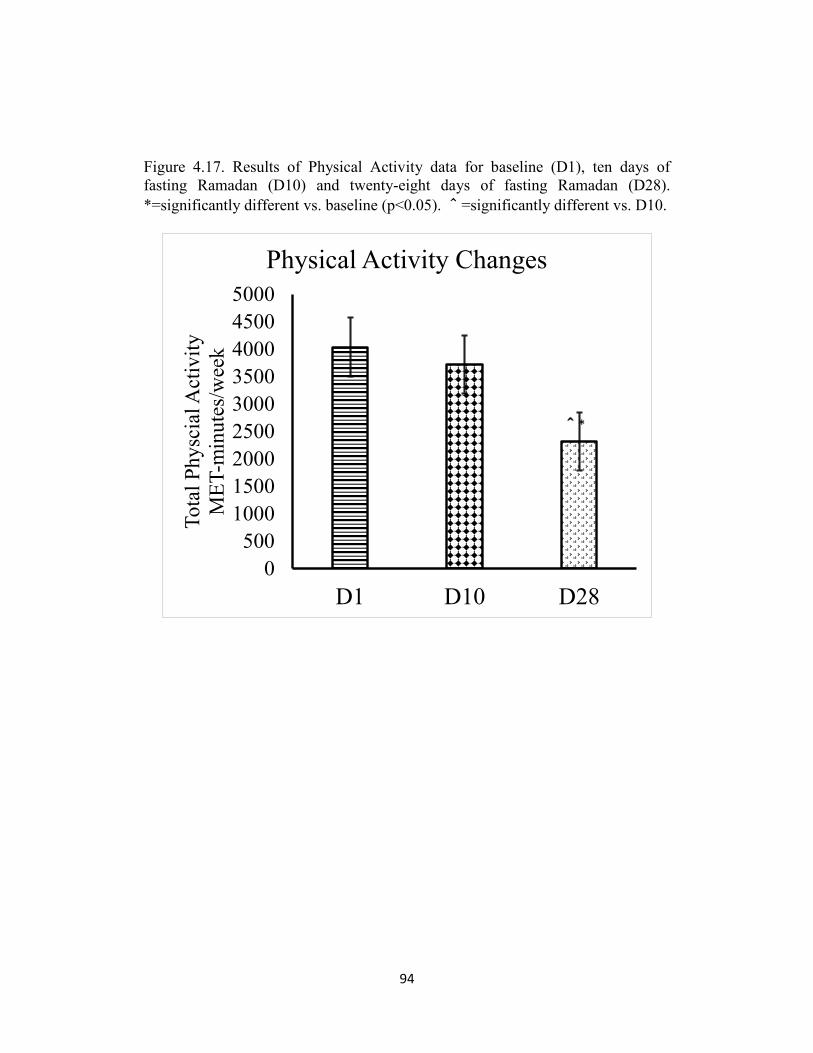
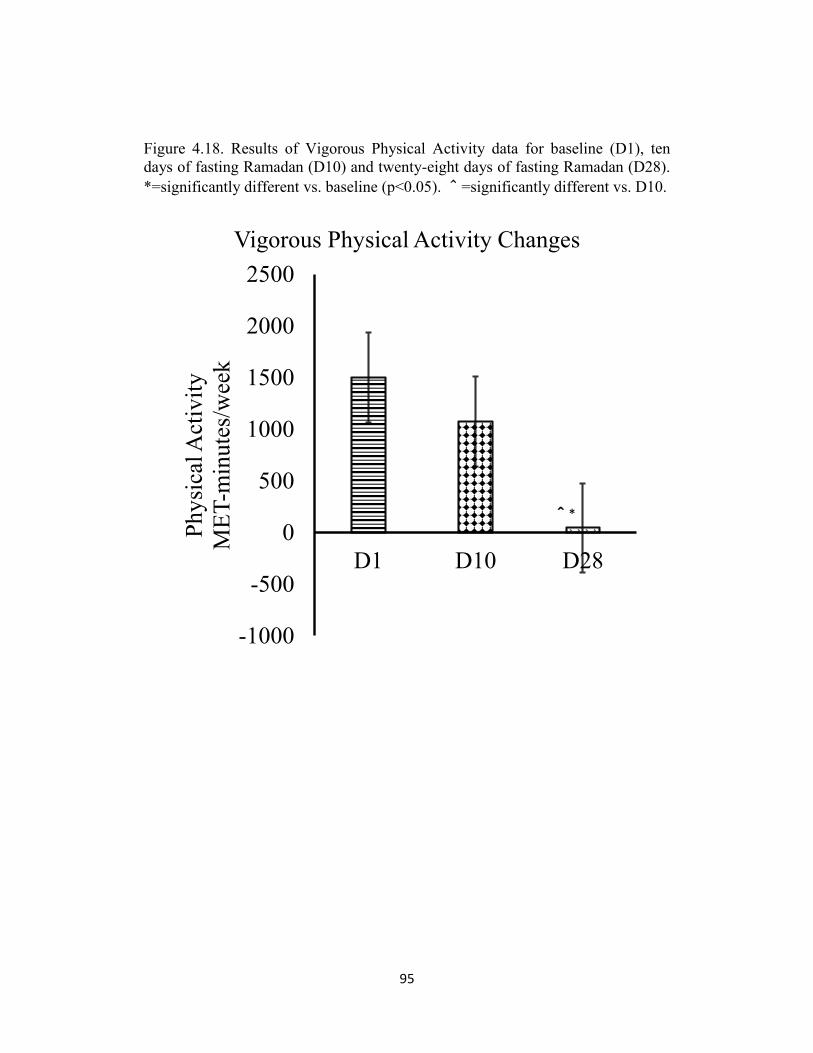
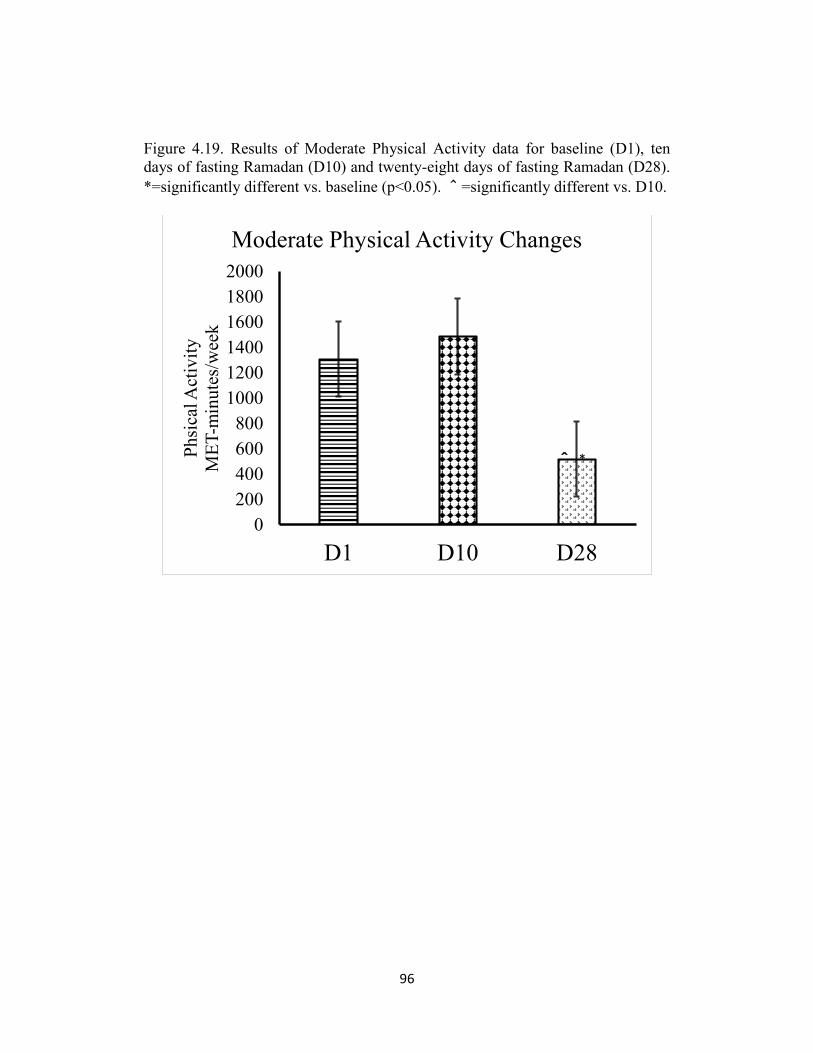
difference in data of Body Fat percentage. Physical activity, Vigorous activity and
Moderate activity were significantly decrease at Day 10 and Day 28 of Ramadan.
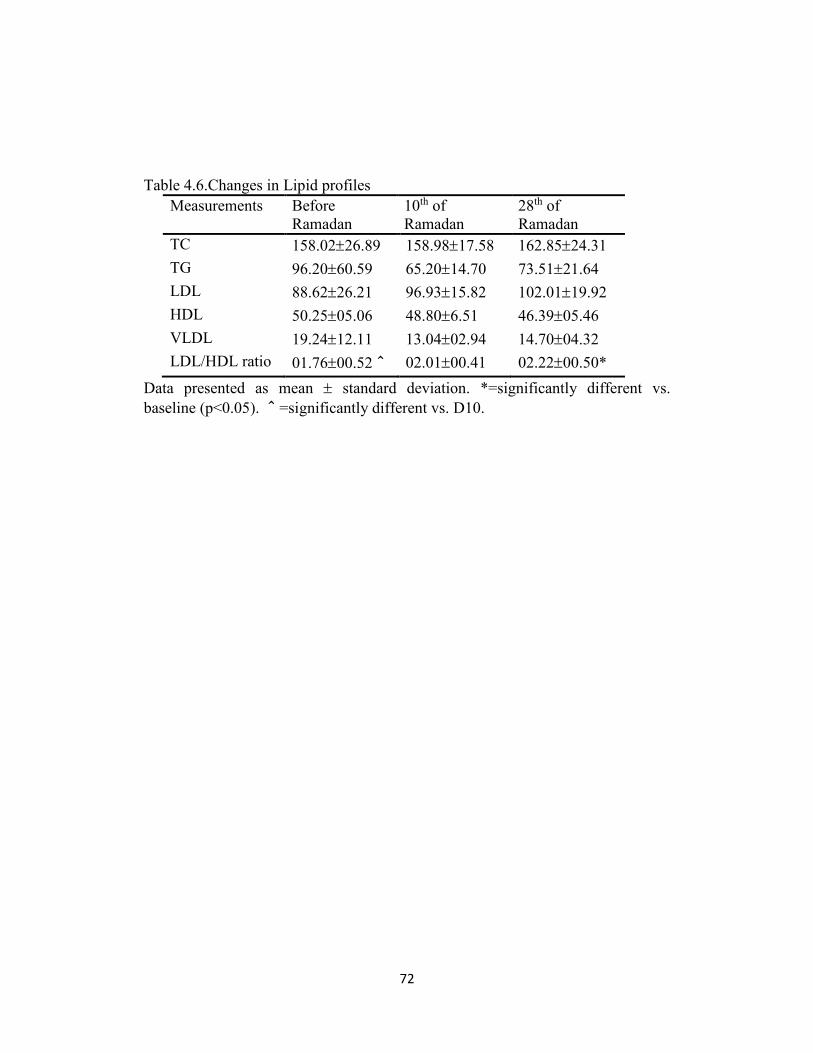
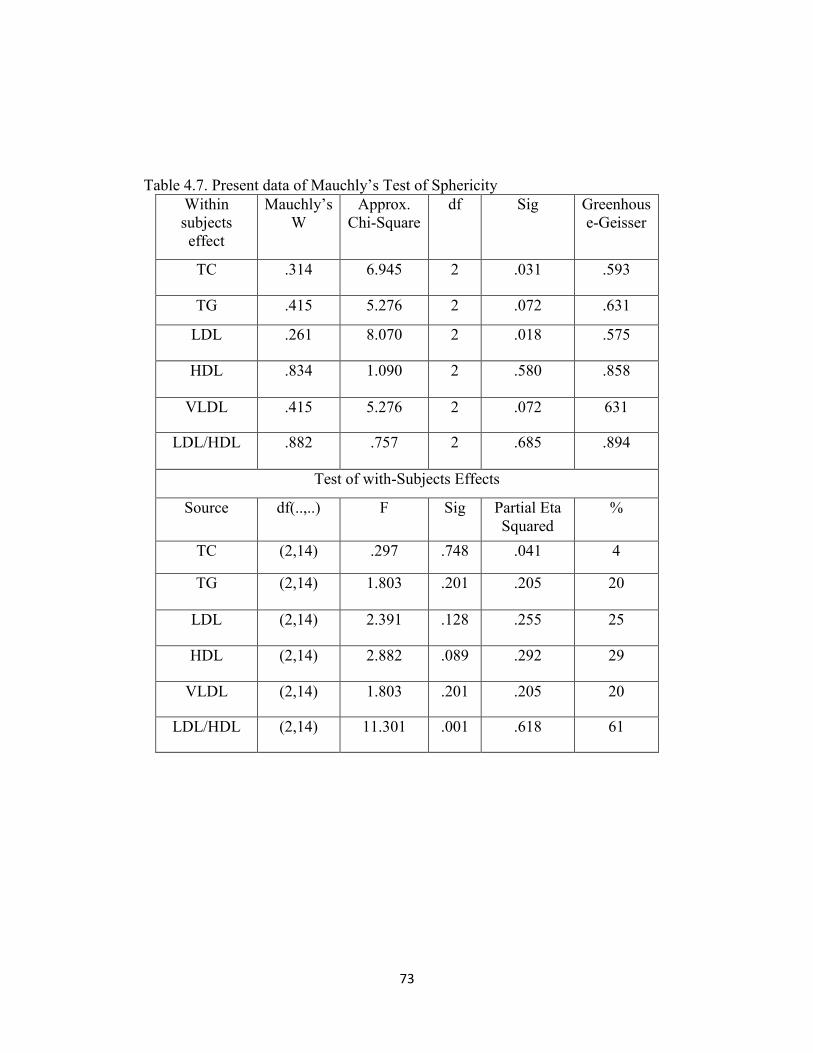
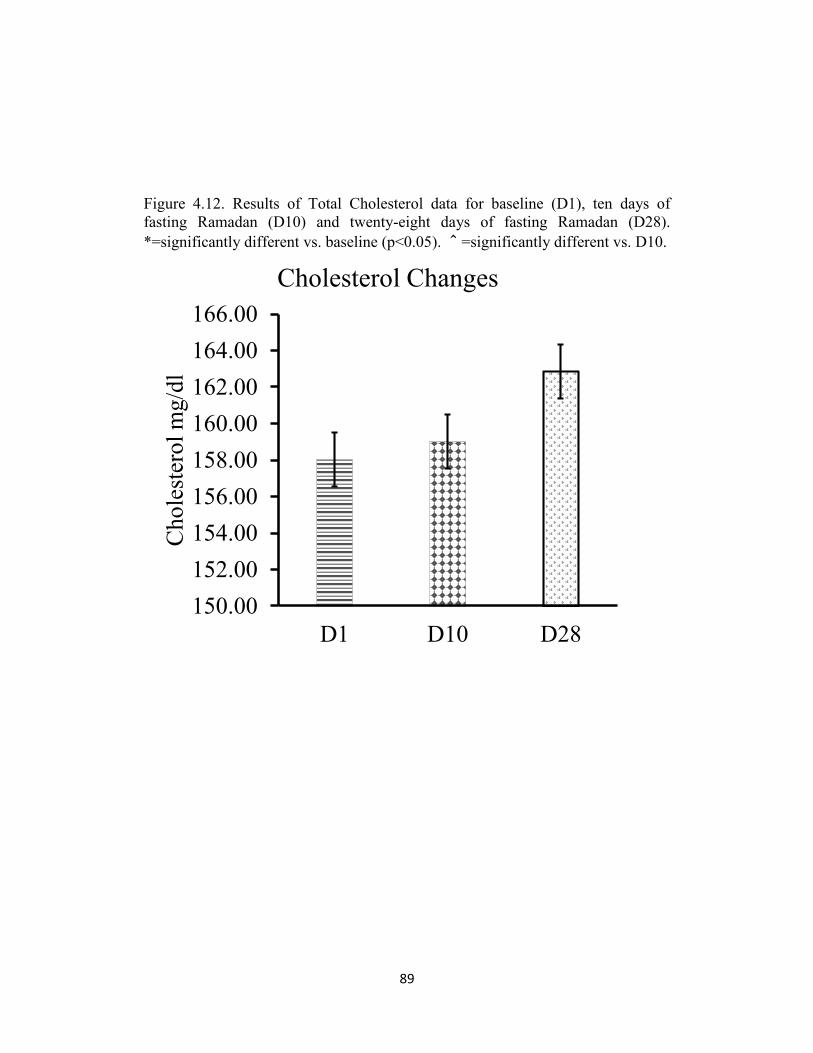
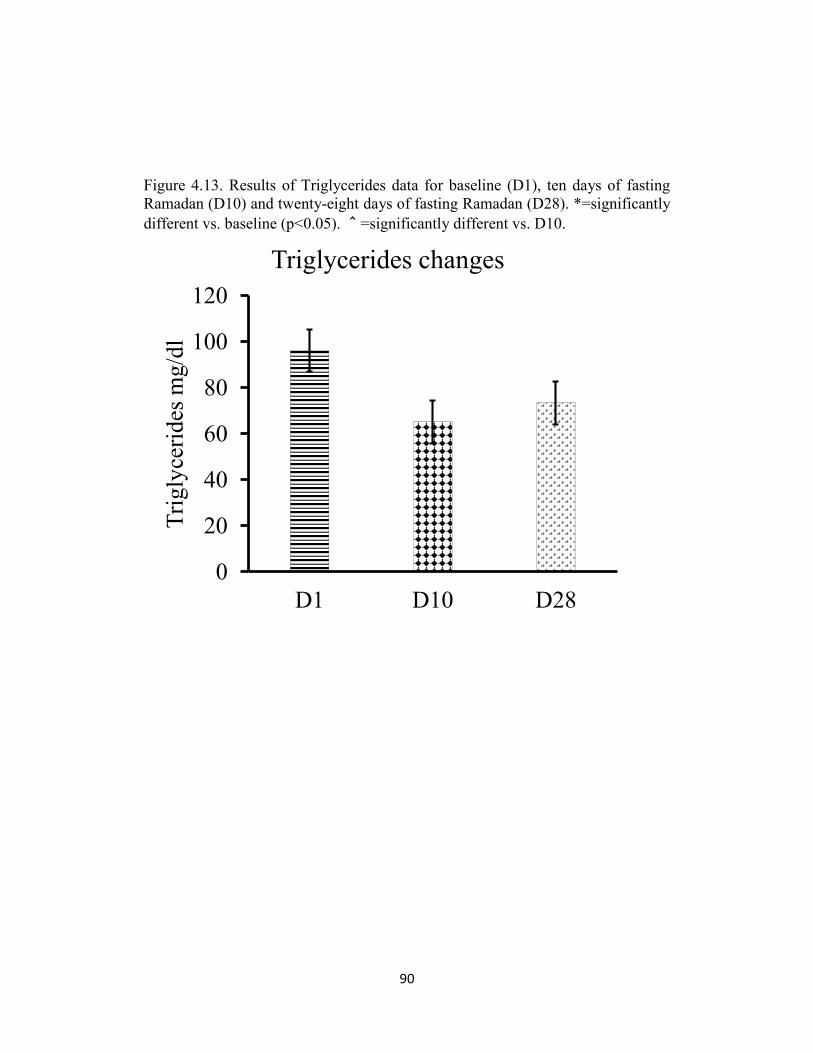
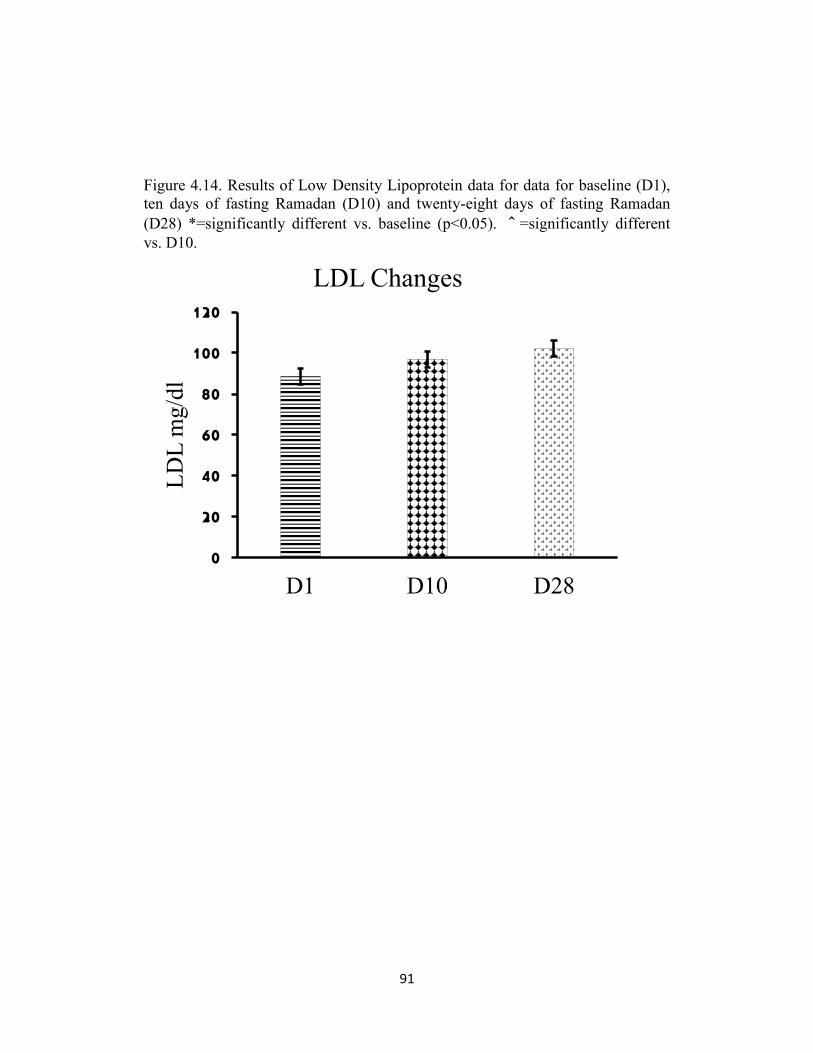
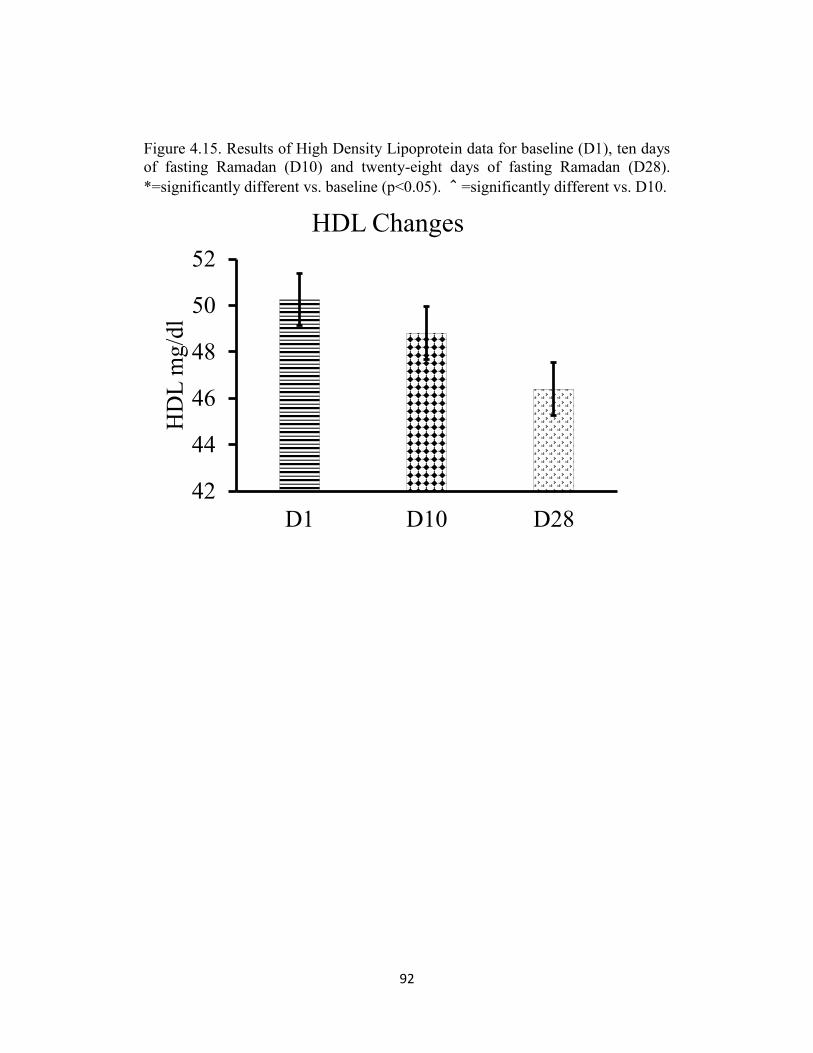
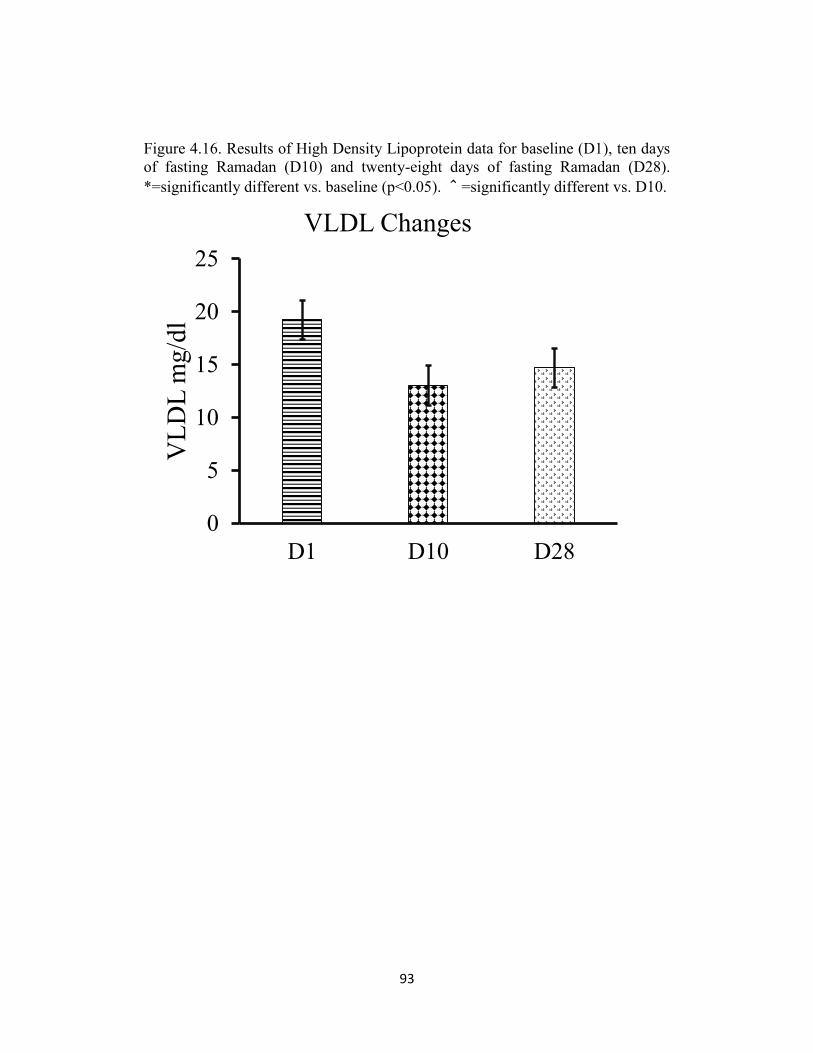
Total cholesterol, Triglycerides, LDL, HDL and VLDL did not show significant
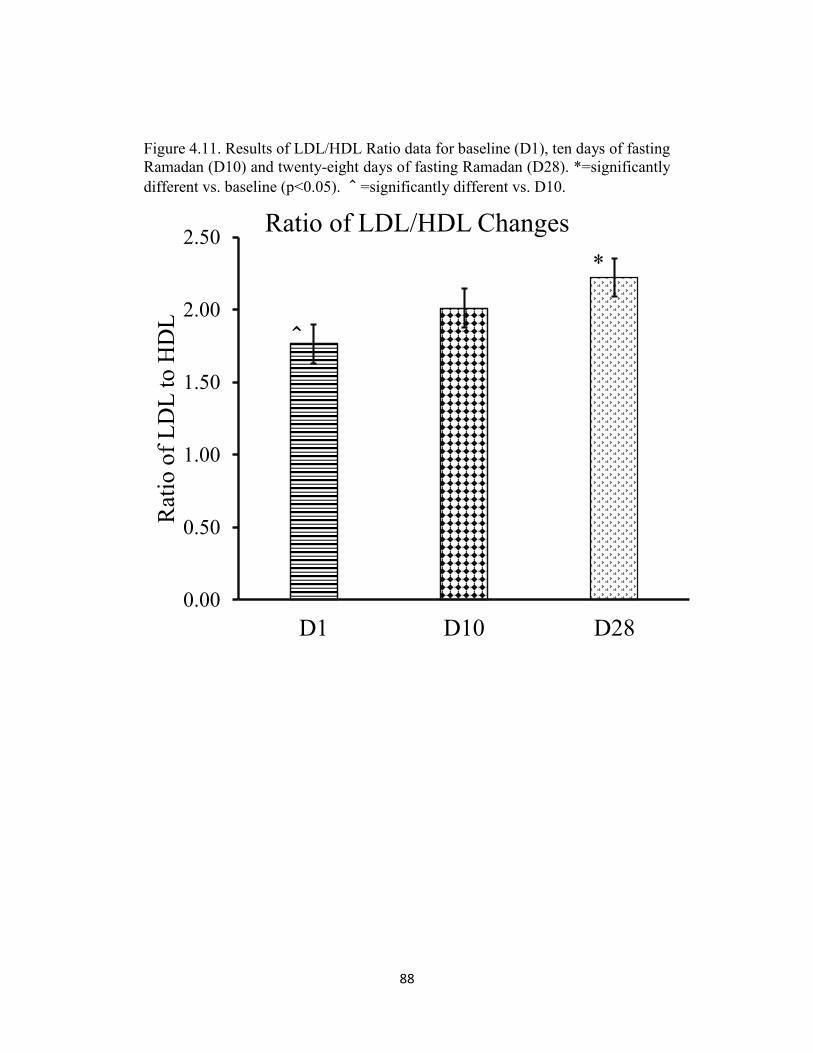
differences. However, the ratio of LDL to HDL was significantly increased at Day
10 (p= 0.021) and at the end of fasting Ramadan (p= 0.004) compare to baseline.
Page 4
iii
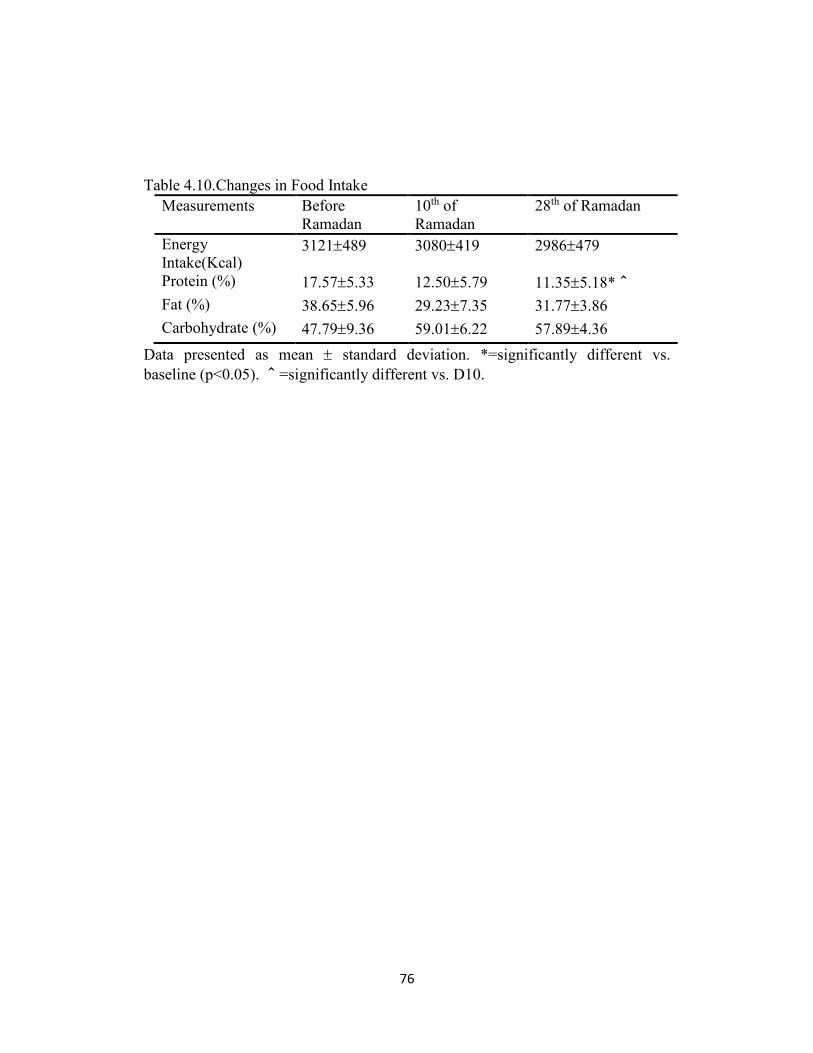
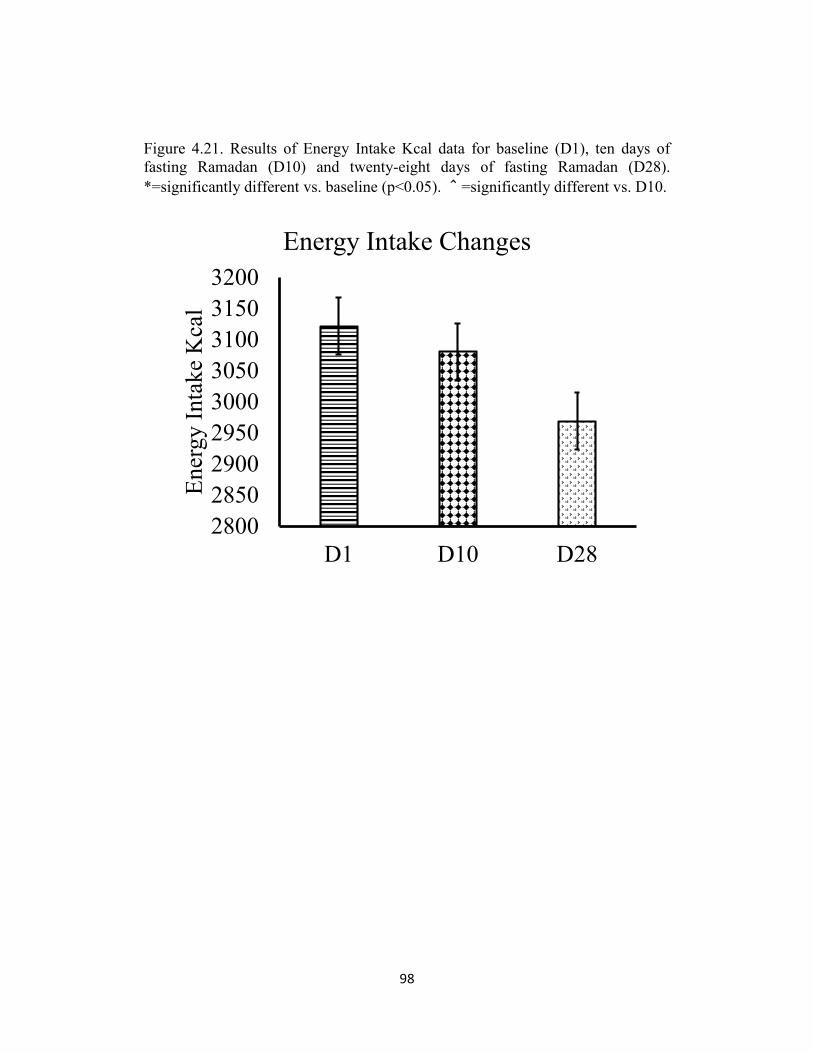
Energy intake showed no significant differences overall across the three times of
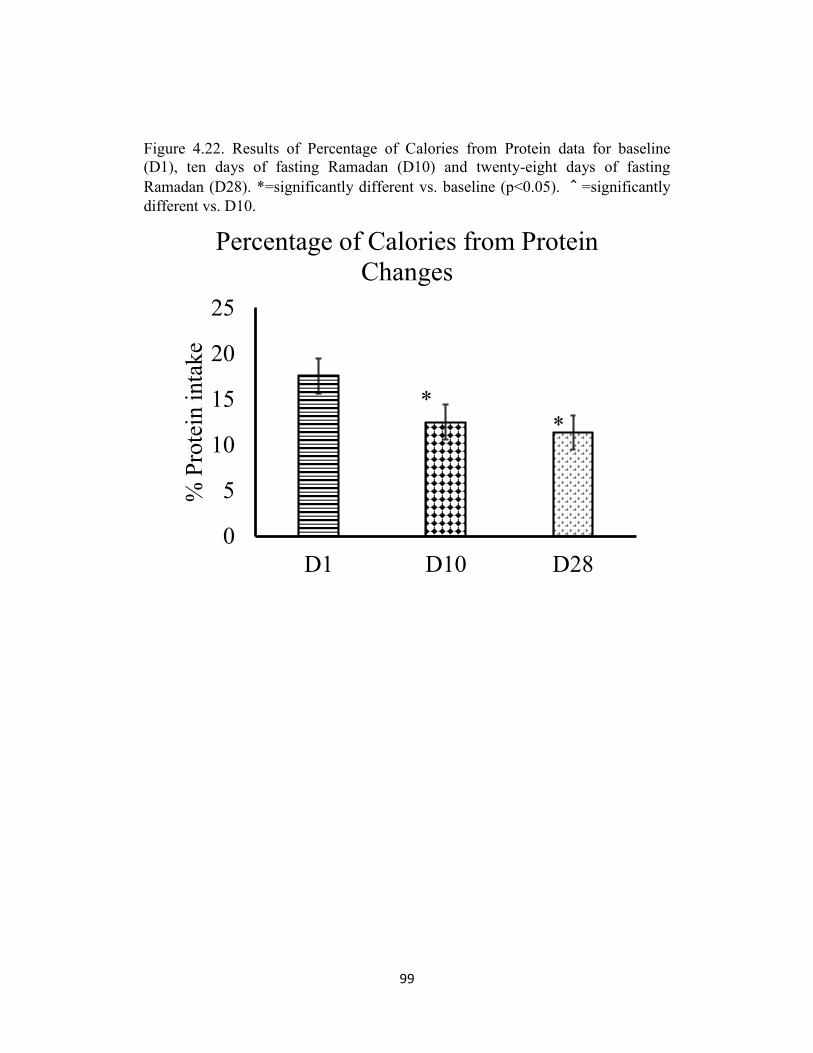
testing. However, the percentage which recommended dietary allowances of
calories from protein showed significant decrease at Day 10 and Day 28 of
Ramadan compare to the baseline (D1=17.57 %, D10 =12.50 % and D28 =11.35
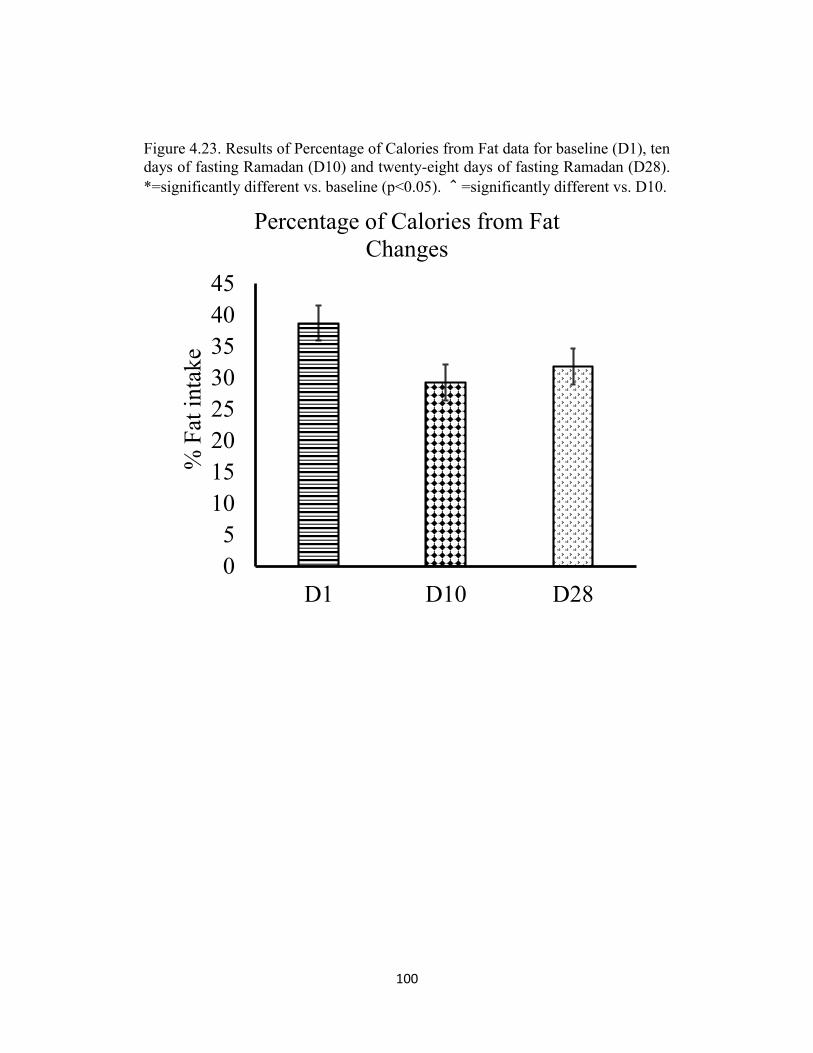
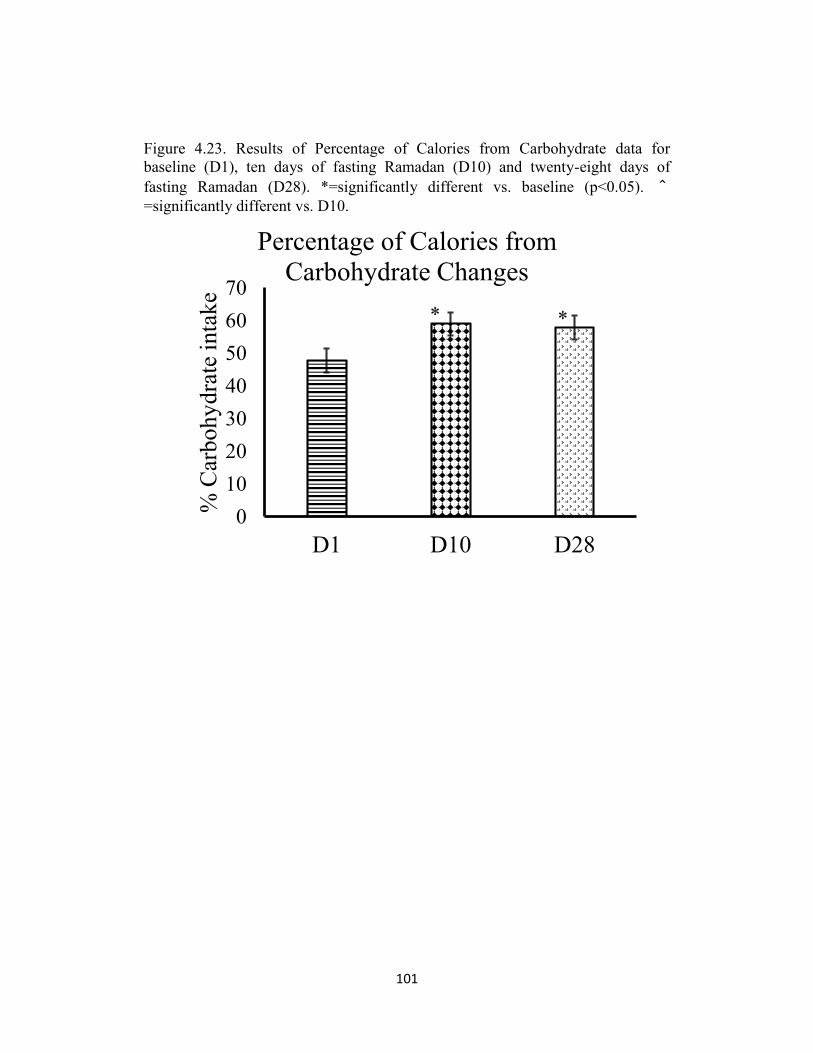
%). In addition, the percentage of calories from carbohydrate showed significant
increase at Day 10 and Day 28 of Ramadan compare to the baseline (D1 =47.79
%, D10 =59.01 % and D28 =57.89 %). Whereas, there were no significant
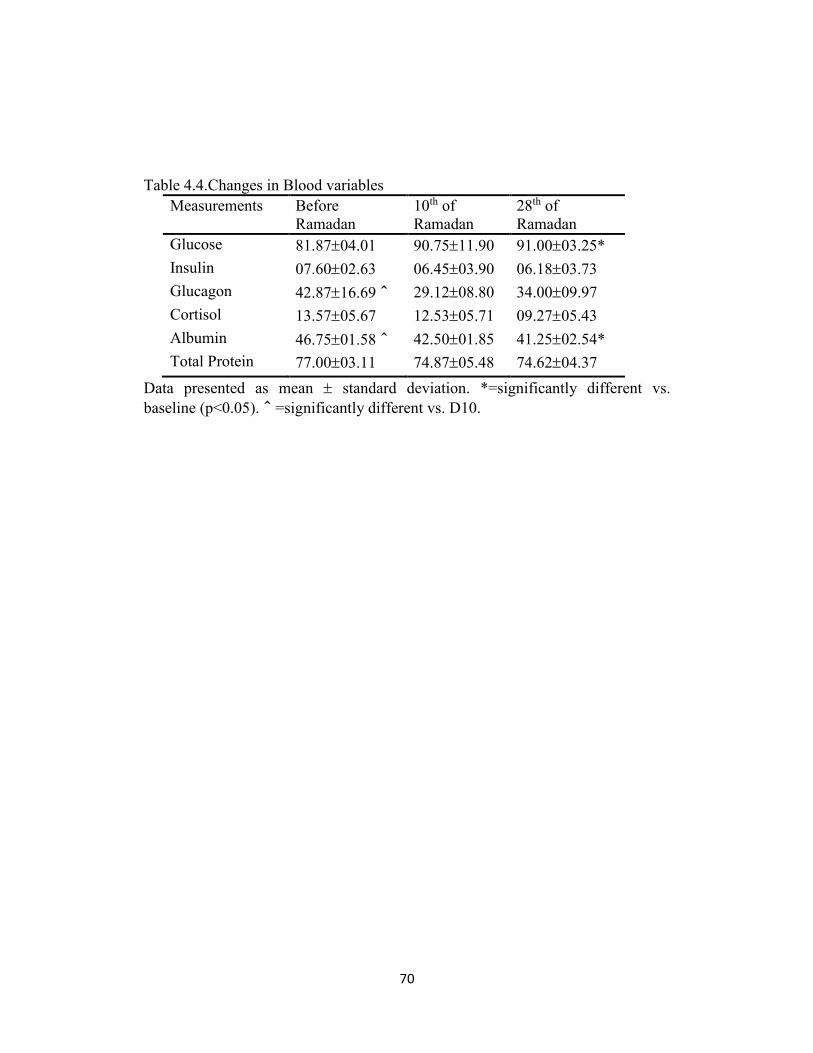
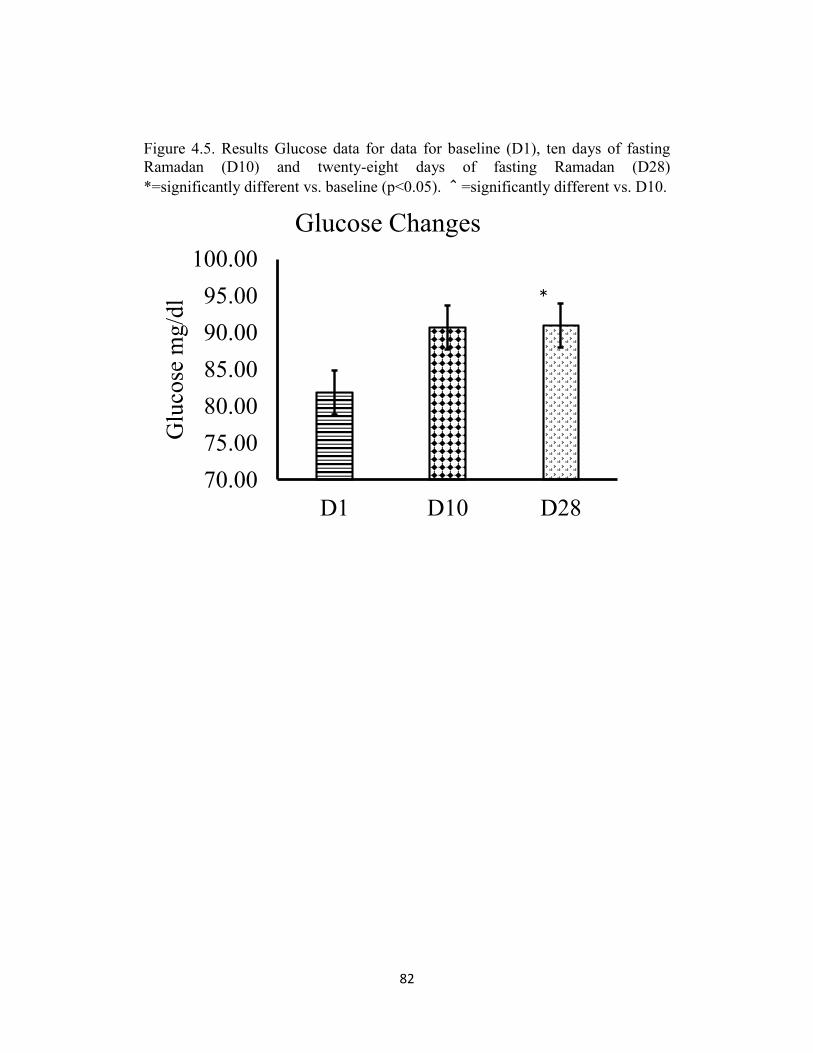
changes in calories from fat. Fasted Glucose levels were significantly increased at
D 10 but not at the end of Ramadan compare to the Pre-Ramadan p=0.001.
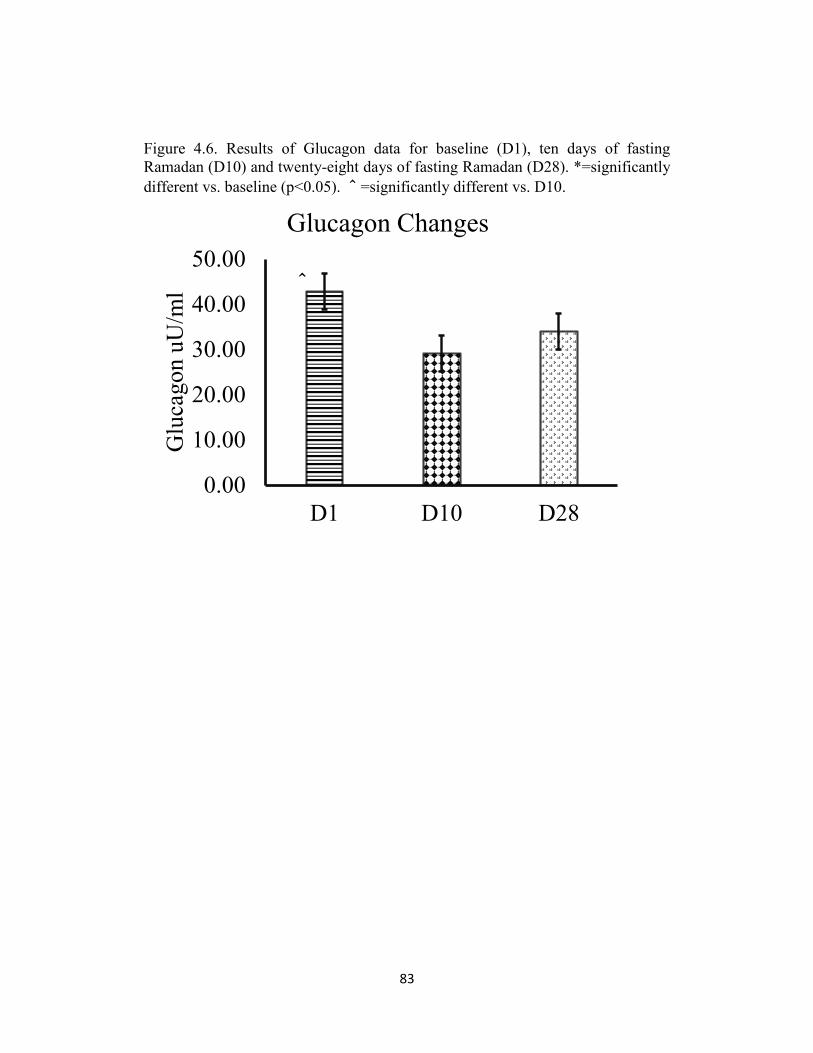
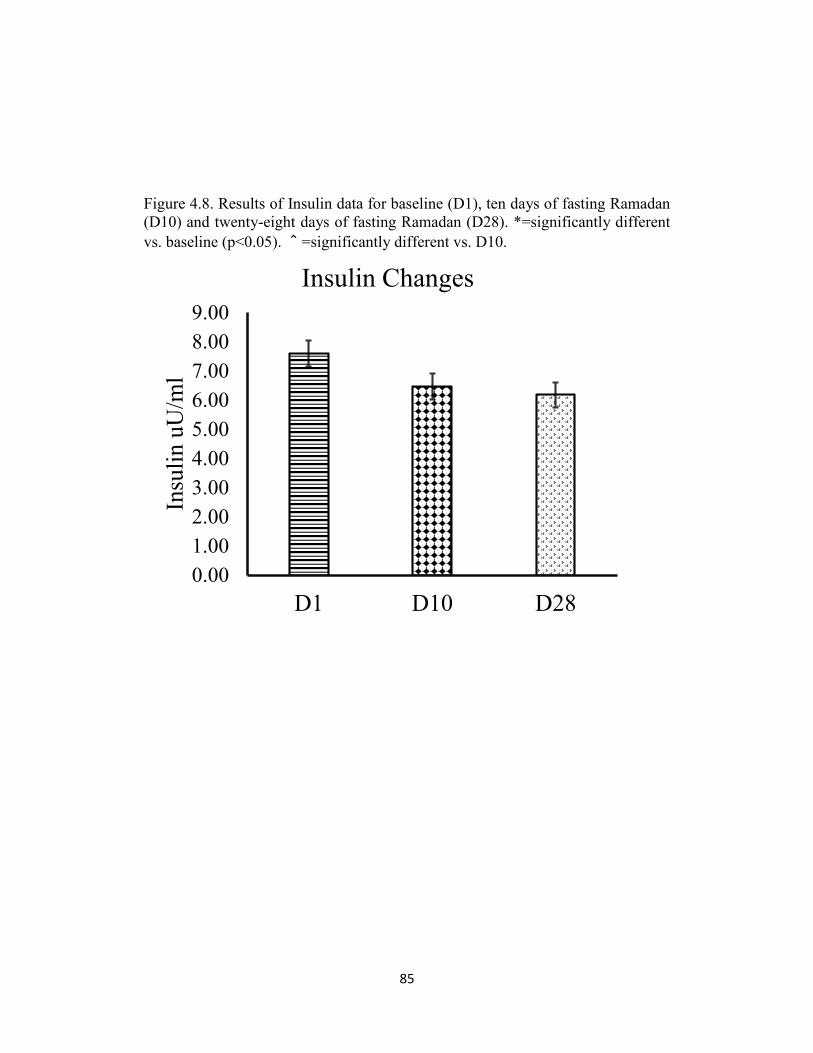
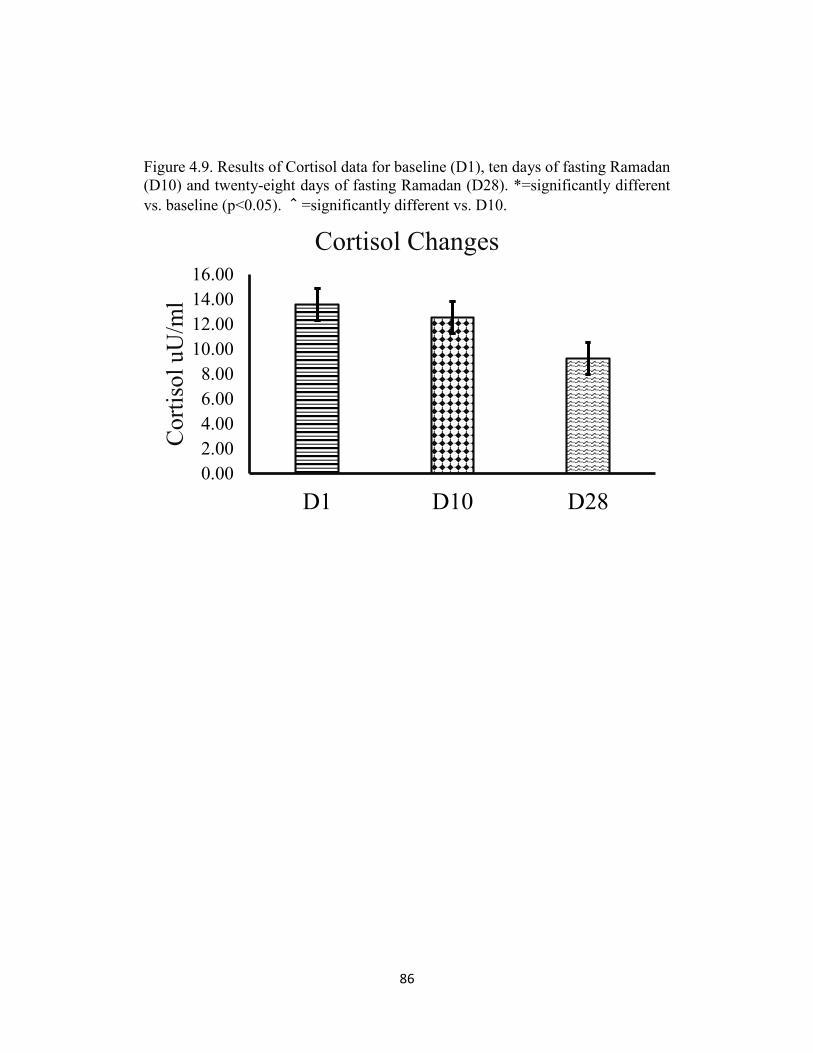
Insulin and Cortisol did not change significantly at all measures. However,
Glucagon decrease significantly after ten days of intermittent fasting and returned
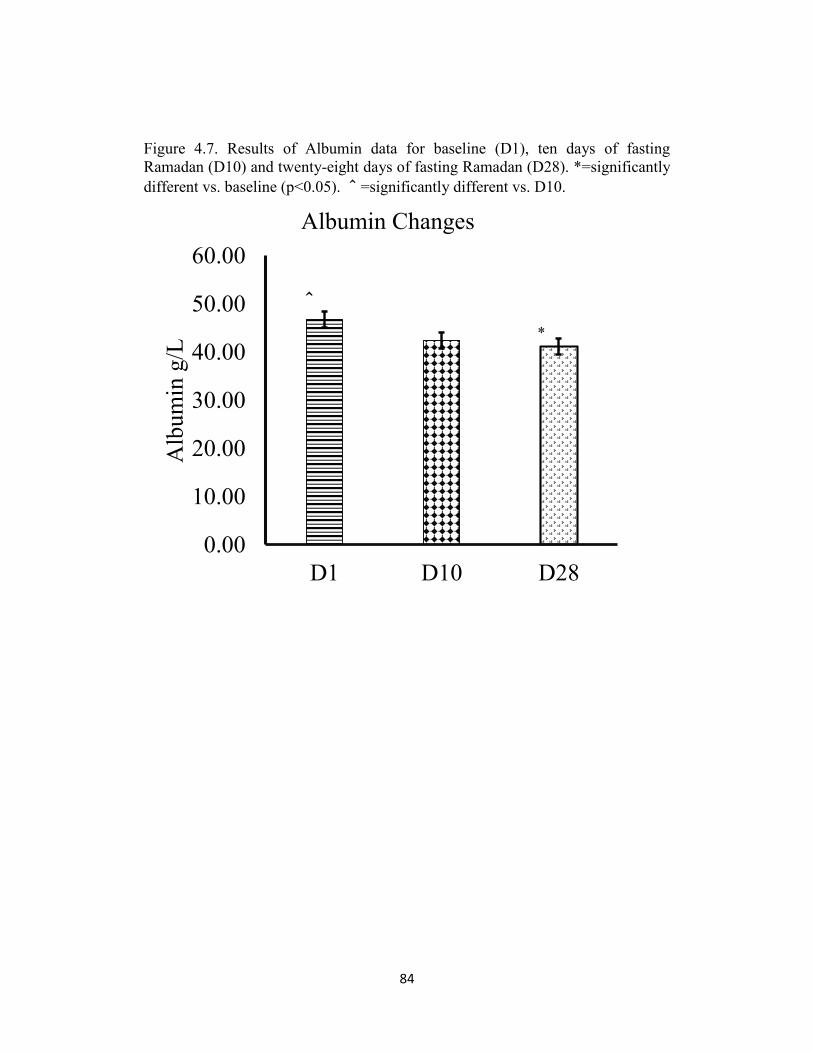
back closer to the Pre-Ramadan at the end of Ramadan. In addition, Albumin
levels were significantly lower at Day 10 and Day 28 of Ramadan compare to
baseline; however, Albumin levels were still within normal/health range.
Conclusion: These results show the level of physical activity and food intake are
major contributing factors on the reduction in body weight specifically the lean
body mass. Overall, these findings indicate no health risk for fasting during the
month of Ramadan.
Key Words: Ramadan, Intermittent fasting, Lipid profiles, Anthropometrics,
hormones
Page 5
iv
Dedication
Dedicate this important professional achievement to the soul of my wonderful
deeply missed Mother. Inexpressible how much I wish she were still with us
Page 6
v
ACKNOWLEDGMENTS
I would like to take this opportunity to thank several people who helped
and supported me during the difficult time while I have been completing my PhD
degree. I would like to thank my family for continually encouraging,
understanding and for helping me to reach my goals while far away from home.
Specifically, my mother who died last July 2013, the most painful loss I have ever
experienced and no amount of acknowledgement will remove that pain. I would
like to express my deepest gratitude to my wife, Muneera Abdullah for her
patience and tolerance for being with me and for her appreciated sacrifices. Thank
you my kids (Wajd, Numai, Luai and Qusai) your presence was enough to give
me a tremendous support. My completion of this degree could not have been
accomplished without the support of my Father, brother in law, Mahdi Alayafi
and all of my sisters and brothers.
I would like to thank my advisor Dr. Philip Gallagher for his valuable
advice and support. Not only did he teach me meaningful lab techniques, but he
also gave me confidence in handling experiments on my own. I really appreciate
his kindness and friendship. He taught me how to be always optimistic, even in
the dark.
Finally yet importantly, I would like to extend my special thanks to my
committee member, Dr. Andrew Fry, Dr. Leon Greene, Dr.Phillip Vardiman and
Page 7
vi
Dr. David Hanson; words are not enough to thank you for your guidance and
encouragement.
In addition, I wholeheartedly thank to Prince Nawaf Bin Faisal, the
president of the Saudi Arabian Olympic Committee, who supported and funded
the study and I have no words to express my gratitude for Dr. Majed Alsulaiman,
Orthopedic and Sport Medicine Consultant, for his counsels and support
throughout the time of doing the study in Prince Faisal Bin Fahad Hospital.
Thanks to all faculty members of the University of Kansas who have provided me
knowledge, guidance, and encouragement. I wish to thank all of my friends for
their wonderful friendship during my time in the United States of America. I
appreciate the help of my friends and colleagues. Finally, I would like to thank the
subjects who have participated in this study.
Page 8
vii
TABLE OF CONTENTS
Abstract.........................................................................................................ii
Dedication
………………………………………..…………………………...….. iv
Acknowledgements........................................................................................v
List of Tables and Figures...........................................................................ix
Abbreviations...............................................................................................xi
Chapter I Introduction.................................................................................1
General Background.......................................................................5
Statement of the Problem................................................................4
Hypothesis.......................................................................................5
Significance of the study.................................................................6
Chapter II Review of Literature...................................................................7
Body weight and Body fat during fasting Ramadan …………..……7
Lipid profile and fasting of Ramadan……………..…………..…15
Blood Proteins and Hormones during fasting Ramadan………....28
The physical performance of Muslim athletes during Ramadan...42
Chapter III Methods & Procedures…………………..…...........................45
Participants ..……………………………….......................................45
Procedures...........................................................................................45
Blood analysis………………………..……………...........................47
Statistic analysis.................................................................................48
Chapter IV Results........................................................................................49
Subject characteristics……………………………............................49
Body composition….……..................................................................49
Glucose, Blood Proteins and Hormones…………..…………….......53
Lipid Profiles......................................................................................57
Physical Activity ……………………..…………..…………….......60
Page 9
viii
Food Intake …… ……………………..…………..…………….......64
Tables and figures..............................................................................67
Chapter V Discussion..................................................................................102
Introduction......................................................................................102
Body composition.............................................................................103
Blood Parameters……………………...………….…………..........104
Summary……...................................................................................106
Assumptions and Limitations……....................................................107
References....................................................................................................108
Appendices..................................................................................................105
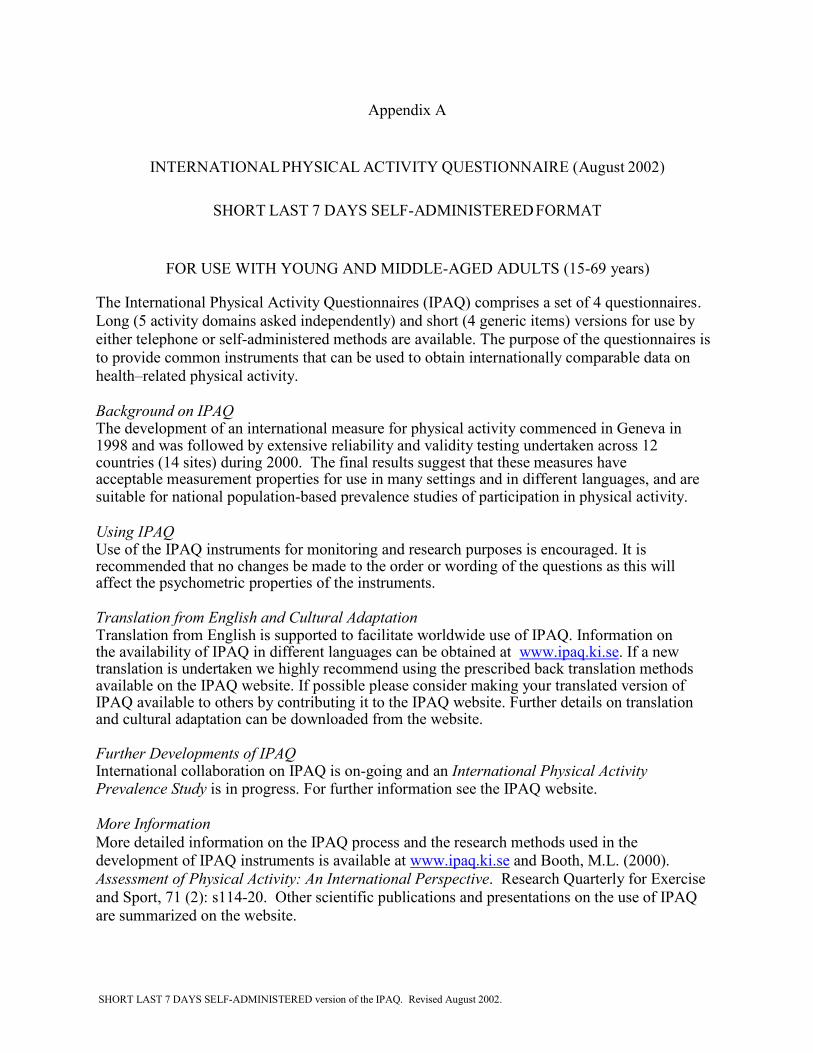
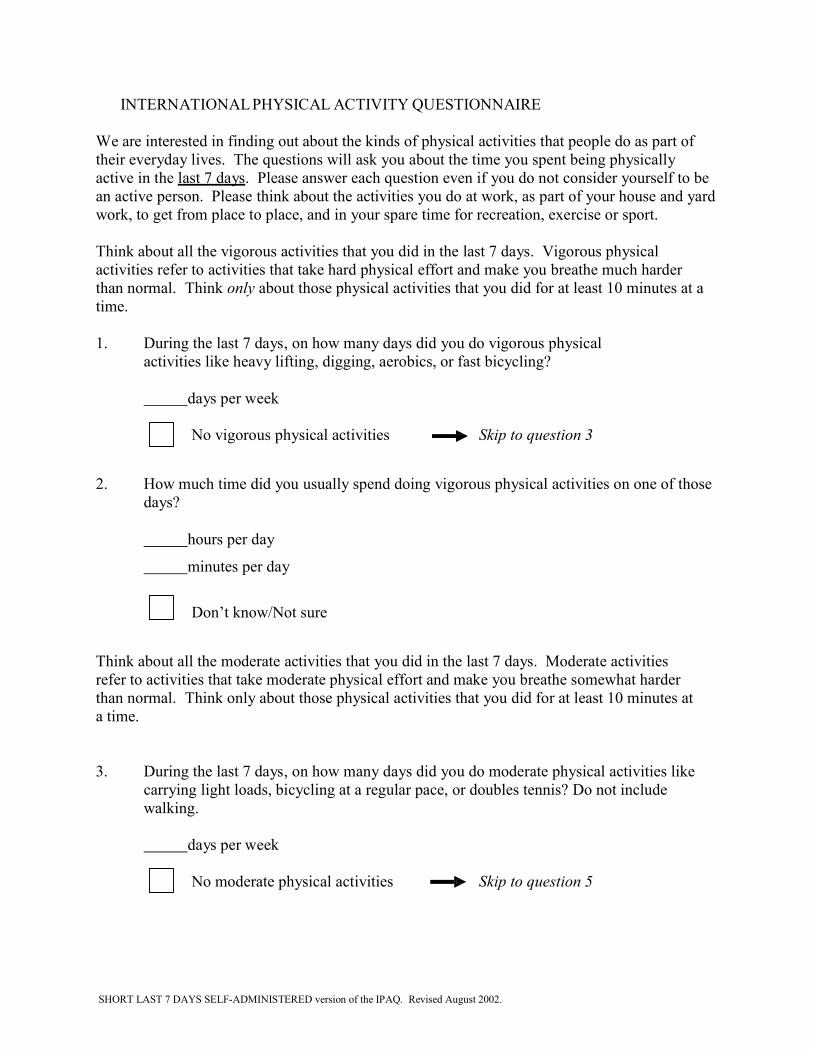
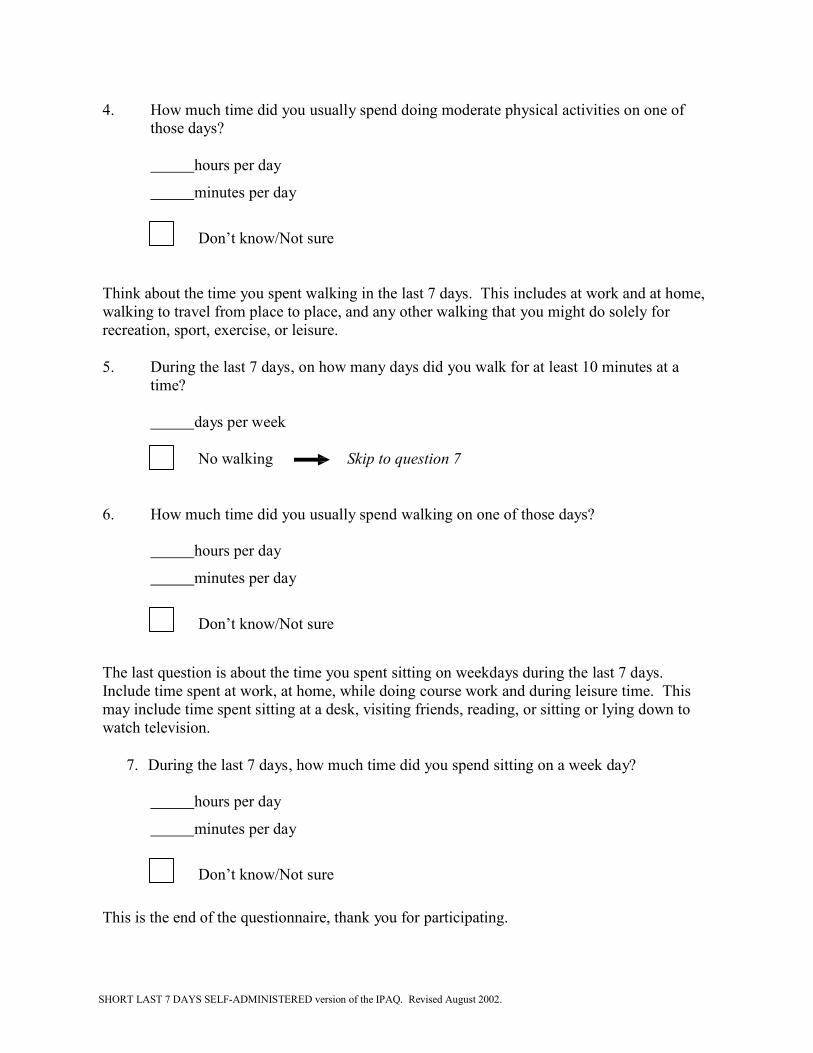
Appendix A – Physical Activity Questionnaire (GPAQ)
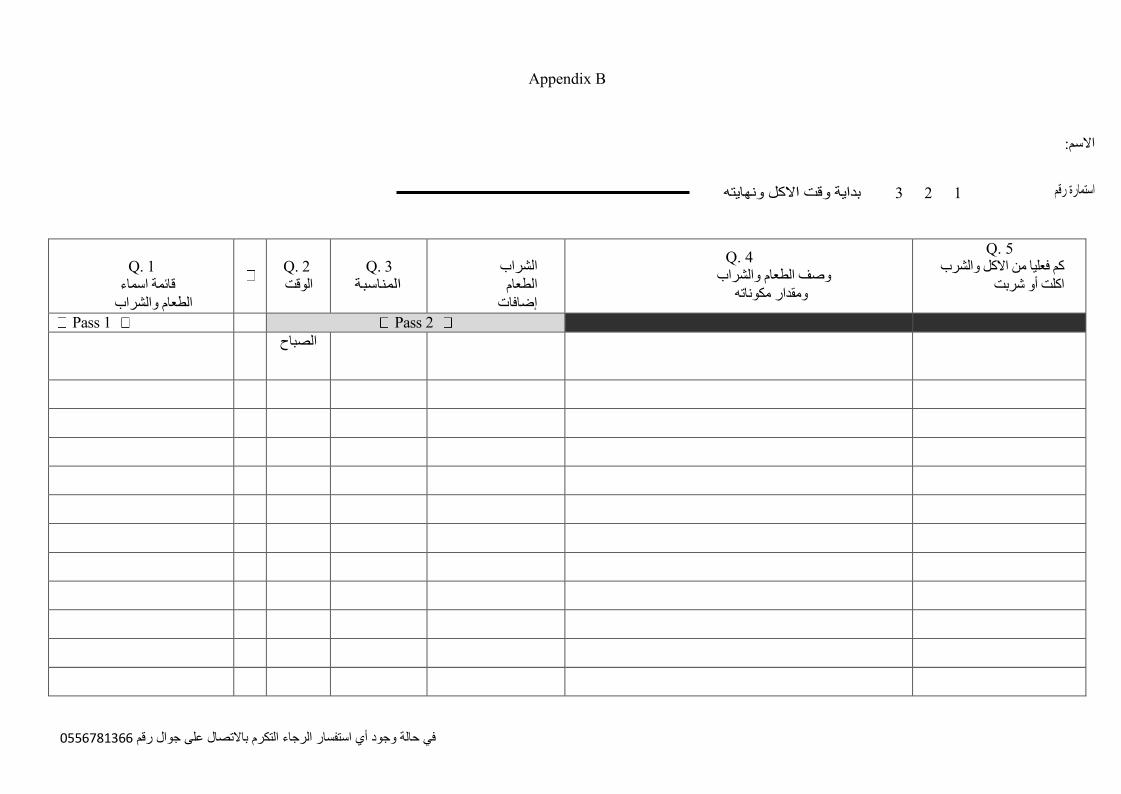
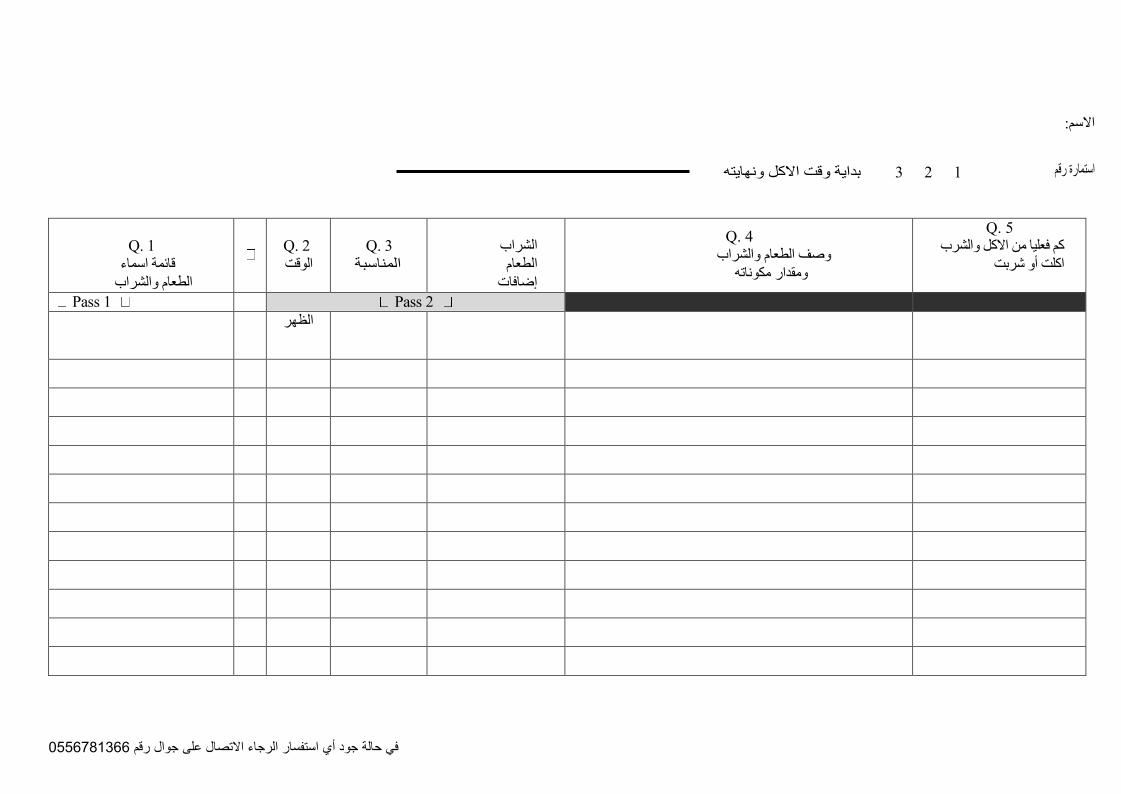
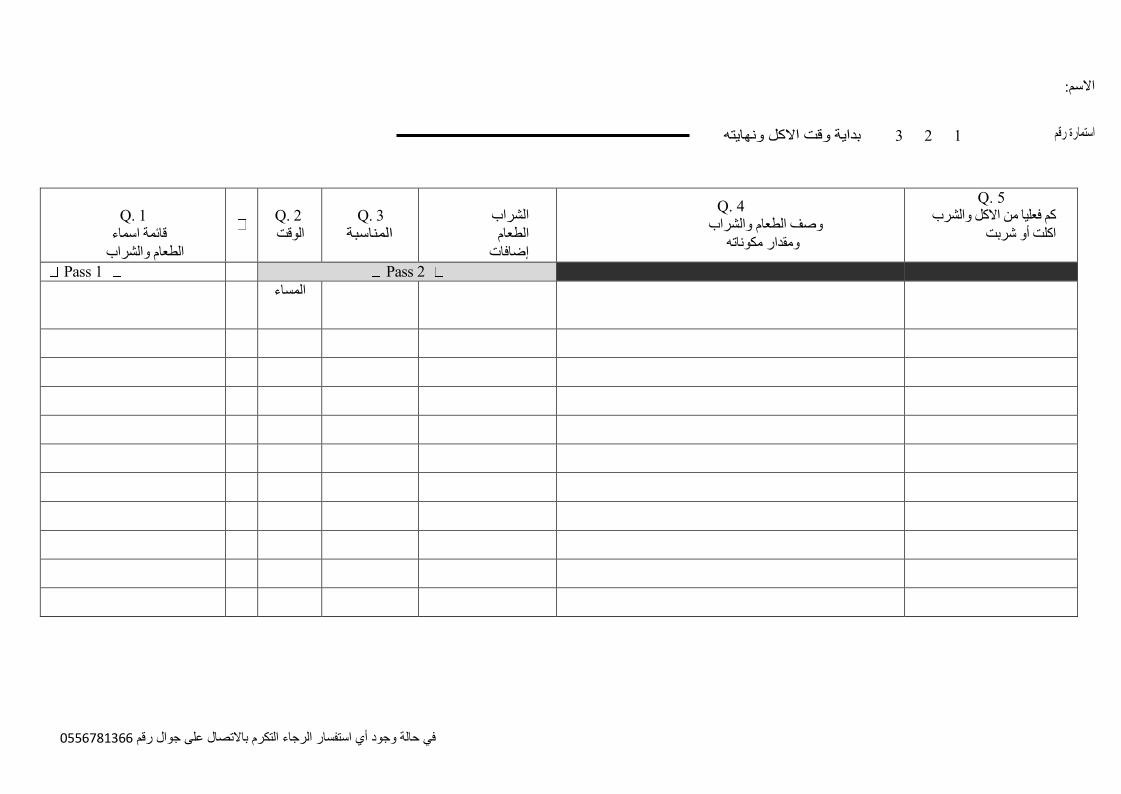
Appendix B – Food Intake Questionnaire
Appendix C – GPAQ Analysis Guide
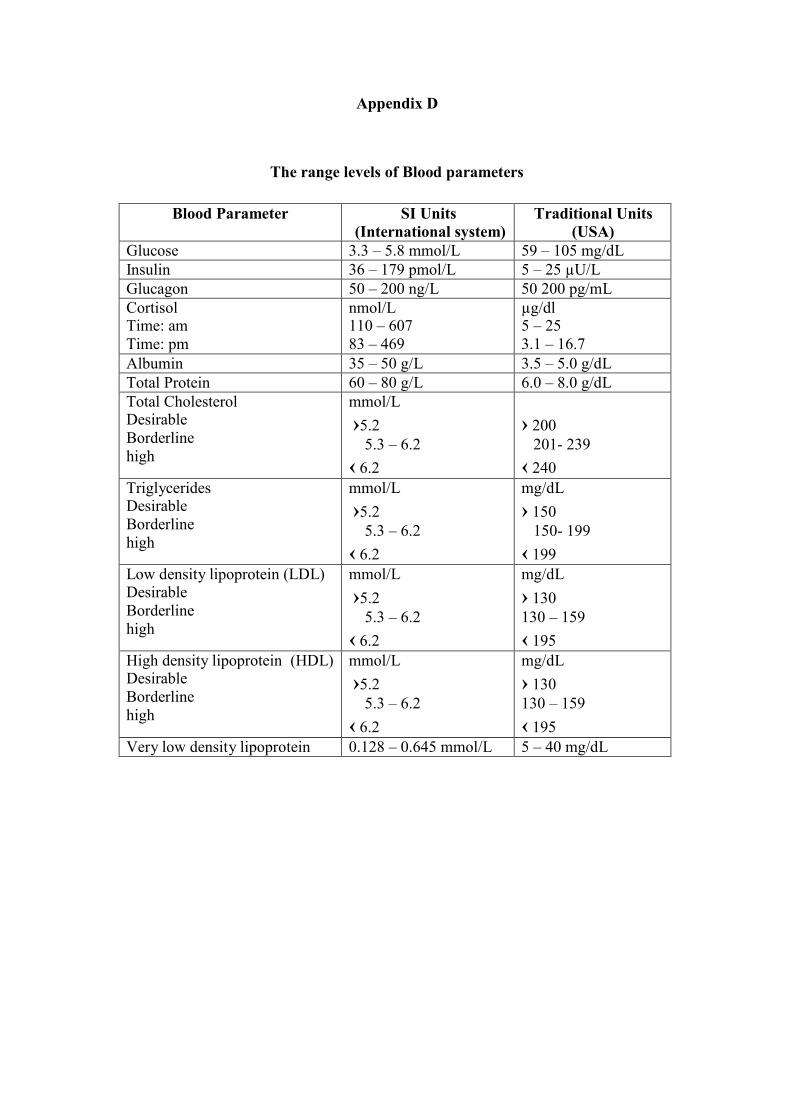
Appendix D – The Range Levels of Blood Parameters
Page 10
ix
List of Tables and Figures
List of Tables
Table 2-1 the effect of fasting Ramadan on body fat ………………………12
Table 2-2 the effect of fasting Ramadan on body weight ……………….….13
Table 2-3 the effect of fasting Ramadan on total cholesterol ………………23
Table 2-4 the effect of fasting Ramadan on LDL …………………………..25
Table 2-5 the effect of fasting Ramadan on HDL ……………………...…..26
Table 2-6 the effect of fasting Ramadan on Triglycerides ……………...….27
Table 2-7 the effect of fasting Ramadan on Glucose …………………...….39
Table 2-8 the effect of fasting Ramadan on Creatinine ………………...…..41
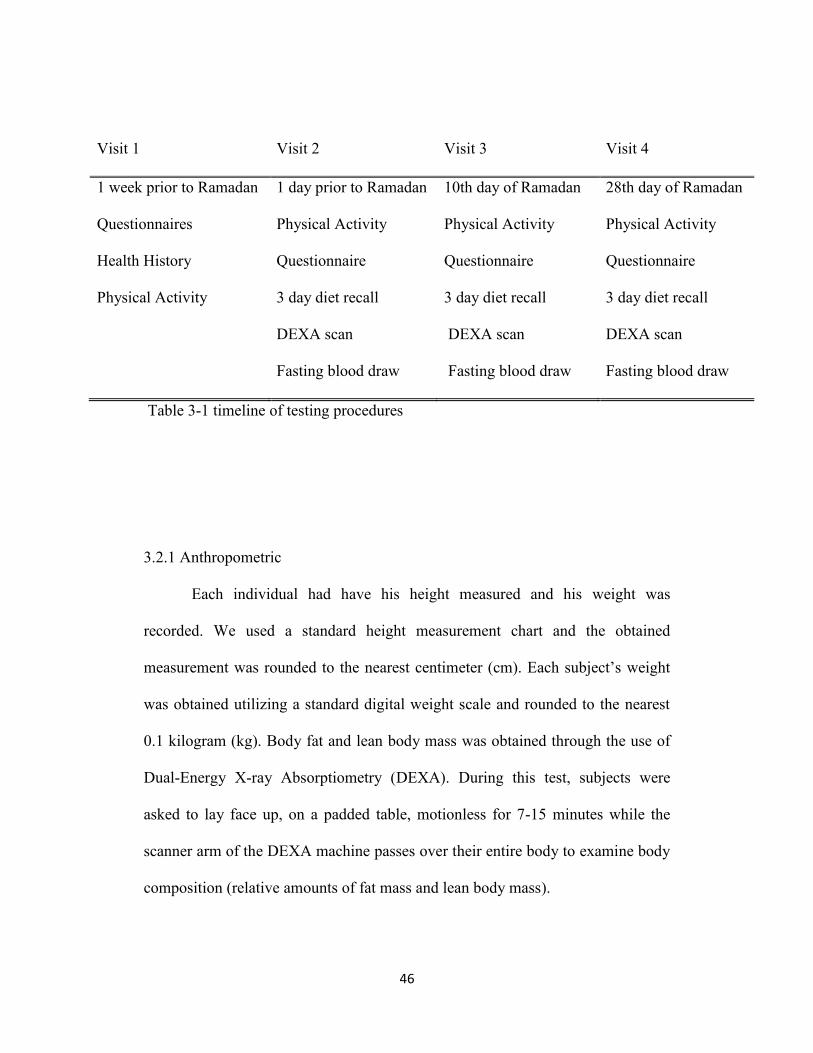
Table 3-1 time line of testing procedures…….………………………..……46
Table 4-1 subject characteristics ……………………………………………67
Table 4-2 changes in body composition …………………………...……….68
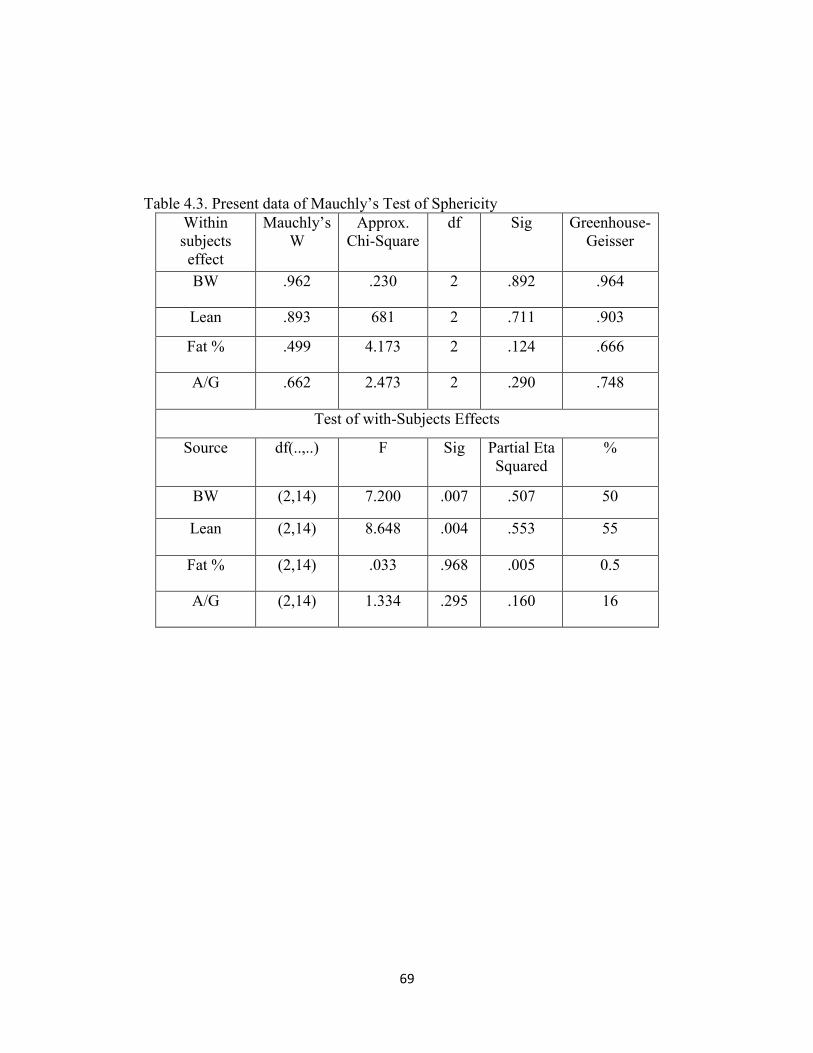
Table 4-3 data of Mauchly’s test of sphericity ……………………..………69
Table 4-4 changes in blood variables ………………………………..……..70
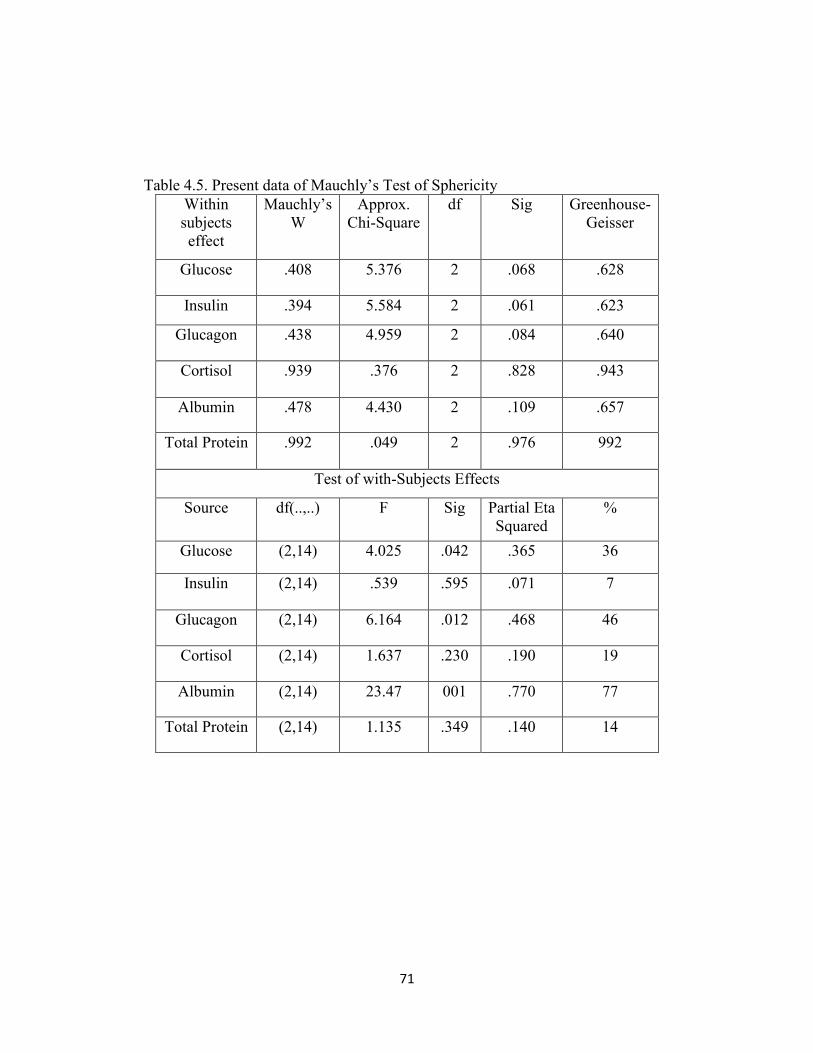
Table 4-5 data of Mauchly’s test of sphericity ………………………..……71
Table 4-6 changes in lipid profiles …………………………………..……..72
Table 4-7 data of Mauchly’s test of sphericity ……………………………..73
Table 4-8 changes in physical activity levels ………………………..……..74
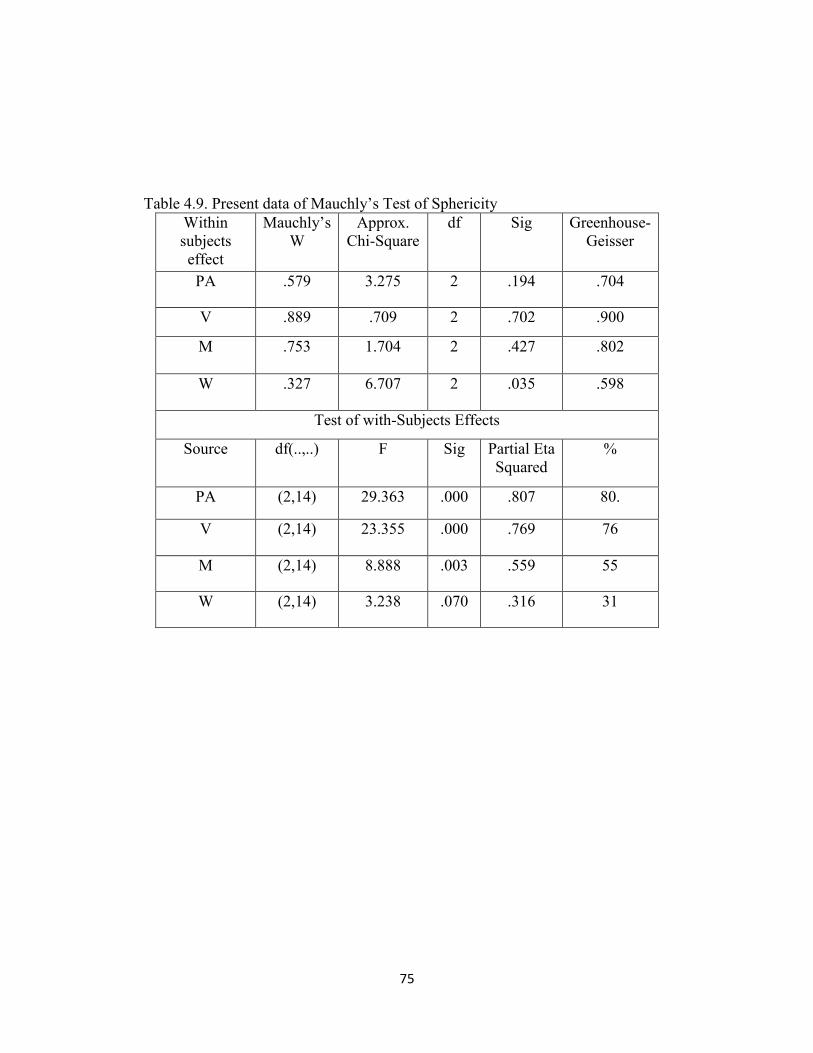
Table 4-9 data of Mauchly’s test of sphericity ……………………..………75
Table 4-10 changes in food intake ……………………………………...…..76
Table 4-11 data of Mauchly’s test of sphericity ……………………..……..77
Page 11
x
List of Figures
Figure 4-1 body weight changes ……………...………………………….....78
Figure 4-2 Lean body mass changes …………..…………………………....79
Figure 4-3 Body fat percentage changes ……….………….………………. 80
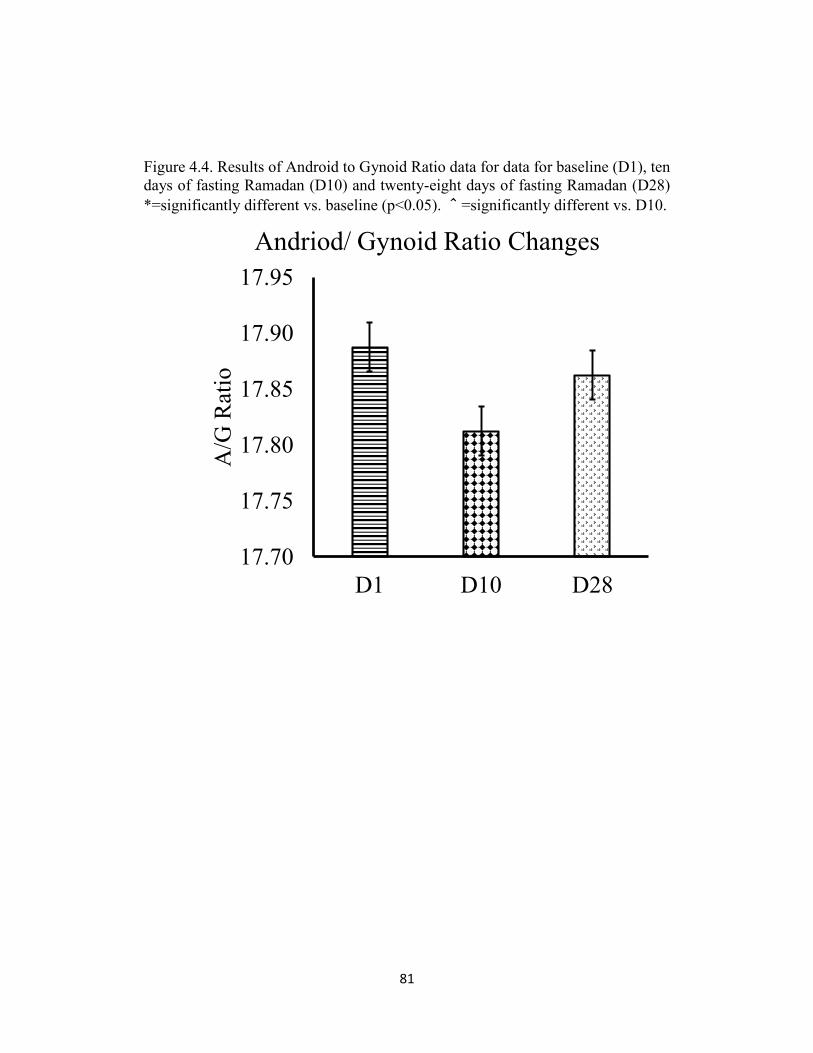
Figure 4-4 Andriod / Gynoid ratio changes ……....………….……………..81
Figure 4-5 Glucose Changes ……………………….………….…………....82
Figure 4-6 Glucagon changes …………………………..…………………..83
Figure 4-7 Albumin changes ………………………………………...….…..84
Figure 4-8 Insulin Changes …………………………………………...…….85
Figure 4-9 Cortisol changes ………………….…………………………..…86
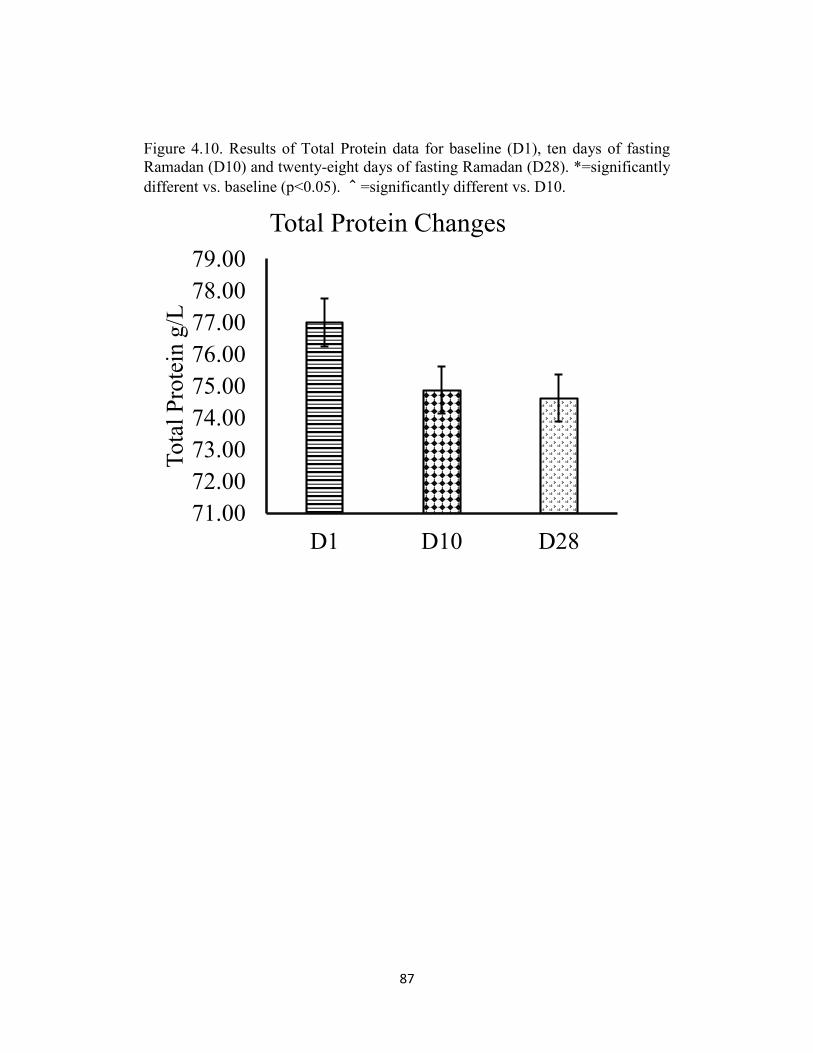
Figure 4-10 Total Protein changes .........… …………………….…….…….87
Figure 4-11 Ration of LDL to HDL changes ……………………...………..88
Figure 4-12 Cholesterol changes ……………………………………..…….89
Figure 4-13 Triglycerides changes ……………………………….….……..90
Figure 4-14 Low density lipoprotein changes …………………..………….91
Figure 4-15 High density lipoprotein changes ………………………..…….92
Figure 4-16 Very low density lipoprotein changes ……………………..…..93
Figure 4-17 Physical activity changes ……………………………..……….94
Figure 4-18 Vigorous Physical Activity changes …………………….…….95
Figure 4-19 Moderate Physical Activity changes …………………….…….96
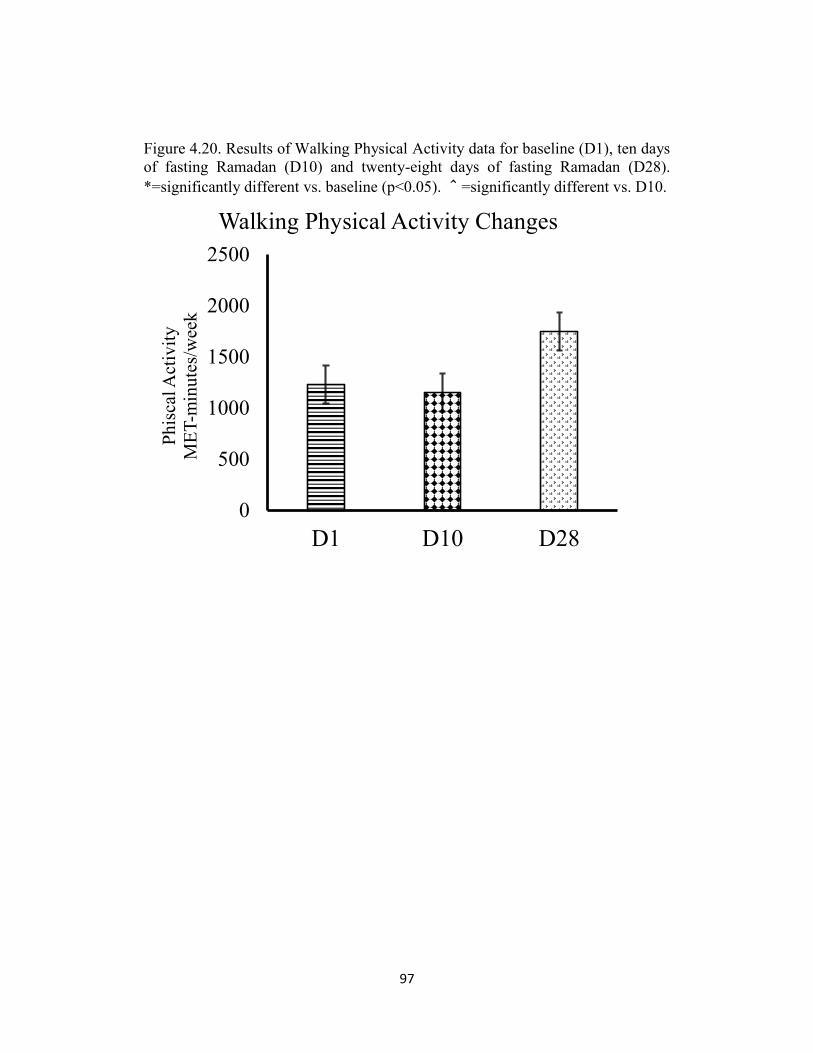
Figure 4-20 Walking Physical Activity changes ………………….….….…97
Figure 4-21 Energy intake changes ………………………………..………..98
Figure 4-22 Percentage of calories from protein changes ………....…….…99
Figure 4-23Percentage of calories from fat changes ……………...……….100
Figure 4-24 Percentage of calories from carbohydrate changes …..…..…..101
Page 12
xi
ABBREVIATIONS
A Activity
AR Test was taken after Ramadan
BW Body Weight
CC% Percentage of Calories from Carbohydrate
CP% Percentage of Calories from Protein
CF% Percentage of Calories from Fat
F Subjects were female
F,M Subjects were female and male
HDL High density lipoprotein
LDL Low density lipoprotein
LDL/HDL Ration of LDL to HDL
M Subjects were male
nW Subjects were normal
oW Subjects were overweight
S Sedentary
TC Total Cholesterol
TG Triglycerides
uW Subjects were underweight
VLDL Very low density lipoprotein
Page 13
1
CHAPTER I
INTRODUCTION
Ramadan is the ninth lunar month in the Islamic calendar and Muslims all
over the world fast each day of this month from sunset to sunrise. All adults
participate with the exception of those who cannot i.e., persons that are traveling,
menstruating, pregnant or nursing women, and others with a medical condition
that would preclude fasting. During fasting, Muslims abstain from eating,
drinking and sexual encounter.
In 2012 was the first time that Muslim athletes competed in the Olympic
games during Ramadan; could that cause a major disadvantage for these athletes?
Research on the effect of fasting Ramadan on athletic performance will be the
subject of major scientific interest in the future.
Several studies have been conducted on the effect of fasting the month of
Ramadan on body weight, Glucose levels, and hormone levels. A few studies
showed either an increase (Forst and Priani 1987, Nagra et al 1998, Meckel et al
2008) or no changes in body weight during the month of Ramadan (Lamari-
Senhadji et al 2009); but most studies show that fasting during Ramadan reduced
body weight (Muazzam and Khaleque 1959, Fedail et al 1982, Husain et al 1987,
Sweileh et al 1992, Afrasiobi et al 2002, Rahman et al 2004, Dewanti et al 2006,
Bouhlel et al 2008, Abedelmalek et al 2011, Trabelsi et al 2012). A study by
Leiper and others (2003); believed these body mass losses were mainly due to a
Page 14
2
decrease of glycogen-bound water stores, in addition to a loss in body tissue
specifically muscle mass.
Studies by Nagra et al (1998), Sulieman et al (1982), Sarraf-Zadegan et al
(2000), Halack et al (1988), Aldouni et al (1997), Temizhan et al (2000), Dowod
Tahm (2004), and Ziaee V et al (2006) reported that there was a significant
decrease in LDL cholesterol while a significant increase in HDL cholesterol were
reported by Maslos et al (1993), Aldouni et al (1997), Temizhan et al (2000),
Afrasiabi et al (2002), and Rahman et al (2004). High blood cholesterol has long
been considered a health factor in cardiovascular disease. These studies show that
fasting during Ramadan may help to reduce the risks of CVD.
A few studies have shown the effect of fasting on Ramadan in relationship
to blood Glucose levels. Muazzam and Khaleque (1959), Aldouni et al (1997),
Larijani et al (2003) Rahman et al 2004), Malhotra et al (1989) , Nomani et al
(1989) and Ziaee Vetal (2006) reported that Glucose levels show significant
decrease in blood Glucose at the end of the month of Ramadan. While Temizhan
et al (2000) reported a significant increase in blood Glucose at the end of the
month of Ramadan.
The inconsistency in the results of previous studies might be due to lack of
control in the type and amount of food that was consumed by the subjects. The
subjects could easily have consumed varying amounts of calories between these
two measurements. A reliable study would be one that takes into consideration
Page 15
3
not only this factor, but the factor of physical activity in relation to the subjects as
well. Thus, there is a need for a study that will investigate the effects of fasting
over a period of 14 to 16 hours each day for one month. Furthermore, this study
will examine the effects of physical activity during fasting Ramadan.
Page 16
4
1.1 Statement of the problem
Many studies have been conducted on fasting during the month of
Ramadan. However, their results were varied and highly inconsistent. Most of the
studies during Ramadan reported a reduction in body weight. Other studies found
that body weight increased or was maintained at a Pre-Ramadan level.
Furthermore, other studies looked at the effect of fasting during Ramadan on
cholesterol and high and low-density lipoproteins levels and have also shown
variances. Few studies have been conducted on hormone levels during Ramadan
and these studies had vastly inconsistent results. Also, it is important to note that
none of these studies controlled food intake with physical activity.
Thus, there is a need for a study, which will consider the amount and type
of food intake with physical activity. This study will investigate whether fasting
14 to 16 hours during the day will affect the maintenance of anthropometric
measurements, as well as the levels of lipids, proteins, Glucose and hormones.
This study may also show if the level of physical activity is major contributing
factors to the values in each of these areas during the month of Ramadan.
Page 17
5
1.2 Hypothesis
Many studies on body weight and blood variables have been conducted
relating to fasting during the month of Ramadan. The results have been varied and
inconsistent, possibly due to the differences in the procedures and the methods
that were used. Most of the studies did not control the food intake and physical
activity during fasting, this maybe the major factor affecting previous studies and
their results.
The hypotheses of this investigation:
- The first hypothesis of this investigation is that the amount and type
of food intake with physical activity levels will affect body weight
and body fat significantly during fasting the month of Ramadan.
- The second hypothesis of this investigation is that the amount and
type of food intake with physical activity levels will affect the lipid
profile, Glucose, blood proteins and hormones significantly during
fasting the month of Ramadan.
Page 18
6
1.3 Significant of the study
The purpose of this study is to investigate the physiological and metabolic
effects in the human body as related to fasting during the month of Ramadan.
Each participating subject will have Glucose, Insulin, Glucagon, Cortisol,
Albumin, and serum total protein levels as well as lipid profile values along with
Anthropometric measurements evaluated during the month long intermittent
fasting. This study may also show if the level of physical activity and food intake
are major contributing factors on these variables.
Information collected during this study may help to show that people who
fast during the month of Ramadan can fast for an extended period without
harmful physiological or metabolic effects. This study will also increase the level
of awareness related to fasting and another significant aspect of this study is that it
may show a more beneficial way of fasting for religious as well as health reasons.
This study has the potential to have far reaching effects, not only within
the scientific community as related to Muslims, but within every aspect of the
medical community, such as a decrease in cardiovascular risk and better control
for diabetic patients. A study with the documentation of physical activity while
fasting could provide valuable information to the Muslims as well as every human
being in the world who decides to utilize a fast for reasons of health.
Page 19
7
CHAPTER II
REVIEW OF LITERATURE
2.1- Body weight and body fat during fasting Ramadan
During the month of Ramadan, Muslims fast from sunrise to sunset,
approximately 14 to 16 hours each day. However, they do eat and drink during the
remaining hours. The effects of fasting during the month of Ramadan on body
weight and body fat have been studied with inconsistent results. The majority of
the studies conducted and published from 1959-2012 are related to body weight.
Little research and even fewer articles have been written concerning body fat in
relationship to the fast of Ramadan. A few studies however, show that fasting
during Ramadan significantly reduced body weight and or body fat (Table 1-Body
Fat and Table 2-Body Weight). Studies by Maislos et al, 1993 and Beltaifa et al,
2002 reported non-significant changes in body weight. It is important to note that
neither of these studies contained to body fat measurement.
Forst and Pirani (1987) showed a significant increase of 3680kcal or a
51.7% in caloric intake and a notable loss from 60.3kg to 58.9kg or a 2.38%
decrease in body weight during the month of Ramadan. Reflectively, this weight
loss could conceivably be due to increased physical activity. However, no
documentation of physical activity was measured in this study. Two other studies
examined caloric intake as well. Decreases in caloric intake were noted Khan and
Page 20
8
Khattak, 2002 and Angel and Schwartz, 1974, 3.8% and 4.51% found 18.14% and
30.44% with decreases in body weight respectively.
A study conducted on Muslim women found that their body weight and fat
mass did not change significantly. Also, they found the daily food intake pre-and
post-Ramadan did not change (El Ati et al, 1995). A study on men by Meckel in
2008 showed that while the intensity of the physical activity decreased
significantly there was no major difference in either body weight or in caloric
intake during Ramadan.
A study of seven male subjects by Angel and Schwartz, 1974 revealed that
daily caloric intake significantly decreased during Ramadan. The mean body
weight among the seven males decreased significantly from 72.3kg to 69.6kg, a
total of 3.32% reduction in body weight. Another study conducted on 12 men and
9 females showed a reduction in body weight along with a decreased food intake
in both genders. The females exhibited a 6.41% reduction in body weight,
dropping from a mean weight 49.9kg to 46.7kg while the males showed a
reduction of 4.04% going from a mean of 62.9kg to 60.3kg. Pre-and post-
Ramadan Anthropometric variables also showed no significant changes (Husian
1987).
Two other studies, one conducted on women and the other on men
revealed significant correlations between decreased caloric intake and loss in
body weight. The study on 12 athletic females during Ramadan revealed
Page 21
9
significant decreases in body weight and body mass index (BMI) related to a
diminished caloric intake. A mean body weight loss from 56.41kg to 54.78kg, a
drop of 2.98% and a loss of 3.02% in BMI were documented (Memari, 2011).
The study consisting of nine men showed evidence of body weight loss with a
decreased food intake. A mean body weight decrease from 74.00kg to 71.50kg, a
3.50% loss was documented (Abedelmalek et al, 2011).
A study performed by Takruri (1989) examined the various weight
categories i.e. normal weight, overweight, and underweight. The researcher found
that the female’s weight loss was less than the males in all weight categories
probably because females have a higher body fat content. Thus, certain types of
medical conditions such as obesity could possibly benefit from this type of
fasting.
A study of 19 physically active men by Trabelsi et al stated that though the
subject’s caloric intake did not change the subject demonstrated a significant
reduction in body weight and body fat. Interestingly, a significant reduction in
water, 4.0L down to 3.3L was noted (Trabelsi et al, 2012). These studies show the
influence that caloric intake has on individuals when undertaking an altered diet
as well as altered meal schedules. It is important to note that none of these studies
showed any correlation between body weight and the level of physical activity
during the month of Ramadan. We hypothesize that the inconsistencies in testing
results may be due to the type of food eaten as well as the amount of caloric
Page 22
10
intake. In addition, the type and the intensity of the PA each subject participates in
may be a prime factor.
A study from Hallak and Nomani (1988) found that during the last two
weeks of Ramadan fasting (RF), when the subjects increased energy intake by 8
% (from 1696 kcal/day to 1834 kcal/day) while being on a high-fat diet, there was
no significant difference in body weights during this time period. Pre-Ramadan
each subject consumed 2275 kcal per day. During the first two weeks of the study
with reduction in caloric intake there was a significant decrease of 2.9% in body
weight.
Biologists Viqul and Chow (2006) investigated patterns in the food intake
of 29 subjects for one year in correlation with body mass index (BMI). Their
findings showed the mean energy intake was less significant relating to BMI, but
had a greater significance related to mean body weight.
Energy intake versus energy expenditure combined with dietary
requirements play major roles in body-weight loss and/or control. In order for
weight control maintenance to be achieved the energy expenditure must be equal
to the energy intake. For weight loss to occur energy intake must be less than
energy expenditure to result in body weight loss. Weight loss is also connected to
high levels of physical activity, associated with various types of work, especially
those that require constant muscle contraction and relaxation. Clearly, these types
of physical activities require high-energy intake. Therefore, physical activity has
Page 23
11
a major impact on the energy expenditure and energy balance in any 24-hour
period (Tappy et al, 2003). An experimental 3-year, study was conducted by Cox
with others in 2007, to determine the relationship between weight maintenance,
the role of physical activity and the amount of energy intake. Utilizing a program
of moderate and vigorous activity each day along with each person’s individual
diet they concluded the level of physical activity may affect the amount of energy
intake required to maintain body weight. Another non-Ramadan study lasting for
12 weeks (Hagan, et al., 1986) compared the amount of weight lost and body fat
reduction in obese females and males; through diet with exercise, diet alone,
exercise alone and the last group as a sedentary control group. The diet was
controlled at 1200 kcal per day and the exercise portion of the study consisted of a
30-minute walk or run 5 times per week. The diet-exercise group with the diet
only group had a greater body weight and body fat reduction than either the
exercise only or sedentary groups. This study clearly illustrates that the low
caloric intake and the level of physical activity affect weight loss.
In conclusion, there have been many studies conducted on the fast of
Ramadan related to body weight. The inconsistencies of previous studies appears
to have a direct correlation to the fact that the majority of the studies do not
control the amount of food intake; nor do they control the level of physical
activity between these two measurements. Moreover, additional research needs to
be conducted to not only further investigate the fast of Ramadan in relationship to
Page 24
12
body weight, but the inclusion and consideration of the level of physical activity
along with the amount and type of food intake.
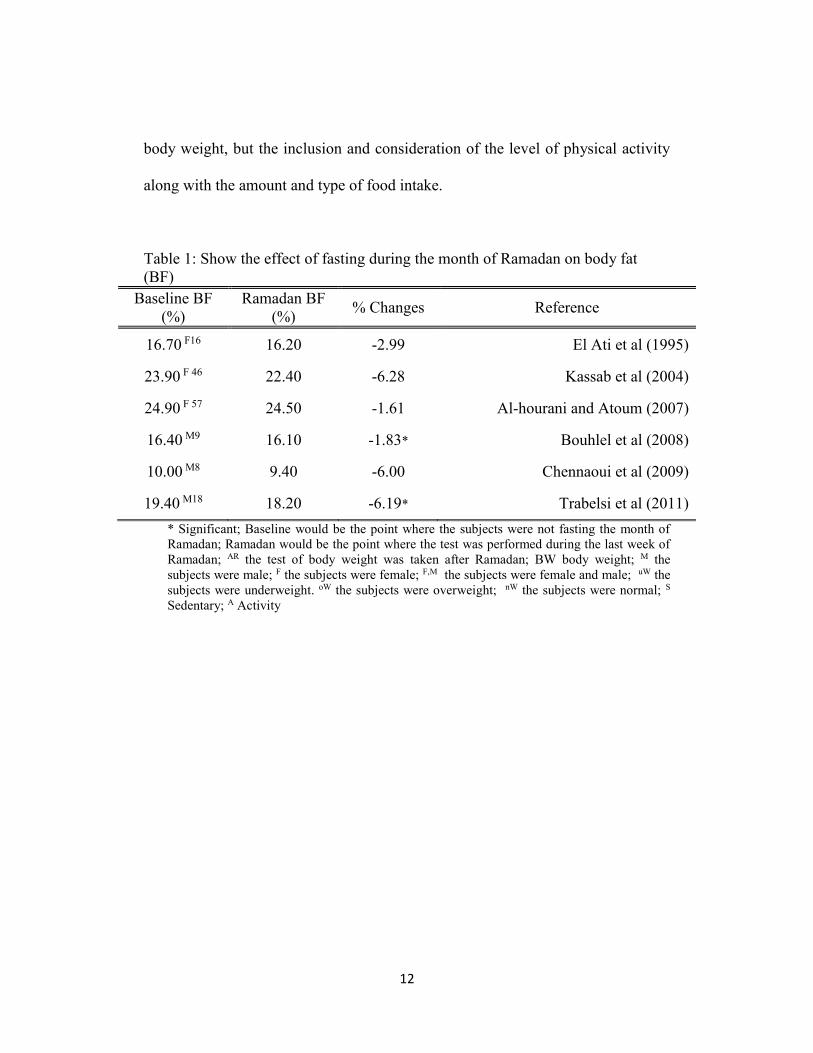
Table 1: Show the effect of fasting during the month of Ramadan on body fat
(BF)
Baseline BF
(%)
Ramadan BF
(%) % Changes Reference
16.70 F16 16.20 -2.99 El Ati et al (1995)
23.90 F 46 22.40 -6.28 Kassab et al (2004)
24.90 F 57 24.50 -1.61 Al-hourani and Atoum (2007)
16.40 M9 16.10 -1.83* Bouhlel et al (2008)
10.00 M8 9.40 -6.00 Chennaoui et al (2009)
19.40 M18 18.20 -6.19* Trabelsi et al (2011)
* Significant; Baseline would be the point where the subjects were not fasting the month of
Ramadan; Ramadan would be the point where the test was performed during the last week of
Ramadan; AR the test of body weight was taken after Ramadan; BW body weight; M the
subjects were male; F the subjects were female; F,M the subjects were female and male; uW the
subjects were underweight. oW the subjects were overweight; nW the subjects were normal; S
Sedentary; A Activity
Page 25
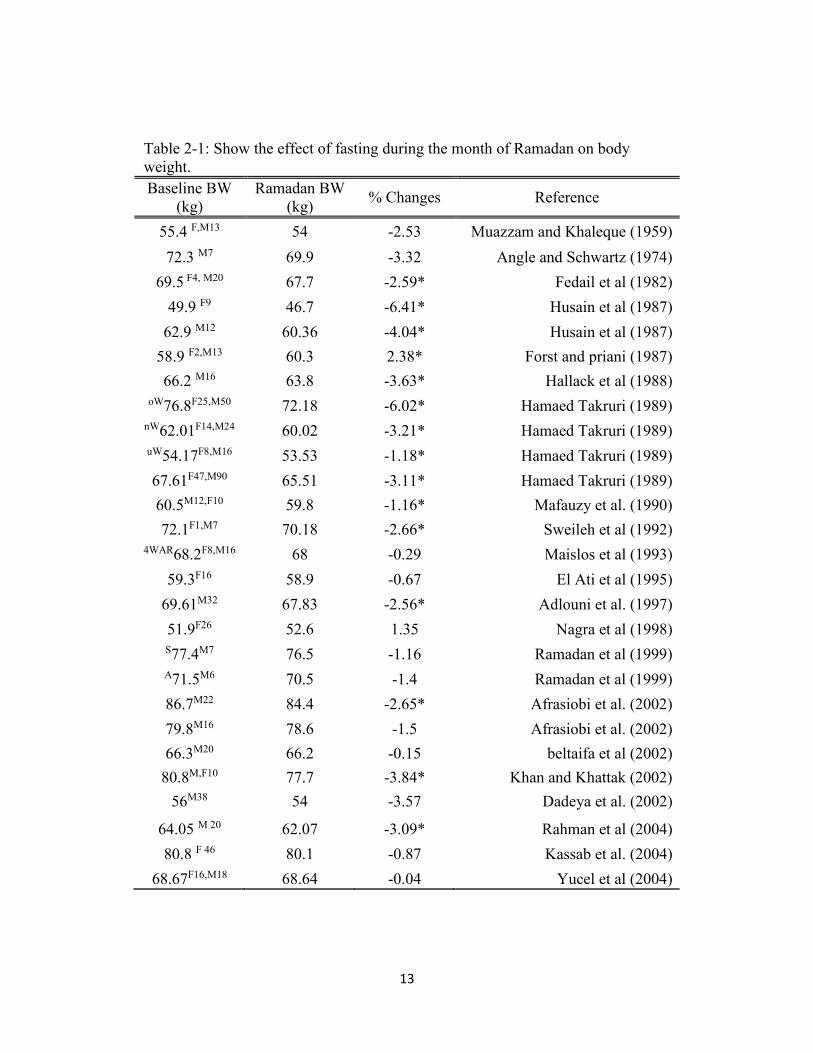
13
Table 2-1: Show the effect of fasting during the month of Ramadan on body
weight.
Baseline BW
(kg)
Ramadan BW
(kg) % Changes Reference
55.4 F,M13 54 -2.53 Muazzam and Khaleque (1959)
72.3 M7 69.9 -3.32 Angle and Schwartz (1974)
69.5 F4, M20 67.7 -2.59* Fedail et al (1982)
49.9 F9 46.7 -6.41* Husain et al (1987)
62.9 M12 60.36 -4.04* Husain et al (1987)
58.9 F2,M13 60.3 2.38* Forst and priani (1987)
66.2 M16 63.8 -3.63* Hallack et al (1988)
oW76.8F25,M50 72.18 -6.02* Hamaed Takruri (1989)
nW62.01F14,M24 60.02 -3.21* Hamaed Takruri (1989)
uW54.17F8,M16 53.53 -1.18* Hamaed Takruri (1989)
67.61F47,M90 65.51 -3.11* Hamaed Takruri (1989)
60.5M12,F10 59.8 -1.16* Mafauzy et al. (1990)
72.1F1,M7 70.18 -2.66* Sweileh et al (1992)
4WAR68.2F8,M16 68 -0.29 Maislos et al (1993)
59.3F16 58.9 -0.67 El Ati et al (1995)
69.61M32 67.83 -2.56* Adlouni et al. (1997)
51.9F26 52.6 1.35 Nagra et al (1998)
S77.4M7 76.5 -1.16 Ramadan et al (1999)
A71.5M6 70.5 -1.4 Ramadan et al (1999)
86.7M22 84.4 -2.65* Afrasiobi et al. (2002)
79.8M16 78.6 -1.5 Afrasiobi et al. (2002)
66.3M20 66.2 -0.15 beltaifa et al (2002)
80.8M,F10 77.7 -3.84* Khan and Khattak (2002)
56M38 54 -3.57 Dadeya et al. (2002)
64.05 M 20 62.07 -3.09* Rahman et al (2004)
80.8 F 46 80.1 -0.87 Kassab et al. (2004)
68.67F16,M18 68.64 -0.04 Yucel et al (2004)
Page 26
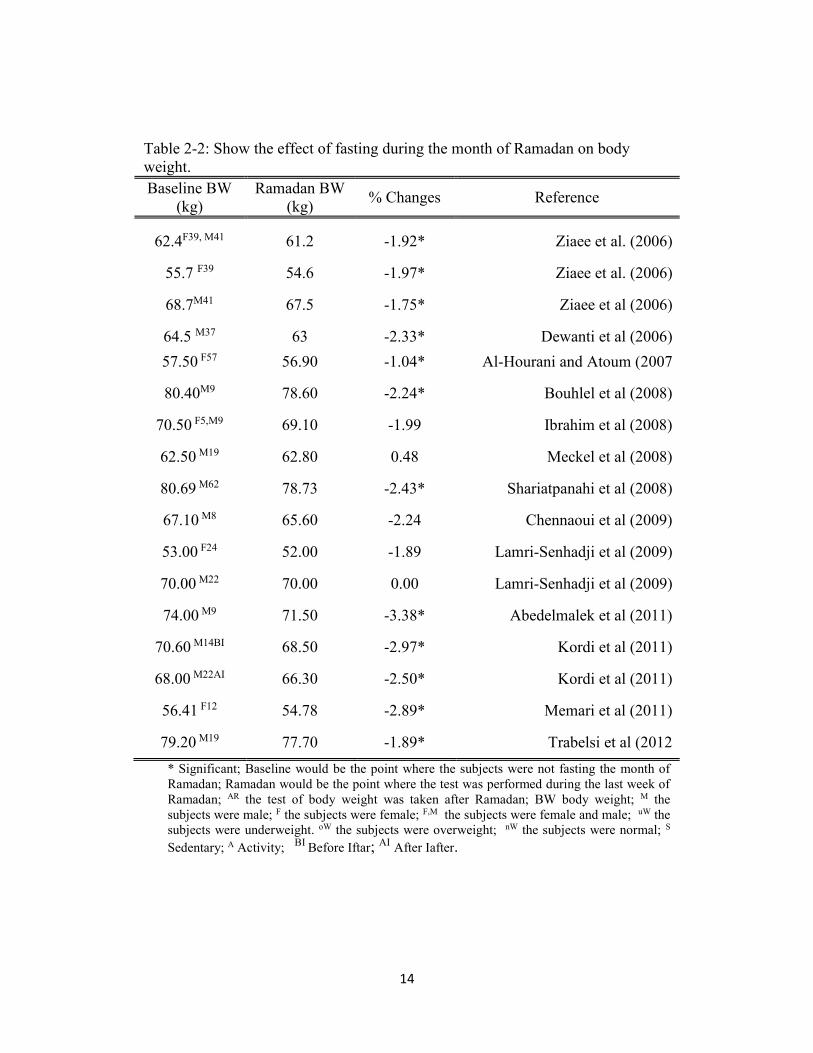
14
Table 2-2: Show the effect of fasting during the month of Ramadan on body
weight.
Baseline BW
(kg)
Ramadan BW
(kg) % Changes Reference
62.4F39, M41 61.2 -1.92* Ziaee et al. (2006)
55.7 F39 54.6 -1.97* Ziaee et al. (2006)
68.7M41 67.5 -1.75* Ziaee et al (2006)
64.5 M37 63 -2.33* Dewanti et al (2006)
57.50 F57 56.90 -1.04* Al-Hourani and Atoum (2007
80.40M9 78.60 -2.24* Bouhlel et al (2008)
70.50 F5,M9 69.10 -1.99 Ibrahim et al (2008)
62.50 M19 62.80 0.48 Meckel et al (2008)
80.69 M62 78.73 -2.43* Shariatpanahi et al (2008)
67.10 M8 65.60 -2.24 Chennaoui et al (2009)
53.00 F24 52.00 -1.89 Lamri-Senhadji et al (2009)
70.00 M22 70.00 0.00 Lamri-Senhadji et al (2009)
74.00 M9 71.50 -3.38* Abedelmalek et al (2011)
70.60 M14BI 68.50 -2.97* Kordi et al (2011)
68.00 M22AI 66.30 -2.50* Kordi et al (2011)
56.41 F12 54.78 -2.89* Memari et al (2011)
79.20 M19 77.70 -1.89* Trabelsi et al (2012
* Significant; Baseline would be the point where the subjects were not fasting the month of
Ramadan; Ramadan would be the point where the test was performed during the last week of
Ramadan; AR the test of body weight was taken after Ramadan; BW body weight; M the
subjects were male; F the subjects were female; F,M the subjects were female and male; uW the
subjects were underweight. oW the subjects were overweight; nW the subjects were normal; S
Sedentary; A Activity; BI
Before Iftar; AI After Iafter.
Page 27
15
2.2- Lipid profile and the fasting of Ramadan
A Lipid Profile (LP) or Lipid Panel is a test that evaluates the levels of
Total Cholesterol (TC), High-Density Lipoproteins (HDL), Low-Density
Lipoproteins (LDL), and Triglycerides (TG) in serum blood. These levels are vital
in the screening and monitoring of multiple medical conditions, i.e.,
cardiovascular disease (CVD), thyroid disease, liver disease, renal disease, along
with various metabolic disorders such as Diabetes Mellitus (DM), (Fischbach,
1998). The levels of a lipid profile frequently evaluate the effectiveness of dietary
and medication concerns. Many factors contribute to the deviations found in these
levels. These variances have been traced back to metabolic diseases, CVD,
pregnancy, thyroid and liver disease, and medication that the person is taking as
well as persons who fast for either short or extended periods of time.
During Ramadan fasting the frequency and amount of caloric intake is
decreased (Angel and Schwartz, 1974). Because of these dietary changes and the
time requirement involved for fasting, the month of Ramadan has been studied
multiple times, but with a diversity of results related to each aspect of the Lipid
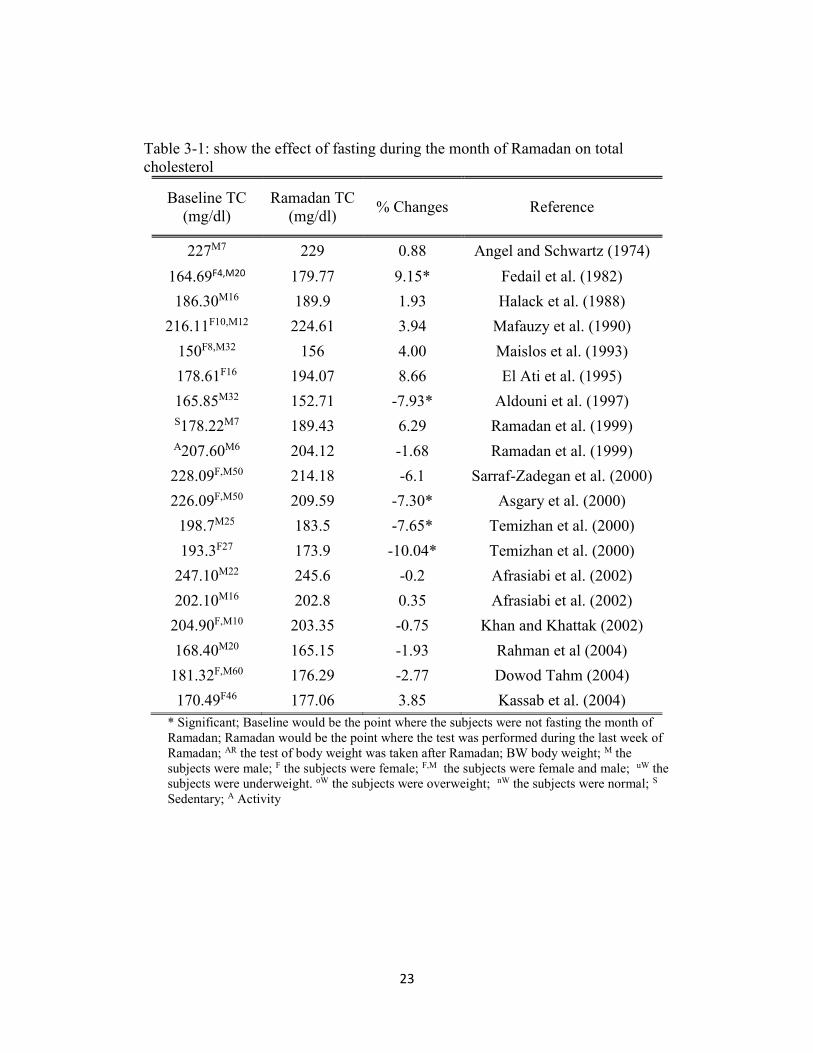
Profile (LP). Many studies showed substantial decreases in total cholesterol levels
whereas other investigations documented significant increases in serum blood TC
levels during the month of Ramadan.
Page 28
16
Asgary et al, 2000 and Aldouni et al, 1997 in studies conducted on both
genders showed significant decreases in TC, 7.30% and 7.93%, respectively.
While the greatest decrease in TC was 10.04% found by Temizhan et al in 2000.
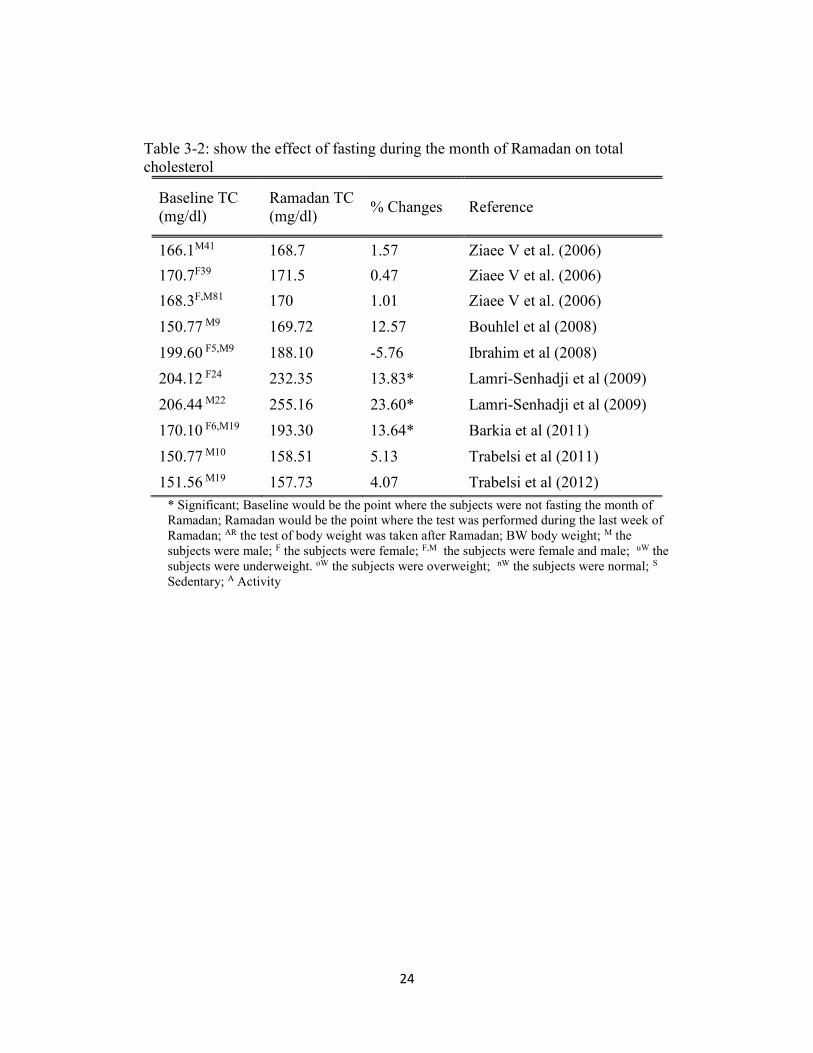
Several studies conducted on both genders showed noteworthy elevations
in TC concentrations. Fedial et al 1982 saw increases of 9.15% in TC levels.
Barkia et al in 2011 recorded greater increases in TC levels of 13.64%. Another
notable study conducted by Lamri-Senhadji et al in 2009-documented substantial
elevations of TC in both genders with an increase in women of 13.83% and in
men of 23.60%. Interestingly, the majority of the results obtained from the studies
showed no significant changes in TC serum blood levels (Table 3).
In summary, total cholesterol levels on serum blood obtained during
Ramadan fasting were widely presented. A few studies showed marked decreases
in TC serum levels as great as 10.04% others revealed elevated percentages as
high as 23.60%. Although these percentage values were elevated, they remain
within the normal/health range. Although, most studies reviewed did not separate
decreased or increased percentages per gender those that did revealed diminished
as well as elevated finding for both genders. Lamri-Senhadji et al and Barkia et al
were in agreement with Aldouni et al, Asgary et al as well as Temizhan et al in
their conclusion that the type and amount of caloric intake such as, increasing
protein, carbohydrate and fat consumption play a major role in either increasing
or decreasing total cholesterol levels. The frequencies of many small meals
Page 29
17
instead of having one or two large meals were also considered as a viable
contributing factor in lowering total cholesterol levels.
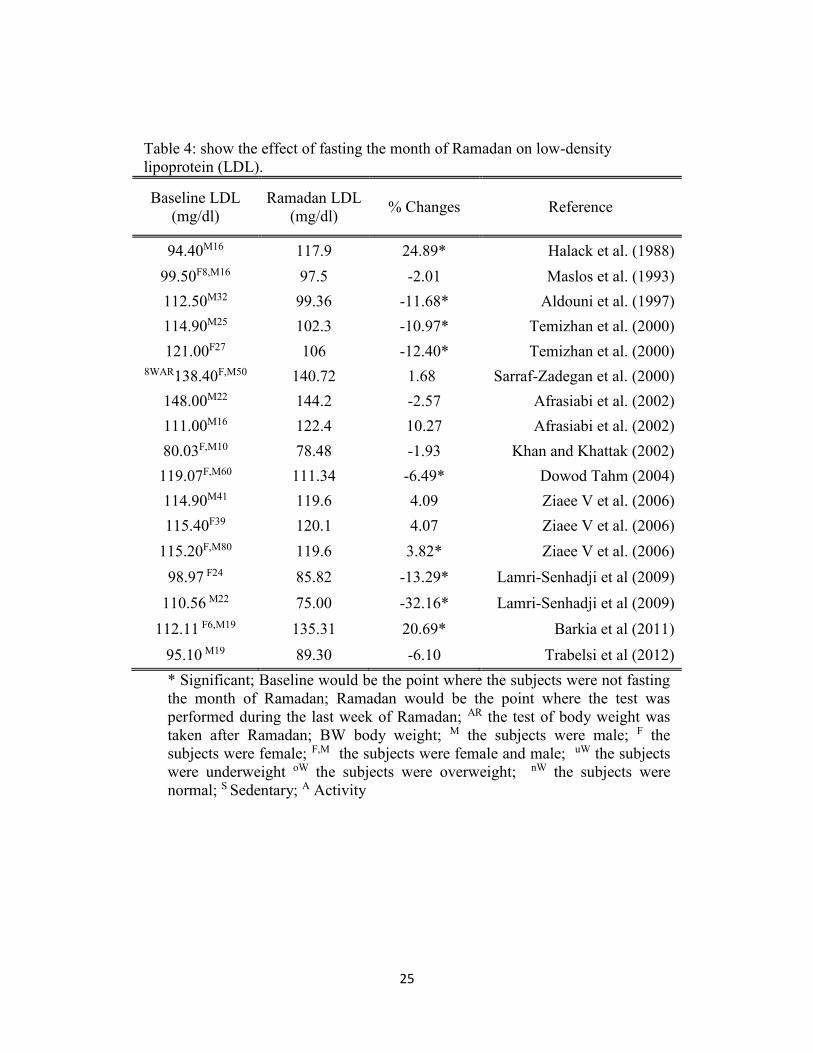
Low-Density Lipoproteins known as “bad cholesterol” is another
component of a Lipid Profile. Elevated levels within this are considered
negatively from a medical aspect and have been associated with the increased risk
of CVD, renal disease and various metabolic disorders. LDL levels have been
reported in studies related to Ramadan fasting in a wide range of high and low
percentages. Some studies looked at blood values from both genders separately,
whereas others recorded a mean percentage covering both genders. In 2004 a
study conducted on both genders recorded a mean LDL decrease of 6.49%. While
a study comprised of 32 males conducted in 1997 recorded mean LDL decreases
of 11.68% (Dowod Tahm, 2004 and Aldouni et al, 1997).
Two other studies, Temezhan et al, 2000 and Lamri-Senhadji et al, 2009
recorded significant changes in both genders but with opposite values per group.
Temezhan showed decreases in mean LDL levels for women of 12.40% and men
10.97%, whereas Lamri-Senhadji et al found decrease of 13.29% for women and
32.16 % for men.
Though a number of studies show decreases in LDL levels during
Ramadan fast other studies show marked increases in the same blood values.
Studies in 2006 and 2011 looked at lab values in each gender. Mean LDL blood
value percentages were elevated in both studies, Ziaee et al, 2006 with an increase
Page 30
18
of 3.82% and Barkia et al in 2011 with a mean increase of 20.69% (Ziaee et al,
2006 and Barkia et al, 2011).
A study showing one of the highest recorded increases, 24.89% found that
the significant elevation of LDL could logically be related to the total caloric
intake and the type of dietary fat consumed (Halack et al, 1988), (Table 5). A
cholesterol study on non-fasting in 2001 found a strong relationship between the
frequency of eating and the levels of TC and LDL. With an increased frequency
of meals the serum levels of TC and LDL decrease (Titan et al, 2001).
Interpretation of data varies somewhat per study. However, for the most
part a consensus regarding the healthy influence of smaller, frequent meals versus
one or two large meals appears to have been established. These smaller meals
combined with the specific types of caloric intake such as increased carbohydrate
and fat intake may well have a more direct and beneficial outcome in controlling
LDL levels than one or two large meals during the Ramadan fast. Additionally,
non-fasting study results support the conclusion that concentrations of low-
density lipoproteins as well as other components of a lipid profile, high-density
lipoproteins, are linked to meal frequency.
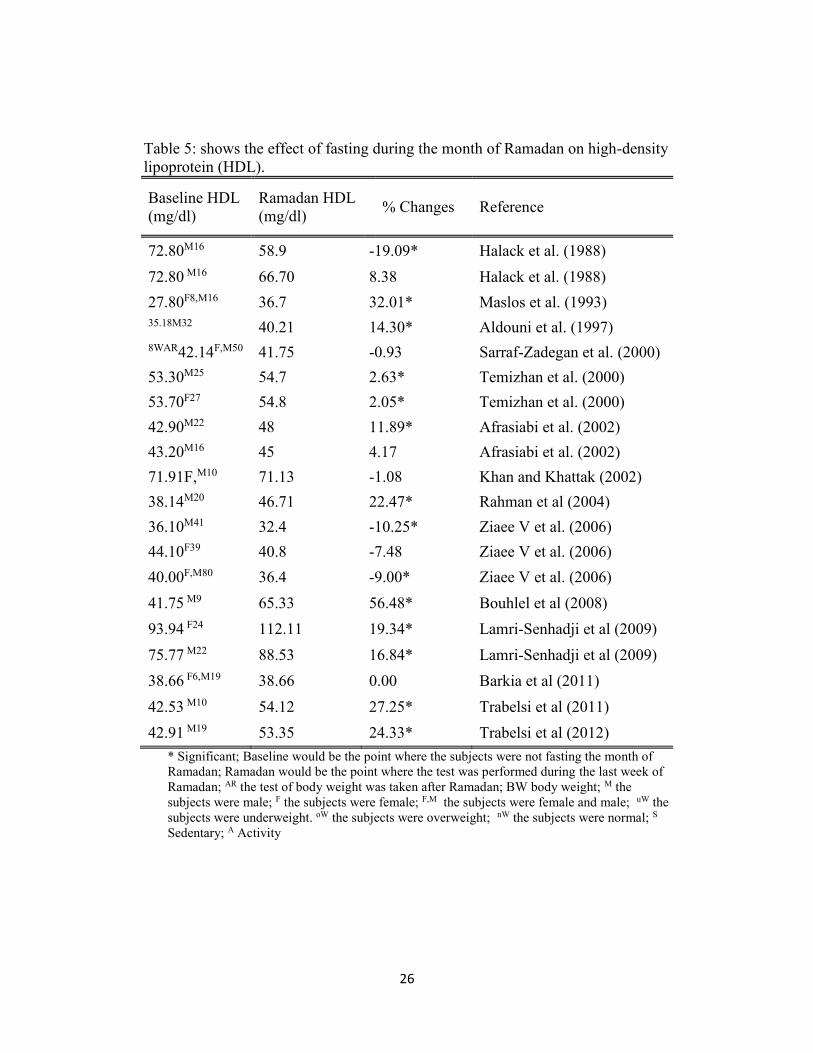
High-density lipoproteins are usually considered as “good cholesterol” and
contain positive reinforcing factors against various CVD. Increased levels of HDL
are considered positive and advantageous from a medical viewpoint.
Consequently, decreased levels of HDL can amplify a person’s health risk. A
Page 31
19
study, divided into two phases, of sixteen healthy males had significantly
decreased levels of HDL by the end of the four-week fast. During phase-one, the
first two weeks of Ramadan, each subject consumed 77.1% of carbohydrates and
8.8% of fat. Phase-two followed with caloric intake of 35% carbohydrates and
51% of fat over the last two weeks of fasting. HDL levels at the end of phase one
saw a decrease of 8.38%, at the end of phase two HDL levels had decreased to
19.09% (Halack et al, 1988).
Another study that considered energy intake and dietary fat consumption
during fasting was Ziaee et al in 2006. He conducted a study on 80 men and
women and documented a mean decrease in HDL levels of 9.00%.
Just as energy intake affects decreases in HDL concentrations it also
greatly impacts increases in HDL levels. Rahman et al conducted an investigation
using twenty healthy males. He reported mean HDL increases of 22.47% with an
increased fat intake. Another researcher compared forty-six men and women and
obtained mean concentration levels of HDL at a 19.34% increase for the women
and a 16.84% increase for the men (Rahman et al, 2004 and Lamri-Senhadji et al,
2009).
Aldouni et al, 1997 and Maislos et al, 1993 both considered “feeding
behavior” a vital factor in the increased HDL levels in their Ramadan study
groups. Meal frequency and diet composition, increased protein and
Page 32
20
carbohydrates with decreased fat intake, were also considered contributing
aspects. Mean percentages of HDL levels were 14.30% and 32.01%, respectively.
The greatest HDL concentration percentage increase found was Bouhlel et
al, 2008 during a study consisting of 9 well-trained male athletes. A recorded
mean HDL of 56.48% was documented.( Table 5)
The findings from these researchers support the concepts and correlations
between LDL and HDL concentrations and energy intake. The type and amount
of food consumed is also a direct link to serum cholesterol levels.
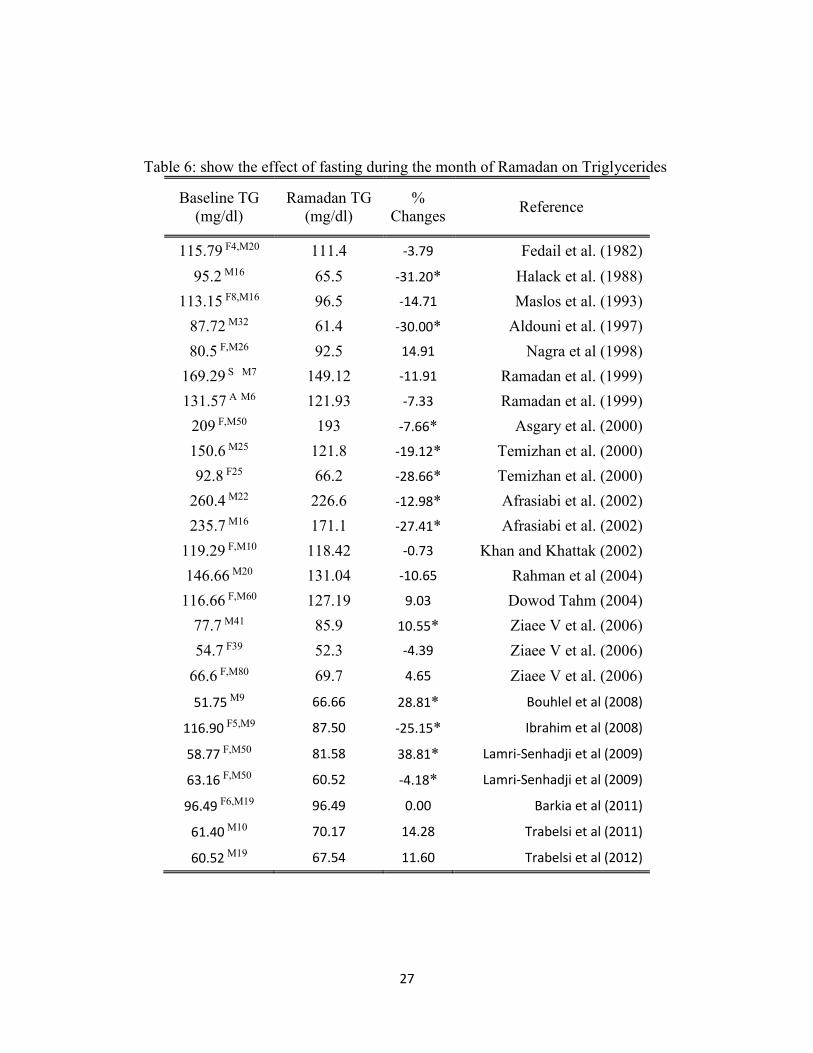
The last component of a lipid profile is Triglycerides. Persons with high
Triglyceride levels have been classified as high-risk individuals for CVD and
various Endocrinopathies (Fischbach, 1998).
A study conducted by Ramadan et al in 1999 compared sedentary and
active subject groups in relationship to the fast of Ramadan. The sedentary group
(S), seven office workers, did not participate in any type of exercise program
during fasting. The active group (A), also six office workers, performed a brisk
exercise session of jogging or brisk walking for 30 to 60 minutes each day, 3 to 5
times per week. The S group had mean TG reductions of 11.91% while the A
group had reductions of 7.33%. (Table 6). Values found during this study showed
that group S decreased their caloric intake in order to maintain their body weight.
This change in dietary pattern caused a reduction in the serum levels of TG. On
Page 33
21
the other hand, group A did not change or decrease their food intake, thus causing
an elevation in their serum TG levels (Ramadan et al, 1999).
Aldouni et al reported 30 % decreases in serum TG levels during Ramadan
in 1997. His study found a substantial decline in these levels and was most likely
related to the dietary pattern changes and the amount and type of fat consumed.
The study also related a correlation between increased energy and the amount of
carbohydrate intake. The study showing one of the highest recorded decreases in
serum TG, 31.20% found that the significant absence of TG was related to but not
limited by the replacement of fats to carbohydrates (Halack et al, 1988)
Increases in serum TG were found in several studies. Ziaee et al in 2006
evaluated TG levels in a mixed gender study of 80 subjects. The males showed a
slight increase of 10.55% in serum TG levels. Interestingly, the females showed a
very slight decrease of 4.39%. A study reviewed with the highest increase was
Bouhlel et al in 2008. This study of nine males recorded a mean increase of serum
TG level of 28.81%.
In conclusion, the need for improved control over specific biochemical
markers is apparent. Heart disease and diabetes are increasing throughout the
world. If altering a dietary pattern as seen in these studies can control, elevate and
lower these markers without major dietary and pharmacological changes, the
medical community will gain vital knowledge (Fischbach, 1998; Venes, 2005).
Significant declines in total cholesterol and triglyceride levels are most likely
Page 34
22
related to the dietary pattern changes and the amount of fat intake noted during
Ramadan. The increase in high-density lipids or “good cholesterol” may also be a
by-product of the Ramadan fast.
Multiple studies have found that several small frequent meals have a
greater influence on lowering these specific laboratory values than values
obtained after the subjects consumed one or two large meals. The physical
activity each subject participated in combined with the type of diet consumed also
seems to have played a major role in blood chemistry levels found in the studies.
Rahman found that HDL concentrations increased while his subjects’ were
consuming a high fat diet, these findings are in conflict with previous studies and
nutrition’s acknowledged role in lipid profile concentrations. This investigation
may explain that the type and amount of food intake combined with the level of
physical activity may directly impact blood chemistry levels such as those related
to a Lipid Profile.
Page 35
23
Table 3-1: show the effect of fasting during the month of Ramadan on total
cholesterol
Baseline TC
(mg/dl)
Ramadan TC
(mg/dl) % Changes Reference
227M7 229 0.88 Angel and Schwartz (1974)
164.69F4,M20 179.77 9.15* Fedail et al. (1982)
186.30M16 189.9 1.93 Halack et al. (1988)
216.11F10,M12 224.61 3.94 Mafauzy et al. (1990)
150F8,M32 156 4.00 Maislos et al. (1993)
178.61F16 194.07 8.66 El Ati et al. (1995)
165.85M32 152.71 -7.93* Aldouni et al. (1997)
S178.22M7 189.43 6.29 Ramadan et al. (1999)
A207.60M6 204.12 -1.68 Ramadan et al. (1999)
228.09F,M50 214.18 -6.1 Sarraf-Zadegan et al. (2000)
226.09F,M50 209.59 -7.30* Asgary et al. (2000)
198.7M25 183.5 -7.65* Temizhan et al. (2000)
193.3F27 173.9 -10.04* Temizhan et al. (2000)
247.10M22 245.6 -0.2 Afrasiabi et al. (2002)
202.10M16 202.8 0.35 Afrasiabi et al. (2002)
204.90F,M10 203.35 -0.75 Khan and Khattak (2002)
168.40M20 165.15 -1.93 Rahman et al (2004)
181.32F,M60 176.29 -2.77 Dowod Tahm (2004)
170.49F46 177.06 3.85 Kassab et al. (2004)
* Significant; Baseline would be the point where the subjects were not fasting the month of
Ramadan; Ramadan would be the point where the test was performed during the last week of
Ramadan; AR the test of body weight was taken after Ramadan; BW body weight; M the
subjects were male; F the subjects were female; F,M the subjects were female and male; uW the
subjects were underweight. oW the subjects were overweight; nW the subjects were normal; S
Sedentary; A Activity
Page 36
24
Table 3-2: show the effect of fasting during the month of Ramadan on total
cholesterol
Baseline TC
(mg/dl)
Ramadan TC
(mg/dl) % Changes Reference
166.1M41 168.7 1.57 Ziaee V et al. (2006)
170.7F39 171.5 0.47 Ziaee V et al. (2006)
168.3F,M81 170 1.01 Ziaee V et al. (2006)
150.77 M9 169.72 12.57 Bouhlel et al (2008)
199.60 F5,M9 188.10 -5.76 Ibrahim et al (2008)
204.12 F24 232.35 13.83* Lamri-Senhadji et al (2009)
206.44 M22 255.16 23.60* Lamri-Senhadji et al (2009)
170.10 F6,M19 193.30 13.64* Barkia et al (2011)
150.77 M10 158.51 5.13 Trabelsi et al (2011)
151.56 M19 157.73 4.07 Trabelsi et al (2012)
* Significant; Baseline would be the point where the subjects were not fasting the month of
Ramadan; Ramadan would be the point where the test was performed during the last week of
Ramadan; AR the test of body weight was taken after Ramadan; BW body weight; M the
subjects were male; F the subjects were female; F,M the subjects were female and male; uW the
subjects were underweight. oW the subjects were overweight; nW the subjects were normal; S
Sedentary; A Activity
Page 37
25
Table 4: show the effect of fasting the month of Ramadan on low-density
lipoprotein (LDL).
Baseline LDL
(mg/dl)
Ramadan LDL
(mg/dl) % Changes Reference
94.40M16 117.9 24.89* Halack et al. (1988)
99.50F8,M16 97.5 -2.01 Maslos et al. (1993)
112.50M32 99.36 -11.68* Aldouni et al. (1997)
114.90M25 102.3 -10.97* Temizhan et al. (2000)
121.00F27 106 -12.40* Temizhan et al. (2000)
8WAR138.40F,M50 140.72 1.68 Sarraf-Zadegan et al. (2000)
148.00M22 144.2 -2.57 Afrasiabi et al. (2002)
111.00M16 122.4 10.27 Afrasiabi et al. (2002)
80.03F,M10 78.48 -1.93 Khan and Khattak (2002)
119.07F,M60 111.34 -6.49* Dowod Tahm (2004)
114.90M41 119.6 4.09 Ziaee V et al. (2006)
115.40F39 120.1 4.07 Ziaee V et al. (2006)
115.20F,M80 119.6 3.82* Ziaee V et al. (2006)
98.97 F24 85.82 -13.29* Lamri-Senhadji et al (2009)
110.56 M22 75.00 -32.16* Lamri-Senhadji et al (2009)
112.11 F6,M19 135.31 20.69* Barkia et al (2011)
95.10 M19 89.30 -6.10 Trabelsi et al (2012)
* Significant; Baseline would be the point where the subjects were not fasting
the month of Ramadan; Ramadan would be the point where the test was
performed during the last week of Ramadan; AR the test of body weight was
taken after Ramadan; BW body weight; M the subjects were male; F the
subjects were female; F,M the subjects were female and male; uW the subjects
were underweight oW the subjects were overweight; nW the subjects were
normal; S Sedentary; A Activity
Page 38
26
Table 5: shows the effect of fasting during the month of Ramadan on high-density
lipoprotein (HDL).
Baseline HDL
(mg/dl)
Ramadan HDL
(mg/dl) % Changes Reference
72.80M16 58.9 -19.09* Halack et al. (1988)
72.80 M16 66.70 8.38 Halack et al. (1988)
27.80F8,M16 36.7 32.01* Maslos et al. (1993)
35.18M32 40.21 14.30* Aldouni et al. (1997)
8WAR42.14F,M50 41.75 -0.93 Sarraf-Zadegan et al. (2000)
53.30M25 54.7 2.63* Temizhan et al. (2000)
53.70F27 54.8 2.05* Temizhan et al. (2000)
42.90M22 48 11.89* Afrasiabi et al. (2002)
43.20M16 45 4.17 Afrasiabi et al. (2002)
71.91F,M10 71.13 -1.08 Khan and Khattak (2002)
38.14M20 46.71 22.47* Rahman et al (2004)
36.10M41 32.4 -10.25* Ziaee V et al. (2006)
44.10F39 40.8 -7.48 Ziaee V et al. (2006)
40.00F,M80 36.4 -9.00* Ziaee V et al. (2006)
41.75 M9 65.33 56.48* Bouhlel et al (2008)
93.94 F24 112.11 19.34* Lamri-Senhadji et al (2009)
75.77 M22 88.53 16.84* Lamri-Senhadji et al (2009)
38.66 F6,M19 38.66 0.00 Barkia et al (2011)
42.53 M10 54.12 27.25* Trabelsi et al (2011)
42.91 M19 53.35 24.33* Trabelsi et al (2012)
* Significant; Baseline would be the point where the subjects were not fasting the month of
Ramadan; Ramadan would be the point where the test was performed during the last week of
Ramadan; AR the test of body weight was taken after Ramadan; BW body weight; M the
subjects were male; F the subjects were female; F,M the subjects were female and male; uW the
subjects were underweight. oW the subjects were overweight; nW the subjects were normal; S
Sedentary; A Activity
Page 39
27
Table 6: show the effect of fasting during the month of Ramadan on Triglycerides
Baseline TG
(mg/dl)
Ramadan TG
(mg/dl)
%
Changes Reference
115.79 F4,M20 111.4 -3.79 Fedail et al. (1982)
95.2 M16 65.5 -31.20* Halack et al. (1988)
113.15 F8,M16 96.5 -14.71 Maslos et al. (1993)
87.72 M32 61.4 -30.00* Aldouni et al. (1997)
80.5 F,M26 92.5 14.91 Nagra et al (1998)
169.29 S M7 149.12 -11.91 Ramadan et al. (1999)
131.57 A M6 121.93 -7.33 Ramadan et al. (1999)
209 F,M50 193 -7.66* Asgary et al. (2000)
150.6 M25 121.8 -19.12* Temizhan et al. (2000)
92.8 F25 66.2 -28.66* Temizhan et al. (2000)
260.4 M22 226.6 -12.98* Afrasiabi et al. (2002)
235.7 M16 171.1 -27.41* Afrasiabi et al. (2002)
119.29 F,M10 118.42 -0.73 Khan and Khattak (2002)
146.66 M20 131.04 -10.65 Rahman et al (2004)
116.66 F,M60 127.19 9.03 Dowod Tahm (2004)
77.7 M41 85.9 10.55* Ziaee V et al. (2006)
54.7 F39 52.3 -4.39 Ziaee V et al. (2006)
66.6 F,M80 69.7 4.65 Ziaee V et al. (2006)
51.75 M9 66.66 28.81* Bouhlel et al (2008)
116.90 F5,M9 87.50 -25.15* Ibrahim et al (2008)
58.77 F,M50 81.58 38.81* Lamri-Senhadji et al (2009)
63.16 F,M50 60.52 -4.18* Lamri-Senhadji et al (2009)
96.49 F6,M19 96.49 0.00 Barkia et al (2011)
61.40 M10 70.17 14.28 Trabelsi et al (2011)
60.52 M19 67.54 11.60 Trabelsi et al (2012)
Page 40
28
2.3 Glucose, Creatinine and hormones levels during fasting Ramadan
Due to the amount of time required for fasting, the multiple components
relating to Ramadan fast has been extensively studied in diverse combinations
with varied and vast results (i.e. weight loss, BMI, caloric intake, dehydration,
lipid, Glucose and creatinine levels, etc). A Reliable data on the exploration of the
effects of fasting on hormone levels, specifically, Insulin, Glucagon, and cortisol
levels are scarcer or non-existent.
Most metabolic and physiological functions in the human body derive its’
energy from Glucose. This makes the maintenance of blood Glucose levels one of
the body’s highest priorities. The absorptive phase refers to the first couple of
hours after a meal when Glucose is the principal source of energy for tissues.
During time between meals, the post-absorptive phase, fatty acids become the
main source of energy for the body (Smith, 2005). When blood Glucose levels are
high, large amounts of Glucose are taken up and stored by the liver and muscle as
glycogen; excluding periods of constrained dietary intake when carbohydrate
intake is severely restricted.
The main source of fuel for the brain is Glucose. The brain and central
nervous system (CNS) uses approximately 150grams of carbohydrates per day.
Any decrease in serum Glucose levels, which would include the state of fasting,
initiates multiple body maintenance systems in order to increase serum
concentrations of Glucose (Nelson and Cox, 2004).
Page 41
29
A number of studies revealed nearly negligible percentage changes in
Glucose levels in correlation to fasting of Ramadan. Asgary et al, 2000 and Nagra
et al, 1998 conducted studies on both genders during Ramadan. Results showed
only minimal percent changes in serum Glucose concentrations during fasting.
Combined mean value changes were 92.57mg/dL dropping to 90.22mg/dL, a
2.54% change and 84.10mg/dL dropping to 82.3mg/dL equaling a 2.14% change
in serum blood Glucose levels, Asgary et al 2000 and Nagra et al 1998
respectively (Table 7).
A Ramadan study in 2002 focused on the effects of fasting on Glucose
levels in ten healthy men. Food and fluid intake were recorded before and during
the first and fourth week of fasting. Blood samples were obtained prior to, and
repeated in the second and fourth week of fasting. Mean Glucose levels
decreased from 82.15mg/dL to 79.63mg/dL, showing a minimal drop of 3.07%.
(Khan and Khattak, 2002).
Minimal Glucose decreases continue with Adlouni et al’s study in 1997.
They conducted a study on thirty-two healthy male subjects. Utilizing four serum
blood samples taken at days 8, 15, 22 and 29 (last day of Ramadan); each subject
provided his own baseline. Glycemic changes were significant with a decrease of
14.1% (mean levels were 91.88mg/dL with a decrease to 78.91mg/dL) by day 29
of Ramadan.
Page 42
30
Several studies documented significant decreases in serum Glucose levels
in connection to Ramadan fasting. A study from the Endocrinology & Metabolism
Research Center in 2003 relating to both genders on fasting serum Glucose
concentrations in healthy adults showed considerable percentage decreases in
serum Glucose levels. While dietary intake was not controlled, it was recorded
through the use of a food frequency questionnaire on the first and fifteenth days of
Ramadan. After establishing a baseline for both genders, levels were examined
on the fourteenth and twenty-eighth day of Ramadan. Following 14 days of
fasting, female Glucose levels decreased from a mean of 89.7mg/dL (baseline) to
a mean of 67.5mg/dL; this level further dropped to a mean serum level of
65.7mg/dL at 28 days of fasting constituting a substantial decrease of 26.76%.
Males during this same period of time showed mean levels as follows: 87.5mg/dL
decreased to 81.1mg/dL followed by a substantial drop to 60.8mg/dL a 30.51%
decrease in serum Glucose levels. It is important to note, the caloric intake
decreased for all participates and sleep patterns were altered during Ramadan
(Larijani et al, 2003).
Another investigation with noteworthy findings was conducted on thirteen
healthy adults. This study extended the number of blood samples for
investigation to five; at one week prior to Ramadan (baseline), repeated on day 1,
10, and day 28 of fasting. The final blood sample was obtained four weeks after
completion of Ramadan. The mean levels were 84.00mg/dL with a drop to
Page 43
31
74.00mg/dL, an 11.90% decline in serum blood Glucose levels. (Muazzam and
Khaleque, 1959)
Increases in serum Glucose have also been included. It is important to note
that the increases of Glucose we found where negligible in comparison to the
decreases in Glucose during Ramadan fast.
Studies showing insignificant increases were from Dowad (2004) with an
increase of 0.54% (mean levels of 100.53mg/dL to 101.07mg/dL), the other study
was by Mafauzy et al (1990) showing an elevation in Glucose levels of 1.87%
(mean levels of 192.77mg/dL elevated to 196.37mg/dL). The interesting aspect
regarding this study is that it was conducted on twenty-two diabetic patients on
oral hypoglycemic agents. Blood was drawn for serum Glucose levels just prior to
the start of Ramadan and at the end of the fasting month.
Studies in 1993 and 1975 showed slight increases in serum Glucose levels.
Maislos conducted a study consisting of twenty-four healthy subjects. Blood
value testing was performed at day 26 and 27 of Ramadan and at one month after
Ramadan. Mean serum blood Glucose concentrations slightly increased from
79.00mg/dL to 83.00mg/dL, an elevation of 4.82% (Maislos et al, 1993). The
1975 study included seven males and took a different approach to Glucose testing
while fasting. They were required to maintain daily dietary records ending one-
week post-Ramadan. Oral Glucose tolerance testing was performed at the
conclusion of Ramadan and again 12 weeks later. Documented mean Glucose
Page 44
32
levels were 85.00mg/dL elevating to 89.00mg/dL or a 4.71% increase in serum
Glucose levels. Also noteworthy, were their findings of a correlation between
“increased ability to dispose of Glucose and enhanced Insulin secretion in
response to an oral Glucose challenge” (Angel and Schwartz, 1975).
Slightly higher increases in Glucose levels were reported from a study by
El Ati et al conducted using sixteen women as subjects. Four laboratory-testing
dates were utilized: 2 days before fasting, the 2nd and the 28th days of Ramadan
and, finally, one month after Ramadan. An increase in serum blood Glucose
levels of 7.2% were noted; with mean levels rising from 87.56 to 93.86 (El Ati et
al, 1995).
When caloric intake is restricted for extended periods of time a state
known as fasting occurs. Whether fasting for medical, personal or religious
reasons Glucose may not always be readily accessible as a fuel source, the body is
then forced to manufacture it from other nutrients, such as from fatty acids found
in adipose tissue or proteins found in muscle tissue. The use of fatty acids for fuel
usually begins when the post-absorptive phase exceeds 14-16 hours. It is the
breakdown and utilization of proteins for energy over extended periods, which
can become a life-threatening occurrence due to the wasting of proteins causing
organ failure (Spriet et al, 2004; Wardlaw; Kessel, 2002 and Smith, 2005).
A few studies examined both Glucose and Insulin concentration levels
during fasting. In 2004, a group of medical physicians examined female
Page 45
33
participates during Ramadan. They focused on Glucose and Insulin levels while
fasting. Serum levels were run on the 14th and 28th day of Ramadan; baseline
was established prior to beginning of fast. A mean Glucose of 97.47mg/dL
(baseline) decreased to a mean of 94.94mg/dL on the 28th day, a drop of 2.59%.
Insulin concentration levels showed a negligible increase from a mean of
7.3µU/mL (baseline) to a mean of 8.83µU/mL (Kassab et al, 2004). A study of
eight mid-distance athletes revealed mean Insulin levels of 20.0 U.1ˉ¹ (baseline)
to 26.1 U. 1ˉ¹ one week after Ramadan (Chennaoui et al, 2009). Other studies
revealed no substantial changes in Insulin concentration levels (Fedail et al, 1982;
Bouhlel et al, 2008).
As previously stated; as blood sugar levels decrease Insulin production
and secretion is inhibited; as this occurs the release of Glucagon is stimulated.
Glucagon is a peptide hormone released by the alpha cells of the pancreas when
blood Glucose levels fall. When Glucagon is secreted it acts on the hepatocytes
to activate the enzymes that are necessary for the breakdown and return of
glycogen into Glucose. Knowing that Glucagon’s major function is to increase
blood Glucose levels, it makes sense that Glucagon is secreted in response to
hypoglycemia or low blood concentrations of Glucose (Spriet et al, 2004 and
smith et al, 2005.
Cortisol is a major glucocorticoid and the third hormone of interest to this
investigation in relation to fasting the month of Ramadan. It is produced in the
Page 46
34
adrenal cortex and released in response to fasting and high stress situations.
Cortisol is a counterregulatory hormone for Insulin. Like Glucagon cortisol reacts
to occurrences of hypoglycemia, whether from excess stress, fasting or low blood
sugars related to high levels of serum Insulin, glycogenolysis. Some of the
pathways for Glucose synthesis from amino acids (gluconeogenesis) are induced
by cortisol as well as by Glucagon (Smith et al, 2005).
Cortisol levels are included in Ramadan studies in order to explore
alterations in biological rhythm-circadian cycles, as well as the effects of fasting
on biochemical processes. A study by Maughan et al in 2008 divided 78 male
athletes into two fasting and two non-fasting groups. Samples were obtained at 3-
week pre-Ramadan (baseline) and after 2-week and 4-week; the results were 93
µg.1ˉ¹, 108 µg.1ˉ¹, and 111 µg.1ˉ¹, for fasting group, respectively. When
comparing the baseline with the second week result there was an elevation of
16.13%, that elevation was increased to 19.35% at week four of Ramadan. For
non-fasting group the baseline was 149 that value remained a constant for 2
weeks and increased to 7.38% at the end of Ramadan.
Another study on cortisol during Ramadan was conducted by Al-Hadramy
in 1987, participants was 7 men and 3 women. Samples were obtained at 1-day
pre-Ramadan (baseline) and day 24 of fasting, results was 348 nmol/l and 542
nmol/l, respectively. Comparing the baseline with day 24 resulted in an elevation
of 55.75%. These two studies are in conflict with the results of Chaouachi et al in
Page 47
35
2007. Fifteen athletes were examined on cortisol levels during Fasting Ramadan.
The samples were obtained 4 day pre Ramadan, 7, 16, and day 29 of fasting
Ramadan, the results were 13.4 mg.1ˉ¹, 9.0 mg.1ˉ¹, 9.3 mg.1ˉ¹, and 10.3 mg.1ˉ¹,
respectively. When comparing the baseline with day 7, 16, 29, results were
decreased 32.48%, 30.6%, 32.13%, respectively.
The physiological relationship between cortisol and creatinine in the
human body is understood and acknowledged. In times of stress or extreme
muscle trauma whether damage is from excessive over-use or traumatic accident
cortisol a glucocorticoid can be released in response to several different
biochemical requirements. When muscles are stressed or extensively damaged
enough to warrant increased muscle metabolism cortisol is able to stimulate
amino acid mobilization from muscle protein. The waste product of this
metabolism is creatinine. A muscle like every other structure in the body requires
fuel. When Glucose levels are low cortisol acting as a counter regulatory hormone
may be released in the body stimulating gluconeogenesis, thus, providing muscles
with fuel for muscle protein metabolism which in turn produces creatinine (Smith
et al, 2005).
Creatinine is produced as a waste by product generated from muscle
metabolism. It is produced from creatine, a molecule of major importance for
energy manufacture in muscles. Approximately 2% of the body’s creatine is
converted to creatinine daily. Creatinine is transported through the bloodstream
Page 48
36
and filtered by the kidneys. Creatinine levels are a key indicator of several
metabolic occurrences’ as well as acute and chronic medical conditions.
Decreased muscle mass related to eating disorders, inadequate intake of dietary
protein or malnutrition as well as degenerative muscle diseases can cause
decreased levels of creatinine. Serum levels can also increase with muscle damage
such as immediately following Myocardial Infarction or muscle damage from
extreme over use. Abnormally, elevated concentrations in urine could indicate
renal dysfunction (Venes, 2005; Fischbach, 1998; Smith, 2005).
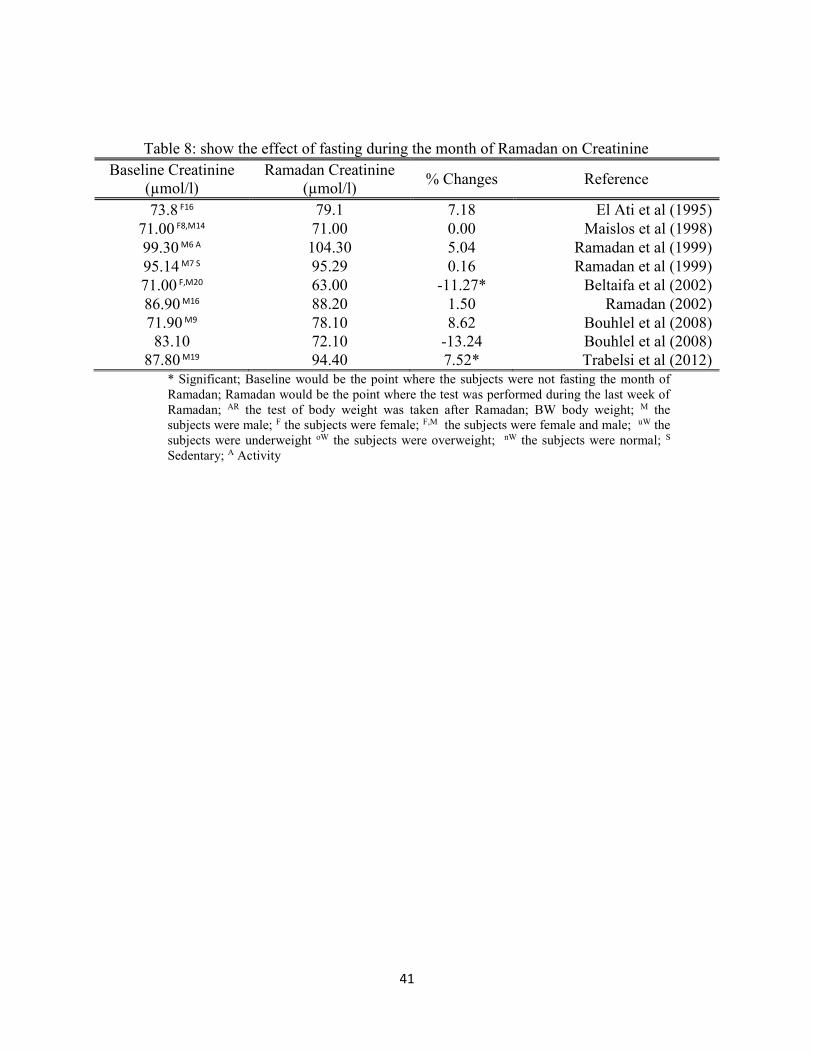
As previously stated elevated creatinine levels can be an indicator of
muscle damage in the human body. Studies have explored the effects of fasting
Ramadan on creatinine levels in humans. While both Maislos et al and Ramadan
et al reported no vital changes in creatinine levels in the their data of fasting
studies, Ramadan et al did explore a bit further by dividing his group into active
and sedentary subjects and looked at pre-and post-Ramadan creatinine levels. The
results of active group presented with mean values of 99.3mg/dl (baseline) with
an elevation to 104.30mg/dl, a change of 5.04% (Table 8). While the sedentary
group data had a mean value of 95.14mg/dl (baseline) to 95.29mg/dl, a change of
0.16% (Ramadan et al, 1999).
However, another study documented decreases in creatinine levels. Lab
values showed a mean of 71mg/dl (baseline) with a decrease to 63mg/dl, a drop of
11.27 were noted (Beltaifa et al, 2002). Nineteen male subjects were divided into
Page 49
37
two groups, one tested after feeding and the other tested after fasting. The fasting
group is the focus of this study. Creatinine values went from a mean of
87.80mg/dl (baseline) to 94.42mg/dl, a change of 7.52% (Trabelsi et al, 2012).
Another study that demonstrated marked changes was Bouhlel et al in 2008. They
evaluated the participants before and after exercise at one week before Ramadan,
10 days and the last day of Ramadan. Pre-exercise values had a mean of
71.9mg/dl (baseline) and 78.1mg/dl, an increased change of 8.62%, while post-
exercise values were a mean of 83.1mg/dl (baseline) to 72.1mg/dl, a decreased
change of 13.24% (Bouhlel et al, 2008).
In summary, fasting influences many physiological functions. It can
induce positive as well as potentially harmful metabolic responses within the
body. Multiple actions as well as biochemical responses come into play when the
human body detects hypo or hyperglycemic states. The pancreas produces
increased levels of Insulin in response to hyperglycemic episodes just as Insulin
levels are decreased for periods of hypoglycemia. The liver also rapidly responds
to hyper and hypoglycemic occurrences by aiding in the adjustment of Glucagon
and the storage of glycogen. Gluconeogenesis, the manufacture of Glucose from
amino acids and fats instead of from carbohydrates, occurs when a person’s
caloric intake changes such as in the state of fasting. Clearly, fasting has a more
positive than negative effect on lipid serum levels. Studies produce visible proof,
Page 50
38
via blood serum values, that metabolic marker’s such as total cholesterol, high-
density lipids and triglyceride levels can positively be affected by fasting.
Fasting during Ramadan frequently alters the body’s natural rhythm
cycles. Our patterns of eating, sleeping, and socialization can all be affected.
Cortisol levels play a significant role in adjusting and supporting these
physiological rhythms. Gluconeogenesis and glycogenolysis are affected by
fasting and can both be stimulated by cortisol release in response to hypoglycemic
as well as decreased protein levels in the body.
A positive aspect in research related to fasting during Ramadan is an
increase in the number of studies exploring and evaluating exercise versus non-
exercise groups along with different types of exercise during the month of
Ramadan (Ramadan et al, 1999, Bouhlel et al, 2008).
The collection of data related to creatinine levels, muscle damage and long
term fasting could provide valuable insight to our scientific communities. Without
a doubt, data collected through research of the month of Ramadan and fasting
could be increasingly advantageous to many health aspects, education, and
exercise professionals.
Page 51
39
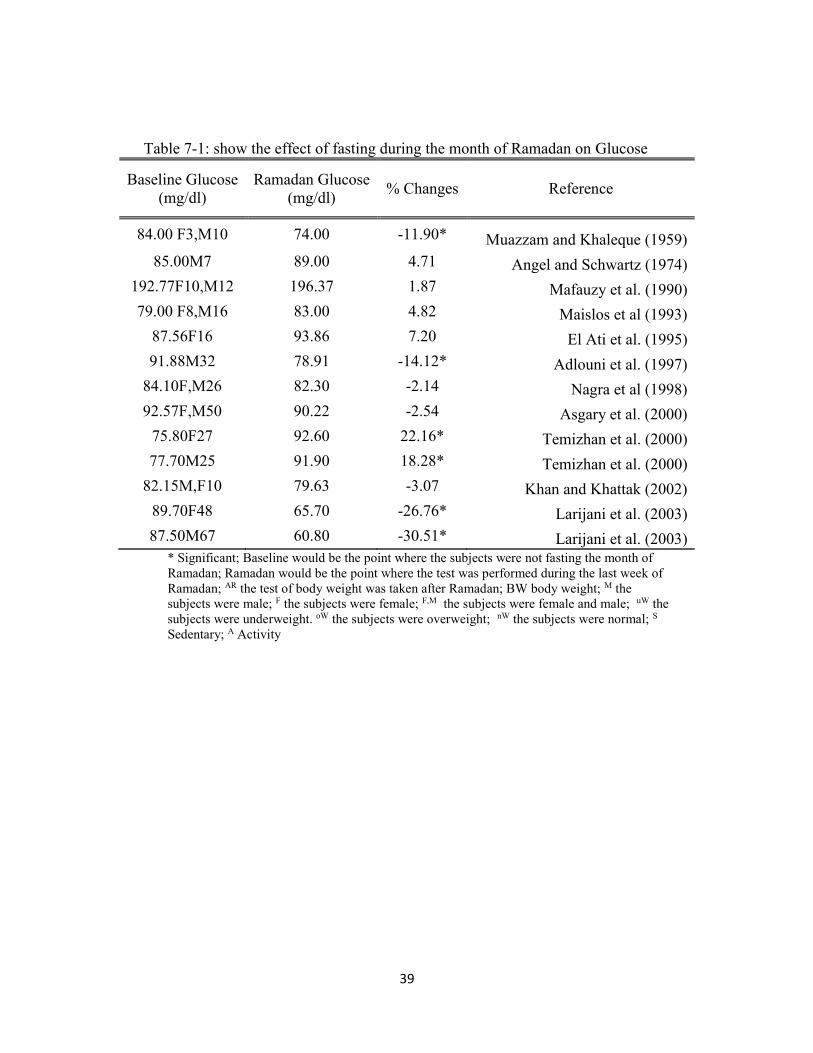
Table 7-1: show the effect of fasting during the month of Ramadan on Glucose
Baseline Glucose
(mg/dl)
Ramadan Glucose
(mg/dl) % Changes Reference
84.00 F3,M10 74.00 -11.90* Muazzam and Khaleque (1959)
85.00M7 89.00 4.71 Angel and Schwartz (1974)
192.77F10,M12 196.37 1.87 Mafauzy et al. (1990)
79.00 F8,M16 83.00 4.82 Maislos et al (1993)
87.56F16 93.86 7.20 El Ati et al. (1995)
91.88M32 78.91 -14.12* Adlouni et al. (1997)
84.10F,M26 82.30 -2.14 Nagra et al (1998)
92.57F,M50 90.22 -2.54 Asgary et al. (2000)
75.80F27 92.60 22.16* Temizhan et al. (2000)
77.70M25 91.90 18.28* Temizhan et al. (2000)
82.15M,F10 79.63 -3.07 Khan and Khattak (2002)
89.70F48 65.70 -26.76* Larijani et al. (2003)
87.50M67 60.80 -30.51* Larijani et al. (2003) * Significant; Baseline would be the point where the subjects were not fasting the month of
Ramadan; Ramadan would be the point where the test was performed during the last week of
Ramadan; AR the test of body weight was taken after Ramadan; BW body weight; M the
subjects were male; F the subjects were female; F,M the subjects were female and male; uW the
subjects were underweight. oW the subjects were overweight; nW the subjects were normal; S
Sedentary; A Activity
Page 52
40
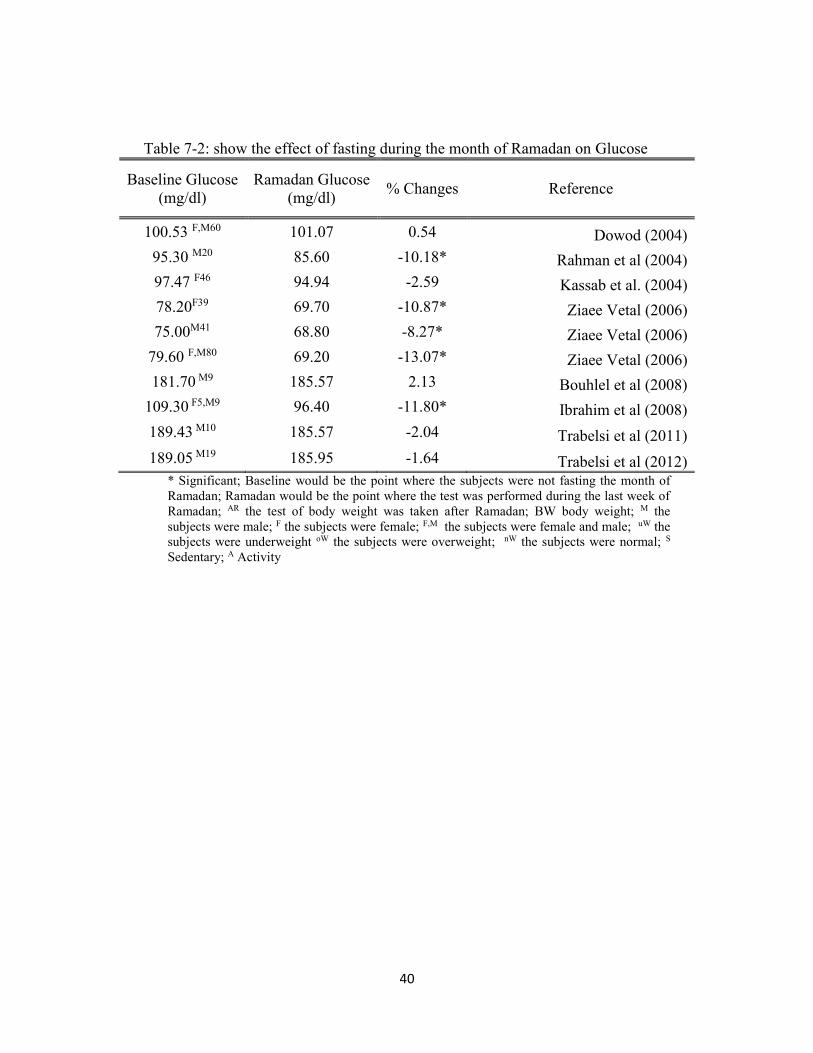
Table 7-2: show the effect of fasting during the month of Ramadan on Glucose
Baseline Glucose
(mg/dl)
Ramadan Glucose
(mg/dl) % Changes Reference
100.53 F,M60 101.07 0.54 Dowod (2004)
95.30 M20 85.60 -10.18* Rahman et al (2004)
97.47 F46 94.94 -2.59 Kassab et al. (2004)
78.20F39 69.70 -10.87* Ziaee Vetal (2006)
75.00M41 68.80 -8.27* Ziaee Vetal (2006)
79.60 F,M80 69.20 -13.07* Ziaee Vetal (2006)
181.70 M9 185.57 2.13 Bouhlel et al (2008)
109.30 F5,M9 96.40 -11.80* Ibrahim et al (2008)
189.43 M10 185.57 -2.04 Trabelsi et al (2011)
189.05 M19 185.95 -1.64 Trabelsi et al (2012) * Significant; Baseline would be the point where the subjects were not fasting the month of
Ramadan; Ramadan would be the point where the test was performed during the last week of
Ramadan; AR the test of body weight was taken after Ramadan; BW body weight; M the
subjects were male; F the subjects were female; F,M the subjects were female and male; uW the
subjects were underweight oW the subjects were overweight; nW the subjects were normal; S
Sedentary; A Activity
Page 53
41
Table 8: show the effect of fasting during the month of Ramadan on Creatinine
Baseline Creatinine
(µmol/l)
Ramadan Creatinine
(µmol/l) % Changes Reference
73.8 F16 79.1 7.18 El Ati et al (1995)
71.00 F8,M14 71.00 0.00 Maislos et al (1998)
99.30 M6 A 104.30 5.04 Ramadan et al (1999)
95.14 M7 S 95.29 0.16 Ramadan et al (1999)
71.00 F,M20 63.00 -11.27* Beltaifa et al (2002)
86.90 M16 88.20 1.50 Ramadan (2002)
71.90 M9 78.10 8.62 Bouhlel et al (2008)
83.10 72.10 -13.24 Bouhlel et al (2008)
87.80 M19 94.40 7.52* Trabelsi et al (2012)
* Significant; Baseline would be the point where the subjects were not fasting the month of
Ramadan; Ramadan would be the point where the test was performed during the last week of
Ramadan; AR the test of body weight was taken after Ramadan; BW body weight; M the
subjects were male; F the subjects were female; F,M the subjects were female and male; uW the
subjects were underweight oW the subjects were overweight; nW the subjects were normal; S
Sedentary; A Activity
Page 54
42
2.5 The physical performance of Muslim athletes during Ramadan
The Muslim athletes in the London Olympic Games of 2012 were facing
an immense challenge as they compete during the fast of Ramadan. There is a
similarity between fasting and a single bout of endurance exercise on metabolic
stress. Each type of stress causes a depletion of energy resources within the
human body (Stannrd, 2011).
Memari with others in 2011 established that the time-span of an
individual’s agility performance test was significantly affected by fasting during
Ramadan. Interestingly, the vertical board jump and the balance performance did
not show any statistical changes. Conversely, a study by Kordi in 2011, revealed
no noteworthy changes in any times related to agility performance or vertical
jumping.
A study conducted by Meckel with others tested different variables of
performance such as a: vertical jump, 40m run, 4 x10m shuttle run, sum 6 x 40m
run, and a 3000m run. They found that the aerobic endurance was significantly
decreased based on the increased time of a 3000m run lasting from 812.8 seconds
to 819.9 seconds at the end of Ramadan fast. In addition, they found the ability of
jumping was decreased significantly from 44.8 cm to 44.0 cm. In their study,
which consisted of nineteen healthy young male soccer players, a significant
decrease in athletic performance capacities was confirmed.
Page 55
43
Nine subjects in a study that was conducted by Abdedlmalek et al in 2011
performed Wingate test. Subjects participated in a three-part exercise plan
consisting of the first and fourth week of Ramadan, followed up with a last
session at three weeks after Ramadan. The conclusions of that study noted that
there was no significant difference during the occasions of testing.
Chennaoui with others in 2009 conducted a study on eight middle distance
athletes. Their results showed that the maximal aerobic velocity test was
influenced negatively by fasting during Ramadan which was statistically
significant by comparing days 7 and 21 of Ramadan with 5 days prior to start of
Ramadan. Also, they looked at fatigue, which was significantly increased at the
end of Ramadan from 5.0 to 7.3.
A comparison study was conducted of sedentary and active males in response to
physical exercise training sessions during Ramadan. The subjects were thirteen
healthy men who were tested using the sub-maximal test on a bicycle ergometer
for maximal oxygen consumption, ventilation, carbon dioxide output, the
respiratory exchange ratio and the heart rate. They found the maximal aerobic
capacity was considerably higher in the active group in comparison to the
sedentary group and the respiratory exchange ratio was decreased significantly in
both groups at the end of RF and only for the A group the heart rate was notably
decreased while there were no prominent differences in the other variables
(Ramadan et al, 1999). In a subsequent study in 2002 Ramadan confirmed his
Page 56
44
earlier findings of diminished heart rate and ventilation at the end of Ramadan in
correlation to performance testing (Ramadan, 2002).
In summary, the athletes performance were influenced by fasting the
month of Ramadan on endurance ability. However, the results on the strength and
power performance were inconsistent in the studies conducted during Ramadan
fasting. It is important to consider that the length of a sport event is the major
factor that may influence the performance of athletes during fasting Ramadan.
Page 57
45
CHAPTER III
METHODS & PROCEDURES
3.1 Participants
Ten healthy athletic male subjects without any known disease or taking
any medication that influenced lipid profile, Glucose, hormone levels were
randomly selected from a first division Saudi soccer league (Raka Soccer
League).
3.2 Study Design
Subjects were asked to come to the Prince Faisal Bin Fahad Sports
Medicine Hospital four times. Table 3.1 shows the timeline of the testing and
procedures. Two times before the month of Ramadan, while the other two during
the month of Ramadan. The first visit was one week before the month of
Ramadan and health history and physical activity were obtained while the second
visit was at one day before the month of Ramadan. The third visit was on the 10th
of Ramadan while the fourth visit was on the 28th of Ramadan. During each visit,
physical activity, height and weight were determined. During the last three visits
the body composition was measured using a Dual Energy X-ray Absorptiometry
(DEXA) measurement, venous blood was collected using standard venipuncture
technique. The subjects were asked to recall their diet for the three days prior to
the second, third and fourth visit. In addition, the subjects were asked to eat the
same amount and type of food one day before each visit.
Page 58
46
Visit 1 Visit 2 Visit 3 Visit 4
1 week prior to Ramadan 1 day prior to Ramadan 10th day of Ramadan 28th day of Ramadan
Questionnaires
Health History
Physical Activity
Physical Activity
Questionnaire
3 day diet recall
DEXA scan
Fasting blood draw
Physical Activity
Questionnaire
3 day diet recall
DEXA scan
Fasting blood draw
Physical Activity
Questionnaire
3 day diet recall
DEXA scan
Fasting blood draw
Table 3-1 timeline of testing procedures
3.2.1 Anthropometric
Each individual had have his height measured and his weight was
recorded. We used a standard height measurement chart and the obtained
measurement was rounded to the nearest centimeter (cm). Each subject’s weight
was obtained utilizing a standard digital weight scale and rounded to the nearest
0.1 kilogram (kg). Body fat and lean body mass was obtained through the use of
Dual-Energy X-ray Absorptiometry (DEXA). During this test, subjects were
asked to lay face up, on a padded table, motionless for 7-15 minutes while the
scanner arm of the DEXA machine passes over their entire body to examine body
composition (relative amounts of fat mass and lean body mass).
Page 59
47
3.2.2 Blood Analysis
Blood samples were analyzed for lipid profile, Glucose, Insulin, Cortisol,
Glucagon, Albumin and Total protein venous blood was collected from the
antecubital fossa using standard venipuncture technique. A sterile 20G, 11/2 inch
needle attached to a sterile 10ml syringe (Becton Dickinson & Co., Franklin
Lakes, NJ) with leur-lock adaptor was used for all test subjects at each blood
draw. Prior to each blood draw, the subject was requested to sit for 30 minutes to
minimize risk of hemoconcentration of blood sample. All blood sampling was
performed at 1800 hours on the day of testing; in the fasting state.
After obtaining the sample, 10 ml of venous blood was transferred to two
Vacutainer tubes containing no additives (Becton Dickinson Vacutainer Systems,
Franklin Lakes, NJ). Blood was allowed to clot for 30minutes at 25oC. Blood was
centrifuged for 15 minutes at 4oC. Serum sample was stored at -80oC and remain
stable for at least one month. The following day all samples for each subject was
run in duplication in the same assay.
Page 60
48
3.2.4 Dietary Recall and Physical Activity
All subjects were asked to record food and drink consumption (including
portion sizes) for three days (two weekdays and one weekend day) prior to their
2nd, 3rd and 4th visit. The Arab Food Analysis Program was used to analysis the
food intake. In addition, the subjects filled physical activity questioners for seven
consecutive days prior 2nd, 3rd and 4th visit. The Global Physical Activity
Questionnaire (QPAG) Analysis Guide was used to analysis the physical activity.
3.2.5 Statistic
We used SPSS package to analyze the data for all variables (Body Weight,
Fat Body Mass, Lean Body Mass, Ratio of Andriod to Gynoid, Glucose, Insulin,
Glucagon, Cortisol, Albumin, Total Protien, TC, TG, LDL, VLDL, Ratio LDL to
HDL, Physical Activity, Vigorous Activity, Moderate Activity, Walking Activity,
Energy Intake, Protein Intake, Fat Intake and Carbohydrate Intake). Data was
expressed as means ± SD and were analyzed using analysis variance repeated
measures a 1x3 ANOVA. P < 0.05 was accepted as statistically significant.
Page 61
49
RESULTS
4.1 Description of the subjects
The subject characteristics are presented as mean and standard deviation
(M ± SD) in table 4.1. The data was obtained from eight subjects who were
athletic soccer players from a first division Saudi soccer league (Raka Soccer
League) with an average age of 21.752.05, average height of 170.685.21cm
and average body weight of 66.737.51kg. The sample size was too small to
evaluate whether assumptions of multivariate normality were satisfied. The
Mauchly test was performed to assess possible violation of the sphericity
assumption
4.2 Body composition
The data of body weight kg (BW), Lean body mass, Body Fat percentage
(BF%) and Android to Gynoid Ration (A/G) are presented in Table 4.2 as means
and standard deviations. To evaluate whether intermittent fasting effect BW,
Lean, BF% and A/G levels on athletic soccer players, one-way repeated measures
ANOVA were performed. Eight participants were tested under three measurement
conditions: baseline one day before Ramadan (D1), after ten days of fasting
Ramadan (D10) and twenty-eight days of fasting Ramadan (D28). The Mauchly
test was performed to assess possible violation of the sphericity assumption; this
was not significant for BW, Lean, BF% and A/G as presented in table 4.3, which
Page 62
50
suggests that the sample size is too small and therefore this test may not have
sufficient power to detect violations of sphericity. The Greenhous-Geisser £ value
of 0.964, 0.903, 0.666, and 0.748 for BW, Lean, BF% and A/G, respectively
suggested that the sample variance/covariance matrix did not depart substantially
from sphericity. Because the Greenhouse-Geisser ƹ value was close to 1, no
correction needs to be made to the degrees of freedom used to evaluate the
significance of the F ratio.
The overall F of differences in mean BW and Lean across the three
measurement conditions was statistically significant: F (2, 14) = 7.200, p=.007
and F (2, 14) = 8.648, p =.004, respectively; the corresponding effect size was a
partial 𝜋2 of .507, and .553 for BW and Lean, respectively. In other words, after
stable individual differences in BW and Lean are taken into account,
approximately 50%, and 55% of the variances were related to intermittent fasting.
Note that even if the ƹ correction factor is applied to the degrees of freedom for F,
the obtained value of F for differences in mean BW and Lean among the three
times of testing remains statistically significant.
Planned contrasts were obtained to compare the three times of measuring
the levels of BW and Lean.
BW levels during baseline (M D1 = 66.73) were similar to the mean of
BW during the D10 (M D10 =66.73). There was no significant difference between
the two means: t (7) = .000, p =.1.000. However, the mean difference between
Page 63
51
BW during D10 (M D10 = 66.73) and D28 (M D28 =65.53) was statistically
significant: t (7) = 3.136, p=.016. In addition, BW during the baseline (M D1 =
66.73) was also higher than the mean of BW during D28 (M D28 =65.53). The
mean difference between D1 and D28 was statistically significant: t (7) = 3.140,
p=.016. A graph of Body Weight means change appears in figure 4.1. Thus, of the
three measure interventions in this study, only the comparison between the
baseline with D10 and D28 had significant changes.
Lean body mass levels during baseline (M D1 = 50.519) were almost
identical to the mean of Lean body mass during the D10 (M D10 =50.469). There
were no significant difference between the two means: t (7) = .189, p =.856.
However, the mean difference between Lean during D10 (M D10 = 50.469) and
D28 (M D28 =49.462) was statistically significant: t (7) = 3.049, p=.019. In
addition, Lean during the baseline (M D1 = 50.519) was also higher than the mean
of Lean during D28 (M D28 =49.462). The mean difference between D1 and D28
was statistically significant: t (7) = 4.115, p=.004. A graph of Body Weight means
change appears in figure 4.2. Thus, of the three measure interventions in this
study, only the comparison between the baseline with D10 and D28 had
significant changes.
BF% and A/G showed no significant differences between all the
measurements. The overall F of differences in mean BF% and A/G across the
three measurement conditions was also not statistically significant: F (2, 14)
Page 64
52
=.033, p =.968 and F (2, 14) = 1.334, p = .295, respectively; the corresponding
effect size was a partial 𝜋2 of 0.005 and 0.160. In other words, after stable
individual differences in BF% and A/G are taken into account, 0.5% and 16% of
the variance in BF% and A/G respectively were related to intermittent fasting.
Note that even if the ƹ correction factor is applied to the degrees of freedom for F,
the obtained value of F for differences in mean BF% and A/G among the three
times of testing remains not statistically significant. A graph of BF% and A/G
means change appears in figure 4.3 and 4.4.
Page 65
53
4.3 Glucose, Blood Proteins and Hormones
The data of Glucose, blood proteins and hormones are presented in table
4.4 as means and standard deviations. To evaluate whether intermittent fasting
effect Glucose, Insulin, Glucagon, Cortisol, Albumin and Total Protein levels on
athletic soccer players, one-way repeated measures ANOVA was performed. The
Mauchly test was performed to assess possible violation of the sphericity
assumption; this was not significant for Glucose, Insulin, Glucagon, Cortisol
Albumin and Total protein as presented in table 4.5. It suggested that the sample
size is to small; this test may not have sufficient power to detect violations of
sphericity. The Greenhous-Geisser £ value of 0.628, 0.623, 0.640, 0.943, 0.657,
0.992 for Glucose, Insulin, Glucagon, cortisol, albumin and total protein,
respectively suggested that the sample variance/covariance matrix did not depart
substantially from sphericity. Because the Greenhouse-Geisser ƹ value was
sufficient, no correction needs to be made to the degrees of freedom used to
evaluate the significance of the F ratio.
The overall F of differences in mean Glucose, Glucagon and Albumin
across the three measurement conditions was statistically significant: F (2, 14) =
4.025, p=.042; F (2, 14) = 6.16, p =.012; F (2, 14) = 23.47, p=.001 respectively;
the corresponding effect size was a partial 𝜋2 of .365, .468 and .770 for Glucose
Glucagon and Albumin, respectively. In other words, after stable individual
differences in Glucose, Glucagon and Albumin are taken into account, about 36%,
Page 66
54
46% and 77% of the variance in Glucose, Glucagon and Albumin, respectively
were related to intermittent fasting. Note that even if the ƹ correction factor is
applied to the degrees of freedom for F, the obtained value of F for differences in
mean Glucose, Glucagon and Albumin among the three times of testing remains
statistically significant.
Planned contrasts were obtained to compare between the three times of
measuring the levels of Glucose, Glucagon and Albumin.
Glucose levels during baseline (M D1 = 81.87) were found lower than the
mean of Glucose during the D10 (M D10 =90.75). The difference between the two
means was not statistically significant: t (7) = -2.095, p =.074. In addition, the
mean difference between Glucose during D10 (M D10 = 90.75) and D28 (M D28
=91.00) was not statistically significant: t (7) = -0.057, p=.956. However, Glucose
during the baseline (M D1 = 81.87) was lower than the mean of Glucose during
D28 (M D28 =91.00). The mean difference between D1 and D28 was statistically
significant: t (7) = -5.164, p=.001. A graph of Glucose means change appears in
figure 4.5. Thus, of the three measure interventions in this study, only the
comparison between D1 and D28 had significant changes.
Glucagon levels during baseline (M D1 = 42.87) were found greater than
the mean of Glucagon during the D10 (M D10 =29.12). The difference between the
two means was statistically significant: t (7) =3.346, p =.012. In addition, the
Glucagon Levels during the baseline (M D1 = 42.87) were also greater than the
Page 67
55
Glucagon mean during D28 (M D28 =34.00). However, the mean difference
between Glucagon D1 and D28 was not statistically significant: t (7) = 1.761,
p=.122. Also, the mean difference between Glucagon during D10 (M D10 = 29.12)
and D28 (M D28 =34.00) was not statistically significant: t (7) = -2.177, p=.066. A
graph of Glucagon means change appears in figure 4.6. Thus, of the three times
interventions in this study, only D10 had significantly lower mean Glucagon than
D1 baseline.
Albumin levels during baseline (M D1 = 46.75) were found greater than the
mean of Albumin levels during the D10 (M D10 =42.50). The difference between
the two means was statistically significant: t (7) =5.19, p =.001. In addition,
Albumin during the baseline (M D1 = 46.75) was also greater than the mean of
Albumin during D28 (M D28 =41.25). The mean difference between Albumin D1
and Albumin D28 was statistically significant as well: t (7) = 10.29, p=.001.
However, the mean difference between Albumin during D10 (M D10 = 42.50) and
Albumin D28 (M D28 =41.25) was not statistically significant: t (7) = 1.15,
p=.29. A graph of Albumin means change appears in figure 4.7. Thus, of the three
measure interventions in this study, only D10 and D28 had significantly lower
mean than baseline.
Insulin, Cortisol and Total Protein showed no significant differences
between all the measurements. The overall F of differences in mean Insulin,
Cortisol and Total Protein across the three measurement conditions was not
Page 68
56
statistically significant: F (2, 14) =.539, p =.595; F (2, 14) = 1.637, p =.230 and F
(2, 14) = 1.135, p = .349, respectively; the corresponding effect size was a partial
𝜋2 of 0.071, 0.19, and 0.14. In other words, after stable individual differences in
Insulin are taken into account, about 7%, 19% and 14% of the variance in Insulin,
Cortisol and Total Protein respectively were related to intermittent fasting. Note
that even if the ƹ correction factor is applied to the degrees of freedom for F, the
obtained value of F for differences in mean Insulin, Cortisol and Total Protein
among the three times of testing remains not statistically significant. A graph of
Insulin, Cortisol and Total Protein means change appears in figure 4.8, 4.9 and
4.10, respectively.
Page 69
57
4.4 Lipid Profiles
The data of total cholesterol (TC), triglycerides (TG), low-density
lipoprotein (LDL), high-density lipoprotein (HDL), very low-density lipoprotein
(VLDL) and the ratio of low-density lipoprotein to high-density lipoprotein
(LDL/HDL) are presented in Table 4.6 as means and standard deviations. To
evaluate whether Ramadan fasting effect TC, TG, LDL, HDL, VLDL and
LDL/HDL levels on athletic soccer players, a one-way repeated measures
ANOVA was performed. The Mauchly test was performed to assess possible
violation of the sphericity assumption; this was not significant for TC, TG, LDL,
HDL, VLDL and LDL/HDL as presented in table 4.7. It suggested that the sample
size is too small; this test may not have sufficient power to detect violations of
sphericity. The Greenhous-Geisser £ value of 0.593, 0.631, 0.575, 0.858, 0.631,
0.894 for TC, TG, LDL, HDL, VLDL and LDL/HDL, respectively suggested that
the sample variance/covariance matrix did not depart substantially from
sphericity. Because the Greenhouse-Geisser ƹ value was sufficient, no correction
needs to be made to the degrees of freedom used to evaluate the significance of
the F ratio.
The overall F of differences in mean LDL/HDL across the three
measurement conditions were statistically significant: F (2, 14) = 11.301, p=.001;
the corresponding effect size was a partial 𝜋2 of .618. In other words, after stable
individual differences in LDL/HDL are taken into account, about 62% of the
Page 70
58
variance in LDL/HDL was related to fasting Ramadan. Note that even if the ƹ
correction factor is applied to the degrees of freedom for F, the obtained value of
F for differences in mean LDL/HDL among the three times of testing remains
statistically significant.
Planned contrasts was obtained to compare between the three times of
measuring the levels of LDL/HDL.
LDL/HDL levels during baseline (M D1 = 1.76) were found lower than the
mean of LDL/HDL during the D10 (M D10 =2.01). The difference between the two
means was statistically significant: t (7) = -2.975, p =.021. Also, LDL/HDL
during the baseline (M D1 = 1.76) was lower than the mean of LDL/HDL during
D28 (M D28 =91.00). The mean difference between D1 and D28 was statistically
significant: t (7) = -4.136, p=.004. However, the mean difference between
LDL/HDL during D10 (M D10 = 2.01) and D28 (M D28 =2.22) was not statistically
significant: t (7) = -2.266, p=.058. A graph of LDL/HDL means change appears in
figure 4.11. Thus, of the three measure interventions in this study, only the
comparison between D1 with D10 and D28 had significant changes.
TC, TG, LDL, HDL and VLDL showed no significant differences
between all the measurements. The overall F of differences in mean TC, TG,
LDL, HDL and VLDL across the three measurement conditions was not
statistically significant: F (2, 14) = .297, p = .748; F (2, 14) = 1.803, p =.201; F (2,
14) = 2.391, p = .128; F (2, 14) = 2.88, p =.089; and F (2, 14) = 1.803, p =.201,
Page 71
59
respectively; the corresponding effect size was a partial 𝜋2 of 0.041, 0.205, 0.255,
0.292, and 0.205, respectively. In other words, after stable individual differences
in TC, TG, LDL, HDL and VLDL are taken into account, about 4%, 20%, 25%,
29% and 20% of the variance in TC, TG, LDL, HDL and VLDL respectively
were related to intermittent fasting. Note that even if the ƹ correction factor is
applied to the degrees of freedom for F, the obtained value of F for differences in
mean TC, TG, LDL, HDL and VLDL among the three times of testing remains
not statistically significant. Graphs of TC, TG, LDL, HDL and VLDL means
change appears in figure 4.12, 4.13, 4.14, 4.15 and 4.16, respectively.
Page 72
60
4.5 Physical activities
The data of physical activates MET-minutes/week (PA), vigorous (V),
moderate (M) and walking (W) are presented in Table 4.8 as means and standard
deviations. To evaluate whether intermittent fasting effect PA, V, M, and W
levels on athletic soccer players, one-way repeated measures ANOVA were
performed. Eight participants were tested under three measurement conditions:
baseline one day before Ramadan (D1), after ten days of fasting Ramadan (D10)
and twenty-eight days of fasting Ramadan (D28). The Mauchly test was
performed to assess possible violation of the sphericity assumption; this was not
significant for PA, V, M and W as presented in table 4.9, which suggests that the
sample size is too small and therefore this test may not have sufficient power to
detect violations of sphericity. The Greenhous-Geisser £ value of 0.704, 0.900,
0.802, and 0.598 for PA, V, M and W, respectively suggested that the sample
variance/covariance matrix did not depart substantially from sphericity. Because
the Greenhouse-Geisser ƹ value was sufficient, no correction needs to be made to
the degrees of freedom used to evaluate the significance of the F ratio.
The overall F of differences in mean PA, V and M and W across the three
measurement conditions was statistically significant: F (2, 14) = 29.363, p=.001,
F (2, 14) = 23.355, p =.001 and F (2, 14) = 8.888, p =.003, respectively; the
corresponding effect size was a partial 𝜋2 of .807, .769 and .559 for PA, V and M,
respectively. In other words, after stable individual differences in PA, V and M
Page 73
61
are taken into account, approximately 80%, 76% and 55% of the variances were
related to intermittent fasting. Note that even if the ƹ correction factor is applied
to the degrees of freedom for F, the obtained value of F for differences in mean
PA, V and M among the three times of testing remains statistically significant.
Planned contrasts were obtained to compare the three times of measuring
the levels Physical Activities, Vigorous activities and Moderate activities.
physical activity levels during baseline (M D1 = 4036) were higher than the
mean of PA during the D10 (M D10 =3715). There was no significant difference
between the two means: t (7) = 2.257, p =.059. However, the mean difference
between PA during D10 (M D10 = 3715) and D28 (M D28 =2309) was statistically
significant: t (7) = 5.028, p=.002. In addition, PA during the baseline (M D1 =
4036) was also higher than the mean of PA during D28 (M D28 =2309). The mean
difference between D1 and D28 was statistically significant: t (7) = 6.351, p=.001.
A graph of PA means change appears in figure 4.17. Thus, of the three measure
interventions in this study, only the comparison between the baseline and D10
with D28 had significant changes.
Vigorous physical activity levels during baseline (M D1 = 1500) were
higher than the mean of V during the D10 (M D10 =1075). There were no
significant difference between the two means: t (7) = 1.831, p =.110. However,
the mean difference between V during D10 (M D10 = 1075) and D28 (M D28 = 45)
was statistically significant: t (7) = 5.749, p=.001. In addition, PA during the
Page 74
62
baseline (M D1 = 1500) was also higher than the mean of PA during D28 (M D28
=45). The mean difference between D1 and D28 was statistically significant: t (7)
= 6.051, p=.001. A graph of Vigorous physical activity means change appears in
figure 4.18. Thus, of the three measure interventions in this study, only the
comparison between the baseline and D10 with D28 had significant changes.
Moderate physical activity levels during baseline (M D1 = 1305) was lower
than the mean of M during the D10 (M D10 =1485). There were no significant
difference between the two means: t (7) = -.606, p =.564. However, the mean
difference between M during D10 (M D10 = 1485) and D28 (M D28 = 517) was
statistically significant: t (7) = 4.244, p=.004. In addition, M during the baseline
(M D1 = 1305) was also higher than the mean of M during D28 (M D28 =517). The
mean difference between D1 and D28 was statistically significant: t (7) = 4.009,
p=.005. A graph of Moderate physical activity means change appears in figure
4.19. Thus, of the three measure interventions in this study, only the comparison
between the baseline and D10 with D28 had significant changes.
Walking activities showed no significant differences between all the
measurements. The overall F of differences in mean W across the three
measurement conditions was also not statistically significant: F (2, 14) = 3.238, p
=.070; the corresponding effect size was a partial 𝜋2 of .316. In other words, after
stable individual differences in W are taken into account, 31% of the variance in
walking was related to intermittent fasting. Note that even if the ƹ correction
Page 75
63
factor is applied to the degrees of freedom for F, the obtained value of F for
differences in mean Walking among the three times of testing remains not
statistically significant. A graph of Walking and means change appears in figure
4.20.
Page 76
64
4.6 Food Intakes
The data of Energy Intake (EI), Percentage of Calories from Protein
(CP%), Percentage of Calories from Fat (CF%) and Percentage of Calories from
Carbohydrate (CC%) are presented in Table 4.8 as means and standard deviations.
To evaluate whether intermittent fasting effect EI, CP%, CF%, and CC% levels
on athletic soccer players, one-way repeated measures ANOVA were performed.
The Mauchly test was performed to assess possible violation of the sphericity
assumption; this was not significant for EI, CP%, CF%, and CC% as presented
in table 4.9, which suggests that the sample size is too small and therefore this test
may not have sufficient power to detect violations of sphericity. The Greenhous-
Geisser £ value of 0.798, 0.969, 0.777, and 0.651for EI, CP%, CF%, and CC%,
respectively suggested that the sample variance/covariance matrix did not depart
substantially from sphericity. Because the Greenhouse-Geisser ƹ value was
sufficient, no correction needs to be made to the degrees of freedom used to
evaluate the significance of the F ratio.
The overall F of differences in mean CP%, and CC% across the three
measurement conditions was statistically significant: F (2, 14) = 10.475, p=.002
and F (2, 14) = 7.321, p =.007, respectively; the corresponding effect size was a
partial 𝜋2 of .599 and .511 for CP%, and CC%, respectively. In other words,
after stable individual differences in CP%, and CC% are taken into account,
approximately 59% and 51% of the variances were related to the month of
Page 77
65
Ramadan. Note that even if the ƹ correction factor is applied to the degrees of
freedom for F, the obtained value of F for differences in mean CP%, and CC%
among the three times of testing remains statistically significant.
Planned contrasts were obtained to compare the three times of measuring
the levels Percentage of Calories from Protein and Percentage of Calories from
Carbohydrate intake.
Percentage of Calories from Protein during baseline (M D1 = 17.57) were
higher than the mean of CP% during the D10 (M D10 =12.50). There was
significant difference between the two means: t (7) = 3.754, p =.007. In addition,
CP% during the baseline (M D1 = 17.57) was also higher than the mean of CP%
during D28 (M D28 =11.35). The mean difference between D1 and D28 was
statistically significant: t (7) = 3.971, p=.005. However, the mean difference
between CP% during D10 (M D10 = 12.50) and D28 (M D28 =11.35) was
statistically not significant: t (7) = .817, p=.441. A graph of CP% means change
appears in figure 4.17. Thus, of the three measure interventions in this study, only
the comparison between the baseline with D10 and D28 had significant changes.
Percentage of Calories from Carbohydrate ( CC%) during baseline (M D1
= 47.79) were lower than the mean of CC% during the D10 (M D10 =59.01).
There was significant difference between the two means: t (7) = -2.663, p =.032.
In addition, CP% during the baseline (M D1 = 47.79) was also lower than the
mean of CC% during D28 (M D28 =57.89). The mean difference between D1 and
Page 78
66
D28 was statistically significant: t (7) = -3.431, p=.011. However, the mean
difference between CC% during D10 (M D10 = 59.01) and D28 (M D28 =57.89)
was statistically not significant: t (7) = .504, p=.629. A graph of CP% means
change appears in figure 4.17. Thus, of the three measure interventions in this
study, only the comparison between the baseline with D10 and D28 had
significant changes.
Energy Intake (EI) and Percentage of Calories from Fat ( CF%) showed no
significant differences between all the measurements. The overall F of differences
in mean EI and CF% across the three measurement conditions was not statistically
significant: F (2, 14) = 2.069, p =.163 and F (2, 14) = 4.323, p =.035 the
corresponding effect size was a partial 𝜋2 of .228 and .382. In other words, after
stable individual differences in EI and CF% are taken into account, 22% and 38%
of the variance in EI and CF% respectively was related to the month of Ramadan.
Note that even if the ƹ correction factor is applied to the degrees of freedom for F,
the obtained value of F for differences in mean EI and CF% among the three
times of testing remains not statistically significant. A graph of EI and CF%
means change appears in figure 4.20.
Page 79
67
Table 4.1.Subject characteristics.
Characteristics Minimum Maximum Mean SD
Age (yrs) 19.00 24.00 21.75 2.05
Height (cm) 161.50 177.00 170.68 5.21
Body Weight (kg) 54.70 76.90 66.73 7.51
Subjects participated in the study (n=8).
Page 80
68
Table 4.2.Changes in Body Composition
Measurements Before
Ramadan
10th of
Ramadan
28th of
Ramadan
Body Weight(kg) 66.737.51 66.738.05 65.537.63*^
Lean (kg) 50.515.33 50.465.79 49.465.18*^
Fat % 17.882.75 17.812.46 17.863.00
A/G Ratio 1.210.13 1.190.17 1.150.15
Data presented as mean standard deviation. *=significantly different vs.
baseline (p<0.05). ^=significantly different vs. D10.
Page 81
69
Table 4.3. Present data of Mauchly’s Test of Sphericity
Within
subjects
effect
Mauchly’s
W
Approx.
Chi-Square
df Sig Greenhouse-
Geisser
BW .962 .230 2 .892 .964
Lean .893 681 2 .711 .903
Fat % .499 4.173 2 .124 .666
A/G .662 2.473 2 .290 .748
Test of with-Subjects Effects
Source df(..,..) F Sig Partial Eta
Squared
%
BW (2,14) 7.200 .007 .507 50
Lean (2,14) 8.648 .004 .553 55
Fat % (2,14) .033 .968 .005 0.5
A/G (2,14) 1.334 .295 .160 16
Page 82
70
Table 4.4.Changes in Blood variables
Measurements Before
Ramadan
10th of
Ramadan
28th of
Ramadan
Glucose 81.8704.01 90.7511.90 91.0003.25*
Insulin 07.6002.63 06.4503.90 06.1803.73
Glucagon 42.8716.69^ 29.1208.80 34.0009.97
Cortisol 13.5705.67 12.5305.71 09.2705.43
Albumin 46.7501.58^ 42.5001.85 41.2502.54*
Total Protein 77.0003.11 74.8705.48 74.6204.37
Data presented as mean standard deviation. *=significantly different vs.
baseline (p<0.05).^=significantly different vs. D10.
Page 83
71
Table 4.5. Present data of Mauchly’s Test of Sphericity
Within
subjects
effect
Mauchly’s
W
Approx.
Chi-Square
df Sig Greenhouse-
Geisser
Glucose .408 5.376 2 .068 .628
Insulin .394 5.584 2 .061 .623
Glucagon .438 4.959 2 .084 .640
Cortisol .939 .376 2 .828 .943
Albumin .478 4.430 2 .109 .657
Total Protein .992 .049 2 .976 992
Test of with-Subjects Effects
Source df(..,..) F Sig Partial Eta
Squared
%
Glucose (2,14) 4.025 .042 .365 36
Insulin (2,14) .539 .595 .071 7
Glucagon (2,14) 6.164 .012 .468 46
Cortisol (2,14) 1.637 .230 .190 19
Albumin (2,14) 23.47 001 .770 77
Total Protein (2,14) 1.135 .349 .140 14
Page 84
72
Table 4.6.Changes in Lipid profiles
Measurements Before
Ramadan
10th of
Ramadan
28th of
Ramadan
TC 158.0226.89 158.9817.58 162.8524.31
TG 96.2060.59 65.2014.70 73.5121.64
LDL 88.6226.21 96.9315.82 102.0119.92
HDL 50.2505.06 48.806.51 46.3905.46
VLDL 19.2412.11 13.0402.94 14.7004.32
LDL/HDL ratio 01.7600.52^ 02.0100.41 02.2200.50*
Data presented as mean standard deviation. *=significantly different vs.
baseline (p<0.05). ^=significantly different vs. D10.
Page 85
73
Table 4.7. Present data of Mauchly’s Test of Sphericity
Within
subjects
effect
Mauchly’s
W
Approx.
Chi-Square
df Sig Greenhous
e-Geisser
TC .314 6.945 2 .031 .593
TG .415 5.276 2 .072 .631
LDL .261 8.070 2 .018 .575
HDL .834 1.090 2 .580 .858
VLDL .415 5.276 2 .072 631
LDL/HDL .882 .757 2 .685 .894
Test of with-Subjects Effects
Source df(..,..) F Sig Partial Eta
Squared
%
TC (2,14) .297 .748 .041 4
TG (2,14) 1.803 .201 .205 20
LDL (2,14) 2.391 .128 .255 25
HDL (2,14) 2.882 .089 .292 29
VLDL (2,14) 1.803 .201 .205 20
LDL/HDL (2,14) 11.301 .001 .618 61
Page 86
74
Table 4.8.Changes in Physical Activity Levels
Measurements Before
Ramadan
10th of
Ramadan
28th of
Ramadan
Physical Activity 4036830 3715829 23091101*^
Vigorous 1500584 1075465 45127*^
Moderate 1305509 1485492 517321*^
Walking 1231985 1155738 17461066
Data presented as mean standard deviation. *=significantly different vs.
baseline (p<0.05). ^=significantly different vs. D10.
Page 87
75
Table 4.9. Present data of Mauchly’s Test of Sphericity
Within
subjects
effect
Mauchly’s
W
Approx.
Chi-Square
df Sig Greenhouse-
Geisser
PA .579 3.275 2 .194 .704
V .889 .709 2 .702 .900
M .753 1.704 2 .427 .802
W .327 6.707 2 .035 .598
Test of with-Subjects Effects
Source df(..,..) F Sig Partial Eta
Squared
%
PA (2,14) 29.363 .000 .807 80.
V (2,14) 23.355 .000 .769 76
M (2,14) 8.888 .003 .559 55
W (2,14) 3.238 .070 .316 31
Page 88
76
Table 4.10.Changes in Food Intake
Measurements Before
Ramadan
10th of
Ramadan
28th of Ramadan
Energy
Intake(Kcal) 3121489 3080419 2986479
Protein (%) 17.575.33 12.505.79 11.355.18*^
Fat (%) 38.655.96 29.237.35 31.773.86
Carbohydrate (%) 47.799.36 59.016.22 57.894.36
Data presented as mean standard deviation. *=significantly different vs.
baseline (p<0.05). ^=significantly different vs. D10.
Page 89
77
Table 4.11. Present data of Mauchly’s Test of Sphericity
Within
subjects
effect
Mauchly’s
W
Approx.
Chi-Square
df Sig Greenhouse-
Geisser
Energy Intake
(Kcal)
.747 .1.754 2 .416 .798
Protein (%) .967 .198 2 .906 .969
Fat (%) .712 2.034 2 .362 .777
Carbohydrate
(%)
.465 4.599 2 .100 .651
Test of with-Subjects Effects
Source df(..,..) F Sig Partial
Eta
Squared
%
Energy Intake
(Kcal)
(2,14) 2.069 .163 .228 22
Protein (%) (2,14) 10.475 .002 .599 59
Fat (%) (2,14) 4.323 .035 .382 38
Carbohydrate
(%)
(2,14) 7.321 .007 .511 51
Page 90
78
Figure 4.1. Results of Body weight data for baseline (D1), ten days of fasting
Ramadan (D10) and twenty-eight days of fasting Ramadan (D28)
*=significantly different vs. baseline (p<0.05). ^=significantly different vs. D10.
64.00
64.50
65.00
65.50
66.00
66.50
67.00
67.50
D1 D10 D28
Body
Wei
ght
(kg)
Body Weight Changes
*^
Page 91
79
Figure 4.2. Results of lean (kg) data for baseline (D1), ten days of fasting
Ramadan (D10) and twenty-eight days of fasting Ramadan (D28) *=significantly
different vs. baseline (p<0.05). ^=significantly different vs. D10.
48.00
48.50
49.00
49.50
50.00
50.50
51.00
D1 D10 D28
Lea
n (
kg)
Lean body mass kg Changes
*^
Page 92
80
Figure 4.3. Results Body Fat Percentage data for data for baseline (D1), ten days
of fasting Ramadan (D10) and twenty-eight days of fasting Ramadan (D28)
*=significantly different vs. baseline (p<0.05). ^=significantly different vs. D10.
17.00
17.20
17.40
17.60
17.80
18.00
D1 D10 D28
Body
Fat
%Body Fat Precentage Changes
Page 93
81
Figure 4.4. Results of Android to Gynoid Ratio data for data for baseline (D1), ten
days of fasting Ramadan (D10) and twenty-eight days of fasting Ramadan (D28)
*=significantly different vs. baseline (p<0.05). ^=significantly different vs. D10.
17.70
17.75
17.80
17.85
17.90
17.95
D1 D10 D28
A/G
Rat
ioAndriod/ Gynoid Ratio Changes
Page 94
82
Figure 4.5. Results Glucose data for data for baseline (D1), ten days of fasting
Ramadan (D10) and twenty-eight days of fasting Ramadan (D28)
*=significantly different vs. baseline (p<0.05). ^=significantly different vs. D10.
70.00
75.00
80.00
85.00
90.00
95.00
100.00
D1 D10 D28
Glu
cose
mg/d
l
Glucose Changes
*
Page 95
83
Figure 4.6. Results of Glucagon data for baseline (D1), ten days of fasting
Ramadan (D10) and twenty-eight days of fasting Ramadan (D28). *=significantly
different vs. baseline (p<0.05). ^=significantly different vs. D10.
0.00
10.00
20.00
30.00
40.00
50.00
D1 D10 D28
Glu
cagon u
U/m
l
Glucagon Changes
^
Page 96
84
Figure 4.7. Results of Albumin data for baseline (D1), ten days of fasting
Ramadan (D10) and twenty-eight days of fasting Ramadan (D28). *=significantly
different vs. baseline (p<0.05). ^=significantly different vs. D10.
0.00
10.00
20.00
30.00
40.00
50.00
60.00
D1 D10 D28
Alb
um
in g
/L
Albumin Changes
^
*
Page 97
85
Figure 4.8. Results of Insulin data for baseline (D1), ten days of fasting Ramadan
(D10) and twenty-eight days of fasting Ramadan (D28). *=significantly different
vs. baseline (p<0.05). ^=significantly different vs. D10.
0.00
1.00
2.00
3.00
4.00
5.00
6.00
7.00
8.00
9.00
D1 D10 D28
Insu
lin u
U/m
l
Insulin Changes
Page 98
86
Figure 4.9. Results of Cortisol data for baseline (D1), ten days of fasting Ramadan
(D10) and twenty-eight days of fasting Ramadan (D28). *=significantly different
vs. baseline (p<0.05). ^=significantly different vs. D10.
0.00
2.00
4.00
6.00
8.00
10.00
12.00
14.00
16.00
D1 D10 D28
Cort
isol
uU
/ml
Cortisol Changes
Page 99
87
Figure 4.10. Results of Total Protein data for baseline (D1), ten days of fasting
Ramadan (D10) and twenty-eight days of fasting Ramadan (D28). *=significantly
different vs. baseline (p<0.05). ^=significantly different vs. D10.
71.00
72.00
73.00
74.00
75.00
76.00
77.00
78.00
79.00
D1 D10 D28
Tota
l P
rote
in g
/L
Total Protein Changes
Page 100
88
Figure 4.11. Results of LDL/HDL Ratio data for baseline (D1), ten days of fasting
Ramadan (D10) and twenty-eight days of fasting Ramadan (D28). *=significantly
different vs. baseline (p<0.05). ^=significantly different vs. D10.
0.00
0.50
1.00
1.50
2.00
2.50
D1 D10 D28
Rat
io o
f L
DL
to H
DL
Ratio of LDL/HDL Changes
*
^
Page 101
89
Figure 4.12. Results of Total Cholesterol data for baseline (D1), ten days of
fasting Ramadan (D10) and twenty-eight days of fasting Ramadan (D28).
*=significantly different vs. baseline (p<0.05). ^=significantly different vs. D10.
150.00
152.00
154.00
156.00
158.00
160.00
162.00
164.00
166.00
D1 D10 D28
Chole
ster
ol
mg/d
l
Cholesterol Changes
Page 102
90
Figure 4.13. Results of Triglycerides data for baseline (D1), ten days of fasting
Ramadan (D10) and twenty-eight days of fasting Ramadan (D28). *=significantly
different vs. baseline (p<0.05). ^=significantly different vs. D10.
0
20
40
60
80
100
120
D1 D10 D28
Tri
gly
ceri
des
mg/d
l
Triglycerides changes
Page 103
91
Figure 4.14. Results of Low Density Lipoprotein data for data for baseline (D1),
ten days of fasting Ramadan (D10) and twenty-eight days of fasting Ramadan
(D28) *=significantly different vs. baseline (p<0.05). ^=significantly different
vs. D10.
0
20
40
60
80
100
120
D1 D10 D28
LD
L m
g/d
l
LDL Changes
Page 104
92
Figure 4.15. Results of High Density Lipoprotein data for baseline (D1), ten days
of fasting Ramadan (D10) and twenty-eight days of fasting Ramadan (D28).
*=significantly different vs. baseline (p<0.05). ^=significantly different vs. D10.
42
44
46
48
50
52
D1 D10 D28
HD
L m
g/d
l
HDL Changes
Page 105
93
Figure 4.16. Results of High Density Lipoprotein data for baseline (D1), ten days
of fasting Ramadan (D10) and twenty-eight days of fasting Ramadan (D28).
*=significantly different vs. baseline (p<0.05). ^=significantly different vs. D10.
0
5
10
15
20
25
D1 D10 D28
VL
DL
mg
/dl
VLDL Changes
Page 106
94
Figure 4.17. Results of Physical Activity data for baseline (D1), ten days of
fasting Ramadan (D10) and twenty-eight days of fasting Ramadan (D28).
*=significantly different vs. baseline (p<0.05). ^=significantly different vs. D10.
0
500
1000
1500
2000
2500
3000
3500
4000
4500
5000
D1 D10 D28
To
tal
Ph
ysc
ial A
ctiv
ity
ME
T-m
inu
tes/
wee
k
Physical Activity Changes
^*
Page 107
95
Figure 4.18. Results of Vigorous Physical Activity data for baseline (D1), ten
days of fasting Ramadan (D10) and twenty-eight days of fasting Ramadan (D28).
*=significantly different vs. baseline (p<0.05). ^=significantly different vs. D10.
-1000
-500
0
500
1000
1500
2000
2500
D1 D10 D28
Phy
sica
l Act
ivit
y
ME
T-m
inute
s/w
eek
Vigorous Physical Activity Changes
^*
Page 108
96
Figure 4.19. Results of Moderate Physical Activity data for baseline (D1), ten
days of fasting Ramadan (D10) and twenty-eight days of fasting Ramadan (D28).
*=significantly different vs. baseline (p<0.05). ^=significantly different vs. D10.
0
200
400
600
800
1000
1200
1400
1600
1800
2000
D1 D10 D28
Ph
sica
l Act
ivit
y
ME
T-m
inu
tes/
wee
k
Moderate Physical Activity Changes
^ *
Page 109
97
Figure 4.20. Results of Walking Physical Activity data for baseline (D1), ten days
of fasting Ramadan (D10) and twenty-eight days of fasting Ramadan (D28).
*=significantly different vs. baseline (p<0.05). ^=significantly different vs. D10.
0
500
1000
1500
2000
2500
D1 D10 D28
Ph
isca
l Act
ivit
y
ME
T-m
inu
tes/
wee
k
Walking Physical Activity Changes
Page 110
98
Figure 4.21. Results of Energy Intake Kcal data for baseline (D1), ten days of
fasting Ramadan (D10) and twenty-eight days of fasting Ramadan (D28).
*=significantly different vs. baseline (p<0.05). ^=significantly different vs. D10.
2800
2850
2900
2950
3000
3050
3100
3150
3200
D1 D10 D28
Ener
gy
Inta
ke
Kca
l
Energy Intake Changes
Page 111
99
Figure 4.22. Results of Percentage of Calories from Protein data for baseline
(D1), ten days of fasting Ramadan (D10) and twenty-eight days of fasting
Ramadan (D28). *=significantly different vs. baseline (p<0.05). ^=significantly
different vs. D10.
0
5
10
15
20
25
D1 D10 D28
% P
rote
in i
nta
ke
Percentage of Calories from Protein
Changes
**
Page 112
100
Figure 4.23. Results of Percentage of Calories from Fat data for baseline (D1), ten
days of fasting Ramadan (D10) and twenty-eight days of fasting Ramadan (D28).
*=significantly different vs. baseline (p<0.05). ^=significantly different vs. D10.
0
5
10
15
20
25
30
35
40
45
D1 D10 D28
% F
at i
nta
ke
Percentage of Calories from Fat
Changes
Page 113
101
Figure 4.23. Results of Percentage of Calories from Carbohydrate data for
baseline (D1), ten days of fasting Ramadan (D10) and twenty-eight days of
fasting Ramadan (D28). *=significantly different vs. baseline (p<0.05). ^=significantly different vs. D10.
0
10
20
30
40
50
60
70
D1 D10 D28
% C
arbohy
dra
te i
nta
ke
Percentage of Calories from
Carbohydrate Changes
**
Page 114
102
DISSCUTION
The goal of this investigation was to examine the effects of fasting
during the month of Ramadan on anthropometrics, Lipid Profile, serum
protein, Glucose, hormones, physical activity, and food intake. Studies related
to body weight and food intake during Ramadan, although well documented,
are inconsistent and contain vastly differing results. In order to maintain
positive energy balance, energy consumed must be greater than energy
expended, thus increasing stored energy. Negative energy balance occurs when
energy expenditure is greater than energy consumed resulting in an energy
decrease and loss of body weight (Wardlaw and Kessel, 2002). A study done
by Forst and Pirani (1987) showed that when caloric intake increased, body
weight also increased during the month of Ramadan. However, Khan and
Khattak (2002) found a decrease in caloric intake with a decrease in body
weight. Decreases in caloric intake with reductions in body weight are
frequently noted in studies (Angel and Schwartz, 1974). A study by El Ati et al
(1995) found no significant differences related to food intake pre- and post-
Ramadan and body weight. Other studies documented no notable variations in
body weight and fat mass correlations (Maislos et al 1993, Beltaifa et al 2002
and El Ati et al, 1995). Studies that investigate interrelated components of
weight loss, caloric intake and levels of physical activity during Ramadan are
less documented.
Page 115
103
The findings of this investigation showed a significant decrease of -
1.82 % in body weight at the end of Ramadan. Reflectively, this weight loss
could conceivably be due to the significant decrease of -6.22 % and -40.57 in
percentage of calories from protein and the physical activity, respectively. Is
weight loss in fat body mass or in lean body mass? This study verified that
weight loss occurred in lean body mass of -2.08 % at the end of Ramadan
fasting. The loss of lean body mass may have negative impact on the athletic
performance (Fogelholm, 1994). During the first ten days of Ramadan there
were no significant changes in body weight which could be due to the non-
significant changes of energy intake and physical activity during the first ten
days compared to pre Ramadan. Physical activity levels, Vigorous and
Moderate at the end of Ramadan were considerably diminished.
Valdimarsson with others conducted a study in 1999 that showed a significant
positive relationship between lean mass and the physical activity.
Interestingly, the reduction in lean body mass may correlated to the
significant reduction of physical activity and insufficient dietary protein
intake from 10th of Ramadan until the end of Ramadan. It has been confirmed
that increasing protein intake reduced loss of lean body mass (Mettler et al,
2010). Moreover, the calories intake from fat was decreased -6.88 % at the
end of Ramadan compare to pre-Ramadan. However, the reduction of calories
from fat was not significant.
Page 116
104
Blood parameters were also investigated in this study. Albumin which
produced by the liver was significantly decreased to -11.76 % at the end of
Ramadan. Albumin may be a marker of malnutrition status such as protein
intake and dehydration. However, Most metabolic and physiological
functions in the human body derive its’ energy from Glucose. Reliable data
on the exploration of the effects of fasting on Glucose levels are becoming
increasingly documented (Asgary et al, 2000 and Nagra et al, 1998). In this
study, the researcher also examined Fasting Glucose levels were considerably
elevated at the end of Ramadan when compared to pre-Ramadan to 11.15 %.
The results of this study are in conflict with previous studies which noted no
changes in Glucose levels (Fedail et al, 1982 and Bouhelel et al, 2008). One
study in concurrence with our findings related to elevated Glucose levels was
Temizhan et al in 2000. Reflectively, the significant increase of Glucose level
could possibly be due to the significant increase of carbohydrate to 10. % at
the end of Ramadan. Other blood constituents such as Glucagon have also
been investigated in this study. Glucagon decreased significantly after the
first ten days of Ramadan. However, at the end of Ramadan, it returned back
almost to pre Ramadan levels. The reason why Glucagon levels returned to
baseline is unclear. The other blood parameters such as Insulin, Cortisol and
total protein did not show any significant differences throughout the three
measurements.
Page 117
105
The changes in eating habits during Ramadan have been well
documented. One main findings in this study that relate to lipid profiles was
the significant increase of the LDL/HDL ratio, but was still within normal and
healthy range. All other lipid profile values were without significant change.
Interpretation of data varies somewhat per study. However, smaller meals
combined with the specific types of caloric intake such as increased
carbohydrate and decreased fat intake may have a more direct and beneficial
outcome in controlling lipid levels than one or two large meals during the
Ramadan fast. Having multiple small meals instead of one or two large meals
should also be considered a viable contributing factor in lowering total
cholesterol levels (Lamri-Senhadji et al 2009, Barkia et al 2011, Aldouni et
al 1997, Asgary et al 2000, Bouhlel et al, 2008).
The physical activity levels were significantly decreased at the end of
Ramadan because the subjects did not maintain their usual training. During
the last ten days of Ramadan nightly, the subjects have a tendency to stay up
until later for praying. The vigorous and moderate physical activity levels
were significantly reduced at the end of Ramadan. As regards the intensity of
physical activity, the findings of the present study were consistent with the
result of Meckel et al 2007. A study conducted by Karli with others
confirmed that if the daily habits of training, food intake, body fluid balance
and sleeping were similar in pre and post Ramadan, there would be no effect
Page 118
106
of Ramadan fasting on body composition and athletic performance.
Summary
The conflict of our results with the previous studies may be due to the
possibility of subjects consuming varying amounts of calories between pre-
and post-Ramadan measurements. The inconsistencies of previous studies
appears to have a direct correlation to the fact that the majority of the studies
do not control the amount of food intake; nor do they control the level of
physical activity between these two measurements. Moreover, more research
needs to be conducted to investigate further the fast of Ramadan in
relationship not only to body weight, but also to the level of physical activity
along with the amount and type of food intake. In this study shows that the
reduction in body weight is related to the loss of lean body mass. Therefore,
examining the effects of intermittent fasting on human muscle intracellular
signaling pathways is the future of research in fasting Ramadan. Finally, the
need for improved control over specific biochemical markers is required.
Heart disease and diabetes are spreading throughout the world. If altering and
or varying dietary patterns as studies are beginning to suggest can control,
elevate and lower these markers without major dietary and pharmacological
changes, the medical community will gain vital knowledge (Fischbach et al,
1998 and Venes et al, 2005).
Page 119
107
ASSUMPTIONS AND LIMITATIONS
The information collected in this study may show people who fast during the
month of Ramadan that no change will occur when the demand in energy
intake reaches the demand required by the body in consideration of the
recommendation dietary allowances per day. In addition, they can fast for an
extended period of time without harmful physiological or metabolic.
Likewise, study shows that exercising regularly after breaking the fast with
complete attention to the time of eating and sleeping has impact on lean body
mass. Ostensible limitation of this study was the size of the sample. The
sample was small in size because people think that donating blood while
fasting is not recommended in Islam unless it is absolutely necessary.
Donating blood while fasting for research purposes seemed unnecessary to
the subjects. Another limitation was that the measurement times. Instated of
having only three times of measuring the subjects it would be better they
come for testing every three or four days to know at which time the changes
occur.
Suggestions for further research
An area for further research is to conduct a study to scan the effect of
intermittent fasting on human muscle intracellular signaling pathways. A
question for further research is “which part of the lean body mass changes? A
carefule study needs to be conducted in order to answer that question.
Page 120
108
References
Abdalla, A. H., F. A. Shaheen, et al. (1998). "Effect of Ramadan fasting on
Moslem kidney transplant recipients." American journal of nephrology 18(2):
101-104.
Abedelmalek, S., N. Souissi, et al. (2011). "Effect of Acute Maximal Exercise on
Circulating Levels of Interleukin-12 during Ramadan Fasting." Asian journal of
sports medicine 2(3): 154-160.
Adlouni, A., N. Ghalim, et al. (1997). "Fasting during Ramadan induces a marked
increase in high-density lipoprotein cholesterol and decrease in low-density
lipoprotein cholesterol." Annals of nutrition & metabolism 41(4): 242-249.
Adlouni, A., N. Ghalim, et al. (1998). "Beneficial effect on serum apo AI, apo B
and Lp AI levels of Ramadan fasting." Clinica chimica acta; international journal
of clinical chemistry 271(2): 179-189.
Afrasiabi, A., S. Hassanzadeh, et al. (2003). "Effects of low fat and low calorie
diet on plasma lipid levels in the fasting month of Ramadan." Saudi medical
journal 24(2): 184-188.
Akanji, A. O., O. A. Mojiminiyi, et al. (2000). "Beneficial changes in serum apo
A-1 and its ratio to apo B and HDL in stable hyperlipidaemic subjects after
Ramadan fasting in Kuwait." European journal of clinical nutrition 54(6): 508-
513.
Al-Arfaj, H. F., S. R. Alballa, et al. (1995). "Effect of short-term use of different
non-steroidal anti-inflammatory drugs on renal function during fasting in
ramadan." Saudi journal of kidney diseases and transplantation : an official
publication of the Saudi Center for Organ Transplantation, Saudi Arabia 6(1): 9-
14.
Al-Hader, A. F., N. A. Abu-Farsakh, et al. (1994). "The effects of Ramadan
fasting on certain biochemical parameters in normal subjects and in type II
diabetic patients." Annals of Saudi medicine 14(2): 139-141.
Al-Mendalawi, M. D. (2011). "Effects of Ramadan fasting on Glucose levels and
serum lipid profile among type 2 diabetic patients." Saudi medical journal 32(6):
647; author reply 647.
Page 121
109
Al-Sinawi, H., S. Al-Adawi, et al. (2008). "Ramadan fasting triggering koro-like
symptoms during acute alcohol withdrawal: a case report from Oman."
Transcultural psychiatry 45(4): 695-704.
Argani, H., S. Mozaffari, et al. (2003). "Evaluation of biochemical and
immunologic changes in renal transplant recipients during Ramadan fasting."
Transplantation proceedings 35(7): 2725-2726.
Aslam, M. and A. Assad (1986). "Drug regimens and fasting during Ramadan: a
survey in Kuwait." Public health 100(1): 49-53.
Assadi, M., A. Akrami, et al. (2011). "Impact of Ramadan fasting on intraocular
pressure, visual acuity and refractive errors." Singapore medical journal 52(4):
263-266.
Aybak, M., A. Turkoglu, et al. (1996). "Effect of Ramadan fasting on platelet
aggregation in healthy male subjects." European journal of applied physiology
and occupational physiology 73(6): 552-556.
Aziz, A. R., M. F. Wahid, et al. (2010). "Effects of Ramadan fasting on 60 min of
endurance running performance in moderately trained men." British journal of
sports medicine 44(7): 516-521.
Ba, A., A. Samb, et al. (2005). "[Comparative study of the effect of fasting during
Ramadan on the glycaemia at rest in sportsmen and sedentaries]." Dakar medical
50(1): 22-25.
BaHammam, A. (2005). "Assessment of sleep patterns, daytime sleepiness, and
chronotype during Ramadan in fasting and nonfasting individuals." Saudi medical
journal 26(4): 616-622.
Bahammam, A. (2006). "Does Ramadan fasting affect sleep?" International
journal of clinical practice 60(12): 1631-1637.
BaHammam, A., M. Alrajeh, et al. (2010). "Circadian pattern of sleep, energy
expenditure, and body temperature of young healthy men during the intermittent
fasting of Ramadan." Appetite 54(2): 426-429.
Bakhotmah, B. A. (2011). "The puzzle of self-reported weight gain in a month of
fasting (Ramadan) among a cohort of Saudi families in Jeddah, Western Saudi
Arabia." Nutrition journal 10: 84.
Page 122
110
Bakiner, O., M. E. Ertorer, et al. (2009). "Repaglinide plus single-dose Insulin
glargine: a safe regimen for low-risk type 2 diabetic patients who insist on fasting
in Ramadan." Acta diabetologica 46(1): 63-65.
Basiri, A., S. M. Moghaddam, et al. (2004). "Monthly variations of urinary stone
colic in Iran and its relationship to the fasting month of Ramadan." JPMA. The
Journal of the Pakistan Medical Association 54(1): 6-8.
Belkhadir, J., H. el Ghomari, et al. (1993). "Muslims with non-Insulin dependent
diabetes fasting during Ramadan: treatment with glibenclamide." BMJ 307(6899):
292-295.
Beltaifa, L., R. Bouguerra, et al. (2002). "[Food intake, and anthropometrical and
biological parameters in adult Tunisians during fasting at Ramadan]." Eastern
Mediterranean health journal = La revue de sante de la Mediterranee orientale =
al-Majallah al-sihhiyah li-sharq al-mutawassit 8(4-5): 603-611.
Ben Salama, F., M. Hsairi, et al. (1993). "[Food intake and energy expenditure in
high school athletes before, during and after the month of Ramadan: effect of
fasting on performance]." La Tunisie medicale 71(2): 85-89.
Benbarka, M. M., A. B. Khalil, et al. (2010). "Insulin pump therapy in Moslem
patients with type 1 diabetes during Ramadan fasting: an observational report."
Diabetes technology & therapeutics 12(4): 287-290.
Benchekroun, M. T. and S. Moussamih (2004). "Effects of Ramadan fasting on
cardiovascular diseases." Saudi medical journal 25(10): 1520-1521.
Bener, A., B. Colakoglu, et al. (2006). "Does hospitalization for asthma and
allergic diseases occur more frequently in Ramadan fasting: a population based
study (2000-2004)." European annals of allergy and clinical immunology 38(4):
109-112.
Bener, A., A. Hamad, et al. (2006). "Is there any effect of Ramadan fasting on
stroke incidence?" Singapore medical journal 47(5): 404-408.
Bernieh, B., M. R. Al Hakim, et al. (2010). "Fasting Ramadan in chronic kidney
disease patients: clinical and biochemical effects." Saudi journal of kidney
diseases and transplantation : an official publication of the Saudi Center for Organ
Transplantation, Saudi Arabia 21(5): 898-902.
Page 123
111
Bernieh, B. O., A. O. Mohamed, et al. (1994). "Ramadan fasting and renal
transplant recipients: Clinical and biochemical effects." Saudi journal of kidney
diseases and transplantation : an official publication of the Saudi Center for Organ
Transplantation, Saudi Arabia 5(4): 470-473.
Bin-Abbas, B. S. (2008). "Insulin pump therapy during Ramadan fasting in type 1
diabetic adolescents." Annals of Saudi medicine 28(4): 305-306.
Bogdan, A., B. Bouchareb, et al. (2001). "Ramadan fasting alters endocrine and
neuroendocrine circadian patterns. Meal-time as a synchronizer in humans?" Life
sciences 68(14): 1607-1615.
Bogdan, A., B. Bouchareb, et al. (2005). "Response of circulating leptin to
Ramadan daytime fasting: a circadian study." The British journal of nutrition
93(4): 515-518.
Bonakdaran, S. H. and M. Khajeh-Dalouie (2011). "The effects of fasting during
Ramadan on glycemic excursions detected by continuous Glucose monitoring
system (CGMS) in patients with type 2 diabetes." The Medical journal of
Malaysia 66(5):447-450.
Boobes, Y., B. Bernieh, et al. (2009). "Fasting Ramadan in kidney transplant
patients is safe." Saudi journal of kidney diseases and transplantation : an official
publication of the Saudi Center for Organ Transplantation, Saudi Arabia 20(2):
198-200.
Boucetta, O. (1952). "[Ramadan fasting]." Maroc medical 31(328): 763-766.
Bouguerra, R., A. Belkadhi, et al. (2003). "[Metabolic effects of the month of
Ramadan fasting on type 2 diabetes]." Eastern Mediterranean health journal = La
revue de sante de la Mediterranee orientale = al-Majallah al-sihhiyah li-sharq al-
mutawassit 9(5-6): 1099-1108.
Bouguerra, R., J. Jabrane, et al. (2006). "[Ramadan fasting in type 2 diabetes
mellitus]." Annales d'endocrinologie 67(1): 54-59.
Bouhlel, E., Z. Salhi, et al. (2006). "Effect of Ramadan fasting on fuel oxidation
during exercise in trained male rugby players." Diabetes & metabolism 32(6):
617-624.
Page 124
112
Bouhlel, E., M. Zaouali, et al. (2008). "Ramadan fasting and the GH/IGF-1 axis
of trained men during submaximal exercise." Annals of nutrition & metabolism
52(4): 261-266.
Brisswalter, J., E. Bouhlel, et al. (2011). "Effects of Ramadan intermittent fasting
on middle-distance running performance in well-trained runners." Clinical journal
of sport medicine : official journal of the Canadian Academy of Sport Medicine
21(5): 422-427.
Cesur, M., D. Corapcioglu, et al. (2007). "A comparison of glycemic effects of
glimepiride, repaglinide, and Insulin glargine in type 2 diabetes mellitus during
Ramadan fasting." Diabetes research and clinical practice 75(2): 141-147.
Chamsi-Pasha, H. and W. H. Ahmed (2004). "The effect of fasting in Ramadan
on patients with heart disease." Saudi medical journal 25(1): 47-51.
Chaouachi, A., A. J. Coutts, et al. (2009). "Effect of Ramadan intermittent fasting
on aerobic and anaerobic performance and perception of fatigue in male elite judo
athletes." Journal of strength and conditioning research / National Strength &
Conditioning Association 23(9): 2702-2709.
Chaouachi, A., J. B. Leiper, et al. (2009). "Effects of Ramadan intermittent
fasting on sports performance and training: a review." International journal of
sports physiology and performance 4(4): 419-434.
Cheah, S. H., S. L. Ch'ng, et al. (1990). "Effects of fasting during Ramadan on
urinary excretion in Malaysian Muslims." The British journal of nutrition 63(2):
329-337.
Chennaoui, M., F. Desgorces, et al. (2009). "Effects of Ramadan fasting on
physical performance and metabolic, hormonal, and inflammatory parameters in
middle-distance runners." Applied physiology, nutrition, and metabolism =
Physiologie appliquee, nutrition et metabolisme 34(4): 587-594.
Chtourou, H., O. Hammouda, et al. (2012). "The effect of time-of-day and
Ramadan fasting on anaerobic performances." International journal of sports
medicine 33(2): 142-147.
Chtourou, H., O. Hammouda, et al. (2011). "The effect of ramadan fasting on
physical performances, mood state and perceived exertion in young footballers."
Asian journal of sports medicine 2(3): 177-185.
Page 125
113
Crosby, S. S., E. J. Rourke, et al. (2005). "Fasting and medical issues during
Ramadan." JAMA : the journal of the American Medical Association 294(13):
1618.
Daghfous, J., M. Beji, et al. (1994). "Fasting in Ramadan, the asthmatics and
sustained-release theophylline." Annals of Saudi medicine 14(6): 523.
Dewanti, L., C. Watanabe, et al. (2006). "Unexpected changes in blood pressure
and hematological parameters among fasting and nonfasting workers during
Ramadan in Indonesia." European journal of clinical nutrition 60(7): 877-881.
Dikensoy, E., O. Balat, et al. (2008). "Effect of fasting during Ramadan on fetal
development and maternal health." The journal of obstetrics and gynaecology
research 34(4): 494-498.
Dikensoy, E., O. Balat, et al. (2009). "The effect of Ramadan fasting on maternal
serum lipids, cortisol levels and fetal development." Archives of gynecology and
obstetrics 279(2): 119-123.
Dolu, N., A. Yuksek, et al. (2007). "Arousal and continuous attention during
Ramadan intermittent fasting." Journal of basic and clinical physiology and
pharmacology 18(4): 315-322.
Drescher, M. J., Z. Wimpfheimer, et al. (2012). "Prophylactic Etoricoxib Is
Effective in Preventing "First of Ramadan" Headache: A Placebo-Controlled
Double-Blind and Randomized Trial of Prophylactic Etoricoxib for Ritual Fasting
Headache." Headache 52(4): 573-581.
Einollahi, B., M. Lessan-Pezeshki, et al. (2009). "Ramadan fasting in kidney
transplant recipients with normal renal function and with mild-to-moderate renal
dysfunction." International urology and nephrology 41(2): 417-422.
Einollahi, B., M. Lessan-Pezeshki, et al. (2005). "Impact of Ramadan fasting on
renal allograft function." Transplantation proceedings 37(7): 3004-3005.
el Ati, J., C. Beji, et al. (1995). "Increased fat oxidation during Ramadan fasting
in healthy women: an adaptative mechanism for body-weight maintenance." The
American journal of clinical nutrition 62(2): 302-307.
Page 126
114
Elgzyri, T. and A. Frid (2011). "[Fasting during Ramadan possible for some
persons with diabetes--but not all. Increased risks with fasting during summer
time--competent counseling is necessary]." Lakartidningen 108(29-31): 1434-
1436.
Elmehdawi, R., M. Ehmida, et al. (2009). "Incidence of Diabetic Ketoacidosis
during Ramadan Fasting in Benghazi-Libya." Oman medical journal 24(2): 99-
102.
Elmehdawi, R. R., N. A. Mukhtad, et al. (2010). "Fasting of Ramadan in peoples
with diabetes in Benghazi, Libya: an exploratory study." The Libyan journal of
medicine 5.
El-Migdadi, F., Z. El-Akawi, et al. (2002). "Plasma levels of adrenocorticotropic
hormone and cortisol in people living in an environment below sea level (Jordan
Valley) during fasting in the month of Ramadan." Hormone research 58(6): 279-
282.
El-Migdadi, F., A. Shotar, et al. (2004). "Effect of fasting during the month of
Ramadan on serum levels of luteinizing hormone and testosterone in people living
in the below sea level environment in the Jordan Valley." Neuro endocrinology
letters 25(1-2): 75-77.
el-Mitwalli, A., A. A. Zaher, et al. (2009). "The effect of Ramadan fasting on
cerebral stroke: a prospective hospital-based study." European journal of
neurology : the official journal of the European Federation of Neurological
Societies 16(4): e80.
Elnadry, M. H., I. A. Nigm, et al. (2011). "Effect of Ramadan fasting on Muslim
patients with chronic liver diseases." Journal of the Egyptian Society of
Parasitology 41(2): 337-346.
El-Wakil, H. S., I. Desoky, et al. (2007). "Fasting the month of Ramadan by
Muslims: could it be injurious to their kidneys?" Saudi journal of kidney diseases
and transplantation : an official publication of the Saudi Center for Organ
Transplantation, Saudi Arabia 18(3): 349-354.
Erol, A., G. Baylan, et al. (2008). "Do Ramadan fasting restrictions alter eating
behaviours?" European eating disorders review : the journal of the Eating
Disorders Association 16(4): 297-301.
Page 127
115
Ertem, I. O., G. Kaynak, et al. (2001). "Attitudes and practices of breastfeeding
mothers regarding fasting in Ramadan." Child: care, health and development
27(6): 545-554.
Fakhrzadeh, H., B. Larijani, et al. (2003). "Effect of Ramadan fasting on clinical
and biochemical parameters in healthy adults." Annals of Saudi medicine 23(3-4):
223-226.
Fariduddin, M., H. Mahtab, et al. (2011). "Practical management of diabetes
during Ramadan fasting." Mymensingh medical journal : MMJ 20(3): 541-546.
Farooq, N., S. Priyamvada, et al. (2006). "Influence of Ramadan-type fasting on
enzymes of carbohydrate metabolism and brush border membrane in small
intestine and liver of rat used as a model." The British journal of nutrition 96(6):
1087-1094.
Farooq, S., Z. Nazar, et al. (2010). "Effect of fasting during Ramadan on serum
lithium level and mental state in bipolar affective disorder." International clinical
psychopharmacology 25(6): 323-327.
Fatim, J., R. Karoli, et al. (2011). "Attitudinal determinants of fasting in type 2
diabetes mellitus patients during Ramadan." The Journal of the Association of
Physicians of India 59: 630-634.
Fatima, J., R. Karoli, et al. (2012). "Ramadan fasting in patients with type 2
diabetes mellitus: Experience from a teaching hospital." Indian journal of
endocrinology and metabolism 16(2): 323-324.
Finch, G. M., J. E. Day, et al. (1998). "Appetite changes under free-living
conditions during Ramadan fasting." Appetite 31(2): 159-170.
Fowler, H., E. Griffin, et al. (1990). "Antenatal attendance and fasting of pregnant
Muslims during Ramadan." British journal of obstetrics and gynaecology 97(9):
861-862.
Fischbach, F. T. (1998). Nurses’ Quick Reference to Common Laboratory and
Diagnostic Test. Philadelphia, Lippincott.
Fogelholm M. (1994) Effects of bodyweight reduction on sports performance.
Sports Med.18:249–67.
Page 128
116
Gaborit, B., O. Dutour, et al. (2011). "Ramadan fasting with diabetes: an
interview study of inpatients' and general practitioners' attitudes in the South of
France." Diabetes & metabolism 37(5): 395-402.
Gali, B. M., A. G. Ibrahim, et al. (2011). "Perforated peptic ulcer (PPU) in
pregnancy during Ramadan fasting." Nigerian journal of medicine : journal of the
National Association of Resident Doctors of Nigeria 20(2): 292-293.
Ghalib, M., J. Qureshi, et al. (2008). "Does repeated Ramadan fasting adversely
affect kidney function in renal transplant patients?" Transplantation 85(1): 141-
144.
Guerrero Morilla, R., J. Ramirez Rodrigo, et al. (2009). "[Dietary modifications,
in young Muslims engaged in Ramadan fasting]." Nutricion hospitalaria : organo
oficial de la Sociedad Espanola de Nutricion Parenteral y Enteral 24(6): 738-743.
Gumaa, K. A., K. Y. Mustafa, et al. (1978). "The effects of fasting in Ramadan. 1.
Serum uric acid and lipid concentrations." The British journal of nutrition 40(3):
573-581.
Habib, A. G., J. C. Shepherd, et al. (2009). "Adherence to anti retroviral therapy
(ART) during Muslim Ramadan fasting." AIDS and behavior 13(1): 42-45.
Haghdoost, A. A. and M. Poorranjbar (2009). "The interaction between physical
activity and fasting on the serum lipid profile during Ramadan." Singapore
medical journal 50(9): 897-901.
Hairon, N. (2007). "Guidance on healthy fasting during the month of Ramadan."
Nursing times 103(40): 21-22.
Hajek, P., K. Myers, et al. (2011). "Weight change during and after Ramadan
fasting." Journal of public health.
Hallak, M. H. and M. Z. Nomani (1988). "Body weight loss and changes in blood
lipid levels in normal men on hypocaloric diets during Ramadan fasting." The
American journal of clinical nutrition 48(5): 1197-1210.
Haouari, M., F. Haouari-Oukerro, et al. (2008). "How Ramadan fasting affects
caloric consumption, body weight, and circadian evolution of cortisol serum
levels in young, healthy male volunteers." Hormone and metabolic research =
Hormon- und Stoffwechselforschung = Hormones et metabolisme 40(8): 575-577.
Page 129
117
Hassanein, M., W. Hanif, et al. (2011). "Comparison of the dipeptidyl peptidase-4
inhibitor vildagliptin and the sulphonylurea gliclazide in combination with
metformin, in Muslim patients with type 2 diabetes mellitus fasting during
Ramadan: results of the VECTOR study." Current medical research and opinion
27(7): 1367-1374.
Hizli, D., S. S. Yilmaz, et al. (2011). "Impact of maternal fasting during Ramadan
on fetal Doppler parameters, maternal lipid levels and neonatal outcomes." The
journal of maternal-fetal & neonatal medicine : the official journal of the
European Association of Perinatal Medicine, the Federation of Asia and Oceania
Perinatal Societies, the International Society of Perinatal Obstetricians.
Hoskins, A. (1992). "Pregnancy and fasting during Ramadan." BMJ 304(6836):
1247.
Hosseini, S. V., M. Torabijahromi, et al. (2006). "The effect of season and
Ramadan fasting on the onset of acute cholecystitis." Saudi medical journal 27(4):
503-506.
Hui, E. and D. Devendra (2010). "Diabetes and fasting during Ramadan."
Diabetes/metabolism research and reviews 26(8): 606-610.
Hui, E. and N. Oliver (2012). "Low Glycaemic Variability in Subjects with Type
2 Diabetes following pre-Ramadan Assessment and Adjustments for Fasting."
Diabetic medicine : a journal of the British Diabetic Association.
Husain, R., M. T. Duncan, et al. (1987). "Effects of fasting in Ramadan on
tropical Asiatic Moslems." The British journal of nutrition 58(1): 41-48.
Ibrahim, W. H., H. M. Habib, et al. (2008). "Effect of Ramadan fasting on
markers of oxidative stress and serum biochemical markers of cellular damage in
healthy subjects." Annals of nutrition & metabolism 53(3-4): 175-181.
Indriss, B. A., B. M. Anas, et al. (2008). "Influence of fasting during Ramadan on
intra-ocular pressure." Annals of Saudi medicine 28(1): 61.
Iraki, L., A. Abkari, et al. (1997). "[Effect of Ramadan fasting on intragastric pH
recorded during 24 hours in healthy subjects]." Gastroenterologie clinique et
biologique 21(11): 813-819.
Page 130
118
Jaleel, M. A., S. A. Raza, et al. (2011). "Ramadan and diabetes: As-Saum (The
fasting)." Indian journal of endocrinology and metabolism 15(4): 268-273.
Javad Fallah, S. (2010). "Ramadan fasting and exercise performance." Asian
journal of sports medicine 1(3): 130.
Kamyabi, Z. and T. Naderi (2004). "The effect of Ramadan fasting on amniotic
fluid volume." Saudi medical journal 25(1): 45-46.
Karaagaoglu, N. and S. Yucecan (2000). "Some behavioural changes observed
among fasting subjects, their nutritional habits and energy expenditure in
Ramadan." International journal of food sciences and nutrition 51(2): 125-134.
Kassab, S., T. Abdul-Ghaffar, et al. (2004). "Interactions between leptin,
neuropeptide-Y and Insulin with chronic diurnal fasting during Ramadan." Annals
of Saudi medicine 24(5): 345-349.
Kavehmanesh, Z. and H. Abolghasemi (2004). "Maternal Ramadan fasting and
neonatal health." Journal of perinatology : official journal of the California
Perinatal Association 24(12): 748-750.
Kerimoglu, H., B. Ozturk, et al. (2010). "Effect of altered eating habits and
periods during Ramadan fasting on intraocular pressure, tear secretion, corneal
and anterior chamber parameters." Eye 24(1): 97-100.
Khafaji, H. A., A. Bener, et al. (2012). "The impact of diurnal fasting during
Ramadan on the lipid profile, hs-CRP, and serum leptin in stable cardiac
patients." Vascular health and risk management 8: 7-14.
Khaled, B. M. and S. Belbraouet (2009). "Effect of Ramadan fasting on
anthropometric parameters and food consumption in 276 type 2 diabetic obese
women." International journal of diabetes in developing countries 29(2): 62-68.
Khaled, B. M., M. Bendahmane, et al. (2006). "Ramadan fasting induces
modifications of certain serum components in obese women with type 2
diabetes." Saudi medical journal 27(1): 23-26.
Khammash, M. R. and T. F. Al-Shouha (2006). "Do road traffic accidents
increase during the fasting month of Ramadan." Neurosciences 11(1): 21-23.
Page 131
119
Khazaie, H., M. Tahmasian, et al. (2009). "Effects of Ramadan fasting on time
perception task." Neurosciences 14(2): 196-197.
Khedmat, H. and S. Taheri (2010). "Ramadan fasting and transplantation: current
knowledge and what we still need to know." Saudi journal of kidney diseases and
transplantation : an official publication of the Saudi Center for Organ
Transplantation, Saudi Arabia 21(3): 417-420.
Kordi, R., M. Abdollahi, et al. (2011). "Investigating Two Different Training
Time Frames during Ramadan Fasting." Asian journal of sports medicine 2(3):
205-210.
Kordy, M. T. and A. G. Abdel Gader (1991). "The effect of fasting in Ramadan
on hemostatic variables." Annals of Saudi medicine 11(1): 23-27.
Lamine, F., R. Bouguerra, et al. (2006). "Food intake and high density lipoprotein
cholesterol levels changes during ramadan fasting in healthy young subjects." La
Tunisie medicale 84(10): 647-650.
Larijani, B., F. Zahedi, et al. (2003). "The effect of Ramadan fasting on fasting
serum Glucose in healthy adults." The Medical journal of Malaysia 58(5): 678-
680.
Leiper, J. B. and A. M. Molla (2003). "Effects on health of fluid restriction during
fasting in Ramadan." European journal of clinical nutrition 57 Suppl 2: S30-38.
Leiper, J. B., P. Watson, et al. (2008). "Intensity of a training session during
Ramadan in fasting and non-fasting Tunisian youth football players." Journal of
sports sciences 26 Suppl 3: S71-79.
Lotfi, S., M. Madani, et al. (2010). "[Variation of cognitive functions and
glycemia during physical exercise in Ramadan fasting]." Revue neurologique
166(8-9): 721-726.
Maislos, M., N. Khamaysi, et al. (1993). "Marked increase in plasma high-
density-lipoprotein cholesterol after prolonged fasting during Ramadan." The
American journal of clinical nutrition 57(5): 640-642.
Makki, A. M. (2002). "Impact of Ramadan fasting on birth weight in 4 hospitals
in Sana'a city, Yemen." Saudi medical journal 23(11): 1419-1420.
Page 132
120
Malik, G. M., M. Mubarik, et al. (1996). "Ramadan fasting--effects on health and
disease." The Journal of the Association of Physicians of India 44(5): 332-334.
Malik, G. M., M. Mubarik, et al. (1996). "Endoscopic evaluation of peptic ulcer
disease during ramadan fasting." Diagnostic and therapeutic endoscopy 2(4): 219-
221.
Mallk, G. M., M. Mubarik, et al. (1995). "Acid peptic disease in relation to
Ramadan fasting: a preliminary endoscopic evaluation." The American journal of
gastroenterology 90(11): 2076-2077.
Maughan, R. J., J. B. Leiper, et al. (2008). "Effect of Ramadan fasting on some
biochemical and haematological parameters in Tunisian youth soccer players
undertaking their usual training and competition schedule." Journal of sports
sciences 26 Suppl 3: S39-46.
Memari, A. H., R. Kordi, et al. (2011). "Effect of ramadan fasting on body
composition and physical performance in female athletes." Asian journal of sports
medicine 2(3): 161-166.
Mesbahzadeh, B., Z. Ghiravani, et al. (2005). "Effect of Ramadan fasting on
secretion of sex hormones in healthy single males." Eastern Mediterranean health
journal = La revue de sante de la Mediterranee orientale = al-Majallah al-sihhiyah
li-sharq al-mutawassit 11(5-6): 1120-1123.
Messaadi, N., F. Abbou, et al. (2011). "[Pregnant women and fasting during the
month of Ramadan]." Journal de gynecologie, obstetrique et biologie de la
reproduction 40(3): 276-277.
Mettler S, Mitchell N, Tipton KD. (2010) Increased protein intake reduces lean
body mass loss during weight loss in athletes. Med Sci Sports Exerc; 42:326–37
Miladipour, A. H., N. Shakhssalim, et al. (2012). "Effect of Ramadan fasting on
urinary risk factors for calculus formation." Iranian journal of kidney diseases
6(1): 33-38.
Page 133
121
Nomani, M. Z., M. H. Hallak, et al. (1989). "Changes in blood urea and Glucose
and their association with energy-containing nutrients in men on hypocaloric diets
during Ramadan fasting." The American journal of clinical nutrition 49(6): 1141-
1145.
Nomani, M. Z., M. H. Hallak, et al. (1990). "Effects of Ramadan fasting on
plasma uric acid and body weight in healthy men." Journal of the American
Dietetic Association 90(10): 1435-1436.
Nomani, M. Z., A. H. Khan, et al. (2005). "Predicting serum gastrin levels among
men during Ramadan fasting." Eastern Mediterranean health journal = La revue
de sante de la Mediterranee orientale = al-Majallah al-sihhiyah li-sharq al-
mutawassit 11(1-2): 119-125.
Nowroozzadeh, M. H., A. Mirhosseini, et al. (2012). "Effect of Ramadan fasting
in tropical summer months on ocular refractive and biometric characteristics."
Clinical & experimental optometry : journal of the Australian Optometrical
Association 95(2): 173-176.
Ozkan, S., P. Durukan, et al. (2009). "Does Ramadan fasting increase acute upper
gastrointestinal haemorrhage?" The Journal of international medical research
37(6): 1988-1993.
Oztek, Z. and T. Bagci (1998). "Effects of fasting during Ramadan on compliance
with medical treatment." Annals of Saudi medicine 18(5): 479-481.
Ozturk, E., O. Balat, et al. (2011). "Effect of Ramadan fasting on maternal
oxidative stress during the second trimester: a preliminary study." The journal of
obstetrics and gynaecology research 37(7): 729-733.
Pathy, R., K. E. Mills, et al. (2011). "Health is a spiritual thing: perspectives of
health care professionals and female Somali and Bangladeshi women on the
health impacts of fasting during Ramadan." Ethnicity & health 16(1): 43-56.
Peeters, B., E. Mehuys, et al. (2012). "Ramadan fasting and diabetes: An
observational study among Turkish migrants in Belgium." Primary care diabetes.
Periwal, V. and C. C. Chow (2006). "Patterns in food intake correlate with body
mass index." American journal of physiology. Endocrinology and metabolism
291(5): E929-936.
Page 134
122
Qujeq, D., K. Bijani, et al. (2002). "Effects of Ramadan fasting on serum low-
density and high-density lipoprotein-cholesterol concentrations." Annals of Saudi
medicine 22(5-6): 297-299.
Rahman, M., M. Rashid, et al. (2004). "Improved serum HDL cholesterol profile
among Bangladeshi male students during Ramadan fasting." Eastern
Mediterranean health journal = La revue de sante de la Mediterranee orientale =
al-Majallah al-sihhiyah li-sharq al-mutawassit 10(1-2): 131-137.
Ramadan, J. (2002). "Does fasting during Ramadan alter body composition, blood
constituents and physical performance?" Medical principles and practice :
international journal of the Kuwait University, Health Science Centre 11 Suppl 2:
41-46.
Rashid, H. (2007). "Ramadan fasting and breast milk." Breastfeeding medicine :
the official journal of the Academy of Breastfeeding Medicine 2(1): 59-60.
Roky, R., F. Chapotot, et al. (2003). "Daytime sleepiness during Ramadan
intermittent fasting: polysomnographic and quantitative waking EEG study."
Journal of sleep research 12(2): 95-101.
Roky, R., F. Chapotot, et al. (2001). "Sleep during Ramadan intermittent fasting."
Journal of sleep research 10(4): 319-327.
Roky, R., I. Houti, et al. (2004). "Physiological and chronobiological changes
during Ramadan intermittent fasting." Annals of nutrition & metabolism 48(4):
296-303.
Roky, R., L. Iraki, et al. (2000). "Daytime alertness, mood, psychomotor
performances, and oral temperature during Ramadan intermittent fasting." Annals
of nutrition & metabolism 44(3): 101-107.
Rossner, S. (1997). "[Ramadan. A month of fasting with risk for both nocturnal
overeating, dehydration and starving]." Lakartidningen 94(21): 2017.
Roy, J., S. Hamidan, et al. (2011). "Temporal Patterns of Subjective Experiences
and Self-Regulation during Ramadan Fasting among Elite Archers: A Qualitative
Analysis." Asian journal of sports medicine 2(3): 195-204.
Sadiya, A., S. Ahmed, et al. (2011). "Effect of Ramadan fasting on metabolic
markers, body composition, and dietary intake in Emiratis of Ajman (UAE) with
metabolic syndrome." Diabetes, metabolic syndrome and obesity : targets and
therapy 4: 409-416.
Page 135
123
Sajid, K. M., M. Akhtar, et al. (1991). "Ramadan fasting and thyroid
hormone profile." JPMA. The Journal of the Pakistan Medical Association
41(9): 213-216.
Saleh, S. A., T. A. El-Kemery, et al. (2004). "Ramadan fasting: relation to
atherogenic risk among obese Muslims." The Journal of the Egyptian Public
Health Association 79(5-6): 461-483.
Salehi, M. and M. Neghab (2007). "Effects of fasting and a medium calorie
balanced diet during the holy month Ramadan on weight, BMI and some blood
parameters of overweight males." Pakistan journal of biological sciences: PJBS
10(6): 968-971.
Salim, S., N. Farooq, et al. (2007). "Influence of Ramadan-type fasting on
carbohydrate metabolism, brush border membrane enzymes and phosphate
transport in rat kidney used as a model." The British journal of nutrition 98(5):
984-990.
Sariri, R., A. Varasteh, et al. (2010). "Effect of Ramadan fasting on tear proteins."
Acta medica 53(3): 147-151.
Sarraf-Zadegan, N., M. Atashi, et al. (2000). "The effect of fasting in Ramadan on
the values and interrelations between biochemical, coagulation and hematological
factors." Annals of Saudi medicine 20(5-6): 377-381.
Schmahl, F. W. and B. Metzler (1991). "The health risks of occupational stress in
islamic industrial workers during the Ramadan fasting period." Polish journal of
occupational medicine and environmental health 4(3): 219-228.
Shariatpanahi, Z. V., M. V. Shariatpanahi, et al. (2008). "Effect of Ramadan
fasting on some indices of Insulin resistance and components of the metabolic
syndrome in healthy male adults." The British journal of nutrition 100(1): 147-
151.
Siddiqui, Q. A., S. Sabir, et al. (2005). "The effect of Ramadan fasting on
spirometry in healthy subjects." Respirology 10(4): 525-528.
Singh, R., O. C. Hwa, et al. (2011). "Subjective Perception of Sports
Performance, Training, Sleep and Dietary Patterns of Malaysian Junior Muslim
Athletes during Ramadan Intermittent Fasting." Asian journal of sports medicine
2(3): 167-176.
Page 136
124
Sobhani, I., D. Rigaud, et al. (1997). "[Digestive and nutritional changes induced
by Ramadan fasting. Methodological requirements and pertinence of scientific
observations]." Gastroenterologie clinique et biologique 21(11): 811-812.
Subhan, M. M., Q. A. Siddiqui, et al. (2006). "Does Ramadan fasting affect
expiratory flow rates in healthy subjects?" Saudi medical journal 27(11): 1656-
1660.
Sulimani, R. A. (1991). "Ramadan fasting: Medical aspects in health and in
disease." Annals of Saudi medicine 11(6): 637-641.
Venes D, Thomas CL, Taber CW, eds: Taber’s cyclopedic medical dictionary, ed
20 Philadelphia, 2005, FA Davis
Tavakkoli, H., S. Haghdani, et al. (2008). "Ramadan fasting and inflammatory
bowel disease." Indian journal of gastroenterology : official journal of the Indian
Society of Gastroenterology 27(6): 239-241.
Temizhan, A., I. Tandogan, et al. (2000). "The effects of Ramadan fasting on
blood lipid levels." The American journal of medicine 109(4): 341-342.
Tian, H. H., A. R. Aziz, et al. (2011). "Effects of fasting during ramadan month
on cognitive function in muslim athletes." Asian journal of sports medicine 2(3):
145-153.
Toda, M. and K. Morimoto (2000). "[Effects of Ramadan fasting on the health of
Muslims]." Nihon eiseigaku zasshi. Japanese journal of hygiene 54(4): 592-596.
Trabelsi, K., K. El Abed, et al. (2011). "Effects of ramadan fasting on
biochemical and anthropometric parameters in physically active men." Asian
journal of sports medicine 2(3): 134-144.
Trabelsi, K., H. Rebai, et al. (2011). "Effect of ramadan fasting on body water
status markers after a rugby sevens match." Asian journal of sports medicine 2(3):
186-194.
Unalacak, M., I. H. Kara, et al. (2011). "Effects of Ramadan fasting on
biochemical and hematological parameters and cytokines in healthy and obese
individuals." Metabolic syndrome and related disorders 9(2): 157-161.
Valdimarsson O, Kristinsson JO, Stefansson SO, Valdimarsson S, Sigurdsson G.
(1999). Lean mass and physical activity as predictors of bone mineral density in
16–20-year old women. J Intern Med 245:489–496.
Page 137
125
Weiss, J. (2009). "[Fasting in Ramadan despite chronic diseases]." Deutsche
medizinische Wochenschrift 134(34-35): p29-30.
Yakasai, A. M., H. Muhammad, et al. (2011). "Once-daily antiretroviral therapy
among treatment-experienced Muslim patients fasting for the month of
Ramadan." Tropical doctor 41(4): 233-235.
Yakoob, M. Y. (2011). "Fasting during Ramadan and obesity." JPMA. The
Journal of the Pakistan Medical Association 61(3): 303-304.
Yarahmadi, S., B. Larijani, et al. (2003). "Metabolic and clinical effects of
Ramadan fasting in patients with type II diabetes." Journal of the College of
Physicians and Surgeons--Pakistan : JCPSP 13(6): 329-332.
Yucel, A., B. Degirmenci, et al. (2004). "The effect of fasting month of Ramadan
on the abdominal fat distribution: assessment by computed tomography." The
Tohoku journal of experimental medicine 204(3): 179-187.
Zare, A., M. Hajhashemi, et al. (2011). "Effect of Ramadan fasting on serum heat
shock protein 70 and serum lipid profile." Singapore medical journal 52(7): 491-
495.
Zebidi, A., S. Rached, et al. (1990). "[The effect of Ramadan fasting on various
blood and urinary parameters]." La Tunisie medicale 68(5): 367-372.
Zerguini, Y., J. Dvorak, et al. (2008). "Influence of Ramadan fasting on
physiological and performance variables in football players: summary of the F-
MARC 2006 Ramadan fasting study." Journal of sports sciences 26 Suppl 3: S3-
6.
Ziaee, V., M. Razaei, et al. (2006). "The changes of metabolic profile and weight
during Ramadan fasting." Singapore medical journal 47(5): 409-414.
Page 138
SHORT LAST 7 DAYS SELF-ADMINISTERED version of the IPAQ. Revised August 2002.
Appendix A
INTERNATIONAL PHYSICAL ACTIVITY QUESTIONNAIRE (August 2002)
SHORT LAST 7 DAYS SELF-ADMINISTERED FORMAT
FOR USE WITH YOUNG AND MIDDLE-AGED ADULTS (15-69 years) The International Physical Activity Questionnaires (IPAQ) comprises a set of 4 questionnaires.
Long (5 activity domains asked independently) and short (4 generic items) versions for use by
either telephone or self-administered methods are available. The purpose of the questionnaires is
to provide common instruments that can be used to obtain internationally comparable data on
health–related physical activity. Background on IPAQ The development of an international measure for physical activity commenced in Geneva in 1998 and was followed by extensive reliability and validity testing undertaken across 12 countries (14 sites) during 2000. The final results suggest that these measures have acceptable measurement properties for use in many settings and in different languages, and are suitable for national population-based prevalence studies of participation in physical activity.
Using IPAQ Use of the IPAQ instruments for monitoring and research purposes is encouraged. It is recommended that no changes be made to the order or wording of the questions as this will affect the psychometric properties of the instruments.
Translation from English and Cultural Adaptation Translation from English is supported to facilitate worldwide use of IPAQ. Information on the availability of IPAQ in different languages can be obtained at www.ipaq.ki.se. If a new translation is undertaken we highly recommend using the prescribed back translation methods available on the IPAQ website. If possible please consider making your translated version of IPAQ available to others by contributing it to the IPAQ website. Further details on translation and cultural adaptation can be downloaded from the website.
Further Developments of IPAQ International collaboration on IPAQ is on-going and an International Physical Activity Prevalence Study is in progress. For further information see the IPAQ website.
More Information
More detailed information on the IPAQ process and the research methods used in the
development of IPAQ instruments is available at www.ipaq.ki.se and Booth, M.L. (2000).
Assessment of Physical Activity: An International Perspective. Research Quarterly for Exercise
and Sport, 71 (2): s114-20. Other scientific publications and presentations on the use of IPAQ
are summarized on the website.
Page 139
SHORT LAST 7 DAYS SELF-ADMINISTERED version of the IPAQ. Revised August 2002.
INTERNATIONAL PHYSICAL ACTIVITY QUESTIONNAIRE
We are interested in finding out about the kinds of physical activities that people do as part of
their everyday lives. The questions will ask you about the time you spent being physically
active in the last 7 days. Please answer each question even if you do not consider yourself to be
an active person. Please think about the activities you do at work, as part of your house and yard
work, to get from place to place, and in your spare time for recreation, exercise or sport.
Think about all the vigorous activities that you did in the last 7 days. Vigorous physical
activities refer to activities that take hard physical effort and make you breathe much harder
than normal. Think only about those physical activities that you did for at least 10 minutes at a
time.
1. During the last 7 days, on how many days did you do vigorous physical
activities like heavy lifting, digging, aerobics, or fast bicycling?
days per week
No vigorous physical activities Skip to question 3
2. How much time did you usually spend doing vigorous physical activities on one of those
days?
hours per day
minutes per day
Don’t know/Not sure Think about all the moderate activities that you did in the last 7 days. Moderate activities
refer to activities that take moderate physical effort and make you breathe somewhat harder
than normal. Think only about those physical activities that you did for at least 10 minutes at
a time. 3. During the last 7 days, on how many days did you do moderate physical activities like
carrying light loads, bicycling at a regular pace, or doubles tennis? Do not include
walking.
days per week
No moderate physical activities Skip to question 5
Page 140
SHORT LAST 7 DAYS SELF-ADMINISTERED version of the IPAQ. Revised August 2002.
4. How much time did you usually spend doing moderate physical activities on one of
those days?
hours per day
minutes per day
Don’t know/Not sure Think about the time you spent walking in the last 7 days. This includes at work and at home,
walking to travel from place to place, and any other walking that you might do solely for
recreation, sport, exercise, or leisure.
5. During the last 7 days, on how many days did you walk for at least 10 minutes at a
time?
days per week
No walking Skip to question 7
6. How much time did you usually spend walking on one of those days?
hours per day
minutes per day
Don’t know/Not sure The last question is about the time you spent sitting on weekdays during the last 7 days.
Include time spent at work, at home, while doing course work and during leisure time. This
may include time spent sitting at a desk, visiting friends, reading, or sitting or lying down to
watch television.
7. During the last 7 days, how much time did you spend sitting on a week day?
hours per day
minutes per day
Don’t know/Not sure This is the end of the questionnaire, thank you for participating.
Page 141
2002منقحة أغسطس -الصيغة المختصرة الستبانة النشاط البدني الدولية، لالستخدام عن طريق الهاتف
(2002 أغسطس) ستبانة النشاط البدني الدوليةا
سنة( 96-51والكبار للشباب ماضية )ال ةلقياس مستوى النشاط البدني في األيام السبع
لالستبانة، لالستخدام بواسطة الهاتفة المختصر صيغةال ــــــــــــــــــــــــــــــــــــــــــــــــــــــــ
حقنو مسنتقلة منن 1أربع مجموعات من االستبانات؛ صيغة مطولة )تتكون منن (IPAQ) استبانة النشاط البدني الدولية تتضمن
لالسنتخدام بواسنطة حنداااإن، ا(. لكل صنيغة منن الصنيغتين اسنتبانتعامة بنود 4األنشطة البدنية(، وصيغة مختصرة )مكونة من
إن ادف انذ االسنتبانات انو تنوفير أداة مشنتركة يمكنن ئتها من قبل الشخص نفسه(. الهاتف، واألخرى لالستخدام الذاتي )يتم تعب
من خال استخدامها الحصو على بيانات عن مستوى النشاط البدني المرتبط بالصحة، قابلة للمقارنة دوليا.
خلفية عن استبانة النشاط البدني الدولية
بنارات مكففنة إجنراء اخت م2000في عام م، وتبع ذلك5661ينة جنيف في عام للنشاط البدني في مد بدأت عملية بناء مقياس دولي
موقعا(. ولقد أظهرت النتائج النهائية أن المقناييس المسنتخدمة تمتناخ بخنواا قيناس 54دولة ) 52، شملت لصدق المقياس وثباته
لدراسنات الوطنينة لمعرفنة شنيوا ممارسنة صنالحيتها لالسنتعما فني امنع الستخدامها في أماكن متعددة وبلغات مختلفة، ،مقبولة
النشاط البدني لدى السكان.
استبانة النشاط البدني الدولية ستخداما
وصني بعندم إحندا يلبحنث العلمني. ولغنر امراقبة مستوى النشاط البدني، ول م استبانة النشاط البدني الدوليةاستخدا على يحث
ستخدمة، ألن ذلك يؤثر في الخصائص السيكومترية لألداة.أي تغيير في ترتيب األسئلة أو في الكلمات الم
مة الفقافيةءالترجمة من اللغة اإلنجليزية والمال
يسهل استعمالها على نطناق مما، يستحق التأييدأمر إن ترجمة استبانة النشاط البدني الدولية من اللغة اإلنجليزية إلى لغات أخرى
علقننة بتننوفر االسننتبانة الدوليننة للنشنناط البنندني بلغننات مختلفننة مننن الموقننع التننالي واسننع. ويمكننن الحصننو علننى المعلومننات المت
www.ipaq.ki.se طريقننة الترجمننة العكسننية ، وفنني حالننة الشننروا فنني ترجمننة االسننتبانة، فدننننا نوصنني بشنندة أن يننتم اسننتخدام
(Back translationالموضننحة علننى موقننع ا )،إتاحننة النسننخة ضننع فنني االعتبننار السننتبانة اإللكتروننني. فضننال، إذا كننان ممكنننا
لومنات إضنافية حنو المترجمة من االستبانة الدولية لآلخرين، وذلك بوضعها في الموقنع اإللكترونني، ويمكنن الحصنو علنى مع
النشاط البدني الدولية. مة الفقافية من خال موقع استبانةالترجمة والمالء
البيانات وترميزااإدخا
ملحق مع إجابات كل سؤا من أسئلة استبانة النشاط البدني الدولية رموخ مقترحة للمتغيرات والمدى المتوقنع لججابنات، لتسنهيل
بالضنبط وصني بنأن ينتموي ،القنائمين علنى إجنراء المقنابالت عملية إدخا البيانات والتعامنل معهنا، وللمسناعدة فني عملينة تندريب
فني خاننة الندقائق، وفني حالنة اإلجابنة بسناعتين، 520دقيقنة تكتنب 520جابة الفعلية للمجيب، فعلى سنبيل المفنا تسجيل اإل
فني 00السناعات، و دفني عنامو 5في خانة الساعات، أما في حالة كون اإلجابة ساعة ونصف فتكتنب علنى أسناس 2فتكتب
الدقائق. دعامو
الدولية استبانة النشاط البدني تطورات
إن التعاون الدولي حو استبانة النشاط البدني الدولية مستمر، وحاليا يتم إنجاخ دراسة دولية حو شيوا ممارسة النشناط البندني.
ولمزيد من المعلومات، يمكن الرجوا إلى الموقع اإللكتروني الستبانة النشاط البدني الدولية.
معلومات إضافية
معلومات إضافية حو إجراءات استبانة النشاط البدني الدولية وطرق www.ipaq.ki.seني التالي يتوافر في الموقع اإللكترو
Booth, M. L. (2000). Assessment of Physical Activity: Anيمكنن الرجنوا للمرجنع التنالي و ،هنائالبحنث المسنتخدمة فني بنا
International Perspective. Research Quarterly for Exercise and Sport, 71 (2): s 114-20. فر، كمنا يتنو
لبحو أخرى نشرت أو ألقيت في مؤتمرات علمية، حو استخدام استبانة النشاط البندني على الموقع اإللكتروني، عر موجز
الدولية.
لالستخدام بواسطة الهاتف ،النشاط البدني الدولية انةالستبة المختصر صيغةال ـــــــــــــــــــــــــــــــــــــــــــــــ
Page 142
2002منقحة أغسطس -الصيغة المختصرة الستبانة النشاط البدني الدولية، لالستخدام عن طريق الهاتف
أنشنطة بدنينة خنال األينام قضنيته فني ممارسنةسنوف أسنألك بعنأل األسنئلة عنن الوقنت النذي أقرأ على المشارك
ط بندنيا. فكنر فني ينفسنك غينر نشن تبنرن كننت تعكل سؤا من األسنئلة التالينة حتنى وإ نالماضية. فضال أجب ع ةالسبع
تلنك التني و اء تنقلنك منن مكنان ،خنر، ننث، و أأعمالنك المنزلينةكجزء منن و خال عملك، األنشطة البدنية التي تمارسها
.تقوم بها في وقت فراغك بغر الترويح أو التمرين أو الرياضة
قمنت بممارسنتها التي تتطلب جهدا بدنيا مرتفع الشدة والتي ا،ن فكر في جميع األنشطة البدنية أقرأ على المشارك
، أعلى بكفير من المعتادمرتفعة الشدة اي تلك األنشطة التي تجعل تنفسك الماضية. األنشطة البدنية ةخال األيام السبع
كنرة لقندم، أو، أو الجنري، أو ممارسنة كنرة امفل رفع أشياء ثقيلة، أو حر األر ، أو ركوب الدراجة بسرعة عالية
علنى دقنائق 50مرتفعة الشدة التي قمت بممارستها لمدة فكر فقط في األنشطة البدنية .، أو السباحة، أو نط الحبلالسلة
في كل مرة. قلاأل
، كم يومالماضية ةاأليام السبعخال -5 مارست فيه نشاطا بدنيا مرتفع الشدة؟ ا
[VDAY; Range 0-7, 8, 9] ........ يوم في األسبوا
دري/ أو غير متأكديال 8.
رفأل اإلجابة 9.
50دة مرتفعنة الشندة التني قمنت بممارسنتها لمنفقنط فني األنشنطة البدنينة فكنرمجري المقابلةإيضاح من )
في كل مرة(. على األقل دقائق
بننة عنننأو رفننأل اإلجا، ( انني صننفر5 إذا كانننت اإلجابننة عننن السننؤا رقننم )لمجننري المقابلننةملحوظننة )
(.0نتقل مباشرة إلى السؤا رقم اأو لم يعرف الجواب، ،السؤا
قضيته في كل يوم مارست فيه نشاطمن الوقت في المعتاد، كم -2 بدني ا مرتفع الشدة؟ ا
]Range 0HRSVD ;-16[ ساعة في اليوم -- --
]Range 0MINVD ;-960, 998, 999[دقيقة في اليوم -- -- --
ال أدري/ أو غير متأكد 998.
رفأل اإلجابة 999.
50دة مرتفعنة الشندة التني قمنت بممارسنتها لمنفقنط فني األنشنطة البدنينة فكنرمجري المقابلةإيضاح من )
في كل مرة(. على األقل دقائق
مجري المقابلةمن متابعة) مرتفنع المطلوب او متوسط الوقت ألحد األيام التي مارست فيها نشاطا بندنيا
كنم هألن وقت الممارسة تفاوت كفيرا من يوم ،خر، أسنأل ،السؤا ا لم يتمكن المجيب من اإلجابة عنالشدة. إذ
(.مرتفع الشدة؟ بدني في ممارسة نشاط الماضية عةاأليام السبمجموا الوقت الذي قضيته خال
]Range 0HRSWV ;-121[ األسبواساعة في -- --
]Range 0MINWV ;-6720, 9899, 9999[ األسبوادقيقة في -- -- --
Page 143
2002منقحة أغسطس -الصيغة المختصرة الستبانة النشاط البدني الدولية، لالستخدام عن طريق الهاتف
دري/ أو غير متأكديال 9998.
رفأل اإلجابة 9999.
قمنت بممارسنتها ا،ن فكر في جميع األنشطة البدنية التي تتطلب جهدا بدنيا معتد الشدة والتي أقرأ على المشارك
إلنى أعلنى منن المعتنادالشدة اي تلك األنشنطة التني تجعنل تنفسنك معتدلةة الماضية. األنشطة البدني ةخال األيام السبع
، أو ممارسنة ممارسنة كنرة الطنائرة، أو عادية، أو ركوب الدراجة بسرعة خفيفةرفع أشياء ويمكن أن تتضمن، حدا ما
،أو كنس المنز ، تنس الطاولة األنشنطة. منرة ال تحسنب المشني ضنمن انذ .، أو غسل السيارةأو غسل المالبس يدويا
في كل مرة. على األقل دقائق 50ة الشدة التي قمت بممارستها لمدة معتدلفكر فقط في األنشطة البدنية أخرى،
، كم يوما مارست فيه نشاطا بدنيا معتد الشدة؟الماضية ةاأليام السبعخال -0
[MDAY; Range 0-7, 8, 9]........ يوم في األسبوا
و غير متأكددري/ أيال 8.
رفأل اإلجابة 9.
50دة الشندة التني قمنت بممارسنتها لمن معتدلنةفقنط فني األنشنطة البدنينة فكنرمجري المقابلنةإيضاح من )
دقائق على األقل في كل مرة(.
( انني صننفر، أو رفننأل اإلجابننة عننن0السننؤا رقننم ) ابننة عننن إذا كانننت اإلجلمجننري المقابلننةملحوظننة )
(.1نتقل مباشرة إلى السؤا رقم االجواب، أو لم يعرف ،السؤا
مارست فيه نشاط كل يومقضيته في في المعتاد، كم من الوقت -4 بدني ا معتد الشدة؟ ا
]Range 0MDHRS ;-16[ساعة في اليوم -- --
]Range 0MDMIN ;-960, 998, 999[دقيقة في اليوم -- -- --
دري/ أو غير متأكديال 998.
رفأل اإلجابة 999.
50دة ة الشندة التني قمنت بممارسنتها لمنمعتدلنفقنط فني األنشنطة البدنينة فكنرمجري المقابلنةإيضاح من )
دقائق على األقل في كل مرة(.
المطلوب او متوسط الوقت ألحد األيام التي مارست فيهنا نشناطا بندنيا معتند مجري المقابلةمن متابعة)
كنم هأسنألالسؤا ألن وقت الممارسة تفاوت كفيرا منن ينوم ،خنر، نالمجيب من اإلجابة ع الشدة. إذا لم يتمكن
بدني معتد الشدة؟(. في ممارسة نشاط الماضية ةاأليام السبعمجموا الوقت الذي قضيته خال
]Range 0MWHRS ;-112[ األسبوا ساعة في -- --
]RangeMWMIN ; 0-6720, 9998, 9999[ األسبوادقيقة في -- -- --
دري/ أو غير متأكديال 9998.
Page 144
2002منقحة أغسطس -الصيغة المختصرة الستبانة النشاط البدني الدولية، لالستخدام عن طريق الهاتف
رفأل اإلجابة 9999.
خال األيام السبع الماضية، ويتضنمن ذلنك المشني المشي في ا،ن فكر في الوقت الذي قضيته أقرأ على المشارك
أننواا المشني بغنر إلى العمل، والمشي أثناء العمنل، وفني البينت، وخنال انتقالنك منن مكنان ،خنر، أو أي ننوا منن
. الترويح أو الرياضة
؟دقائق على األقل في كل مرة 50المشي لمدة ، كم يوما مارست فيه الماضية ةاأليام السبعخال -1
[WDAY; Range 0-7, 8, 9]........ يوم في األسبوا
دري/ أو غير متأكديال 8.
رفأل اإلجابة 9.
دقائق على األقل في كل مرة(. 50دة لم هقمت ب المشي الذيفي فقط فكرالمقابلة مجري إيضاح من)
،السنؤا ( اي صفر، أو رفنأل اإلجابنة عنن1السؤا رقم ) ن إذا كانت اإلجابة علمجري المقابلةملحوظة )
(.7أو لم يعرف الجواب، أنتقل مباشرة إلى السؤا رقم
؟ ي المش ت فيهمارسكل يوم في المعتاد، كم من الوقت قضيته في -9
]Range 0DHRSW ;-16[ساعة في اليوم -- --
]Range 0DMINW ;-960, 998, 999[دقيقة في اليوم -- -- --
دري/ أو غير متأكديال 998.
رفأل اإلجابة 999.
ذا لنم . إالمشني المطلنوب انو متوسنط الوقنت ألحند األينام التني مارسنت فيهنا مجنري المقابلنةمنن متابعنة)
كنم مجمنوا هالسنؤا ألن وقنت الممارسنة تفناوت كفينرا منن ينوم ،خنر، أسنأل يتمكن المجينب منن اإلجابنة عنن
؟(. الماضية ةاأليام السبعخال في المشي الوقت الذي قضيته
]Range 0HRSWW ;-112[ األسبوا ساعة في -- -- --
]Range 0MINWW ;-6720, 9989, 9999[ األسبوادقيقة في -- -- -- --
دري/ أو غير متأكديال 9998.
رفأل اإلجابة 9999.
ا،ن فكر في الوقت الذي قضيته أقرأ على المشارك أحسب وقت الجلنوس فني الماضية. ةخال األيام السبع جالسا
وأثناء العمنل تب،الجلوس على المكوقت ن يتضمن ذلك العمل، وفي المنز ، وفي الدراسة، وفي الترفيه. من الممكن أ
.لمشاادة التلفزيون ءأو االستلقا و الجلوسو أثناء خيارتك لصديق، و أثناء القراءة، على الكمبيوتر،
، كم من الوقت قضيتهالماضية ةاأليام السبعخال -7 ؟أيام اإلجاخة األسبوعية غيرمن أحد اذ األيام في جالسا
Page 145
2002منقحة أغسطس -الصيغة المختصرة الستبانة النشاط البدني الدولية، لالستخدام عن طريق الهاتف
]Range 0HRSDS ;-16[ اليوم في ساعة -- --
]Range 0MINSD ;-999 ,998 ,960[ اليومفي دقيقة -- -- --
دري/ أو غير متأكديال 998.
رفأل اإلجابة 999.
، وكنذلك وقنت مستلقيا وأننت مسنتيق الوقت الذي كنت فيه ،ذلك ضمنيدخل مجري المقابلةإيضاح من )
الجلوس(.
ه تالذي قضي الواحد الوقت في اليوم المطلوب او متوسط مجري المقابلة متابعة من) . إذا لنم ينتمكن جالسا
كنم مجمنوا الوقنت النذي هالسؤا ألن وقت الجلوس يتفاوت كفيرا من يوم ،خر، أسأل ناإلجابة ع المجيب من
قضيته جالسا في يوم االثنين الماضي؟(.
]Range 0HRSWS ;-16[ساعة في يوم األثنين -- --
]Range 0MINWS ;-999 ,998 ,960[قة في يوم األثنين دقي -- -- --
دري/ أو غير متأكديال 998.
رفأل اإلجابة 999.
Page 146
6330876500في حالة وجود أي استفسار الرجاء التكرم باالتصال على جوال رقم
Appendix B
االسم:
استمارة رقم 1 2 3 بداية وقت االكل ونهايته
Q. 1
اسماء قائمة
الطعام والشراب
Q. 2
الوقت
Q. 3
المناسبة
الشراب
الطعام
إضافات
Q. 4
وصف الطعام والشراب
ومقدار مكوناته
Q. 5 كم فعليا من االكل والشرب
اكلت أو شربت
Pass 1 Pass 2
الصباح
Page 147
6330876500في حالة جود أي استفسار الرجاء االتصال على جوال رقم
االسم:
استمارة رقم 1 2 3 بداية وقت االكل ونهايته
Q. 1
اسماء قائمة
والشراب الطعام
Q. 2
الوقت
Q. 3
المناسبة
الشراب
الطعام
إضافات
Q. 4
وصف الطعام والشراب
ومقدار مكوناته
Q. 5 كم فعليا من االكل والشرب
اكلت أو شربت
Pass 1 Pass 2
الظهر
Page 148
6330876500في حالة وجود أي استفسار الرجاء التكرم باالتصال على جوال رقم
االسم:
استمارة رقم 1 2 3 بداية وقت االكل ونهايته
Q. 1
اسماء قائمة
الطعام والشراب
Q. 2
الوقت
Q. 3
المناسبة
الشراب
الطعام
إضافات
Q. 4
وصف الطعام والشراب
ومقدار مكوناته
Q. 5 كم فعليا من االكل والشرب
اكلت أو شربت
Pass 1 Pass 2
المساء
Page 149
Revised November2005 1
Appendix C
Guidelines for Data Processing and Analysis of the International Physical
Activity Questionnaire (IPAQ) – Short and Long Forms
November 2005
Contents
1. Introduction
2. Uses of IPAQ Instruments
3. Summary Characteristics of Short and Long Forms
4. Overview of Continuous and Categorical Analyses of IPAQ
5. Protocol for Short Form
6. Protocol for Long Form
7. Data Processing Rules
8. Summary Algorithms
Appendix 1. At A Glance IPAQ Scoring Protocol – Short Forms
Appendix 2. At A Glance IPAQ Scoring Protocol – Long Forms
Page 150
Revised November2005 2
1. Introduction
This document describes recommended methods of scoring the data derived from the
telephone / interview administered and self-administered IPAQ short and long form
instruments. The methods outlined provide a revision to earlier scoring protocols for the IPAQ
short form and provide for the first time a comparable scoring method
for IPAQ long form. Latest versions of IPAQ instruments are available from
www.ipaq.ki.se.
Although there are many different ways to analyse physical activity data, to date
there is no formal consensus on a ‘correct’ method for defining or describing levels of
physical activity based on self–report population surveys. The use of different scoring
protocols makes it very difficult to compare within and between countries, even when the
same instrument has been used. Use of these scoring methods will enhance the comparability
between surveys, provided identical sampling and survey methods
have been used.
2. Uses of IPAQ Instruments
IPAQ short form is an instrument designed primarily for population surveillance of
physical activity among adults. It has been developed and tested for use in adults (age range
of 15-69 years) and until further development and testing is undertaken the use of IPAQ
with older and younger age groups is not recommended.
IPAQ short and long forms are sometimes being used as an evaluation tool in intervention
studies, but this was not the intended purpose of IPAQ. Users should carefully note the
range of domains and types of activities included in IPAQ before using it in this context.
Use as an outcome measure in small scale intervention studies is not recommended. 3. Summary Characteristics of IPAQ Short and Long Forms
1. IPAQ assesses physical activity undertaken across a comprehensive set of domains
including:
a. leisure time physical activity
b. domestic and gardening (yard) activities c.
work-related physical activity
d. transport-related physical activity;
2. The IPAQ short form asks about three specific types of activity undertaken in the four
domains introduced above. The specific types of activity that are assessed are
walking, moderate-intensity activities and vigorous-intensity activities.
3. The items in the short IPAQ form were structured to provide separate scores on walking,
moderate-intensity and vigorous-intensity activity. Computation of the total score for the
short form requires summation of the duration (in minutes)
and frequency (days) of walking, moderate-intensity and vigorous-intensity
activities. Domain specific estimates cannot be estimated.
Page 151
Revised November2005 3
4. The IPAQ long form asks details about the specific types of activities undertaken
within each of the four domains. Examples include walking for transportation and
moderate-intensity leisure-time activity.
5. The items in the long IPAQ form were structured to provide separate domain specific
scores for walking, moderate-intensity and vigorous-intensity activity within each of the
work, transportation, domestic chores and gardening (yard) and leisure-time domains.
Computation of the total scores for the long form requires summation of the duration (in
minutes) and frequency (days) for all the types of activities in all domains. Domain
specific scores or activity specific sub- scores may be calculated. Domain specific scores
require summation of the scores for walking, moderate-intensity and vigorous-intensity
activities within the specific domain, whereas activity-specific scores require summation
of the scores for the specific type of activity across domains. 4. Overview of Continuous and Categorical Analyses of IPAQ
Both categorical and continuous indicators of physical activity are possible from both IPAQ
forms. However, given the non-normal distribution of energy expenditure in many
populations, it is suggested that the continuous indicator be presented as median
minutes/week or median MET–minutes/week rather than means (such as mean minutes/week
or mean MET-minutes/week). 4.1 Continuous Variables
Data collected with IPAQ can be reported as a continuous measure. One measure of the
volume of activity can be computed by weighting each type of activity by its energy
requirements defined in METs to yield a score in MET–minutes. METs are multiples of the
resting metabolic rate and a MET-minute is computed by multiplying the MET score of an
activity by the minutes performed. MET-minute scores are equivalent to kilocalories for a 60
kilogram person. Kilocalories may be computed from MET-minutes using the following
equation: MET-min x (weight in kilograms/60 kilograms). MET-minutes/day or MET-
minutes/week can be presented although the latter is more frequently used and is thus
suggested.
Details for the computation for summary variables from IPAQ short and long forms are
detailed below. As there are no established thresholds for presenting MET- minutes, the
IPAQ Research Committee propose that these data are reported as comparisons of median
values and interquartile ranges for different populations.
4.2 Categorical Variable: Rationale for Cut Point Values
There are three levels of physical activity proposed to classify populations:
1. Low
2. Moderate
3. High
Page 152
Revised November2005 4
The algorithms for the short and long forms are defined in more detail in Sections 5.3 and 6.3,
respectively. Rules for data cleaning and processing prior to computing the algorithms appear
in Section 7.
Regular participation is a key concept included in current public health guidelines for physical
activity.1
Therefore, both the total volume and the number of days/sessions are included in the
IPAQ analysis algorithms.
The criteria for these levels have been set taking into account that IPAQ asks questions in all
domains of daily life, resulting in higher median MET-minutes estimates than would have
been estimated from leisure-time participation alone. The criteria for these three levels are
shown below.
Given that measures such as IPAQ assess total physical activity in all domains, the “leisure
time physical activity” based public health recommendation of 30 minutes on most days will
be achieved by most adults in a population. Although widely accepted as a goal, in absolute
terms 30 minutes of moderate-intensity activity is low and broadly equivalent to the
background or basal levels of activity adult individuals would accumulate in a day. Therefore
a new, higher cutpoint is needed to describe the levels of physical activity associated with
health benefits for measures such as IPAQ, which report on a broad range of domains of
physical activity.
‘High’
This category was developed to describe higher levels of participation. Although it is known
that greater health benefits are associated with increased levels of activity there is no
consensus on the exact amount of activity for maximal benefit. In the absence of any
established criteria, the IPAQ Research Committee proposes a measure which equates to
approximately at least one hour per day or more, of at
least moderate-intensity activity above the basal level of physical activity Considering that
basal activity may be considered to be equivalent to approximately 5000 steps per day, it is
proposed that “high active” category be considered as those who move at least 12,500 steps
per day, or the equivalent in moderate and vigorous activities. This represents at least an hour
more moderate-intensity activity over and above the basal level of activity, or half an hour of
vigorous-intensity activity over and above basal levels daily. These calculations were based on
emerging results of pedometers
studies.2
This category provides a higher threshold of measures of total physical activity and is a useful
mechanism to distinguish variation in population groups. Also it could be used to set
population targets for health-enhancing physical activity when multi- domain instruments,
such as IPAQ are used.
1 Pate RR, Pratt M, Blair SN, Haskell WL , Macera CA, Bouchard C et al. Physical activity and public health. A
recommendation from the Centers for Disease Control and Prevention and the American College of Sports
Medicine. Journal of American Medical Association 1995; 273(5):402-7. and U.S. Department of Health and Human Services. Physical Activity and Health: A Report of the Surgeon General. Department of Health and Human Services, Centers for Disease Control and Prevention, National Center for Chronic Disease Prevention and Health Promotion, The Presidents' Council on Physical Fitness and Sports: Atlanta, GA:USA. 1996. 2 Tudor-Locke C, Bassett DR Jr. How many steps/day are enough? Preliminary pedometer indices for public health. Sports Med. 2004;34(1):1-8.
Page 153
Revised November2005 5
‘Moderate’
This category is defined as doing some activity, more than the low active category. It is
proposed that it is a level of activity equivalent to “half an hour of at least
moderate-intensity PA on most days”, the former leisure time-based physical activity
population health recommendation.
‘Low’
This category is simply defined as not meeting any of the criteria for either of the
previous categories. 5. Protocol for IPAQ Short Form
5.1 Continuous Scores
Median values and interquartile ranges can be computed for walking (W), moderate- intensity
activities (M), vigorous-intensity activities (V) and a combined total physical activity score.
All continuous scores are expressed in MET-minutes/week as defined below.
5.2 MET Values and Formula for Computation of MET-minutes/week
The selected MET values were derived from work undertaken during the IPAQ Reliability
Study undertaken in 2000-20013. Using the Ainsworth et al. Compendium (Med Sci Sports
Med 2000) an average MET score was derived for each type of activity. For example; all types of walking were included and an average MET value for walking was created. The same procedure was undertaken for moderate-intensity
activities and vigorous-intensity activities. The following values continue to be used for the
analysis of IPAQ data: Walking = 3.3 METs, Moderate PA = 4.0 METs and Vigorous PA =
8.0 METs. Using these values, four continuous scores are defined:
Walking MET-minutes/week = 3.3 * walking minutes * walking days
Moderate MET-minutes/week = 4.0 * moderate-intensity activity minutes * moderate
days Vigorous MET-minutes/week = 8.0 * vigorous-intensity activity minutes *
vigorous-intensity days Total physical activity MET-minutes/week = sum of Walking +
Moderate + Vigorous MET- minutes/week scores. 5.3 Categorical Score
Category 1 Low
This is the lowest level of physical activity. Those individuals who not meet criteria for
Categories 2 or 3 are considered to have a ‘low’ physical activity level.
3 Craig CL,Marshall A , Sjostrom M et al. International Physical Activity Questionnaire: 12 country
reliability and validity Med Sci Sports Exerc 2003;August
Page 154
Revised November2005 6
Category 2 Moderate
The pattern of activity to be classified as ‘moderate’ is either of the following criteria:
a) 3 or more days of vigorous-intensity activity of at least 20 minutes per day
OR
b) 5 or more days of moderate-intensity activity and/or walking of at least 30
minutes per day
OR
c) 5 or more days of any combination of walking, moderate-intensity or vigorous
intensity activities achieving a minimum Total physical activity of at least 600
MET-minutes/week. Individuals meeting at least one of the above criteria would be defined as accumulating a
minimum level of activity and therefore be classified as ‘moderate’. See Section 7.5 for
information about combining days across categories.
Category 3 High
A separate category labelled ‘high’ can be computed to describe higher levels of
participation.
The two criteria for classification as ‘high’ are:
a) vigorous-intensity activity on at least 3 days achieving a minimum Total
physical activity of at least 1500 MET-minutes/week
OR
b) 7 or more days of any combination of walking, moderate-intensity or
vigorous-intensity activities achieving a minimum Total physical activity of at least 3000 MET-minutes/week.
See Section 7.5 for information about combining days across categories.
5.4 Sitting Question in IPAQ Short Form
The IPAQ sitting question is an additional indicator variable of time spent in sedentary activity
and is not included as part of any summary score of physical activity. Data on sitting should be
reported as median values and interquartile ranges. To-date there are few data on sedentary
(sitting) behaviours and no well-accepted thresholds for data presented as categorical levels. 6. Protocol for IPAQ Long Form
The long form of IPAQ asks in detail about walking, moderate-intensity and vigorous-
intensity physical activity in each of the four domains. Note: asking more detailed questions
regarding physical activity within domains is likely to produce higher prevalence estimates
than the more generic IPAQ short form.
Page 155
Revised November2005 7
6.1 Continuous Score
Data collected with the IPAQ long form can be reported as a continuous measure and
reported as median MET-minutes. Median values and interquartile ranges can
be computed for walking (W), moderate-intensity activities (M), and vigorous-intensity
activities (V) within each domain using the formulas below. Total scores may also be
calculated for walking (W), moderate-intensity activities (M), and vigorous-intensity activities
(V); for each domain (work, transport, domestic and garden, and leisure)
and for an overall grand total. 6.2 MET Values and Formula for Computation of MET-minutes
Work Domain
Walking MET-minutes/week at work = 3.3 * walking minutes * walking days at work
Moderate MET-minutes/week at work= 4.0 * moderate-intensity activity minutes *
moderate-intensity days at work
Vigorous MET-minutes/week at work= 8.0 * vigorous-intensity activity minutes * vigorous-intensity days at work
Total Work MET-minutes/week =sum of Walking + Moderate + Vigorous MET-minutes/week scores at work.
Active Transportation Domain
Walking MET-minutes/week for transport = 3.3 * walking minutes * walking days for
transportation
Cycle MET-minutes/week for transport= 6.0 * cycling minutes * cycle days for transportation
Total Transport MET-minutes/week = sum of Walking + Cycling MET-minutes/week scores for transportation.
Domestic and Garden [Yard Work] Domain
Vigorous MET-minutes/week yard chores= 5.5 * vigorous-intensity activity minutes *
vigorous-intensity days doing yard work (Note: the MET value of 5.5 indicates that
vigorous garden/yard work should be considered a moderate-intensity activity for scoring
and computing total moderate intensity activities.)
Moderate MET-minutes/week yard chores= 4.0 * moderate-intensity activity minutes *
moderate- intensity days doing yard work Moderate MET-minutes/week inside chores= 3.0* moderate-intensity activity minutes *
moderate- intensity days doing inside chores. Total Domestic and Garden MET-minutes/week =sum of Vigorous yard + Moderate yard +
Moderate inside chores MET-minutes/week scores. Leisure-Time Domain
Walking MET-minutes/week leisure = 3.3 * walking minutes * walking days in leisure Moderate MET-minutes/week leisure = 4.0 * moderate-intensity activity minutes *
moderate-intensity days in leisure Vigorous MET-minutes/week leisure = 8.0 * vigorous-intensity activity minutes *
vigorous-intensity days in leisure Total Leisure-Time MET-minutes/week = sum of Walking + Moderate + Vigorous MET-
minutes/week scores in leisure.
Page 156
Revised November2005 8
Total Scores for all Walking, Moderate and Vigorous Physical Activities
Total Walking MET-minutes/week = Walking MET-minutes/week (at Work + for Transport + in Leisure) Total
Moderate MET-minutes/week total = Moderate MET-minutes/week (at Work + Yard chores +
inside chores + in Leisure time) + Cycling Met-minutes/week for Transport + Vigorous Yard chores MET-minutes/week
Total Vigorous MET-minutes/week = Vigorous MET-minutes/week (at Work + in Leisure)
Note: Cycling MET value and Vigorous garden/yard work MET value fall within the coding range of
moderate-intensity activities.
Total Physical Activity Scores
An overall total physical activity MET-minutes/week score can be computed as:
Total physical activity MET-minutes/week = sum of Total (Walking + Moderate + Vigorous) MET-
minutes/week scores.
This is equivalent to computing:
Total physical activity MET-minutes/week = sum of Total Work + Total Transport + Total Domestic and
Garden + Total Leisure-Time MET-minutes/week scores.
As there are no established thresholds for presenting MET-minutes, the IPAQ Research Committee
proposes that these data are reported as comparisons of median values and interquartile ranges for
different populations. 6.3 Categorical Score
As noted earlier, regular participation is a key concept included in current public health
guidelines for physical activity.4
Therefore, both the total volume and the number of
day/sessions are included in the IPAQ analysis algorithms. There are three levels of physical
activity proposed to classify populations – ‘low’, ’moderate’,
and ‘high’. The criteria for these levels are the same as for the IPAQ short [described earlier
in Section 4.2]
Category 1 Low
This is the lowest level of physical activity. Those individuals who not meet criteria for
Categories 2 or 3 are considered ‘low’.
Category 2 Moderate
The pattern of activity to be classified as ‘moderate’ is either of the following criteria:
d) 3 or more days of vigorous-intensity activity of at least 20 minutes per day
OR
e) 5 or more days of moderate-intensity activity and/or walking of at least 30
minutes per day
OR
4 Pate RR, Pratt M, Blair SN, Haskell WL , Macera CA, Bouchard C et al. Physical activity and public health. A
recommendation from the Centers for Disease Control and Prevention and the American College of Sports
Medicine. Journal of American Medical Association 1995; 273(5):402-7. and U.S. Department of Health and
Human Services. Physical Activity and Health: AReport of the Surgeon General. Department of Health and
Human Services, Centers for Disease Control and Prevention, National Center for Chronic Disease Prevention
and Health Promotion, The Presidents' Council on Physical Fitness and Sports: Atlanta, GA:USA. 1996.
Page 157
Revised November2005 9
f) 5 or more days of any combination of walking, moderate-intensity or vigorous-
intensity activities achieving a minimum Total physical activity of at least 600
MET-minutes/week.
Individuals meeting at least one of the above criteria would be defined as accumulating
a moderate level of activity. See Section 7.5 for information about combining days
across categories.
Category 3 High
A separate category labelled ‘high’ can be computed to describe higher levels of
participation.
The two criteria for classification as ‘high’ are:
a) vigorous-intensity activity on at least 3 days achieving a minimum Total
physical activity of at least 1500 MET-minutes/week
OR
b) 7 or more days of any combination of walking, moderate-intensity or
vigorous-intensity activities achieving a minimum Total physical activity of at
least 3000 MET-minutes/week.
See Section 7.5 for information about combining days across categories.
6.4 IPAQ Sitting Question IPAQ Long Form
The IPAQ sitting question is an additional indicator variable and is not included as part of any
summary score of physical activity. To-date there are few data on sedentary (sitting)
behaviours and no well-accepted thresholds for data presented as categorical levels. For the
sitting question ‘Minutes’ is used as the indicator to reflect time spent in sitting rather than
MET-minutes which would suggest an estimate of energy expenditure.
IPAQ long assesses an estimate of sitting on a typical weekday, weekend day and time
spent sitting during travel (see transport domain questions).
Summary sitting variables include
Sitting Total Minutes/week = weekday sitting minutes* 5 weekdays + weekend day sitting
minutes* 2 weekend days Average Sitting Total Minutes/day = (weekday sitting minutes* 5 weekdays + weekend
day sitting minutes* 2 weekend days) / 7
Note: The above calculation of ‘Sitting Total’ excludes time spent sitting during travel because the introduction
in IPAQ long directs the responder to NOT include this component as it would have already been captured under
the Transport section. If a summary sitting variable including time spent sitting for transport is required, it
should be calculated by adding the time reported (travelling in a motor vehicle) under transport to the above
formula. Care should be taken in reporting these alternate data to clearly distinguish the ‘total sitting’ variable
from a ‘total sitting – including transport’ variable.
Page 158
Revised November2005 10
7. Data Processing Rules
In addition to a standardized approach to computing categorical and continuous measures of
physical activity, it is necessary to undertake standard methods for the cleaning and
treatment of IPAQ datasets. The use of different approaches and rules would introduce
variability and reduce the comparability of data.
There are no established rules for data cleaning and processing on physical activity. Thus, to
allow more accurate comparisons across studies IPAQ Research Committee has established
and recommends the following guidelines:
7.1 Data Cleaning
I. Any responses to duration (time) provided in the hours and minutes response option
should be converted from hours and minutes into minutes.
II. To ensure that responses in ‘minutes’ were not entered in the ‘hours’ column by mistake
during self-completion or during data entry process, values of ‘15’, ‘30’,
‘45’, ‘60’ and ‘90’ in the ‘hours’ column should be converted to ‘15’, ‘30’, ‘45’, ‘60’
and ‘90’ minutes, respectively, in the minutes column.
III. In some cases duration (time) will be reported as weekly (not daily) e.g., VWHRS,
VWMINS. These data should be converted into an average daily time by dividing by 7.
IV. If ‘don’t know’ or ‘refused ‘ or data are missing for time or days then that case is
removed from analysis.
Note: Both the number of days and daily time are required for the creation of
categorical and continuous summary variables 7.2 Maximum Values for Excluding Outliers
This rule is to exclude data which are unreasonably high; these data are to be considered
outliers and thus are excluded from analysis. All cases in which the sum total of all Walking,
Moderate and Vigorous time variables is greater than 960 minutes (16 hours) should be
excluded from the analysis. This assumes that on average an individual of 8 hours per day is
spent sleeping.
The ‘days’ variables can take the range 0-7 days, or 8, 9 (don’t know or refused);
values greater than 9 should not be allowed and those cases excluded from analysis. 7.3 Minimum Values for Duration of Activity
Only values of 10 or more minutes of activity should be included in the calculation of
summary scores. The rationale being that the scientific evidence indicates that episodes or
bouts of at least 10 minutes are required to achieve health benefits. Responses of less than 10
minutes [and their associated days] should be re-coded to
‘zero’.
Page 159
Revised November2005 11
7.4 Truncation of Data Rules
This rule attempts to normalize the distribution of levels of activity which are usually
skewed in national or large population data sets.
In IPAQ short - it is recommended that all Walking, Moderate and Vigorous time variables
exceeding ‘ 3 hours’ or ‘180 minutes’ are truncated (that is re-coded) to be equal to ‘180
minutes’ in a new variable. This rule permits a maximum of 21 hours of activity in a week to
be reported for each category (3 hours * 7 days).
In IPAQ long – the truncation process is more complicated, but to be consistent with the
approach for IPAQ short requires that the variables total Walking, total Moderate- intensity
and total Vigorous-intensity activity are calculated and then, for each of these summed
behaviours, the total value should be truncated to 3 hours (180 minutes).
When analysing the data as categorical variable or presenting median and interquartile ranges
of the MET-minute scores, the application of the truncation rule will not affect the results.
This rule does have the important effect of preventing misclassification in the ‘high’ category.
For example, an individual who reports walking for 10 minutes on 6 days and 12 hours of
moderate activity on one day could be coded as ‘high’ because this pattern meets the ‘7 day”
and “3000 MET-min” criteria for ‘high’. However, this uncommon pattern of activity is
unlikely to yield the health benefits that the ‘high’ category is intended to represent.
Although using median is recommended due to the skewed distribution of scores, if IPAQ
data are analysed and presented as a continuous variable using mean values, the application
of the truncation rule will produce slightly lower mean values than would otherwise be
obtained. 7.5 Calculating MET-minute/week Scores
Data processing rules 7.2, 7.3, and 7.4 deals first with excluding outlier data, then
secondly, with recoding minimum values and then finally dealing with high values. These
rules will ensure that highly active people remain classified as ‘high’, while decreasing the
chances that less active individuals are misclassified and coded as
‘high’.
Using the resulting variables, convert time and days to MET-minute/week scores
[see above Sections 5.2 and 6.2; METS x days x daily time]. 7.6 Calculating Total Days for Presenting Categorical Data on Moderate and
High Levels
Presenting IPAQ data using categorical variables requires the total number of ‘days’ on which
all physical activity was undertaken to be assessed. This is difficult because frequency in
‘days’ is asked separately for walking, moderate-intensity and vigorous- intensity activities,
thus allowing the total number of ‘days’ to range from a minimum
Page 160
Revised November2005 12
of 0 to a maximum of 21’days’ per week in IPAQ short and higher in IPAQ long. The IPAQ
instrument does not record if different types of activity are undertaken on the same day.
In calculating ‘moderately active’, the primary requirement is to identify those individuals
who undertake activity on at least ‘5 days’/week [see Sections 4.2 and
5.3]. Individuals who meet this criterion should be coded in a new variable called “at least
five days” and this variable should be used to identify those meeting criterion b) at least 30
minutes of moderate-intensity activity and/or walking; and those meeting criterion c) any
combination of walking, moderate-intensity or vigorous-intensity activities achieving a
minimum of 600 MET-minutes/week.
Below are two examples showing this coding in practice:
i) an individual who reports ‘2 days of moderate-intensity’ and ‘3 days of walking’
should be coded as a value indicating “at least five days”;
ii) an individual reporting ‘2 days of vigorous-intensity’, ‘2 days of moderate-
intensity’ and ‘2 days of walking should be coded as a value to indicate “at least
five days” [even though the actual total is 6].
The original frequency of ‘days’ for each type of activity should remain in the data file for
use in the other calculations.
The same approach as described above is used to calculate total days for computing the ‘high’
category. The primary requirement according to the stated criteria is to identify those
individuals who undertake a combination of walking, moderate-intensity and or vigorous-
intensity activity on at least 7 days/week [See section 4.2].
Individuals who meet this criterion should be coded as a value in a new variable to reflect
“at least 7 days”.
Below are two examples showing this coding in practice:
i) an individual who reports ‘4 days of moderate-intensity’ and ‘3 days of walking’
should be coded as the new variable “at least 7 days”.
ii) an individual reporting ‘3 days of vigorous-intensity’, ‘3 days moderate- intensity’
and ‘3 days walking’ should be coded as “at least 7 days” [even though the total
adds to 9] . 8. Summary algorithms
The algorithms in Appendix 1 and Appendix 2 to this document show how these rules work in
an analysis plan, to develop the categories 1 [Low], 2 [Moderate], and 3
[High] levels of activity.
IPAQ Research Committee
November 2005
Page 161
Revised November2005 13
APPENDIX 1
At A Glance
IPAQ Scoring Protocol (Short Forms)
Continuous Score
Expressed as MET-min per week: MET level x minutes of activity/day x days per week
Sample Calculation
MET levels MET-minutes/week for 30 min/day, 5 days
Walking = 3.3 METs 3.3*30*5 = 495 MET-minutes/week Moderate Intensity
= 4.0 METs 4.0*30*5 = 600 MET-minutes/week Vigorous Intensity = 8.0 METs
8.0*30*5 = 1,200 MET-minutes/week
TOTAL = 2,295 MET-minutes/week
Total MET-minutes/week = Walk (METs*min*days) + Mod (METs*min*days) + Vig
(METs*min*days)
Categorical Score- three levels of physical activity are proposed
1. Low
• No activity is reported OR
• Some activity is reported but not enough to meet Categories 2 or 3.
2. Moderate
Either of the following 3 criteria
• 3 or more days of vigorous activity of at least 20 minutes per day OR
• 5 or more days of moderate-intensity activity and/or walking of at least 30 minutes per day OR
• 5 or more days of any combination of walking, moderate-intensity or vigorous- intensity
activities achieving a minimum of at least 600 MET-minutes/week.
3. High
Any one of the following 2 criteria
• Vigorous-intensity activity on at least 3 days and accumulating at least 1500
MET-minutes/week OR
• 7 or more days of any combination of walking, moderate- or vigorous-intensity activities
accumulating at least 3000 MET-minutes/week
Please review the full document “Guidelines for the data processing and analysis of the International Physical
Activity Questionnaire” for more detailed description of IPAQ analysis and recommendations for data cleaning
and processing [www.ipaq.ki.se].
Page 162
Revised November2005 14
APPENDIX 2
At A Glance
IPAQ Scoring Protocol (Long Forms)
Continuous Score
Expressed as MET-minutes per week: MET level x minutes of activity/day x days per week
Sample Calculation
MET levels MET-minutes/week for 30 min/day, 5 days
Walking at work= 3.3 METs 3.3*30*5 = 495 MET-minutes/week Cycling for
transportation= 6.0 METs 6.0*30*5 = 900 MET-minutes/week Moderate yard work= 4.0
METs 4.0*30*5 = 600 MET-minutes/week Vigorous intensity in leisure= 8.0 METs
8.0*30*5 = 1,200 MET-minutes/week
TOTAL = 3,195 MET-minutes/week
Domain Sub Scores
Total MET-minutes/week at work = Walk (METs*min*days) + Mod (METs*min*days) + Vig
(METs*min*days) at work
Total MET-minutes/week for transportation = Walk (METs*min*days) + Cycle
(METs*min*days) for transportation
Total MET-minutes/week from domestic and garden = Vig (METs*min*days) yard work + Mod
(METs*min*days) yard work + Mod (METs*min*days) inside chores
Total MET-minutes/week in leisure-time = Walk (METs*min*days) + Mod (METs*min*days)
+ Vig (METs*min*days) in leisure-time
Walking, Moderate-Intensity and Vigorous-Intensity Sub Scores
Total Walking MET-minutes/week = Walk MET-minutes/week (at Work + for Transport + in
Leisure)
Total Moderate MET-minutes/week = Cycle MET-minutes/week for Transport + Mod MET- minutes/week
(Work + Yard chores + Inside chores + Leisure) + Vigorous Yard chores MET- minutes
Note: The above is a total moderate activities only score. If you require a total of all moderate-intensity physical
activities you would sum Total Walking and Total Moderate
Total Vigorous MET-minutes/week = Vig MET-minutes/week (at Work + in Leisure) Total Physical
Activity Score
Total Physical Activity MET-minutes/week = Walking MET-minutes/week + Moderate MET- minutes/week +
Total Vigorous MET-minutes/week
Continued………..
Page 163
Also
Total Physical Activity MET-minutes/week = Total MET-minutes/week (at Work + for
Transport + in Chores + in Leisure)
Categorical Score- three levels of physical activity are proposed
1. Low
No activity is reported OR
a. Some activity is reported but not enough to meet Categories 2 or 3.
2. Moderate
Either of the following 3 criteria
a. 3 or more days of vigorous-intensity activity of at least 20 minutes per day OR
b. 5 or more days of moderate-intensity activity and/or walking of at least 30 minutes per day
OR
c. 5 or more days of any combination of walking, moderate-intensity or vigorous- intensity
activities achieving a minimum of at least 600 MET-min/week.
3. High
Any one of the following 2 criteria
• Vigorous-intensity activity on at least 3 days and accumulating at least 1500
MET-minutes/week OR
• 7 or more days of any combination of walking, moderate- or vigorous- intensity activities
accumulating at least 3000 MET-minutes/week Please review the full document “Guidelines for the data processing and analysis of the International Physical
Activity Questionnaire” for more detailed description of IPAQ analysis and recommendations for data cleaning and
processing [www.ipaq.ki.se].
Page 164
Appendix D
The range levels of Blood parameters
Blood Parameter SI Units
(International system)
Traditional Units
(USA)
Glucose 3.3 – 5.8 mmol/L 59 – 105 mg/dL
Insulin 36 – 179 pmol/L 5 – 25 µU/L
Glucagon 50 – 200 ng/L 50 200 pg/mL
Cortisol Time: am
Time: pm
nmol/L 110 – 607
83 – 469
µg/dl 5 – 25
3.1 – 16.7
Albumin 35 – 50 g/L 3.5 – 5.0 g/dL
Total Protein 60 – 80 g/L 6.0 – 8.0 g/dL
Total Cholesterol Desirable
Borderline
high
mmol/L
›5.2
5.3 – 6.2
‹ 6.2
› 200
201- 239
‹ 240
Triglycerides Desirable
Borderline
high
mmol/L
›5.2
5.3 – 6.2
‹ 6.2
mg/dL
› 150
150- 199
‹ 199
Low density lipoprotein (LDL) Desirable
Borderline
high
mmol/L
›5.2
5.3 – 6.2
‹ 6.2
mg/dL
› 130
130 – 159
‹ 195
High density lipoprotein (HDL) Desirable
Borderline
high
mmol/L
›5.2
5.3 – 6.2
‹ 6.2
mg/dL
› 130
130 – 159
‹ 195
Very low density lipoprotein 0.128 – 0.645 mmol/L 5 – 40 mg/dL