BY CHRIS M. WOOD1, R. G. BOUTILIER2* AND D. J. RANDALL2
Centre de I'Environnement d'Opunohu MNHM-EPHE, He de Moorea, BP 12,Moorea, Polynesie Frangaise, lj ^Department of Biology, McMaster University,
Hamilton, Ontario, Canada L8S 4K1 and 2Department of Zoology, University ofBritish Columbia, Vancouver, BC, Canada V6T2A9
Accepted 26 June 1986
SUMMARY
Air-breathing Cardisoma carnifex, collected in Moorea, French Polynesia, wereheld in fresh water similar in chemical composition to that in their burrows. Undercontrol conditions, which allowed branchial chamber flushing but not ventilation ofthe medium, crabs demonstrated net Na+ and Cl~ uptake, and ammonia, urea andbase excretion (= acidic equivalent uptake). Throughout 192 h of water deprivation,crabs dehydrated slowly at a rate of 0-55gH2Okg~1 h"1, eventually reaching a nearlethal 18% loss of total body water. Increases in haemolymph osmolytes were quitevariable (0-29%); electrolyte excretion was negligible. MQ2 and MCOz bothdecreased by approximately 55%, maintaining an unusually low gas exchange ratio(R = 0-53), and suggesting general metabolic depression. There was no evidence ofinternal hypoxia as haemolymph lactate remained at hydrated levels and Pao2
actually increased. The dominant acid-base response was a progressive metabolicalkalosis accompanied by a partially compensating rise in Paco2- Alkalosis wasprobably caused by blockage of the normal aquatic excretion of base produced by themetabolism of this herbivore. Other possible causes were eliminated: i.e. alkalaemiadue to contraction of the ECFV; entrainment via strong ion shifts; CaCO3
mobilization; and ammonia accumulation in the haemolymph. In the absence ofwater, net ammonia production and excretion both appeared to cease, and alternateend products (urea, uric acid) did not generally accumulate. Within 2h of re-hydration, crabs regained more than half the lost water, MOl and MCo increasedabove control levels, and ammonia excretion and haemolymph concentration bothexhibited a prolonged (56 h) 4- to 6-fold rise. At the same time, metabolic alkalosiswas reversed in association with elevated net base excretion into the water; thelatter was correlated with an increase in the strong ion difference (SID) flux
+ + Ca 2 + +Mg 2 + -Cr ] ) .
•Present address: Department of Biology, Dalhousie University, Halifax, Nova Scotia, CanadaB3H 4J1.
f Address for reprint requests.
Key words: dehydration, land crab, acid-base, respiration, ionoregulation, nitrogenous wastes.
272 C. M. WOOD, R. G. BOUTILIER AND D. J. RANDALL
INTRODUCTION
Dehydration is thought to be the single most important factor limiting the successof decapod crustaceans on land (Powers & Bliss, 1983). There exist numerousstudies on the effects of dehydration on osmotic and ionic balance in terrestrial crabs(for reviews, see Bliss, 1968, 1979; Mantel, 1979; Mantel & Farmer, 1983) but itsconsequences for respiration, blood gas transport and acid-base balance havereceived scant attention. Notable exceptions are studies by Gross (1955) onPachygrapsus, MacMillen & Greenaway (1978) on Holthuisana and Burggren &McMahon (1981) and Wheatly, Burggren & McMahon (1984) on Coenobita, Birgusand Cardisoma. The goal of the present study was to extend these observations withparticular reference to interactions between gas exchange, electrolyte balance,acid—base status and nitrogen metabolism during dehydration stress, for theseprocesses are all inter-related (Stewart, 1978; Atkinson & Camien, 1982; Hochachka& Somero, 1984).
The terrestrial gecarcinid Cardisoma carnifex was chosen for study because itsbasic physiology has been well characterized as a result of the Alpha Helix expeditionto the Palau Islands (see Cameron, 1981a for overview). Aerial gas-exchange occursvia a complex 'lung'/gill apparatus enclosed within large branchial chambers whichare ventilated by forward scaphognathite pumping (Wood & Randall, 1981a.fr). Thegills are also putative sites of ion, acid-base and nitrogenous waste exchange(Randall & Wood, 1981; Towle, 1981) and are normally bathed in water carried atthe base of the chambers during terrestrial excursions. When an external pool isprovided, the branchial chamber water is changed every few minutes. This habitmakes C. carnifex especially amenable to flux studies, for exchange rates of varioussubstances between the whole crab and its environment can be determined byperiodic analysis of a closed external pool.
Recently, we have studied a population of C. carnifex in the wild in Moorea,French Polynesia (Wood & Boutilier, 1985). Dehydrated, apparently distressed,crabs were occasionally seen above ground during the daytime. However, despitetheir evolutionary origin in sea water, the crabs usually retreat to burrows containingfresh water during the heat of the day, apparently to avoid such dehydration. Thecrabs are essentially in osmotic and ionic 'equilibrium' with this fresh water whencaught foraging above ground at night. Ammonia is the major nitrogenous waste,and uric acid production appears negligible. The present investigation focused on thefollowing questions.
(1) Does O2 consumption decline during dehydration (cf. Gross, 1955; Mac-Millen & Greenaway, 1978)? Is CO2 excretion similarly affected? Branchial water isprobably a significant route of CO2 excretion in C. carnifex, and the overall gasexchange ratio in hydrated animals is curiously low (R = 0-5—0-6), perhaps indi-cating the fixation of respiratory CO2 as carbonate deposition in the exoskeleton(Wood & Randall, 1981a; Randall & Wood, 1981; Cameron & Wood, 1985).
(2) If O2 consumption is depressed, is there an accompanying internal hypoxia?Lactic acid accumulation could explain the metabolic acidosis observed in desiccated
Dehydration stress in the land crab 273
crabs by Burggren & McMahon (1981). Alternative explanations include a blockageof the acidic equivalent excretion which must occur if respiratory CO2 is fixed ascarbonate in the carapace (Cameron & Wood, 1985), or an entrainment of acidosisvia strong electrolyte shifts accompanying dehydration, as suggested by Wheatly etal. (1984).
(3) In light of the above, how does haemolymph osmotic and ionic statuschange during dehydration, and is ionic and acidic equivalent exchange with theenvironment altered during rehydration?
(4) As excretion of gaseous ammonia to the atmosphere apparently does notoccur (Wood & Boutilier, 1985), what happens to nitrogenous waste metabolismduring long-term deprivation of water? Internal ammonia accumulation would beexpected to cause alkalosis and toxicity, while conversion to alternative end products(e.g. urea, uric acid) could correct the problem (Atkinson & Camien, 1982).
MATERIALS AND METHODS
Experimental animals
Land crabs (Cardisoma carnifex; 90-330 g) were collected by hand at night within0-5 km of the shore on the island of Moorea, French Polynesia, during July andAugust. In the laboratory (temperature = 24-26°C), they were held communally inlarge plastic tubs containing 1 cm of fresh water (4 1 kg"1), which was changed daily.This fresh water, which was identical to that used in the subsequent experiments,was prepared as a 1% sea water: 99% Moorea tap water (non-chlorinated) mixture.Levels of major electrolytes (in mequivP1) were [Na+]~6-0, [Cl~]~6-0,[Mg2 +]«l-2 , [Ca2+]«0-5, [K+]=0-2, [NH4
+]«0-01, with osmolality«20mosmolkg~1, titration alkalinity (to pH = 4-0) = 1-OmequivP1, and pH = 7-0.This composition was very similar to fresh water found in natural crab burrows inMoorea (Wood & Boutilier, 1985). Approximately 48h prior to the start of ex-periments (4-8 days after capture), the crabs were towel-dried and weighed (to anaccuracy of 0-2g) and the chelipeds were firmly taped closed. This procedure had noapparent ill effect on the crab and was undoubtedly beneficial to the investigators.The larger crabs (252 ± 14g; X ± 1 S.E.M.; N = 9) were assigned to the haemolymphseries in which blood parameters were measured, and were fitted with arterialsampling sites covered with dental dam over the anterior margin of the pericardium,as described by Wood & Randall (198la). The smaller crabs (128 ± 9 g; N = 8) wereassigned to the gas exchange series.
The animals were then transferred to their individual experimental chambers,which were dark polyethylene buckets (22 cm diameter X 25 cm depth) in thehaemolymph series, or blackened sealable respirometer jars (12 cm diameter X 14 cmdepth) in the gas exchange series. The lids were left slightly ajar and heavilyweighted to prevent escape. The chambers were filled with fresh water to a depth of==1 cm (2 lkg"1 in the haemolymph series and 1-2 lkg"1 in the gas exchange series
274 C M . WOOD, R. G. BOUTILIER AND D. J. RANDALL
because of the different vessel dimensions). This depth allowed the crabs todraw water into their branchial chambers through the posterior margins of thebrachiostegites, as described by Wood & Randall (1981a), but not to ventilate it. Thewater in the buckets and jars was renewed at approximately 12-h intervals.
Experimental protocols
The two experimental series were designed to correlate changes in haemolymphgases, ions, acid—base status, nitrogenous wastes and fluxes with the environmentalwater (haemolymph series) with changes in O2 and CO2 exchange (gas exchangeseries) under control conditions, during progressive dehydration and duringsubsequent rehydration. Thus experimental protocols and sampling times werevirtually identical in the two series.
Haemolymph series
After 48 h recovery from handling and surgery, a control flux determination wasperformed: new fresh water was introduced and water samples were taken at 15 min(to allow initial flushing of the branchial chambers) and again after 12 h. Fluxesdetermined in this way represent exchanges across the total body surface (i.e. gills,gut, renal system, etc.), although, as the crabs had been starved in the laboratory,defaecation did not occur. An arterial haemolymph sample (0-5 ml) was removedwith minimal disturbance, the animal was towel-dried, weighed again, and placed ina clean, dry bucket. This point represented time 0, the start of dehydration. Theblood sampling and weighing procedures were repeated at 36-h intervals until 180 h.At 192 h, the crab was weighed again without blood sampling, and the bucket wasthoroughly flushed with exactly 200 ml of distilled water to recover all electrolytesand wastes lost by the animal during 8 days of dehydration. The crab was thenreturned to hydrated conditions (time 0, rehydration) with haemolymph samplesdrawn at 2 and 36h of rehydration. Weights were determined at 2, 36 and 72 h, andflux determinations were performed in the standard fashion over the periods 0—2,2-19, 19-36 and 36-53 h of rehydration.
Gas exchange series
These experiments were designed to measure total (i.e. from both air and water)oxygen consumption (Mo ) and CO2 excretion (MCo ) rates at comparable times tothe blood samples in the first series during the dehydration/rehydration protocol. Asthese determinations took 4—6h, they actually spanned the haemolymph sampletimes of the first series, i.e. control, 33-39, 69-75, 105-111, 141-147 and 177-183 hof dehydration, 0—4 and 33—39 h of rehydration. For each measurement, initial airand water samples (if present) were taken, the respirometer was then sealed and finalair and water samples were drawn after 4-6 h, through appropriate ports. Weightswere determined at 192 h dehydration (by weighing the dry jar and crab) and after
Dehydration stress in the land crab 275
rehydration (by weighing the towel-dried crab) for comparison with the haemo-lymph series.
Analytical techniques
Haemolymph samples were drawn anaerobically into ice-cold, gas-tight Hamiltonsyringes and analysed immediately for pHa, Paco , P^o a nd CaCo using standardRadiometer electrode methodology (Cameron, 1971; Boutilier, Randall, Shelton &Toews, 1978; Wood & Randall, 1981a). Wosthoff pumps provided precision gasmixtures for calibration. Coulometric titration with a Radiometer CMT10chloridometer was used to determine haemolymph [Cl~], and a 100-/U1 sample wasfixed in 200 (A ice-cold 8% perchloric acid for subsequent measurement of lactate.The remainder of the haemolymph sample (including that recovered from theelectrode chambers) was frozen at — 20 °C for transport home, and subsequentdetermination of [Na+], [K+], [Mg2+], [Ca2+], osmolality, total protein, totalammonia, urea, uric acid and glucose. In our experience, freezing does not ap-preciably affect these parameters in crab blood. Clots were removed by centri-fugation prior to analysis.
Air and water samples from the gas exchange series were analysed for PQ and Pcousing the same Radiometer electrode system. The total CO2 content of water sampleswas determined by a modification of the Cameron (1971) technique in whichstronger acid (0-1 moll"1 HC1), a larger sample (200[A) and a more dilute standard(SmmolP1 NaHCO3) were employed to enhance sensitivity. Water from the fluxexperiments was analysed immediately for titratable alkalinity by titration of air-equilibrated samples to pH = 4-00 with 0-02 mol P 1 HC1 as described by McDonald& Wood (1981). The remainder of the sample was frozen for later determination of[Na+], [CP], [K+], [Mg2+], [Ca2+], total ammonia, urea and uric acid.
[Na+] and [K+] were measured by flame photometry (Eel Mk II or RadiometerFLM3), osmolality was measured by vapour pressure osmometry (Wescor 5100B),[Cl~] by coulometric titration (Radiometer CMT 10 or Buchler Cotlove 4-2000,the latter for a few very dilute water samples), [Mg2+] by atomic absorptionspectrophotometry (Varian 1275AA) and [Ca2+] either by atomic absorption (watersamples) or by colourimetric reaction with o-cresolphthalein complexone usingSigma (1981a) reagents (haemolymph samples). The two [Ca2+] techniques werecross-validated. Micro-modifications of commercial diagnostic kits were used for thespectrophotometric assay of lactate (lactic dehydrogenase/NADH method; Sigma,1977), glucose (o-toluidine method; Sigma, 1980), urea (diacetylmonoxine method;Sigma, 19816), uric acid (uricase/phosphotungstate method; Sigma, 1981c), hae-molymph total protein (Lowry method, Sigma, 1982a) and haemolymph totalammonia (L-glutamic dehydrogenase/NAD method; Sigma, 19826). Total ammoniain water was determined by a micro-modification of the salicylate hypochloritemethod of Verdouw, van Echteld & Dekkers (1978). Different ammonia assays wereused for water and haemolymph as the simpler salicylate hypochlorite method gavespurious values for haemolymph; the two assays were cross-validated on watersamples.
276 C M . WOOD, R. G. BOUTILIER AND D. J. RANDALL
Calculations
Haemolymph [HCC>3~] was calculated as CaCo ~(*CO2XPaco) usingat the appropriate temperature and haemolymph ionic strength from Truchot(1976). Operational pK' values (combining HCO3~ and CO32~) for constructionof [HCO3~]a vs pHa diagrams (e.g. Fig. 5) were calculated using the Henderson—Hasselbalch equation. The change in the concentration of acidic/basic equivalents inthe haemolymph was calculated as:
AHjT = [HCO3-]i - [HCO3-]f + /S(pHi-pHf), (1)
where i and f refer to initial and final values and /? is the slope of the haemolymphnon-bicarbonate buffer line, taken as 12-lslykes for C. carnifex from Wood &Randall (19816). /? is a function of total protein (mainly haemocyanin) concen-tration, and as this exhibited only small changes during the present experiments (seeFig. 7), the error introduced by assuming a constant value of /3 is negligible. O2
saturation of the haemolymph was estimated from measured values of Pao and pHaand a family of haemocyanin O2 dissociation curves at different pH values forC. carnifex (W. W. Burggren & B. R. McMahon, personal communication; Wood &Randall, 19816).
Net flux rates (Jnet) of each substance (e.g. X) between the crab and the externalwater pool were calculated as:
_ ( [ X ] , - [ X ] f ) x VJnet t X W ' ( >
where i and f refer to initial and final concentrations (in //equivml"1 or jV is the volume of the external water pool (in ml), t is the elapsed time (in h) and W isthe body weight (in kg). Thus net losses by the animal have a negative sign, net gainsa positive sign. By reversing the i and f terms, the net titratable acidity flux wascalculated from the titratable alkalinities. The sum of titratable acidity and ammoniafluxes gave the net flux of acidic equivalents (J^t! Maetz, 1973).
Rates of O2 consumption (Mo ) were calculated as the sums of the rates from theair and water phases (if present). For each, an equation analogous to equation 2 wasused, with the O2 concentration calculated as the product of the measured Po andthe tabulated capacitance coefficient for the appropriate medium at the experimentaltemperature (Dejours, 1975). A similar approach was used for M c o , but here theCO2 concentrations in water were measured directly, as the CO2 capacitance of freshwater is not necessarily a constant (Dejours, 1975).
Data have been expressed as means ± 1 S.E.M., unless otherwise stated. Thesignificance (PsSO-05) of differences between means was assessed with a pairedStudent's two-tailed t-test, using each animal as its own control. One crab in thehaemolymph series escaped after 108 h dehydration and was never seen again, whileone in the gas exchange series died at 180 h, apparently from desiccation. Up untilthese times, the two crabs followed the general trends of the other animals, but theirdata have been omitted from means in view of the paired statistical design.
Dehydration stress in the land crab 111
1
+ 30
0
- 3 0
-60
120
150
Control
-
V*
1
Dehydration
* \
* >
/I*
*
I*1
Rehydration
A*
36 72 108
Time (h)
144 180 2 36 72
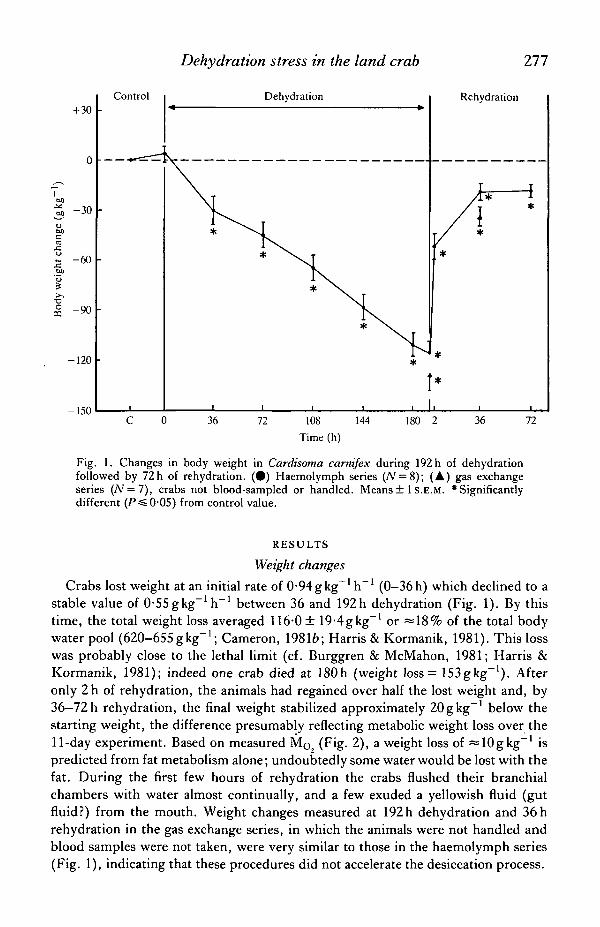
Fig. 1. Changes in body weight in Cardisoma carnifex during 192 h of dehydrationfollowed by 72h of rehydration. (•) Haemolymph series (iV = 8); (A) gas exchangeseries (N = 7), crabs not blood-sampled or handled. Means ± 1 S.E.M. 'Significantlydifferent (P^O-05) from control value.
RESULTS
Weight changesCrabs lost weight at an initial rate of 0-94gkg-1 h"1 (0-36h) which declined to a
stable value of O-SSgkg^'h"1 between 36 and 192h dehydration (Fig. 1). By thistime, the total weight loss averaged 116-0 ± 19-4gkg~' or =18% of the total bodywater pool (620-655gkg""1; Cameron, 19816; Harris & Kormanik, 1981). This losswas probably close to the lethal limit (cf. Burggren & McMahon, 1981; Harris &Kormanik, 1981); indeed one crab died at 180h (weight loss = 153gkg~'). Afteronly 2h of rehydration, the animals had regained over half the lost weight and, by36—72 h rehydration, the final weight stabilized approximately 20gkg- 1 below thestarting weight, the difference presumably reflecting metabolic weight loss over the11-day experiment. Based on measured Mo (Fig. 2), a weight loss of ^lOgkg"1 ispredicted from fat metabolism alone; undoubtedly some water would be lost with thefat. During the first few hours of rehydration the crabs flushed their branchialchambers with water almost continually, and a few exuded a yellowish fluid (gutfluid?) from the mouth. Weight changes measured at 192h dehydration and 36 hrehydration in the gas exchange series, in which the animals were not handled andblood samples were not taken, were very similar to those in the haemolymph series(Fig. 1), indicating that these procedures did not accelerate the desiccation process.
278 C M . WOOD, R. G. BOUTILIER AND D. J. RANDALL
Gas exchange
Under hydrated control conditions, MQ and Mco were only about half those in aprevious study (Wood & Randall, 1981a), possibly reflecting metabolism nearer thebasal value (i.e. nearer resting conditions) or the use of fresh water rather than 50%sea water in the present investigation. However, the gas exchange ratio (R = 0-53)was again unusually low (Fig. 2). Dehydration caused marked reductions (=55 %) in
1c
£iOO
•3
0
min
'
kg"
0
a.
Ou
30
24
18
12
6
0
24
18
12
6
U
0-75
0-50
0-25
0
Control
A
- I1
B
-
•
•
C
-
-
-
1
\ v*
*
— j -*
*
1
Dehydration
*
*
A
1
1
-4- -*
—J
I—1
11*
Rehydration
\ r. . . . , , T -
[ ^
1
36 72 108
Time (h)
144 180 2 36
Fig. 2. Changes in (A) total O2 consumption rate (Mo2); (B) total CO2 excretionrate (Mco2) i
a n d (C) the gas exchange ratio R ^ C O Z / M Q J ) in Cardisoma carnifex during192h of dehydration (18% loss of body water) followed by 36h of rehydration.M e a n s ! ls.E.M. (JV = 7). * Significantly different (P^O-OS) from control value.
Dehydration stress in the land crab 279
both MQ2 and MCo2 which were established by 36 h and stable by 108 h. Within 2 h ofrehydration, Mo and M c o increased significantly to levels above the original controlwith a return to normal by 36 h. Throughout the experiment, Mo and MCo changedproportionately, so R did not vary significantly. The crabs remained generallymotionless during both the control and dehydration periods, so we do not think thatthe reduction in metabolism was due to a reduction in overt activity. However, uponrehydration, the crabs clearly became more active, so this may well explain the surgeof metabolism above the control level at this time. Our respirometry system did notprevent gas equilibration between air and water phases; nevertheless it is interestingthat while the fraction of Mo derived from water measurements was negligible(=2%), the comparable aquatic fraction of M c o was both large and highly variable( -50% to +65 % of the total).
There was no evidence that the fall in MQ during dehydration caused internalhypoxia. Haemolymph lactate levels remained very low and stable (Fig. 3B), whilePao actually increased (Fig. 3A). In view of the relatively high O2 affinity ofC. carnifex haemocyanin (Ps0 = 13-5 Torr under these conditions; W. W. Burggren& B. R. McMahon, personal communication; Wood & Randall, 19816), thesechanges in Pao had minimal influence on arterial saturation which remained at90-100%. Blood glucose levels fell significantly at 36h, recovered, and then fellagain at 180h, but returned to normal during rehydration (Fig. 3C).
Haemolymph acid—base status
Haemolymph acid-base status during dehydration was characterized by alkalosis;pHa stabilized 0-05-0-1 units above the control level during the entire periodof water deprivation (Fig. 4C). However, first CaCo (Fig. 4A) and later PaCo(Fig. 4B) progressively increased during dehydration. The initial effect (0-36 h) wasa straight metabolic alkalosis with HCC>3~ accumulation at constant Paco (Fig. 5).Thereafter, there occurred a partial respiratory compensation (Paco build-up) of anincreasing metabolic alkalosis. By 180 h, the haemolymph [HCO3~] had reached= 28-5mequivl~1, a value approximately 70% above control, reflecting a AHjt of—13-1 mequivP1 (i.e. basic equivalent accumulation). Assuming an extracellularfluid volume (ECFV) of 195 ml kg"1 in C. carnifex (Kormanik & Harris, 1981;Harris & Kormanik, 1981), the total basic equivalent load in the haemolymph wasZSSS^uequivkg"1. By 36 h rehydration, virtually all of this base load has beenremoved from the haemolymph; pHa and Caco2 returned to normal although Paco2
remained slightly elevated (Figs 4, 5).
Haemolymph ionic status
Haemolymph [Na+], [Cl~], [Mg2+], [K+], total protein concentration (mainlyhaemocyanin) and osmolality all increased significantly during dehydration, and allexcept [K+] returned to normal during rehydration (Figs 6, 7). The fall in proteinlevel below control during rehydration presumably reflected sampling losses orstarvation (Fig. 7B). Most increases in osmolytes during dehydration were in therange 8-15%, far smaller than the observed 70% rise in haemolymph [HCO3~].
280 C M . WOOD, R. G. BOUTILIER AND D. J. RANDALL
100
75
50
25
0
3
O
3
0-4
0-3
S 0-2
0-1
Control Dehydration Rehydration
36 72 108
Time (h)
144 180 2 36
Fig. 3. Changes in (A) arterial haemolymph O2 tension (Pao2); (B) haemolymph lactateconcentration; and (C) haemolymph glucose concentration in Cardisoma carnifex during192h of dehydration (18% loss of body water) followed by 36h of rehydration.Means ± 1 s.E.M. (N = 8). 'Significantly different (P^0-05) from control value.
Furthermore, with the single exception of [Mg2+] (29% increase, Fig. 6D), theseelevations in haemolymph osmolytes, even after taking excretion (Table 2) intoaccount, were smaller than anticipated had the measured 18% water loss beenproportionately distributed between extracellular and intracellular spaces. Indeed,[Cl~] only increased at the final dehydration sample (Fig. 6B) and [Ca2+] showed nosignificant variation throughout the experiment (Fig. 6C). The latter observationtends to rule out CaCO3 mobilization from the carapace (see Wood & Randall,19816) as the cause of the observed haemolymph metabolic alkalosis.
Dehydration stress in the land crab 281
By the strong ion difference concept (Stewart, 1978), the increase in haemolymph[HCC>3~] during metabolic alkalosis should be associated with an increaseddifference between strong cation and strong anion concentrations (SID). This wasindeed the case; the mean SID, here calculated as [Na+ + Ca2+ + Mg2+ +K+ —Cl~ —lactate] increased from 11-SmequivP1 (control) to 26-2mequivl~1
(180h dehydration) and then decreased to 24-8mequivl~1 (36h rehydration).At these same times, mean HCC>3~ levels were 16-6, 28-5 and l 1
40
'= 30 ho
E
ood
(2
20 •
10
20
15
jr> 10
0
7-7
7-6
I 7-5Q.
7-4 •
7-3
Control• A
•
1
B
•
I1' 1
C
I
*TA-
Dehydration
* T
-—{— 1
1 1
* *
T T
^ \ i
^^ *I" I
• i
- 4 -
*T
— t
*
T
*
1
Rehydration
L*
36 72 108
Time (h)
144 180 2 36
Fig. 4. Changes in the components of arterial haemolymph acid-base status inCardisoma carnifex during 192h of dehydration (18% loss of body water) followed by36 h of rehydration. (A) total C02 concentration (Caco2)> (B) CO2 tension (Paco2)>(C) arterial pH (pHa). Means ± 1 S.E.M. (JV = 8). • Significantly different (P^0-05)from control value.
282 C M . WOOD, R. G. BOUTILIER AND D. J. RANDALL
respectively. However, inspection of both mean and individual values indicated thatthe SID changes could not be correlated with changes in any one anion or cation, butrather reflected varying contributions from different ions at different times. The sumof all measured osmolytes (excluding protein) in mmolF1 was very close to themeasured osmotic pressure in mosmol kg~ ; mean ratios (osmolytes/osmotic press-ures) were virtually constant (range 1 -00—1-03) over the experiment, suggesting thatunmeasured substances (e.g. SO4
2~) did not vary greatly.
Nitrogenous wastes
Under control hydrated conditions, ammonia was the major nitrogenous waste inthe haemolymph at a mean level (l*26mmoll~1; Fig. 8A) approximately 10-foldgreater than urea (0-14mmoll~1; Fig. 8B), while uric acid was undetectable(detection limit = 3/imolP1). A single animal exhibited approximately 25-foldgreater urea levels (Table 1) and therefore has been omitted from Fig. 8B. Duringdehydration, haemolymph ammonia doubled at 36 and 72 h, but then returned tonormal for the remainder of the desiccation period (Fig. 8A). However, duringrehydration, there was a very large but variable rise to a mean level greater than
32 28 24 20 18
8
7-7
Fig. 5. Display of arterial haemolymph acid-base status on a pH-HCC>3 diagram inCardisoma carnifex during 192 h of dehydration (18% loss of body water; D) followed by36 h of rehydration (R); C, control. Transverse line represents the non-HCC>3~ bufferline with slope of 12-1 slykes from Wood & Randall (19816). Means ± ls.E.M. (N = 8).
Dehydration stress in the land crab 283
7mmoll ' at 36 h. This pattern of ammonia changes clearly did not explain theobserved metabolic alkalosis in the haemolymph (Figs 4, 5), for during dehydrationammonia returned to normal while basic equivalent accumulation progressed, and
600
400
200
a-
i
400
200
0
24
18
12
6
0
15
10
5
Control
- A
D
- E
36
Dehydration
N a +
Cl"
Ca2+
K+
Rehydration
72 108
Time (h)
144 180 2 36
Fig. 6. Changes in haemolymph ionic status in Cardisoma carnifex during 192 h ofdehydration (18% loss of body water) followed by 36 h of rehydration. (A) Sodium,(B) chloride, (C) calcium, (D) magnesium and (E) potassium. Means ± 1 S.E.M. (iV= 8).•Significantly different (P^-0'05) from control value.
284 C M . WOOD, R. G. BOUTILIER AND D. J. RANDALL
1on
jsm
ol
B>^
olal
EO
f, 1
CD
COJ
oO .
Tot
al
1200
800
400
0
40
2U
n
Control- A
-
i
-
t
B
II
*
i
Dehydration
i;
*T
—i—
*— \ — •
*
i—i
*—i—
*ii
*
i
*ii
Rehydration
*
I 1
I*
c 36 72 108
Time (h)
144 180 2 36
Fig. 7. Changes in (A) haemolymph osmolality and (B) total protein concentration in thehaemolymph in Cardisoma camifex during 192h of dehydration (18% loss of bodywater) followed by 36h of rehydration. Means ± Is.E.M. (iV=8). * Significantlydifferent ( P ^ 0-05) from control value.
later greatly increased during rehydration while basic equivalents were removed fromthe haemolymph. Urea levels varied considerably during the experiment but showedno significant changes overall (Fig. 8B). A single crab, the one with the unusuallyhigh urea levels, exhibited significant uric acid accumulation in the blood duringdehydration and removal during rehydration (Table 1). However even at its peak,uric acid accounted for less than 26% of the total nitrogen relative to the high levelsof ammonia and urea in this animal. Uric acid remained below detection limitsthroughout the experiment in the other eight crabs.
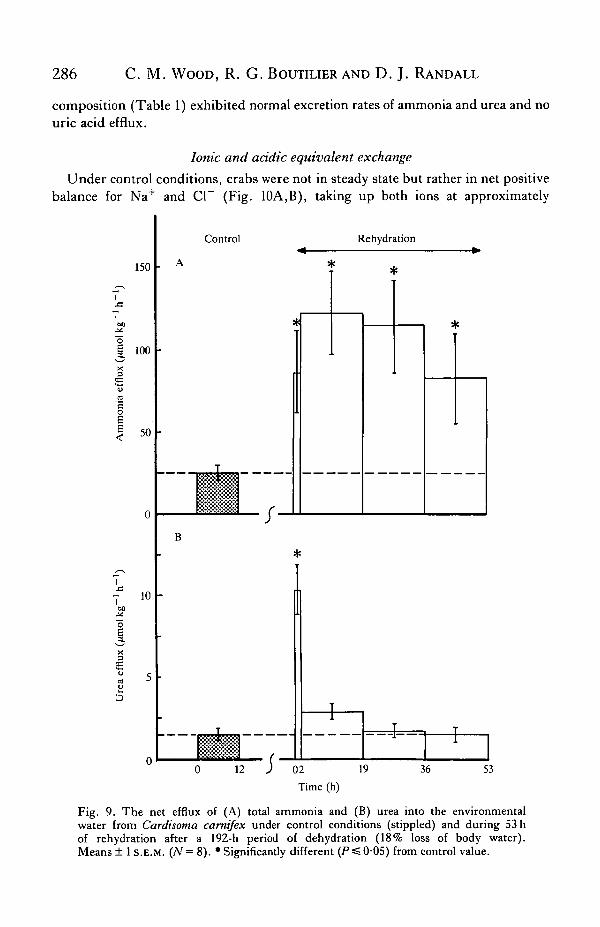
Ammonia was also the major nitrogenous waste excreted into the external waterunder control conditions (Fig. 9A), although a very low urea efflux occurred in allanimals (Fig. 9B). Uric acid excretion was not detected in any crab (detection limitin water = 0'5 /xmol I"1). No attempt was made to check whether ammonia excretionoccurred by direct volatilization to the atmosphere during dehydration in the presentexperiments, though an earlier pilot study indicated that C. carnifex does not carryout this process (Wood & Boutilier, 1985). Washings from the dry bucket after 8 daysdehydration revealed negligible ammonium and no uric acid precipitation, thoughthe accumulated urea in the containers was equivalent to about 12 h excretion of ureaunder control conditions (Table 2). Upon rehydration after 192h desiccation,ammonia efflux exhibited an immediate 3- to 4-fold increase above the relatively low
Dehydration stress in the land crab 285
control level, an effect which persisted for at least 53 h (Fig. 9A). This waspresumably associated with the very high haemolymph ammonia concentrations atthis time (Fig. 8A). Urea excretion also increased markedly, but only during the2-h period immediately following rehydration (Fig. 9B). Again uric acid excretionwas not detected. Rather surprisingly, the crab with the abnormal haemolymph
10
8
6
4
2
0
0-3
0-2
0 1
n
Control
- A
-
-
I1
B
•
-
I1
-
Dehydration
I ]VJ_ 1—
/
i i i i i
Rehydration
*
*s
yi
36 72 108
Time (h)
144 180 2 36
Fig. 8. Changes in the concentrations of (A) total ammonia (N = 8) and (B) urea (TV = 7)in the haemolymph of Cardisoma carnifex during 192 h of dehydration (18 % loss of bodywater) followed by 36 h of rehydration. Means ± 1 S.E.M. * Significantly different(Ps£0-05) from control level.
Table 1. Nitrogenous wastes (\imoll ') in the haemolymph of a single Cardisomacarnifex exhibiting uric acid production during dehydration and rehydration
composition (Table 1) exhibited normal excretion rates of ammonia and urea and nouric acid efflux.
Ionic and acidic equivalent exchange
Under control conditions, crabs were not in steady state but rather in net positivebalance for Na+ and Cl~ (Fig. 10A,B), taking up both ions at approximately
150
1 100
50
10
"5
Control Rehydration
12 02
Time (h)
19 36 53
Fig. 9. The net efflux of (A) total ammonia and (B) urea into the environmentalwater from Cardisoma camifex under control conditions (stippled) and during S3 hof rehydration after a 192-h period of dehydration (18% loss of body water).Means ± 1 S.E.M. (;Y= 8). 'Significantly different (P^0 - 05) from control value.
Dehydration stress in the land crab 287
+400
0
-400
-800
+400
0
-400
-800
0
> -1003
-200
-100
-200
-50
-100
Control Rehydration
. B
HL
-+-T-*-Na + flux
c r flux
• + •
Ca2+ flux
0 12 02 19Time (h)
36 53
Fig. 10. The net fluxes of (A) sodium, (B) chloride, (C) calcium, (D) magnesium and(E) potassium between Cardisoma camifex and its environmental water under controlconditions (stippled) and during 53 h of rehydration after a 192-h period of dehydration(18% loss of body water). Positive fluxes represent uptakes by the crabs, negative valuesrepresent net losses. Means ± ls.E.M. (AT = 8 ) . * Significantly different (P^O-05) fromcontrol value.
288 C. M. WOOD, R. G. BOUTILIER AND D. J. RANDALL
+250//equivkg~I h"1 from the external fresh water, and net negative balance forCa2+ and Mg2+ (Fig. 10C,D), losing both at approximately — 30;uequivkg~1h~1.There was no significant net K+ flux (Fig. 10E). Small amounts of all ions were lostto the dry buckets over 8 days of dehydration (Table 2). These losses were equivalentto haemolymph clearances of approximately 1 ml kg~ for Na+ and CP, 3—5 ml kg~for K+ and Mg2+, and 9 ml kg"1 for Ca2+ (cf. Fig. 6). Nevertheless, this total Ca2+
efflux was negligible (<6%) relative to the accumulated load of basic equivalents^SS^equivkg"1) in the haemolymph during desiccation, again arguing againstCaCO3 mobilization from the carapace as the source of the latter. During the first2 h of rehydration, there were large net losses of all ions into the external medium(Fig. 10), effects which could have resulted from the flushing of highly concentratedfluid or precipitates out of the branchial chambers, gut or renal systems. Over thesubsequent 51 h, net Na+ uptake and Ca loss rates remained at the control levels(Fig. 10A,C). However, net Cl~ uptake and K+ loss rates were stimulated at the2-19h rehydration period (Fig. 10B,E), while Mg2+ losses were significantlyreduced during the 36-53 h period (Fig. 10D).
j " t , calculated as the sum of the titratable acidity (not shown) and ammonia fluxes(Fig. 9A), signs considered, was significantly positive under control conditions(Fig. 11 A); the crabs took up acidic equivalents and/or excreted basic equivalents ata net rate ^120/iequivkg"1 h"1. Upon rehydration, j " e t increased markedly duringthe first 2h and then remained elevated at a level averaging = 160 % of the originalcontrol until 53 h (Fig. 11 A). It should be emphasized that this apparent baseexcretion was in addition to any ammonia efflux which occurred as NH3, for whileNH3 certainly has an alkalinizing influence, its movement is considered neutral withrespect to acid-base balance, both theoretically and in the j " t calculation. Relativeto the control rate, the increased j " e t during 53 h rehydration accounted for anapparent base excretion of 3945 /Jequiv kg~', more than sufficient to explain the
Table 2. Total excretions of nitrogenous wastes and inorganic electrolytes(fjequiv kg~ ) recovered from the containers of Cardisoma carnifex after 192 h
dehydration
AmmoniaUreaUric acidNa+
crK+
Ca2+
Mg2+
Excretion
12-3 ±7-312-7 ±6-1
ND3500 ±91-0454-7 ± 146-5
14-8 ±2-9143-6 ±3-748-4 ±11-7
% of haemolymphcontent*
——
0-540-661-694-542-51
X ± 1 S . E . M . , A T = 8 .•Calculated assuming the control concentration values of Fig. 6 and an ECFV of 195 ml kg"1
(Harris & Kormanik, 1981).ND, not detectable.
Dehydration stress in the land crab
Control Rehydration
289
+600
+400
+200
f -200
- 4 0 0
-600
- 8 0 0
H+flux
SID flux
12 02 19
Time (h)
36 53
Fig. 11. (A) The net fluxes of acidic equivalents (jj^t) and (B) the net strong iondifference (SID) fluxes, here calculated as [Na++K+ + Ca2+ + M g 2 + - C r ] fluxes,between Cardisoma carnifex and its environmental water under control conditions(stippled, cross-hatched) and during S3 h of rehydration after a 192-h period ofdehydration (18% loss of body water). Positive fluxes represent net uptakes by the crabs,negative value represent net losses. Means ± ls.E.M. (iV=8). * Significantly different(Ps=005) from control value.
290 C. M. WOOD, R. G. BOUTILIER AND D. J. RANDALL
observed removal from the haemolymph of approx. 2555/uequivkg"1 basic equiv-alents which had accumulated during dehydration.
Net [Na+ + K+ + Ca2+ + M g 2 + - C r ] flux was calculated as an index of the stronganion minus strong cation, or SID, flux (Stewart, 1978; Fig. 11B). This closelymirrored the changes in j " e t (Fig. 11 A) and was also in good quantitative agreementwith j " e t , except during the first 2h of rehydration. This is in accord with theconstraints of electrical neutrality, and suggests that the fluxes of most quantitativelyimportant electrolytes (except perhaps SO^2") have been accounted for. However,inspection of the data from both individual crabs and the summarized values ofFig. 10 clearly showed that the trends in SID flux reflected varying contributionsfrom different ions at different times. As with haemolymph SID, changes in any oneparticular anion or cation did not predominate.
DISCUSSION
Rate of dehydration
After a slightly higher initial weight loss (0-94 g kg"1 h"1), perhaps reflecting theevaporation of branchial chamber water over the first 36 h, C. camifex dehydrated atonly a very slow rate (0-55 gkg~' h~') during continued water deprivation (Fig. 1).This may be compared with previously measured rates of l-S-S-Ogkg^'h"1 inthe same species and other gecarcinids (Gross, Lasiewski, Dennis & Rudy, 1966;Bliss, 1968; Herreid, 1969; Harris, 1977; Burggren & McMahon, 1981; Harris &Kormanik, 1981), and 0-65-l-07gkg~1h~1 in terrestrial hermit crabs, where themolluscan shell greatly inhibits water loss (McMahon & Burggren, 1979; Burggren &McMahon, 1981; Wheatly et al. 1984). The low rates seen here probably reflectedthe different experimental conditions of the present investigation; relative humidity,while not assayed, was undoubtedly greater than 90% in the covered containers (vs25-90% in other studies), convection currents were virtually non-existent, anddisturbance to the animals was minimal except at times of weighing. The crabsotherwise remained almost motionless in their containers throughout dehydration.Upon rehydration, restoration of lost water was very rapid (Fig. 1), in accord withprevious studies, and the animals became more active. These experimentalconditions may duplicate those in the deep, blind-ended burrows (Wood & Boutilier,1985), when the water table rises and falls during periods of rain and drought.However, we cannot prove that this is the case, as the only dry burrow which wefound was apparently disused.
Gas exchange and metabolism
The sustained 55 % decrease in Mo2 throughout dehydration (Fig. 2A) is similar tothat seen in the intertidal crab Pachygrapsus (Gross, 1955) and the 'fresh water' landcrab Holthuisana (MacMillen & Greenaway, 1978). At least in Cardisoma, thisreduction in M o did not cause internal hypoxia (Fig. 3) nor did it lead to a change inthe respiratory quotient of the animal, as Mco w a s similarly depressed (Fig. 2B).These data, taken together with our measurement of a marked decline in branchial
Dehydration stress in the land crab 291
chamber ventilation during dehydration (R. G. Boutilier & C. M. Wood, inpreparation), are a general indication of a depression in metabolic rate. In accordwith MacMillen & Greenaway (1978), we interpret this as a water- and energy-conserving mechanism allowing the animals to withstand prolonged periods ofdrought in their burrows.
The gas exchange ratio, R, remained unusually low (0-5—0-6; Fig. 2C) butconstant during dehydration, indicating that the presence of branchial water was notobligatory for CO2 excretion, at least at the reduced levels of CO2 productionoccurring at this time. Although some CO2 retention in the haemolymph (associatedwith metabolic alkalosis, Fig. 4A) did occur during dehydration, this amounted toonly approx. 3 % of the total MCo over the 8-day desiccation period. Certainly, therespiratory exchange quotient was lower than that usually considered to be thetheoretical minimum for standard aerobic respiration. Ideas about the underlyingmetabolic processes are developed below. Such processes must also have been ineffect throughout dehydration since R values remained at these unusually low levelsthroughout the dehydration period.
Acid-base regulation
In contrast to previous studies on C. carnifex and other land crabs, where theanimals developed combined metabolic and respiratory acidoses during dehydration(Burggren & McMahon, 1981; Wheatly et al. 1984), our animals exhibited a smallincrease in blood pH which thereafter remained relatively stable (Figs 4, 5). Thedifferences between this and other studies were probably related to the much slowerrate of dehydration which allowed our animals to better regulate ECFV andcomposition (see below) and thereby minimize disturbances in blood gas transportand acid-base regulation. The primary response was a progressively developingmetabolic alkalosis (accumulation of basic equivalents) followed by a partiallycompensating respiratory acidosis (Paco build-up) (Figs 4, 5). While the Pacoretention is explained by the observed hypoventilation during dehydration (R. G.Boutilier & C. M. Wood, in preparation), the cause of the metabolic alkalosis is lesscertain. Nevertheless, the present data rule out several possibilities. These include:decrease of ECFV resulting in HCO3"" elevation by haemoconcentration ('con-traction alkalaemia', Hills, 1973) (compare Fig. 5 with Figs 6 and 7); CaCO3
mobilization from the carapace (Fig. 6C; Table 2); entrainment by disturbances ofone particular strong anion or cation (Figs 6, 10); and ammonia accumulation in thehaemolymph (Fig. 8A). We can, however, put forward one reasonable explanationon the basis of our data. Under control hydrated conditions, C. carnifex exhibited asignificantly positive j j ^ with the environmental water (Fig. 11A). This uptake ofacidic equivalents (and/or excretion of basic equivalents) was presumably blocked bydehydration. If we assume that, like Mo and MCo (Fig- 2), the metabolic processwhich necessitates positive j " e t continued during dehydration at 45 % of the controlrate, then approx. 9500^equivkg~1 of basic equivalents would have been ac-cumulated by 180h. The estimated haemolymph load was ZSSS^iequivkg"1 at thistime. The difference could well have been stored in the much larger intracellular
292 C. M. WOOD, R. G. BOUTILIER AND D. J. RANDALL
fluid volume (ICFV) (Cameron, 19816) or carapace compartments; the latterrepresents a massive sink for basic equivalents (Wood & Cameron, 1985; Cameron &Wood, 1985). Indeed, the elevated j " e t during rehydration was more than enough toexplain the correction of haemolymph acid-base status over this period. Anadvantage of this metabolic base accumulation during desiccation would be toneutralize respiratory acidosis, for the burrows in which the animals would probablyundergo dehydration in the wild are markedly hypercapnic (Pico ~ 16Torr; Wood& Boutilier, 1985). We suggest that the cause of continuing metabolic baseproduction and excretion may in some way be related to the herbivorous feedingstrategy of C. carnifex, for the metabolism of most herbivorous diets is strongly baseproducing (Hills, 1973; Atkinson & Camien, 1982). Unfortunately, it is not clearwhether this process would continue for the starvation period employed in thepresent experiments.
These acid-base data certainly do not support an earlier hypothesis (Wood &Randall, 1981a; Randall & Wood, 1981) that the unusually low R value of C.carnifex results from fixation of some respiratory CO2 for carapace growth. Thisscheme would necessitate the excretion of two hydrogen ions for every CO2 stored asCC>32~ (Cameron & Wood, 1985), rather than the observed uptake of H+. Additionalevidence against the previous idea includes the persistent negative calcium balancethroughout the experiment (Fig. IOC), and the fact that carapace mineralization isprobably not a continuous process, but rather occurs rapidly in the post-moult stageonly (Greenaway, 1985). Having discounted this hypothesis, we are unfortunately ata loss to explain either the abnormally low R value, or the apparent persistence ofmetabolic base production in the absence of feeding. Further metabolic studies areclearly required.
Ionoregulation
While Na+ and Cl~ levels in the haemolymph were approximately normal, Ca2+,Mg2+ and K+ concentrations were 20-50 % below 'field' values, presumably becauseof the week's holding period in fresh water plus starvation prior to experimentation(Wood & Boutilier, 1985).
The concentrations of most haemolymph osmolytes (Figs 6, 7) increased less thanthe 18% loss of body water, suggesting preferential regulation of the extracellularfluid during dehydration. This is in agreement with Harris & Kormanik (1981), whofound similar [Na+], [Cl~] and osmotic pressure changes in C. carnifex andGecarcoidea lalandii dehydrated to the same extent. They also showed, by directmeasurement, that the ECFV was maintained constant. In contrast, Burggren &McMahon (1981) reported 25—75% increases in haemolymph osmolytes in the sametwo species dehydrated to the same weight loss. Again, this probably reflectsdifferences in the rate of dehydration and/or experimental conditions between thestudies.
When kept on sand dampened with 80 % sea water, C. carnifex produced urine atapprox. l-Smlkg^'h"1 (Kormanik & Harris, 1981). Urine production was probablyeven higher under the freshwater hydration conditions of the present study. Had this
Dehydration stress in the land crab 293
rate of urine excretion continued during water deprivation, crabs would have lostweight at least 2-5-fold faster than observed (Fig. 1). Furthermore, the observedlosses of electrolytes to the dry containers amounted to total haemolymph clearancesof only 1-9 ml kg"1 over 192 h (Table 2). Clearly either the urine was reabsorbed(e.g. via mouth or branchial chambers; cf. Wolcott & Wolcott, 1985), or urineproduction greatly decreased during dehydration. In Gecarcinus lateralis, Harris(1977) has presented evidence against the former possibility, and in C. carnifex andGecarcoidea lalandii, Harris & Kormanik (1981) have shown that inulin clearancefrom the haemolymph ceases during dehydration, supporting the latter idea.
The present flux measurements (Figs 10, 11) are in agreement with our earlierfindings that C. carnifex exhibits positive j " e t under control conditions, shows ex-cellent correlation between j " e t and SID fluxes, is capable of net Na+ and Cl~ uptakefrom fresh water, and is in slightly negative Ca + and Mg balance in the absence offeeding (Wood & Boutilier, 1985). Furthermore, in that study, during rehydrationafter much milder dehydration (48 h, 40gkg~1 water loss), increased net Cl~ uptakesimilarly occurred. This was due to increased unidirectional Cl~ influx, presumablyat the gills; the same explanation may apply in the present study (Fig. 10B).However, mildly dehydrated crabs also showed increased net Na+ uptake and nochange in j " e t ) in contrast to the present animals, differences probably resulting fromthe degree of desiccation and the constraints of electrical neutrality in relation toacid-base exchange.
Nitrogen metabolism
After an initial doubling during the first 72 h of dehydration, haemolymphammonia returned to control levels during continued water deprivation inC. carnifex (Fig. 8A). Negligible ammonium was recovered from the dry containersat the end of the experiment (Table 2), and alternative end products (urea, uric acid;Fig. 8B; Tables 1, 2) were not accumulated or excreted to any great extent. Theprominent uric acid deposits which we had observed in a different population of thisspecies in Palau (Wood & Randall, 1981a; Henry & Cameron, 1981) were never seenin the Moorea animals, before or after dehydration. This must mean either thatammonia excretion was achieved by direct volatilization to the atmosphere or that netammonia production ceased during dehydration. We favour the latter explanationsince in our earlier study, we were unable to detect any volatilization up to 48 hdehydration (Wood & Boutilier, 1985). The MQ2 and MCo2 data (Fig. 2) indicate ageneral metabolic depression, suggesting a decrease in ammoniagenesis. Further-more, the large sustained increases in both the levels of ammonia in the haemolymphand the excretion of ammonia during rehydration (Figs 8A, 9A) suggest thatammonia production was turned on again at this time. Indeed, over 53 h rehydration,the ammonia excretion in excess of control levels (~4310mmolkg~1) was almostsufficient to compensate for the 'missing' ammonia excretion (=4700mmolkg~1)during 192 h of dehydration. Similar changes were seen after mild, 48 h dehydrationin C. carnifex (Wood & Boutilier, 1985). The processes involved in switchingammonia production off and on in land crabs are unknown. However, comparable
294 C M . WOOD, R. G. BOUTILIER AND D. J. RANDALL
effects have been seen in mammalian hibernators and are associated with an ability torecycle nitrogen through urea back into amino acids via micro-organisms in the gut(Hochachka & Somero, 1984); it is therefore interesting that C. carnifex producedand excreted small amounts of urea (Figs 8B, 9B; Table 1).
This is only one of the many aspects of nitrogen metabolism in Cardisoma whichdeserve further investigation. For example, total nitrogenous waste excretion rates inboth C. carnifex and C. guanhumi (Fig. 9A; Home, 1968; Gifford, 1968; Wood &Boutilier, 1985) are less than 20% of those in a herbivorous vertebrate of comparablesize (e.g. the carp, Vellas & Sefarty, 1974). On the other hand, the animal cantolerate very high blood ammonia levels (e.g. 7mmoll~1 during dehydration,Fig. 8A) which would almost certainly be very toxic in vertebrates (Warren, 1958;Hillaby & Randall, 1979). Of more than 30 animals examined in the Mooreapopulation, only one crab showed unequivocal evidence of uric acid production(Table 1), despite the fact that this compound was routinely found in the burrows(Wood & Boutilier, 1985). To further complicate matters, the same species in Palauroutinely exhibited higher levels of uric acid than ammonia in the haemolymph, andno evidence of urea (Henry & Cameron, 1981)! Similar discrepancies occur betweenthe findings of Home (1968) and Gifford (1968) on C. guanhumi. Clearly, thereremains much to learn about nitrogen metabolism in this most clever animal.
Supported by NSERC International Colaborative Research grants to CMW andDJR. RGB was supported by an NSERC Killam postdoctoral fellowship. Drs J. N.Cameron, University of Texas Marine Science Institute, and A. O. D. Willows,Friday Harbor Laboratory, University of Washington, kindly provided analyticalfacilities. We thank the Director, Dr B. Salvat, Manager, Dr G. Vergonzanne, andstaff of Centre de l'Environnement d'Opunohu, Moorea, for their hospitality andassistance. Dr C. E. Booth provided helpful comments on the manuscript. Most ofthe land crabs were returned to their environment.
REFERENCESATKINSON, D. E. & CAMIEN, M. N. (1982). The role of urea synthesis in the removal of metabolic
bicarbonate and the regulation of blood pH. Curr. Topics cell. Reg. 21, 261-302.BLISS, D. E. (1968). Transition from water to land in decapod crustaceans. Am. Zool. 8, 355-392.BLISS, D. E. (1979). From sea to tree: saga of a land crab. Am. Zool. 19, 385-410.BOUTILIER, R. G., RANDALL, D. J., SHELTON, G. & TOEWS, D. P. (1978). Some response
characteristics of CO2 electrodes. Respir. Physiol. 32, 381-388.BURGGREN, W. W. & MCMAHON, B. R. (1981). Hemolymph oxygen transport, acid-base status,
and hydromineral regulation during dehydration in three terrestrial crabs, Cardisoma, Birgus,and Coenobita.J. exp. Zool. 218, 53-64.
CAMERON, J. N. (1971). Rapid method for determination of total carbon dioxide in small bloodsamples. J . appl. Physiol. 31, 632-634.
CAMERON, J. N. (1981a). Brief introduction to the land crabs of the Palau Islands: stages in thetransition to air breathing. J . exp. Zool. 218, 1-5.
CAMERON, J. N. (19816). Acid-base responses to changes in CO2 in two Pacific crabs: the coconutcrab, Birgus latro, and a mangrove crab, Cardisoma carnifex. jf. exp. Zool. 218, 65-73.
Dehydration stress in the land crab 295
CAMERON, J. N. & WOOD, C M . (1985). Apparent H + excretion and CO2 dynamics accompanyingcarapace mineralization in the blue crab (Callinectes sapidus) following moulting. J. exp. Biol.114, 181-196.
DEJOURS, P. (1975). Principles of Comparative Respiratory Physiology. Amsterdam: NorthHolland.
GIFFORD, C. A. (1968). Accumulation of uric acid in the land crab, Cardisoma guanhumi. Am.Zool. 8, 521-528.
GREENAWAY, P. (1985). Calcium balance and moulting in the Crustacea. Biol. Rev. 60, 425-454.GROSS, W. J. (1955). Aspects of osmotic regulation in crabs showing the terrestrial habit. Am. Nat.
89, 205-222.GROSS, W. J., LASIEWSKI, R. C , DENNIS, M. & RUDY, P. J. (1966). Salt and water balance in
selected crabs of Madagascar. Comp. Biochem. Physiol. 17, 641-660.HARRIS, R. R. (1977). Urine production rate and water balance in the terrestrial crabs Gecarcinus
lateralis and Cardisoma guanhumi. J. exp. Biol. 68, 57-67.HARRIS, R. R. & KORMANIK, G. A. (1981). Salt and water balance and antennal gland function in
three Pacific species of terrestrial crab (Gecarcoidea lalandii, Cardisoma carnifex, Birgus latro).II. The effects of dessication. J. exp. Zool. 218, 107-116.
HENRY, R. P. & CAMERON, J. N. (1981). A survey of blood and tissue nitrogen compounds interrestrial decapods of Palau. J. exp. Zool. 218, 83-88.
HERREID, C. F., II (1969). Water loss of crabs from different habitats. Comp. Biochem. Physiol. 28,829-839.
HILLABY, B. A. & RANDALL, D. J. (1979). Acute ammonia toxicity and ammonia excretion inrainbow trout (Salmo gairdneri). J'. Fish Res. Bd Can. 36, 621-629.
HILLS, A. G. (1973). Acid-Base Balance - Chemistry, Physiology, Pathophysiology. Baltimore:The Williams & Wilkens Co.
HOCHACHKA, P. W. & SOMERO, G. N. (1984). Biochemical Adaptation. Princeton, NJ: PrincetonUniversity Press.
HoRNE, F. R. (1968). Nitrogen excretion in Crustacea. I. The herbivorous land crab Cardisomaguanhumi Latreille. Comp. Biochem. Physiol. 26, 687-695.
KORMANIK, G. A. & HARRIS, R. R. (1981). Salt and water balance and antennal gland function inthree Pacific species of terrestrial crab {Gecarcoidea lalandii, Cardisoma carnifex, Birgus latro).I. Urine production and salt exchanges in hydrated crabs. J. exp. Zool. 218, 97-105.
MCDONALD, D. G. & WOOD, C. M. (1981). Branchial and renal acid and ion fluxes in the rainbowtrout, Salmo gairdneri, at low environmental pH. J. exp. Biol. 93, 101-118.
McMAHON, B. R. & BURGGREN, W. W. (1979). Respiration and adaptation to the terrestrialhabitat in the land hermit crab Coenobita clypeatus.j. exp. Biol. 79, 265-281.
MACMILLEN, R. E. & GREENAWAY, P. (1978). Adjustments of energy and water metabolism todrought in an Australian arid-zone crab. Physiol. Zool. 51, 230-240.
MAETZ, J. (1973). Na + /NH 4+ , N a + / H + exchanges and NH3 movement across the gill of
Carassius auratus.J. exp. Biol. 58, 255-275.MANTEL, L. H. (1979). Terrestrial invertebrates other than insects. In Comparative Physiology of
Osmoregulation in Animals, vol. 1 (ed. G. M. O. Maloiy), pp. 175-218. New York: AcademicPress.
MANTEL, L. H. & FARMER, L. L. (1983). Osmotic and ionic regulation. In The Biology ofCrustacea, vol. 5 (ed. D. E. Bliss), pp. 53-161. New York: Academic Press.
POWERS, L. W. & BLISS, D. E. (1983). Terrestrial adaptations. In The Biology of Crustacea,vol. 8 (ed. D. E. Bliss), pp. 271-333. New York: Academic Press.
RANDALL, D. J. & WOOD, C. M. (1981). Carbon dioxide excretion in the land crab (Cardisomacarnifex). J. exp. Zool. 218, 37-44.
SIGMA (1977). The quantitative determination of pyruvic acid and lactic acid in whole blood at340 nm. Sigma Technical Bulletin 726-UV and 826-UV, Sigma Chemical Co., St Louis.
SIGMA (1980). The colorimetric determination of glucose in whole blood, plasma, or serum at620-650 nm. Sigma Technical Bulletin 635, Sigma Chemical Co., St Louis.
SIGMA (1981a). The quantitative colorimetric determination of total calcium in serum, plasma orurine at 570-575 nm. Sigma Technical Bulletin 585, Sigma Chemical Co., St Louis.
SIGMA (19816). The colorimetric determination of urea nitrogen in blood, plasma, or serum at515-540nm. Sigma Technical Bulletin 535, Sigma Chemical Co., St Louis.
296 C. M. WOOD, R. G. BOUTILIER AND D. J. RANDALL
SIGMA (1981C). The enzymatic-colorimetric determination of uric acid in serum or urine at650-750nm. Sigma Technical Bulletin 680, Sigma Chemical Co., St Louis.
SIGMA (1982a). The colorimetric micro-determination of total protein. Sigma Technical Bulletin690, Sigma Chemical Co., St Louis.
SIGMA (19826). The quantitative ultraviolet determination of ammonia in plasma at 340 nm. SigmaTechnical Bulletin 170-UV. Sigma Chemical Co., St Louis.
STEWART, P. A. (1978). Independent and dependent variables of acid-base control. Respir.Physiol. 33, 9-26.
TOWLE, D. W. (1981). Transport-related ATPases as probes of tissue function in three terrestrialcrabs of Palau.J. exp. Zool. 218, 89-95.
TRUCHOT, J. P. (1976). Carbon dioxide combining properties of the blood of the shore crabCarcinus maenas (L): carbon dioxide solubility coefficients and carbonic acid dissociationconstants. J. exp. Biol. 64, 43-57.
VERDOUW, H., VAN ECHTELD, J. A. & DEKKERS, E. M. J. (1978). Ammonia determination basedon indophenol formation with sodium salicylate. Water Res. 12, 399-402.
VELLAS, F. & SERFARTY, A. (1974). L'ammoniaque et l'uree chez un teleosteen d'eau douce: lacarpe (Cyprinus carpio L.).jf. Physiol., Paris 68, 591-614.
WARREN, K. S. (1958). The differential toxicity of ammonium salts. J . din. Invest. 37, 497-501.WHEATLY, M. G., BURGGREN, W. W. & MCMAHON, B. R. (1984). The effects of temperature and
water availability on ion and acid-base balance in hemolymph of the land hermit crab Coenobitaclypeatus. Biol. Bull. mar. biol. Lab., Woods Hole 166, 427-445.
WOLCOTT, T. G. & WoiXOTT, D. L. (1985). Extrarenal modification of urine for ion conservationin ghost crabs, Ocypode quadrata (Fabricius). J. exp. mar. Biol. Ecol. 91, 93-107.
WOOD, C. M. & BOUTILIER, R. G. (1985). Osmoregulation, ionic exchange, blood chemistry, andnitrogenous waste excretion in the land crab Cardisoma carnifex: a field and laboratory study.Biol. Bull. mar. biol. Lab., Woods Hole 169, 267-290.
WOOD, C. M. & CAMERON, J. N. (1985). Temperature and the physiology of intracellular andextracellular acid—base regulation in the blue crab Callinectes sapidus. J. exp. Biol. 114,151-179.
WOOD, C. M. & RANDALL, D. J. (1981a). Oxygen and carbon dioxide exchange during exercise inthe land crab (Cardisoma carnifex). J. exp. Zool. 218, 7-22.
WOOD, C. M. & RANDALL, D. J. (19816). Haemolymph gas transport, acid—base regulation, andanaerobic metabolism during exercise in the land crab (Cardisoma carnifex). J. exp. Zool. 218,23-35.