THE PHYSIOLOGY OF THE ALLIGATOR HEART: THECARDIAC CYCLE
BY G. SHELTON
School of Biological Sciences, University of East Anglia, Norwich NR4 7TJ, UK
AND D. R. JONES
Department of Zoology, University of British Columbia, 6270 UniversityBoulevard, Vancouver, BC, Canada V6T 2A9
Accepted 27 February 1991
Summary
Pressure recordings from the heart and major arteries of the alligator show thata conventional relationship exists between the left ventricle and the right aorta.Pressure gradients from ventricle to aorta during systole are very small. Rightaortic blood flow rises rapidly to a single peak and then falls more gradually untilaortic valve closure.
The right ventricle is connected both to the pulmonary arteries and to the leftaorta. Right ventricular pressures show that systole is a two-stage process.Initially, blood leaves to the low-resistance lung circuit, though appreciablepressure gradients exist across the pulmonary outflow tract. Active contraction ofthe pulmonary outflow tract stops pulmonary ejection and a second-stage pressurerise is seen in the right ventricle.
When systemic blood pressures are high, this second-stage pressure does notreach the levels recorded in the left aorta, and the left aortic valves remain closedso that lung and body circuits are functionally separate. An alternation of flow isfound in the left aorta under these conditions, with reversed flow during systoleand forward flow during diastole. Flow rates are extremely low, compared withthose in the right aorta or pulmonary arteries, and the foramen of Panizza has verylittle significance in the cardiac cycle.
If the systemic blood pressures are low, the second stage of systole in the rightventricle gives rise to pressures that are higher than those in the left aorta, the leftaortic valves open and blood is ejected to the systemic circulation, giving a right-to-left shunt. This can occur with no changes in pulmonary pressures or flows. Leftaortic flow is not dependent on increased constriction of the pulmonary outflowtract, which continues to function as an on-off active valve. Constriction withinthe lung vasculature may, on some occasions, be significant in establishing leftaortic flow, but it is clear from the present work that low systemic blood pressure isa factor of crucial importance.
Key words: alligator, heart, cardiac cycle, left aorta, active valve, blood shunt, blood pressures,flows, Alligator mississipiensis.
540 G. SHELTON AND D. R. JONES
IntroductionConsideration of the evolution of structure and function in the reptile heart
reminds us of the advice given to the enquiring traveller that his destination is easyto find provided he does not start from his present position. In the anapsid anddiapsid reptiles, the anatomical relationships between the partially dividedventricle and its three output vessels (the right and left aortae and the pulmonaryartery) evolve in directions that seem to make complete separation of lung andbody circuits difficult to achieve (Webb et al. 1971, 1974; Webb, 1979). It may bethat such separation would not be adaptive in these animals. It has been argued,with some justification, that because of central shunts the ability to regulate bloodflow to the lungs independently of that to the body persists as an adaptive featurein intermittently breathing animals such as amphibians and the vast majority ofreptiles (Shelton, 1985; Burggren, 1987; Shelton and Croghan, 1988). However,the fact that intermittent breathing can develop in spectacular form in diving birdsand mammals (Butler and Jones, 1982) without central shunts undermines theargument a little. In addition, the selective advantages of the variable lungperfusion that is allowed by central shunts in intermittent breathers are hypotheti-cal and largely untested. Finally, in varanid lizards, there is complete division ofthe ventricle during systole (Millard and Johansen, 1973; Burggren and Johansen,1982) and almost certainly during diastole too (Webb et al. 1971; Heisler et al.1983; G. Shelton, D. R. Jones and W. K. Milsom, unpublished work). Theanatomical arrangements are extraordinary. An interventricular partition formedby the atrioventricular valves operates during diastole, whereas the muscular ridgewithin the ventricle divides it at a quite different site during systole. The varanidsseem to have achieved an almost completely divided double circulation from arather unpromising starting position, even though some species are well-adapteddivers that breathe intermittently. Though a great deal of the physiology is stillrather sketchily worked out and evolutionary trends difficult to see, there can beno doubt that the cardiovascular systems in living reptiles are evidence that a lot ofevolutionary experiment has gone on in the group.
The heart and arterial arches in the Crocodilia show further evidence of thatexperiment and add to the confusion. These animals breathe intermittently andhave a complete interventricular septum but the left aorta opens, together with thepulmonary artery, from the right ventricle (Fig. 1), a fact that has puzzledanatomists since the 17th century (see Grigg, 1989). More recently, White (1956,1969) showed that, during normal cardiac cycles, oxygen levels in the left and rightaortae were similar and that high systemic blood pressures kept the left aorticvalve permanently closed, thus preserving complete separation of lung and bodycircuits. He suggested that, during systole in these circumstances, blood flowedinto the left aorta from the right via the foramen of Panizza, a small connectionbetween the left and right aortae just outside the aortic valves (Fig. 1). Greenfieldand Morrow (1961), in contrast, thought that the foramen was closed duringsystole by the medial cusp of the right aortic valve, but that blood flow from rightto left occurred during diastole. Grigg and Johansen (1987) suggested that floya
Cardiac cycle in alligator
CarA
541
oz
ozD
Fig. 1. Diagram to show details of connections between ventricles and central arteriesin alligator circulation and to indicate sites where pressures (P) and flows (F) weremeasured. CA, coeliac artery; CarA, carotid artery; DAo, dorsal aorta; FT, foramenof Panizza; LAo, left aorta; LV, left ventricle; PA, pulmonary artery; PECT, pectoralregion; RAo, right aorta; RV, right ventricle; SubA, subclavian artery.
could occur at both times in different circumstances and that the variability ofdifferent investigators' results could be attributed largely to changes in diameter ofthe foramen of Panizza. Direct measurement of flow in the left aorta of the caiman(Axelsson et al. 1989) showed that, in the undisturbed animal, flow rates were verylow and entirely dependent on movement of blood through the foramen duringmost of the cardiac cycle.
However, this controversy seems rather peripheral to the fundamental problemof the connection between right ventricle and left aorta. In his important papers of1968 and 1969, White suggested that the resistance of the pulmonary outflow tractfrom the right ventricle was variable and regulated by a cholinergic mechanism.During forced dives, with accompanying bradycardia, he found that the resistanceof the outflow tract increased so that pressures in the right ventricle also increasedand ultimately blood was ejected into the left aorta. In spite of the completeinterventricular septum, therefore, the Crocodilia had retained the ability to shuntblood away from the lungs (right-to-left shunt) during certain types of apnoea.White (1970, 1976) developed these views further and the right-to-left shunt hassince been confirmed by the pressure measurements and oxygen determinations ofGrigg and Johansen (1987), though only in unforced, aerobic dives. Axelsson et al.
^989) , however, were unable to confirm flow into the left aorta from the right
542 G. SHELTON AND D. R. JONES
ventricle in their animals, even during voluntary dives. Dives with bradycardia andhypoxia could not be elicited in their calm and contented caimans and injections ofacetylcholine were necessary to produce a right-to-left shunt via the left aorta.
There are still many aspects of the cardiac physiology of crocodiles that arelargely conjectural and, until the details have been worked out, it will not bepossible to understand the significance of the anatomical arrangements in thephysiology of the whole animal and in the context of evolutionary change. Thepresent paper attempts to describe some of the basic relationships betweenpressures and flows in the heart and arterial arches. Later papers will attempt toanswer the more difficult questions on the broader issues of whole-animalphysiology and adaptive significance of the relationships.
Materials and methods
The experiments were carried out on eight alligators {Alligator mississipiensis)purchased from a commercial alligator farm in South Carolina and shipped by airto the UK. Their mean body mass was 4.01 kg with a range from 2.79 to 5.02 kg.They were kept in a temperature-controlled room at 25 °C. Infrared lamps werepositioned 1 m above the floor so that the crocodiles could bask and a trough ofwater was provided in which they could submerge at will. They fed aggressivelyand remained in good condition throughout the holding period.
All the experiments described in this paper were performed on anaesthetisedanimals with open chests. Anaesthesia was initially induced by placing an animalin a closed box containing a pad soaked in halothane. This procedure took sometime because the animal breathed infrequently. When the alligator becameunconscious it was placed on an operating table and a tracheal cannula wasintroduced through the glottis, which had previously been sprayed with xylocaine.The cannula was then connected to an intermediate animal ventilator (HarvardApparatus, South Natick, MA) and the lungs were ventilated continuously at2.5-4.0breathsmin~1 with a tidal volume of 15-20 ml kg"1. These values werebased on data given by Naifeh et al. (1970) for caiman and alligator. Theventilation was sufficient to keep arterial blood fully oxygenated and reduce theanimal's own ventilation movements to a minimum. If the pump was stopped,however, as it was quite frequently in order to judge the level of anaesthesia, theanimal began making the intermittent breathing movements characteristic of thespecies. The gas used for ventilation was usually a 50 % oxygen/50 % nitrous oxidemixture, though on occasions when very light anaesthesia was required this waschanged to 80% oxygen/20% nitrous oxide. During the surgery, halothane up toa concentration of 4 %, but more usually of 2 %, was added to the oxygen/nitrousoxide mixture by means of a Fluotec 3 vaporiser (Cyprane Ltd, Keighley, UK).The halothane concentration was reduced to approximately 0.5 % after surgeryhad been completed, the level being adjusted to give appropriate levels ofanaesthesia throughout the experiments. The animals were maintained at 25-30°^
Cardiac cycle in alligator 543
during the operations and experiments by means of a heated pad on the operatingtable and an infrared lamp above it. Rectal temperature was monitored continu-ously.
The whole heart and the arterial arches were exposed, in the initial experiments,by a ventral incision through the midline of the sternum, beginning midwaybetween the front and rear legs and continuing forward to the level of the frontlegs. Incisions of this length proved to be unnecessary after the initial exploration,even in animals in which simultaneous pressure recordings were made from theventricles and arteries. The major arteries are contained within a single, largeconnective tissue sheath as they emerge from the ventricle. This truncus is aboutthe same length as the ventricles and is enclosed within the pericardium. In it thepulmonary artery and right aorta expand into chambers of substantial volume(called sinuses by Webb, 1979). The left aorta, in contrast, remains small and mayeven decrease in diameter in the truncus. The arterial arches were separated andfreed of connective tissue, over lengths sufficient for flow probe and pressurecatheter implantation, as they emerged from the anterior ends of the truncus andpericardium. There was little blood loss during surgery.
Several pressure values, up to a maximum of six, were measured simultaneouslyby inserting polythene catheters (PP60; i.d. 0.8 mm, o.d. 1.2 mm) into the leftaorta, either the left or right pulmonary artery, and either the right aorta or the leftsubclavian artery (Fig. 1). The arteries were clamped off and a small hole wasmade in the wall with a hypodermic needle, and the catheter inserted. It was heldin place with a purse string of surgical thread tied round the catheter and taking ina small amount of the arterial wall all the way round the aperture. This techniquewas subsequently modified by flaring the end of the catheter before insertion andthen pulling the flared end back against the arterial wall before tightening thefixing loop. Pressures were also measured in different regions of the right and leftventricles (Fig. 1). Holes were made in the myocardium with a hypodermic needleand catheters, with their ends cut to sharply angled points, were then insertedthrough the holes and tied in place with a loop of surgical thread taking in the outerconnective tissue coat of the ventricle. The pericardium, which had to be openedfor the placement of ventricular catheters, was closed by a number of sutures.Again, blood loss was minimal.
The pressures were measured with BioTec BT70 and Elcomatic EM 750pressure transducers, both types being strain gauge instruments with variableresistances in a bridge configuration. They were connected to Hewlett Packard8805A carrier preamplifiers or strain gauge bridge amplifiers. The pressure signalswere displayed on a Hewlett Packard six-channel pen recorder writing onrectangular coordinates, and on a Medelec FOR4.2 recording oscilloscope. Thelatter was used to produce superimposed records such as those of Figs 2 and 7. Thetransducers could be connected to columns of saline so that zero and calibrationpressures could be applied to them at any time. The pressure-measuring apparatuswas filled with 0.8% NaCl containing 50i.u. heparinml"1 and care was taken tod air bubbles from transducers and catheters. The frequency characteristics
544
10.0
G. SHELTON AND D. R. JONES
• Is '
Fig. 2. Simultaneous pressure recordings from left ventricle (LV), right ventricle(RV), pulmonary artery (PA) and right aorta (RAo) in a 3.6kg alligator. The lettersabove the recordings indicate phases of the cardiac cycle on the left (L) and right (R)sides of the heart, as described fully in the text. Mean durations (S.E.) of the phases inseconds, determined from three animals, are as follows for the left heart: LI, 0.121(0.006); L2, 0.336 (0.010); L3, 0.109 (0.007); L4, 0.198 (0.008); L5, 0.380 (0.013); andfor the right heart: Rip, 0.082 (0.007); R2p, 0.218 (0.012); R3p+R4p, 0.465 (0.022);R5, 0.375 (0.013). The mean heart rate to which these durations apply was52.5beatsmin~'.
of the overall system were adequate to record the pressures found withoutdistortion.
Blood flow was measured in the right aorta, the left aorta, and either the right orleft pulmonary artery, whichever was not being used for pressure measurements(Fig. 1). Biotronix electromagnetic flow probes were used in all cases, with a 3 mmprobe being fixed around the right aorta and 2.5 mm probes around the other twovessels. The probes were driven from Biotronix 410 and 610 fiowmeters. The flow-measuring apparatus was calibrated after the experiments using a piece of excisedright aorta perfused with saline from a reservoir at the correct height to give meanarterial pressure. Flow rates were regulated by a screw clamp on the outflow tubeand the amount of saline collected in a measured time was determined byweighing. Five or six flow rates were used for each probe and the best calibrationLine was established by linear regression. Zero flow levels were determinedregularly throughout the experiments by mechanical occlusion of the vessels,downstream of the probes, using miniature artery clamps.
A number of experiments were carried out in attempts to modify therelationships between the right and left ventricles and their respective arterialoutput vessels. The animal was arranged on the operating table so that its
Cardiac cycle in alligator 545
could be tilted backwards and submerged in a beaker of water. In this way forceddives could be simulated for periods up to lOmin. The temperature of the animalcould be changed by resetting the temperature-controlled pad and by augmentingthe infrared heating above the operating table. Cooling was achieved bysurrounding the alligator with ice-filled bags.
ResultsThe main features of the cardiac cycle are summarised in Fig. 2 which shows the
timing of events, Table 1 which gives details of blood pressure and Table 2 whichgives data on blood flow. The experiments were so arranged that these datasummaries could be obtained from at least three animals; thus, blood flows were,in the main, measured in a group of three animals and ventricular blood pressureswere measured in a different group, also of three animals. Sets of data werecollected on at least three occasions in each animal, at times when thecardiovascular system was judged to be stable, there had been no recentexperimental interventions and anaesthesia was at a light level. Arterial bloodpressure and heart rate were measured in all animals and so provided the basis forestablishing comparabilities between groups.
The cardiac cycle on the left side of the heart can be divided into five phases asshown in Fig. 2, based on significant components in the pressure records. Theoccurrence of the following events separates each phase of the cycle from itspredecessor: (LI) a pressure rise marks the beginning of isovolumic ventricularcontraction with no blood leaving to the right aorta; (L2) a pressure rise in theright aorta marks the beginning of ejection of blood from the left ventricle; (L3)peak pressure occurs in the left ventricle and outflow vessels and ejection slows;
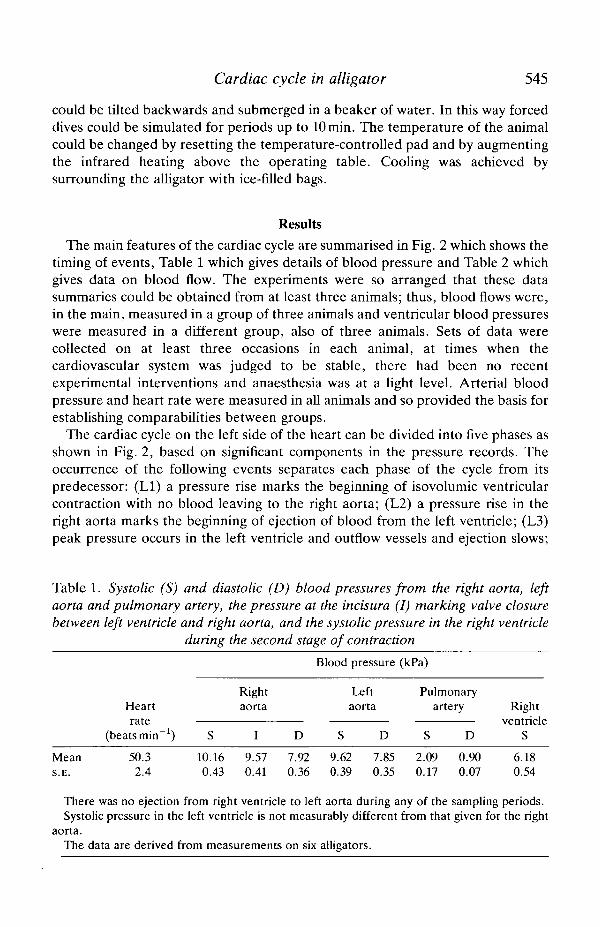
Table 1. Systolic (S) and diastolic (D) blood pressures from the right aorta, leftaorta and pulmonary artery, the pressure at the incisura (I) marking valve closurebetween left ventricle and right aorta, and the systolic pressure in the right ventricle
during the second stage of contraction
MeanS.E.
Heartrate
(beats min"1)
50.32.4
S
10.160.43
Rightaorta
I
9.570.41
70
D
.9236
Blood pressure
Leftaorta
S D
9.62 7.850.39 0.35
(kPa)
Pulmonaryartery
S D
2.09 0.900.17 0.07
Rightventricle
S
6.180.54
There was no ejection from right ventricle to left aorta during any of the sampling periods.Systolic pressure in the left ventricle is not measurably different from that given for the right
aorta.The data are derived from measurements on six alligators.
546 G. SHELTON AND D. R. JONES
(L4) ejection stops and an inflection marks the closure of the aortic valves followedby isovolumic ventricular relaxation; (L5) pressure reaches zero in the leftventricle and filling begins. Identification of equivalent phases in the right heart iscomplicated by there being two components in its cycle. However, it is convenientto adopt the same criteria, as far as possible, to establish five phases for the rightventricle as it relates first to the pulmonary and then to the systemic circulations.Clearly there is a common filling phase (R5), which is not substantially different intiming from phase L5. However, the isovolumic contraction, ejection andisovolumic relaxation phases on the right side are different in relation to thepulmonary (Rlp-R4p) and systemic (Rls-R4s) circulations, because of thesequential nature of ejection to the pulmonary artery and left aorta, and they aredealt with separately in the descriptions that follow. Only pulmonary phases arelabelled in Fig. 2 because right ventricular ejection to the left aorta does not occur.Some systemic components can always be seen, even in the absence of ejection,with systemic isovolumic contraction (Rls) being immediately followed byisovolumic relaxation (R4s), but they are not analysed in Fig. 2. Systemic ejectionphases from the right ventricle will be described in a later section. To makecomparisons easier, vertical lines, showing pulmonary phases in the right ventricletogether with those in the left ventricle, have been drawn where possible on Figs 3and 4. Similar lines to show systemic phases in the right ventricle have been drawnon Figs 7, 8 and 9.
The durations of the five phases shown in Fig. 2 are given in the caption, thevalues being means derived from three animals with heart rates close to the meanvalue of 52.5+0.97beats min"1. When the rate was made to decrease by theintravenous injection of acetylcholine, only the filling phase (5) changed substan-tially in duration. The remaining phases increased slightly, though not signifi-cantly, so the times given in Fig. 2 are not unduly sensitive to changes in the levelof vagal tone such as would be involved, for example, in the development of a milddiving bradycardia.
Left ventricular output
The pressure and flow relationships between the left ventricle and its outputvessels, the right aorta and the carotid and subclavian arteries, were of aconventional pattern (Figs 2, 3 and 4). The pressure in the left ventricle increasedrapidly during the isovolumic contraction in phase LI to 7.92 kPa (Table 1), atwhich time the right aortic valves opened passively and blood was ejected withincreasing velocity into the aorta and its associated vessels (Fig. 4, phase L2).Pressures in the ventricle and arteries continued to rise during phase L2 to meansystolic values of 10.16kPa (Figs 2 and 3; Table 1), though flow rate eventuallybegan to decline. This decrease in flow continued through phase L3 and the aorticvalves closed passively. Pressures also fell, rapidly approaching zero in theventricle during the isovolumic relaxation of phase L4. Diastolic pressure run offwas identical in the subclavian and carotid arteries and the right aorta duringphases 4 and 5. A substantial flow was maintained in these vessels throughouJi
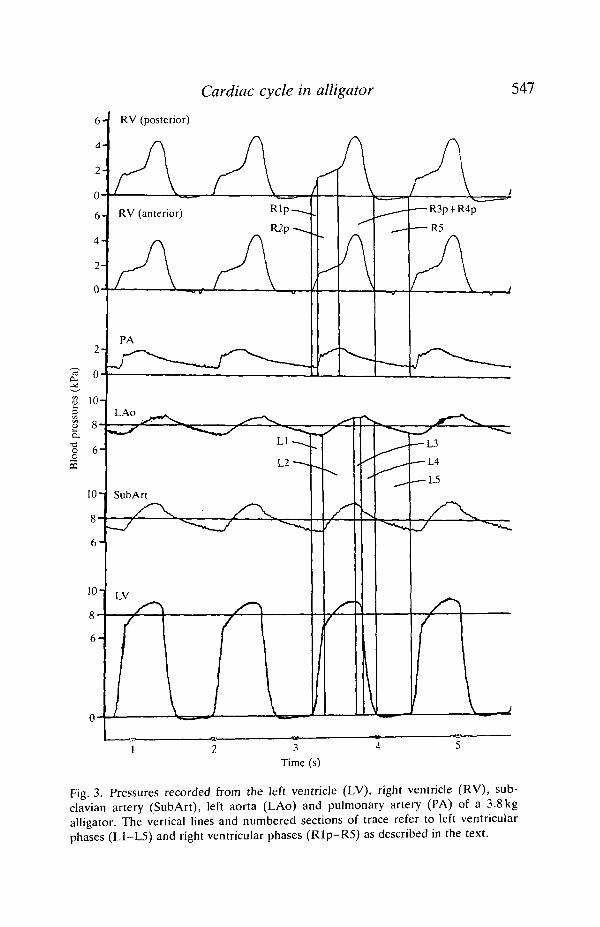
Cardiac cycle in alligator 547
RV (posterior)
-ao_oCQ
Time (s)
Fig. 3. Pressures recorded from the left ventricle (LV), right ventricle (RV), sub-clavian artery (SubArt), left aorta (LAo) and pulmonary artery (PA) of a 3.8kgalligator. The vertical lines and numbered sections of trace refer to left ventricularphases (L1-L5) and right ventricular phases (Rlp-R5) as described in the text.
548 G. SHELTON AND D. R. JONES
12-
10
~ 0.2-
a.-a 0.2-
12-
10
2-
LAo
LAo
SubArt
RAo
•L2
• L3
-Av/y / v >W'W'V
Is
Fig. 4. Pressures and flows recorded from the right aorta (RAo) and subclavian artery(SubArt), the left aorta (LAo) and the pulmonary artery (PA) of a 4.6 kg alligator. Theright aorta and the pulmonary artery flow rates were 44.1 ml min"1 and 52.5mlmin~1,respectively, and the stroke flows were 1.05 ml cycle"1 and 1.25 ml cycle"1, respect-ively. Forward flow in the left aorta was 3.4mlmin~' and reversed flow was3.0mlmin"'. The forward stroke flow was 0.08 ml cycle"1 and reversed stroke flow was0.07 ml cycle"1. The vertical lines and numbered sections of trace refer to phases of thecardiac cycle in the right and left hearts.
Cardiac cycle in alligator 549
diastole. Flow zero was checked on numerous occasions and the maintained flowconfirmed; the level changed very little during diastole in spite of the continuouslyfalling arterial pressures.
Flow values for the pulses shown are given in the figure captions and meanvalues from three animals are summarised in Table 2.
Right ventricular output
Pressure and flow relationships between the right ventricle and its outputvessels, the pulmonary arteries and the left aorta, are much more complex. Thepulmonary stage of right ventricular systole began synchronously with that in theleft ventricle, though the rate of rise in pressure was lower on the right side (phaseRip, Figs 2 and 3). The rate diminished even more at a well-defined inflection,coinciding with the sudden increase in pulmonary artery pressure (phase R2p) orfollowing soon after. Right ventricular pressure then began to increase atprogressively greater rates during phase R3p, marking the beginning of phase Rl sand ultimately reaching peak values with a mean of 6.18 kPa. Peak systolic valuevaried over a much wider range (s.D. = 1.33kPa) than the equivalent value in theleft ventricle (s.D. = 1.06kPa) and occurred approximately 25 ms later. In trabecu-late hearts it is possible to record two component pressures of the type shown hereif the catheter tip is enclosed within the trabeculae and squeezed by the ventricularmuscle as it contracts. Though the alligator heart has fewer trabeculae than mostreptile hearts, the multi-chambered nature of the ventricle suggested that such anartefact could not be discounted. Pressures were therefore recorded fromcatheters located in two different parts of the right ventricle (Fig. 1). Identicalpressure outlines were always found, even in regions of the ventricle as far awayfrom one another as possible (Fig. 3).
Pressures in the pulmonary arteries were related to, but not the same as, theinitial components found in the right ventricle during systole. The lung circulationin alligators is clearly a high-flow, low-resistance system in which the arterialpressures are very low, having a mean systolic value of only 2.09 kPa. In contrast,the flow rates were higher in both the right and the left pulmonary artery thanthose measured in the right aorta with the flow probe located downstream of thebranches to the carotid and subclavian arteries (Table 2). Slightly less than half theresistance of the whole pulmonary system was located in the pulmonary outflowtract, as judged by the pressure gradients between ventricle and arteries (Figs 2and 3). Moreover, that part of the resistance possessed some non-linear character-istics. The increase in arterial pressure and the beginning of blood flow in thepulmonary vessels (phase R2p) did not occur until 80 ms after right ventricularcontraction had started. Usually, an abrupt increase in both pulmonary pressureand flow was found following this delay, as though some part of the outflow regionhad suddenly opened, but, even so, arterial pressure did not rise to the levelsfound in the right ventricle (Figs 2 and 3). The inflection in the ventricular pressuretrace occurred as pulmonary arterial pressure increased abruptly and high flow^ates were established (phase R2p, Figs 3 and 4). As pressure and flow in the
Cardiac cycle in alligator 551
pulmonary artery reached peak values at the end of phase R2p (Figs 2, 3 and 4),the systemic stage of right ventricular contraction began with the pressure risingrapidly. Resistance of the pulmonary outflow tract must have increased substan-tially at this point because pulmonary arterial flow began to fall exponentiallythrough phases R3p and R4p.
It is difficult to decide at what point ventricular ejection stopped, or evenwhether it continued at a low level over much of the systemic stage of rightventricular contraction. The boundary between phases R3p and R4p cannottherefore be shown with certainty on Fig. 2. Eventually, pressure in the chamberfell below that in the pulmonary artery and from this stage, at least, relaxation wasisovolumic (phase R4p) and the pulmonary arterial valves closed.
During the later stages of phase R3p, through R4p into phase R5, two smalladditional pulses were sometimes seen to distort the smooth exponential decline inboth flow and pressure traces from the pulmonary arteries. The first of these pulses(Figs 2 and 5) occurred just as the ventricles of both sides began to relax,coinciding more or less with phase L4. The second (Figs 4, 5, 8 and 9) began aspressures fell to zero in both ventricles and filling started (phases L5 and R5).
For most of the time in these acute preparations the pressures in the rightventricle, though variable, never reached the levels found in the left aorta and theleft aortic valves remained closed throughout the cardiac cycle. All the bloodleaving the right ventricle was conveyed to the lungs. Cardiac output from one sideof the heart could be estimated as twice the flow measured in a pulmonary artery(Table 2), assuming equal flow in the two vessels.
Left aortic patterns: with no right ventricular components
When the left aortic valves were closed throughout the cycle, pressures in theleft aorta resembled those found in the right in their timing but differedimportantly in value. The systolic pressures in the left aorta were lower, by a meanvalue of 0.54 kPa, than those in the right, a difference that is significant at the0.1% level (using paired comparisons and Student's Mest). The differencesbetween the two diastolic pressures were much smaller, with a mean of 0.07 kPa,but they were still significant at the 2% level.
At the end of phase L3, when the right aortic valves closed, a notch wasfrequently observed in the trace from the left aorta (Figs 3 and 6). Its sizedepended on the difference that had developed between the two pressures duringthe preceding systole. The most important determinant of this pressure differencewas the resistance to flow offered by the left aorta below the pressure catheter (i.e.in the direction of the dorsal aorta). In preparations in which a flared catheter wasinserted through the arterial wall and then pulled back so that the flare abutted thewall itself, no obstruction was caused, left and right pressure differences weresmall, and the notch was small or non-existent (Fig. 4). In earlier experiments, ashort length of catheter was inserted into the lumen of the vessel before beinganchored to the wall, so that resistance to flow was increased by an unknown•mount. In some of these cases a very large notch or spike was seen (Fig. 6).
552
1.5
1.0
0.5
0
G. SHELTON AND D. R. JONES
LAo
Fig. 5. Blood flows recorded from the right aorta (RAo), left aorta (LAo) andpulmonary artery (PA) of a 3.3 kg alligator. The right aorta and pulmonary artery flowrates were 63.2mlmin~1 and 39.2ml min"1, respectively, and the stroke flows were1.59 ml cycle"1 and 0.96 ml cycle"1, respectively. In the left aorta, forward flow ratewas G.Omlmin"1 and reversed flow 2.6mlmin~1. Left aortic stroke flows were0.15 ml cycle"1 forward flow and 0.06 ml cycle"1 reversed flow.
Orientation of the catheter was important. When the record in Fig. 6 was taken,the catheter opening was facing towards the heart. The additional resistance,caused by the catheter itself, was therefore located between its opening and thedorsal aorta. Immediately afterwards, the catheter was redirected towards thedorsal aorta so that the additional resistance was located between the heart and thecatheter opening. The spike disappeared and records resembling those shown inFig. 3 were obtained. In all cases, regardless of catheter type or orientation, or thesize of the spike, differences in pressure between right and left aortae became verysmall after aortic valve closure and remained so throughout diastole (Table 1;Figs 3, 4 and 6).
Two types of flow pattern were seen in the left aorta when there was no outflowfrom the right ventricle. The usual one (Figs 4 and 5), found in five out of a total ojj
10
LAoForamen spike
5-
o
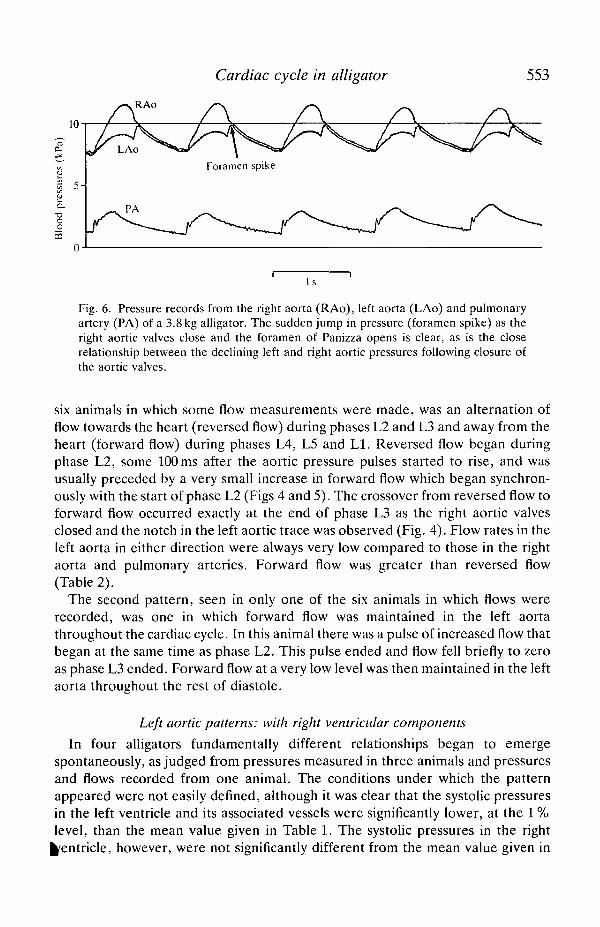
Cardiac cycle in alligator 553
Is
Fig. 6. Pressure records from the right aorta (RAo), left aorta (LAo) and pulmonaryartery (PA) of a 3.8 kg alligator. The sudden jump in pressure (foramen spike) as theright aortic valves close and the foramen of Panizza opens is clear, as is the closerelationship between the declining left and right aortic pressures following closure ofthe aortic valves.
six animals in which some flow measurements were made, was an alternation offlow towards the heart (reversed flow) during phases L2 and L3 and away from theheart (forward flow) during phases L4, L5 and LI. Reversed flow began duringphase L2, some 100ms after the aortic pressure pulses started to rise, and wasusually preceded by a very small increase in forward flow which began synchron-ously with the start of phase L2 (Figs 4 and 5). The crossover from reversed flow toforward flow occurred exactly at the end of phase L3 as the right aortic valvesclosed and the notch in the left aortic trace was observed (Fig. 4). Flow rates in theleft aorta in either direction were always very low compared to those in the rightaorta and pulmonary arteries. Forward flow was greater than reversed flow(Table 2).
The second pattern, seen in only one of the six animals in which flows wererecorded, was one in which forward flow was maintained in the left aortathroughout the cardiac cycle. In this animal there was a pulse of increased flow thatbegan at the same time as phase L2. This pulse ended and flow fell briefly to zeroas phase L3 ended. Forward flow at a very low level was then maintained in the leftaorta throughout the rest of diastole.
Left aortic patterns: with right ventricular components
In four alligators fundamentally different relationships began to emergespontaneously, as judged from pressures measured in three animals and pressuresand flows recorded from one animal. The conditions under which the patternappeared were not easily defined, although it was clear that the systolic pressuresin the left ventricle and its associated vessels were significantly lower, at the 1 %level, than the mean value given in Table 1. The systolic pressures in the right
Ventricle, however, were not significantly different from the mean value given in
554 G. SHELTON AND D. R. JONES
Table 1. The pressures in Table 1 were determined when there was no blood flowto the left aorta.
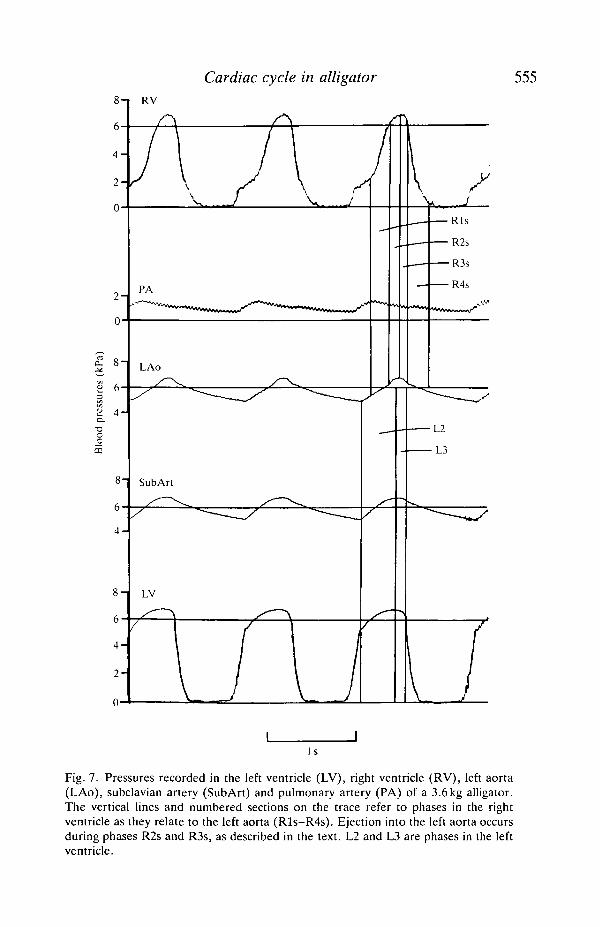
The clearest indication of the appearance of this new pattern was a change in theshape of the left aortic pressure pulse. An increased slope developed in the risingpressure wave during phase L2 (Figs 7 and 8). It was produced when pressures inthe right ventricle equalled or slightly exceeded those in the left aorta (Fig. 7).Blood was ejected through the open aortic valves, causing a transition in the leftaortic pressure as it became determined by right ventricular rather than leftventricular activity. The transition marked the beginning of phase R2s and itstiming was variable. When it came late in phase L2 (Figs 7 and 8), very smallvolumes of blood were pumped from the right ventricle into the left aorta. Theeffect of this was to bring reversed flow in the aorta to an end somewhat earlierthan would be the case when there was no right ventricular output. The crossoverto forward flow occurred early in phase L3, before closure of the aortic valves(compare Fig. 8 with Figs 4 and 5). When the transition appeared earlier in phaseL2, a correspondingly greater change was seen in the left aortic flow record(Fig. 9). Reversed flow now occurred only momentarily, if at all, and a moresubstantial forward component began with the opening of the left aortic valves.Peak pressure and forward flow occurred more or less synchronously in the leftaorta, marking the beginning of phase R3s, some 25 ms later than that of phase L3.Peak pressures occurred later in the right ventricle than in the left, whether or notejection to the left aorta occurred. Ejection came to an end simultaneously on bothsides of the heart as right and left aortic valves closed simultaneously and phasesR3s and L3 ended. In spite of the increased forward component, the total flow inthe left aorta was still small, being only about 5 % of the total output of the rightventricle.
Fig. 9 shows one of the more marked spontaneous changes in pattern. Theventilator was running throughout the record as the regular oscillations in thepressure traces show. There were no changes in the level of anaesthesia or anyother known variable. The aortic blood pressures were seen to fall and the leftaortic flow pattern to change during routine recording at low paper speed. It isclear that the falling aortic pressures brought the left aorta into the range ofpressure generated in the second stage of right ventricular contraction, makingejection possible. The immediate cause of the fall in aortic pressures must havebeen a sudden decrease in systemic resistance, though the reason for the changewas unknown. The recorder speed was increased for a short period until thepressures started to rise and the flow pattern to revert to its more usual state. Mostsignificantly, there were no changes in pulmonary pressures and flow ac-companying these modifications. Changes were found, however, in flow pulsesrecorded from the right aorta, with peak systolic flows increasing and diastolicflows falling to lower levels, and these were also attributable to a sudden fall insystemic resistance. Recovery from this short period of right ventricular ejectionwas as rapid as its onset.
A number of experiments were carried out in attempts to reproduce
Cardiac cycle in alligator 555
4 -
2 -
0
2 -
0
£ 6-
a 4 -•aoo
4 -
4 -
2 -
0
RV
Aj_
PA
LAo
SubArt
J• R l s
R2s
•R3s
•R4s
•L2
L3
Is
Fig. 7. Pressures recorded in the left ventricle (LV), right ventricle (RV), left aorta(LAo), subclavian artery (SubArt) and pulmonary artery (PA) of a 3.6kg alligator.The vertical lines and numbered sections on the trace refer to phases in the rightventricle as they relate to the left aorta (Rls-R4s). Ejection into the left aorta occursduring phases R2s and R3s, as described in the text. L2 and L3 are phases in the leftventricle.
I s
Fig. 8
Cardiac cycle in alligator 557
Fig. 8. Pressures and flows recorded from the right aorta (RAo), subclavian artery(SubArt), left aorta (LAo) and pulmonary arteries (PA) of a 3.3 kg alligator. The rightaorta and pulmonary flow rates were 56.8mlmin"' and 72.2mlmin~1, respectively,and the stroke flows were 1.19 ml cycle"1 and 1.50 ml cycle"1, respectively. Forwardflow in the left aorta was 6.6 ml min"1 and reversed flow was 1.9 ml min"1. Left aorticstroke flows were 0.14 ml cycle"1 forward flow and 0.04 ml cycle"1 reversed flow. Thevertical lines and numbered sections show phases in the left ventricle (L2 and L3) andin the right ventricle as they relate to ejection into the left aorta (R2s and R3s) and thepulmonery arteries (R2p).
ejection to the left aorta. Immersion of the nostrils and head in water, to simulatethe forced dives that White (1969) suggested were effective in causing left aorticflow and left-to-right shunt, did not result in a change in pattern. Althoughbradycardia was induced in some of these experiments, the systemic bloodpressures were always higher than those generated in the second stage of rightventricular contraction. Switching the ventilator off for periods of up to 5 min wasequally ineffective in causing ejection to the left aorta. Grigg (1989) has suggested,in a slightly different context, that low water temperatures give rise to low systemicblood pressures. We found that cooling the alligators from 30 to 22°C had no effecton blood pressure and did not trigger ejection to the left aorta. The onlyexperimental intervention that would reliably cause left aortic flow was theintravenous injection of acetylcholine. These experiments will be described in alater paper.
Discussion
The data presented in Table 2 are the first estimates of cardiac output incrocodiles. The values range from 14 to 41 ml min"1 kg"1 and are slightly, but notsignificantly, lower than the mean value of 49 ml min""1 kg"1 determined by Tucker(1966) for Iguana iguana between 20 and 30°C, and of 44 ml min"1 kg"1 also forIguana and measured over the same temperature range by Baker and White(1970). Both Iguana values were determined from oxygen consumption andarteriovenous differences in oxygen content. The blood pressures in Table 1 arenot significantly different from those recorded by Grigg and Johansen (1987) in air-breathing Crocodylus porosus, but the systolic values are significantly higher thanthose found in the femoral artery of Caiman crocodylus by Axelsson et al. (1989).
The systemic circulation
The simultaneous recording of a number of pressure and flow traces makes itpossible to interpret the events of the cardiac cycle in greater detail than has beendone before. Pressure relationships between the left ventricle and right aorta aresimilar to those seen in mammals (McDonald, 1974; Noble, 1968), with a forwardpressure gradient during phase L2 causing the rapid acceleration of blood flow toits peak value midway through the phase. Reversal of the gradient in phase L3
ds to flow deceleration and probably to passive valve closure due to local flow
558 G. SHELTON AND D. R. JONES
rate
sfl
ow
£
7
!_
(kPa
)
20
2
1
0
864
•ao
m
1 min Is
Fig. 9. Pressures and flows recorded in the right aorta (RAo), left aorta (LAo) andpulmonary artery of a 3.3 kg alligator, showing the development of right ventricularejection to the left aorta. The right aorta and pulmonary flow rates were 62.0 ml min"1
and 68.2 ml min"1, respectively and stroke flows were OSmlcycle"1 and 1.52mlcycle"1, respectively. Forward flow in the left aorta was 7.2 ml min"1 after rightventricular ejection had begun and stroke flows were 0.16 ml cycle"1 in the forwarddirection. There were no measurable reversed flows when right ventricular ejectionwas well established.
reversal at the end of the phase. At the flow recording site some distance down theright aorta, continuous flow occurs throughout diastole because of the storedenergy in the substantial central elastic reservoir. The right systemic arteryexpands into a large aortic sinus within the connective tissue truncus that binds allthe aortic trunks together, so that the central reservoir is relatively large involume. The left aorta does not expand into a large sinus in this way.
The pulmonary circulation
The relationships between the right ventricle, pulmonary arteries and left
Cardiac cycle in alligator 559
are unique, as Greenfield and Morrow (1961) and White (1969,1970) first revealedwith their pressure measurements on Alligator mississipiensis. Pulmonary flowbegins early in the cardiac cycle, about 80 ms before flow from the left ventricle tothe right aorta (Figs 4 and 5). This is due, as it is in mammals, to the fact thatejection starts at very low pressure in the pulmonary circuit. However, the delaybetween the beginning of ventricular systole and the appearance of flow andpressure pulses in the pulmonary artery is clearly greater than might be expected(Figs 2, 3 and 4). This delay, together with the substantial pressure gradient thatcontinues to be apparent during the early stages of pulmonary ejection (phaseR2p), must be due to the remarkable anatomy of the pulmonary outflow tract. Asubpulmonary chamber is marked off from the rest of the right ventricle,extending as far as the pulmonary valves. It probably represents an evolutionaryremnant of the conus arteriosus. It has a contractile wall with a lining of densefibrous nodules projecting into and largely occluding the outflow tract (Webb,1979; van Mierop and Kutsche, 1985). These nodules appear to be able to fittogether closely and may intermesh when the myocardium beneath themcontracts. The evidence from pressure measurements suggests that some part ofthis outflow tract has to open suddenly after right ventricular systole has been inprogress for about 80 ms (Fig. 2). Phase R2p then begins and flow accelerates inthe pulmonary arteries. Even after opening in this way, the tract still contributesan appreciable component to the total resistance of the low-resistance lung circuit,judged by the persisting pressure gradient between right ventricle and pulmonaryartery.
As phase R2p ends, the myocardium of the outflow tract begins to contract.Closure of this active valve causes the pressure gradient from ventricle to artery toincrease rapidly. Pulmonary outflow must stop or slow substantially soon afterpeak arterial pressure is reached because, at this time, arterial flow begins a slowexponential decline in spite of the rapidly increasing pressure gradient. This fall inflow is much less abrupt than that leading to aortic valve closure in the right aorta,reflecting significant differences in the length and compliance of systemic andpulmonary circulations. There is an extensive pulmonary sinus distal to theoutflow tract and to the arterial valves which acts as a substantial elastic reservoir.
White (1969) suggested that the resistance of the pulmonary outflow tract couldbe changed by a cholinergic mechanism so that the second stage of rightventricular systole produced higher pressures and ultimately outflow through theleft aorta. If, as we believe, the active valve functions as an on-off mechanism sothat pulmonary outflow stops or becomes extremely low during this second stage,such control of outflow resistance is impossible and cannot be important inregulating ventricular pressures and left aortic flow. The cholinergic mechanismcould induce earlier closure of the pulmonary outflow tract or a tonic constrictionof some sort, both of which would restrict pulmonary blood flow earlier in rightventricular systole and so leave more blood in the ventricle for the second stage.We have no evidence that either of these occurs. The relative timing of right and^ft ventricular events remains constant during systole (Figs 2, 3 and 7) and is not
560 G. SHELTON AND D. R. JONES
affected by acetylcholine. In addition, there is no evidence of large changes inresistance of the open pathway from right ventricle to pulmonary artery as anecessary condition for left aortic outflow (Figs 7 and 9). Further experiments arebeing carried out to test the hypothesis that the outflow tract acts as an activeon-off valve and not as a variable resistance controlling pulmonary flow over awide range.
The additional small flow pulses that sometimes occur in the pulmonary arteryare of some interest in this context. The earlier, more discrete, pulse (Fig. 5) isseen during isovolumic relaxation (phases L4, R4s) and is probably attributable tothe beginning of relaxation in the cardiac muscle of the outflow tract. Rightventricular pressure is still high during the early stages of this phase (Fig. 2) and issufficient to cause an outflow of blood into the pulmonary artery before closure ofthe pulmonary valves proper. The pulse, when it occurs, is always brief (10-15 %of the cardiac cycle) and shorter than phase 4. The second pulse (Figs 4,5,8 and 9)is much more difficult to explain since it occurs during phases L5 and R5 whenventricular pressure is below that in the pulmonary artery so that the passivepulmonary valves must be closed. It may be due to the transmural transfer ofenergy between compartments or vessels within the confines of the relativelyinextensible pericardium and/or truncus.
Flow in the left aorta
Pressures in the left aorta are necessarily related fairly closely to those in the restof the systemic circulation because of the connections via the foramen of Panizzaand the dorsal aorta (Fig. 1). When pressures in the systemic circulation are highand left aortic valves closed, blood in the aorta moves slowly away from the heart(forward flow) during diastole and towards it (reversed flow) during systole. Asdiastole begins, closure of the right aortic valve causes the medial cusp to moveaway from the foramen of Panizza and so open it up for restricted flow from rightto left aorta. Forward flow continues, with both the foramen and elastic recoil inthe left aorta contributing, through to the next systole. This flow persists briefly asthe foramen is closed by the opening right aortic valves, but ultimately reversesafter the flow pulse completes the circuit from right to left aorta via the dorsalaortic connection.
During systole, reversed flow can only charge up the elastic reservoir of the leftaorta since flow through the foramen is prevented by the cusp of the right aorticvalve. This stored energy runs down during diastole. However, forward flow isgreater than reversed flow and the additional flow must be due to movement ofblood through the foramen. Mean foramen flow calculated on this basis is0.022±0.009 ml kg"1 cardiac cycle"1 or approximately O^mlmin" 1 kg"1 movingthrough the foramen. This amounts to only 2-6 % of the blood being pumped intothe right aorta. The restricted aperture and obscured position of the foramen,together with the small pressure gradients from right to left sides during diastole,are consistent with this conclusion on the minor nature of foramen flow. It has verylittle significance in the overall cardiac cycle, except as a mechanism to preve^
Cardiac cycle in alligator 561
total stagnation of blood in the left aorta at times when the left aortic valves areclosed. The slow flow of blood prevents clot formation and damage to the artery.
In one animal, forward flow in the left aorta occurred throughout the cardiaccycle, reaching a maximum during systole and a minimum with a momentaryreversal as the aortic valves closed. The pattern must be due either to a failure ofthe cusp of the semilunar valve to close the foramen or to a transmuraltransmission of energy between aortic trunks during systole. The former seemsmore likely.
The pressure differences that develop between right and left aortae when theforamen is closed by the right aortic cusp can be quite large under somecircumstances (Fig. 6). The beginning of diastole is marked then by a jump inpressure in the left aorta as the foramen opens and the pressure differencesbetween the two aortae become very small. This was called the foramen spike byGrigg and Johansen (1987), who suggested that the variability in the spike sizedepended on fairly rapid, controlled changes in the diameter of the foramen. Theydismissed the possibility of pressure wave transmission around the loop from rightto left aorta via the dorsal aortic connection. Our evidence suggests that thesehypotheses are incorrect. The size of the spike depends on the pressure differencethat develops between right and left aortae during systole, since diastolic pressuresare always close to one another through the open foramen. In turn, when there isno ejection from the right ventricle to the left aorta, the difference in systolicpressures in the two aortae depends on the leakiness of the cusp closure of theforamen and on the overall resistance to flow in the right-to-left loop. In mostcases the foramen closes completely so that, after the initial forward movement ofblood accompanying the cusp closure (Figs 4 and 5), the further increase inpressure in the left aorta is due entirely to reversed flow round the loop. If there isan appreciable resistance to this flow, then the rate of pressure increase at the leftaortic cannula will be low and a large spike will ensue (Fig. 6) when the right aorticvalve closes and the foramen opens. Conversely, with low loop resistance, only asmall pressure difference, due principally to time delays in the loop, will bedeveloped and the spike will be non-existent (Fig. 4) or seen as a small notch(Fig. 3).
Care is needed to avoid introducing resistance into the loop inadvertently. Ashort length of 1.22 mm tubing inserted into the left aorta, with its aperture facingtowards the heart, was sufficient to produce the spike in Fig. 6. The possibility thatthe resistance of the loop may be controlled in some way cannot be eliminated. Anobvious region for such control is the connection between the left aorta and thedorsal aorta (Fig. 1), which most authors refer to as small or minor (Webb, 1979;van Mierop and Kutsche, 1985). The vessel is inaccessible and we have not seen itin a living animal. In dead animals it is undoubtedly smaller than the vessels itconnects but, nevertheless, appears to be a substantial connection that would notconstitute a high resistance to flow. There is no direct evidence of mechanisms thatmight control its diameter, but the possibility is worth examining.
Flow from the right ventricle into the left aorta changes relationships in a major
562 G. SHELTON AND D. R. JONES
way but, before discussing the new patterns, it will be useful to consider theconditions that could give rise to this type of right ventricular output. Usually inthese preparations, the total output of the right ventricle is pumped into thepulmonary circuit in the first stage of systole. When the active valve closes and thesecond stage of systole begins, the pressures that can then be generated are not ashigh as those in the left ventricle. This is not due to the right ventricularmyocardium being less powerful than the left, as it is in the varanid lizards; bothleft and right chambers have thick walls in alligators. The relatively low pressuresreached must be the result of low ventricular volume and short muscle fibre length,together with declining levels of activation.
There are four ways in which the pressures in the right ventricle could be madeto equal or exceed those in the left: (1) increasing the contractility of the rightmyocardium selectively, for example via the sympathetic innervation; (2) increas-ing the length of the right ventricular fibres by increased filling; (3) decreasingblood flow to the lungs by pulmonary vasoconstriction; (4) reducing left ventricu-lar and systemic pressures by systemic vasodilation. The first hypothesis has neverbeen investigated in alligators. Nor has the second, though it must have someimportance because, other things being equal, consistent right ventricular outputto the systemic circulation must increase venous return to the right side of theheart. The third mechanism is of known importance. The resistance of thepulmonary circuit has been shown to increase during diving (White, 1969) andafter intravenous injections of acetylcholine (White, 1969; Axelsson et al. 1989),causing a right-to-left shunt. The precise site of the resistance change is not clear,though White (1969) suggested that the outflow tract was important. We think thatthere are difficulties with this hypothesis, as outlined earlier, and we shall bedescribing the properties of the pulmonary circulation in a later paper.
The fourth possibility, reduction of systemic blood pressure, is clearly of majorimportance in giving rise to left aortic flow. It is the most significant factorestablished in the present experiments and involves no obvious changes in rightventricular contractility or modifications in resistance of the pulmonary circuit.The lower the systemic pressure, the earlier in the cycle does the second-stagepressure in the right ventricle reach levels high enough to open the left aortic valve(phase R2s) and establish flow (Figs 7, 8 and 9). However, no matter how low thesystemic pressure, flow cannot be set up before the active closure of the pulmonaryoutflow tract has occurred and the second stage of right ventricular systole hasbecome well established. Consequently, the early stages of left aortic flow are asbefore, with a short pulse of forward flow as the right aortic cusp moves to closethe foramen, followed by an equally short period of reversed flow round the right-to-left loop (Figs 8 and 9). The reversed flow is quickly ended by the ejection ofblood through the left aortic valves (Fig. 9) when right ventricular pressurereaches that in the left aorta. This pressure is often lower than that in the rightaorta because of losses round the loop. The pressure difference can be sustained atthe central ends of the aortae, as blood flows down them from their respectiveventricles, because the foramen is now closed by both right and left aortic
Cardiac cycle in alligator 563
There will be some interesting consequences of such differences at the dorsalanastomosis. In fact, we have evidence that pressure gradients can be set up inboth directions. This suggests that flow can occur from right aorta to coeliac arteryand from left aorta to dorsal aorta. Dynamic effects would favour the latterbecause of the oblique connections of the anastomosis (Fig. 1), but there can be nodoubt that adjustments occur in both directions. The evidence does not supportthe suggestion that the left aorta supplies almost all of the blood to the stomachand intestines or that blood from that vessel does not get into the systemic circuit(Webb, 1979).
The experiments described in this paper provide the basis for several newhypotheses about the relationships between the right and left sides of the alligatorheart and their respective arterial arches. The conditions for right ventricularejection to the left aorta are defined and one, the reduction of systemic bloodpressure, is shown to be of considerable importance. It leads to increased cardiacoutput as the right ventricle begins to pump more blood than the left one, whoseoutput, in turn, may stay constant or may increase as well. The other well-established condition for ejection to the left aorta is that of vasoconstriction in thepulmonary circuit. This will lead to reduced cardiac output, since flow round thepulmonary circuit, and therefore venous return to the left heart, must be reduced.We shall describe these relationships in a subsequent paper. In both cases the rightside of the heart pumps more blood than the left, but the physiologicalconsequences in terms of lung perfusion and relationships in the systemiccirculation are different. The alligator heart is a most versatile and intriguingorgan and there are many questions yet to be answered about its physiology.
We are grateful to the Royal Society, London, to NATO and to NSERCC forfinancial support.
ReferencesAXELSSON, M., HOLM, S. AND NILSSON, S. (1989). Flow dynamics of the crocodilian heart. Am.
J. Physiol. 256, R875-R879.BAKER, L. A. AND WHITE, F. N. (1970). Redistribution of cardiac output in response to heating
in Iguana iguana. Comp. Biochem. Physiol. 35, 253-262.BURGGREN, W. W. (1987). Form and function in reptilian circulations. Am. Zool. 27, 2-19.BURGGREN, W. W. AND JOHANSEN, K. (1982). Ventricular hemodynamics in the monitor lizard,
BUTLER, P. J. AND JONES, D. R. (1982). The comparative physiology of diving in vertebrates. InAdvances in Comparative Physiology and Biochemistry, vol. 8 (ed. O. E. Lowenstein), pp.179-364. London, New York: Academic Press.
GREENFIELD, L. J. AND MORROW, A. G. (1961). The cardiovascular hemodynamics ofCrocodilia. J. surg. Res. 1, 97-103.
GRIGG, G. (1989). The heart and patterns of cardiac outflow in Crocodilia. Proc. Aust. physiol.pharmacol. Soc. 20, 43-57.
GRIGG, G. C. AND JOHANSEN, K. (1987). Cardiovascular dynamics in Crocodylus porosusbreathing air and during voluntary aerobic dives. /. comp. Physiol. B 157, 381-392.
HEISLER, N., NEUMANN, P. AND MALOIY, G. M. O. (1983). The mechanism of intracardiacshunting in the lizard Varanus exanthematicus. J. exp. Biol. 105, 15-32.
564 G. SHELTON AND D. R. JONES
MCDONALD, D. A. (1974). Blood Flow in Arteries. London: Edward Arnold.MILLARD, R. W. AND JOHANSEN, K. (1973). Ventricular outflow dynamics in the lizard, Varanus
niloticus: responses to hypoxia, hypercarbia and diving. J. exp. Biol. 60, 871-880.NAIFEH, K. H., HUGGINS, S. E., HOFF, H. E., HUGG, T. W. AND NORTON, R. E. (1970).
Respiratory patterns in crocodilian reptiles. Respir. Physiol. 9, 31-42.NOBLE, M. I. M. (1968). The contribution of blood momentum to left ventricular ejection in the
dog. Circulation Res. 23, 663-670.SHELTON, G. (1985). Functional and evolutionary significance of cardiovascular shunts in the
Amphibia. In Cardiovascular Shunts: Phylogenetic, Onto genetic and Clinical Aspects. AlfredBenzon Symp. 21 (ed. K. Johansen and W. W. Burggren), pp. 100-120. Copenhagen:Munksgaard.
SHELTON, G. AND CROGHAN, P. C. (1988). Gas exchange and its control in non-steady-statesystems: the consequences of evolution from water to air breathing in the vertebrates. Can. J.Zoo I. 66, 109-123.
TUCKER, V. A. (1966). Oxygen transport by the circulatory system of the green iguana (Iguanaiguana) at different body temperatures. J. exp. Biol. 44, 77-92.
VAN MIEROP, L. H. S. AND KUTSCHE, L. M. (1985). Some aspects of comparative anatomy of theheart. In Cardiovascular Shunts: Phylogenetic, Ontogenetic and Clinical Aspects. AlfredBenzon Symp. 21, (ed. K. Johansen and W. W. Burggren), pp. 38-56. Copenhagen:Munksgaard.
WEBB, G. J. W. (1979). Comparative cardiac anatomy of the Reptilia. III. The heart ofcrocodilians and an hypothesis on the completion of the interventricular septum ofcrocodilians and birds. /. Morph. 161, 221-240.
WEBB, G. J. W., HEATWOLE, H. AND DE BAVAY, J. (1971). Comparative cardiac anatomy of theReptilia. I. The chambers and septa of the varanid ventricle. J. Morph. 134, 335-350.
WEBB, G. J. W., HEATWOLE, H. AND DE BAVAY, J. (1974). Comparative cardiac anatomy of theReptilia. II. A critique of the literature on the Squamata and Rhynchocephalia. J. Morph.142, 1-20.
WHITE, F. N. (1956). Circulation in the reptilian heart (Caiman sclerops). Anat. Rec. 125,417-431.
WHITE, F. N. (1968). Functional anatomy of the heart of reptiles. Am. Zool. 8, 211-219.WHITE, F. N. (1969). Redistribution of cardiac output in the diving alligator. Copeia 3, 567-570.WHITE, F. N. (1970). Central vascular shunts and their control in reptiles. Fedn Proc. Fedn Am.
Socs exp. Biol. 29, 1149-1153.WHITE, F. N. (1976). Circulation. In Biology of the Reptilia, vol. 5 (ed. C. Gans), pp. 275-334.