39
The Political and Social Economy of Care: Japan Research Report 2 Yuko TAMIYA Masato SHIKATA February 2009

The Political and Social Economy of Care:
Japan Research Report 2
Yuko TAMIYA
Masato SHIKATA
February 2009

1
The United Nations Research Institute for Social Development (UNRISD) is an autonomous agency engaging in multidisciplinary research on the social dimensions of contemporary problems affecting development. Its work is guided by the conviction that, for effective development policies to be formulated, an understanding of the social and political context is crucial. The Institute attempts to provide governments, development agencies, grassroots organizations and scholars with a better understanding of how development policies and processes of economic, social and environmental change affect different social groups. Working through an extensive network of national research centres, UNRISD aims to promote original research and strengthen research capacity in developing countries. Research programmes include: Civil Society and Social Movements; Democracy, Governance and Well-Being; Gender and Development; Identities, Conflict and Cohesion; Markets, Business and Regulation; and Social Policy and Development. A list of the Institute’s free and priced publications can be obtained by contacting the Reference Centre.
UNRISD, Palais des Nations 1211 Geneva 10, Switzerland
Tel: (41 22) 9173020 Fax: (41 22) 9170650
E-mail: [email protected] Web: http://www.unrisd.org
Copyright © United Nations Research Institute for Social Development (UNRISD). This is not a formal UNRISD publication. The responsibility for opinions expressed in signed studies rests solely with their author(s), and availability on the UNRISD Web site (http://www.unrisd.org) does not constitute an endorsement by UNRISD of the opinions expressed in them. No publication or distribution of these papers is permitted without the prior authorization of the author(s), except for personal use.

2
Introduction This paper analyses time use surveys carried out in Japan, focusing on how people distribute their time between work and care. The Ministry of Internal Affairs and Communications has carried out the Survey on Time Use and Leisure Activities (Shakai Seikatsu Kihon Chōsa) every five years from 1976. Using this time survey, we firstly analyze how people spend their time on paid and unpaid work by sex, age, household type, work status and household income. Secondly, we examine how the amount of time Japanese women and men spent in child and elderly care changed between 1991 and 2006. Furthermore, we discuss how these changes may have been influenced by child care and elderly care policy in this period. The Survey on Time Use and Leisure Activities (STULA) aims to obtain comprehensive data on daily patterns of time allocation The latest survey (the seventh) was conducted in 2006. From the 2001 survey (the sixth), Questionnaire B (which uses the post-coding approach) was introduced in order to obtain more detailed results concerning people’s time allocation. The pre-coded form used in former surveys was retained and named Questionnaire A . Therefore, from 2001 respondents were divided into two groups. The first group, which comprised the majority of the total sample, answered Questionnaire A while the second much smaller group answered Questionnaire B. The sample consists of around 70,000 to 100,000 households (around 200,000 to 250,000 total household members) selected from lists of households prepared by enumerators before the survey. All persons aged ten and over (15 and over up to the 1991 survey) in the sample households are asked to respond to the survey. The respondents are asked to report their time use on two consecutive days during nine days in September or October. For more detail on the survey from 1991 to 2006 see Appendix 1. In Questionnaire A, the kinds of activities are classified into 20 categories: sleep; personal care; meals; commuting to and from school or work; work; schoolwork; housework; caring for adults; child care; shopping; travel; watching TV, listening to the radio, reading newspapers or magazines; rest and relaxation; study and research; hobbies and amusements; sports; volunteer and social activities; social life; undergoing medical examination or treatment; other activities. In Questionnaire B, the respondents record their activities by 15-minute intervals, and the activities are subsequently classified into 62 categories during tabulation. In this paper, we collapse these 62 categories into ten categories,1 paid work, services for income and other production of goods not for establishment, household maintenance, care of persons, community service, learning, social and cultural activities, mass media use, personal care and others, in order to compare the results with those of other countries participating in the UNRISD project. For the details of these activities see Appendices 2 and 3. In the first half of our analysis, we utilise the data of Questionnaire B in the micro data set from the 2001 STULA.2 These data are extracted from 80% of the households (all family members are included in the sample households) to which Questionnaire B was administered by random sampling. The sample size is 3,129 households (7,822 household members). The second half of our analysis uses data from Questionnaire A from the surveys carried out from 1991 to 2006. The data are
1 Other countries participating in this UN project classified time use into ten categories; employment for establishment, primary production activities; service for income and other production of goods not for establishment; household maintenance, management and shopping for own household; care for children, the sick, elderly and disabled for own household; community service and help to other households; learning; social and cultural activities; mass media use; and personal care and self-maintenance. There is no activity corresponding to primary production activities in STULA. Further, STULA includes an “other” classification for otherwise unclassifiable items. 2 These data were anonymously-processed micro data provided by the Research Centre for Information and Statistics of Social Science, Institute of Economic Research, Hitotsubashi University. The micro data of STULA surveys conducted in 1991, 1996 and 2001 were provided by the centre.

3
weighted by region, sex and age.
I. Gender distribution of paid and unpaid work in Japan: Analysis of the micro data in the 2001 time use survey 1. Attributes of the respondents Tables 1 to 6 show the attributes of the respondents. They are 7,822 males and females aged ten years and over. In terms of age groups, the respondents aged ten to 17 comprise 10% of the total, those 18 to 49 years 47%, those 50 to 64 years 24% and each of the 50 to 64 years and 65 and over groups 19% (Table 1). In terms of sex, the percentage of males aged 18 to 49 is 49%, which is larger than that of females in the same age group (46%). The percentage of females aged 65 and over is 21%, which is larger than that of males in the same age group (17%) (Table 1). Table 1. Distribution of sample by age group and sex (%) 10-17 18-49 50-64 65+ Total Male 10.1 48.8 24.1 16.9 100.0 Female 9.9 45.7 23.5 20.8 100.0 Total 10.0 47.2 23.8 18.9 100.0 Table 2 shows the distribution of respondents by marital status. In this survey, “single” refers to those who have never married and “married” denotes those who had a partner (including common-law marriage) at the time of the survey. “Widowed/divorced” covers those whose partner has died or who are separated from a former partner and are currently single. The single group makes up 30% of the total, married 60% and “widowed/divorced” 10%. In terms of sex, the percentage of widowed/divorced is higher for females (15%) than males (5%) due to longer average life expectancy for females and the fact that wives tend to be younger than husbands. Table 2. Distribution of sample by marital status and sex (%)
Single
Married
Widowed/ Divorced
Total
Male 32.8 61.9 5.3 100.0 Female 28.2 57.1 14.7 100.0 Total 30.4 59.4 10.1 100.0 Table 3 shows the distribution of respondents by age of the youngest child in the household. Of all the respondents, 83% lived in households which had no children under 18 years of age, 8% co-resided with a child under seven and 9% lived in households in which the youngest child was aged seven to 17 years. Table 3. Distribution of sample by child status and sex (%) No children* 7-17 <7 Total Male 82.1 8.9 9.0 100.0 Female 83.8 7.8 8.4 100.0 Total 83.0 8.4 8.7 100.0 *No children means no person aged 17 or under in the household. Table 4 shows the employment status of the respondents. Here the respondents aged 15 and over are classified by their work status. Respondents aged 10 to 14 are excluded from this table. Those who are working for an income are employed, as are family workers who are working continuously, even if

4
they are unpaid. The remainder are classified as not employed. Among the respondents, 71% of males and 49% of females were employed. In total, 60% of the respondents were employed and 40% are not employed. Table 4. Distribution of sample by work status and sex (%) Employed Not employed Total Male 71.1 28.9 100.0 Female 48.8 51.2 100.0 Total 59.7 40.3 100.0 Table 5 shows the annual income of the households to which the respondents belonged. Here annual income is the sum total of pre-tax incomes of all members of a household in the year spanning October 20th, 2000 to October 19th, 2001.3 Of the respondents, 22% belonged to households with an annual income below three million yen, 24% to households with an income of three million to 4.99 million yen, 21% to households with an income of five million to 6.99 million yen, 19% to households with an income of seven million to 9.99 million yen, and 14% to households with an income of ten million yen and over. In terms of sex, the percentage of those belonging to households with a low annual income of below three million yen was higher for females (23%) than males (20%). Table 5. Distribution of sample by household income (10,000 yen) and sex (%) 0-299 300-499 500-699 700-999 1000+ Total Male 20.4 24.2 22.0 19.4 14.0 100.0 Female 22.6 24.4 20.1 19.2 13.7 100.0 Total 21.5 24.3 21.0 19.3 13.8 100.0 Table 6 shows the distribution of the respondents by household composition. Here we follow Budlender (2009), categorizing those under 18 years of age as children, those 18 to 49 years of age as adults, and those 50 and over as old. We find that 22% of all respondents belonged to households composed of children and adults, 17% to households comprised of children, adults and elderly persons, 11% to households comprised only of adults, 28% to households with adults and elderly persons, 22% to households comprised only of elderly persons and 1% to households with children and elderly persons. The respondents in this type of household are too small in number to analyze, thus we exclude these households from the following tables. In terms of sex, the percentage of households comprised only of adults is higher for males (13%) than females (8%). The percentage of households comprised only of elderly persons is higher for females (23%) than males (20%). Table 6. Distribution of sample by household composition (%)
Child + Adult
Child + Adult + Old
Adult Adult + Old
Old Child + Old
Total
Male 21.6 16.7 13.0 27.8 20.0 0.9 100.0 Female 21.5 18.1 8.2 28.2 23.2 0.8 100.0
3 In the case of self-employed workers, annual income is operating income, obtained by deducting expenses from sales. Income includes wages, salaries, dividends, allowances and benefits such as pensions, and excludes income from the disposal of assets, and withdrawal of deposits and savings. Non-recurring incomes such as inheritances, gifts and retirement allowances are also excluded. For those who were newly employed during the year, the annual income is estimated as the amount of income which they would have earned if they had worked for a full year, based on their income since the time they were employed.

5
Total 21.5 17.4 10.6 28.0 21.6 0.8 100.0 2. Distribution of time spent on paid and unpaid work by respondent attributes This section analyses the time use of Japanese males and females, concentrating on time allocation in paid and unpaid work, using the micro data from Questionnaire B in the 2001 STULA. Time use analysis can be based on either mean population time or mean actor time. Mean population time is the average of time spent by all persons on a particular activity, including those who did not perform the activity. Mean actor time is the average time spent by persons who actually performed the activity. The participation rate is the number of persons who performed the activity divided by the full population with specified respondent attributes. In the analysis in this section, the daily mean population time will be presented for each of the ten categories of activity by Budlender (2009). We will also present an analysis which classifies the activities into broader categories of paid and unpaid work. We define paid work according to the narrow production boundary of the System of National Accounts (SNA) which includes all kinds of activities in the categories paid work, primary production and non-establishment work.4 We define unpaid care (UCW) as activities in the categories of household maintenance, care of persons and community services. Table 7 shows the daily mean population time spent by males and females on each kind of activity. The time spent on all activities adds up to 1440 minutes (24 hours). The male-female differential is large in respect of time spent on paid work, household maintenance and care of persons. While males spent 337 minutes on paid work, twice as long as females (166 minutes), they spent less than one hour on household maintenance and care of persons combined. Females spent 218 minutes on household maintenance and 26 minutes on care of persons. Mass media use shows the next biggest contrast in time use between males and females, with males spending 17 minutes longer (175 minutes) than females (158 minutes). Table 7. Distribution of activities over the day by sex Male Female Activity category Minutes % Minutes % Paid work 337 23.4% 166 11.5% Non-establishment work 1 0.1% 0 0.0% Household maintenance 45 3.2% 218 15.2% Care of persons 8 0.6% 26 1.8% Community service 5 0.4% 4 0.3% Learning 70 4.9% 67 4.6% Social & cultural 93 6.5% 89 6.2% Mass media use 175 12.1% 157 10.9% Personal care 674 46.8% 682 47.3% Other 31 2.1% 31 2.2% Total 1440 100.0% 1440 100.0% The relevant items in Table 7 are categorized into UCW and SNA work in Table 8. While females spent 17% of the day on UCW and 12% on SNA work, males spent only 4% on the former and approximately one-fourth of the day on the latter.
4 Note that, among the activity categories in the individual data of STULA used in this chapter, there is no item that corresponds to primary production, and only building and repairing falls under the category of non-establishment work.

6
Table 8. Time spent on paid and unpaid work per day by sex Mean minutes per day % of day
Male Female Male Female UCW 59 248 4.1% 17.2% Of which: Care of persons 8 26 0.6% 1.8% SNA work 338 166 23.5% 11.5% Of which: Paid work 337 166 23.4% 11.5% Table 9 shows time spent on UCW and SNA work by sex and age. Females in every age group spent more than males time on UCW, while males spent more time than females on SNA work. Although the male-female differential in SNA work is relatively small among those under 18 years of age, in other age groups males spent approximately twice the amount of time spent by females. As for UCW, the difference in time use is considerable among those between the ages of 18 and 64. Table 9 Time spent on paid and unpaid work by age group and sex (%)
Male Female 10-17 18-49 50-64 65+ 10-17 18-49 50-64 65+ UCW 1.2 3.8 4.2 6.7 2.4 18.7 20.9 17.0 Of which: Care of persons
0.0 0.7 0.4 0.8 0.1 3.0 0.9 0.8
SNA work 0.9 30.3 28.4 10.2 0.4 16.1 14.1 3.9 Of which: Paid work 0.9 30.3 28.3 10.1 0.4 16.1 14.1 3.8 Table 10 shows time spent on UCW and SNA work by sex and marital status. Regardless of marital status, females spent more time on UCW and males spent more time on SNA work. This tendency is especially strong among married males and females. Married males spent 65 minutes (5% of the day) on UCW, while married females spent 344 minutes (24%). Married males spent 398 minutes (28%) on SNA work, while married females spent 167 minutes (12%).

7
Table 10 Time spent on paid and unpaid work by marital status and sex
Male Female
Single Married
Widowed�Divorced Single Married
Widowed�Divorced
Minutes UCW 39 65 107 79 344 203 Of which: Care of persons 1 12 5 2 42 9 SNA work 243 398 236 188 167 120 Of which: Paid work 243 396 235 188 167 120 Percentage of day UCW 2.7% 4.5% 7.5% 5.5% 23.9% 14.1% Of which: Care of persons 0.1% 0.9% 0.4% 0.1% 2.9% 0.6% SNA work 16.9% 27.6% 16.4% 13.0% 11.6% 8.3% Of which: Paid work 16.8% 27.5% 16.3% 13.0% 11.6% 8.3% Table 11 shows time spent on UCW and SNA work by sex and presence of children of different ages. Regardless of the presence and age of children, females spent more time on UCW while males spent more time on SNA work. Those who have children under seven years of age spent much more time, compared with those who have children aged between seven and 17, not only on care of persons, including child care, but also on UCW as a whole, and this applies to both males and females. On the other hand, while females with children aged seven to 17 spent more time on SNA work than those with children under seven years of age, there is little difference among males by age of children. Table 11. Time spent on paid and unpaid work by child status and sex (minutes) Male Female
No children 7-17 <7
No children 7-17 <7
UCW 58 4% 44 3% 83 6% 58 4% 280 19% 433 30%Of which: Care of persons 4 0% 4 0% 36 2% 4 0% 16 1% 129 9% SNA work 292 20% 447 31% 458 32% 292 20% 206 14% 130 9% Of which: Paid work 290 20% 446 31% 457 32% 290 20% 206 14% 130 9% Table 12 shows time spent on UCW and SNA work by sex and employment status. Those who are not employed spent more time on UCW than those employed, and this applies to both males and females. The difference between males and females in the time spent on UCW was about four times in every case, which was much more evident than in the case of SNA work.

8
Table 12 Time spent on paid and unpaid work by work status and sex Male Female
Employed Not employed Employed
Not employed
Minutes UCW 53 74 218 277 Of which: Care of persons 9 7 16 35 SNA work 472 9 334 6 Of which: Paid work 471 8 333 6 Percentage of day UCW 3.7 5.2 15.2 19.2 Of which: Care of persons 0.6 0.5 1.1 2.4 SNA work 32.8 0.6 23.2 0.4 Of which: Paid work 32.7 0.6 23.2 0.4
Table 13 shows time spent on UCW and SNA work by sex and household income. Regardless of annual income, females spent more time on UCW and males spent more time on SNA work. There is a tendency for both males and females to spend less time on UCW and more time on SNA work as their household income increases. However, this tendency is not observed in respect of care of persons, such as child care and elderly care. Table 13 Time spent on paid and unpaid work by household income and sex (minutes) 0-299 300-499 500-699 700-999 1000+ Male UCW 72 73 51 50 45 Of which: Care of persons 6 12
9 8 4
SNA work 240 332 364 379 393 Of which: Paid work 239 331 363 379 393 Female UCW 242 276 247 235 232 Of which: Care of persons 18 38
26 27 16
SNA work 152 159 152 188 198 Of which: Paid work 152 159 152 188 197
Table 14 shows time spent on UCW and SNA work by sex and household composition. Regardless of household composition, females spent more time on UCW and males spent more time on SNA work. Males spent the least time on UCW when they belonged to a three-generation household (47 minutes), while females spent the least time on UCW when they belonged to a household composed only of adults (191 minutes). Both adult males and females who co-resided only with one or more children spent more time on UCW than those who also co-resided with old persons. This suggests that they may share time spent on household maintenance and child care with the older generation through co-residence with them.
9
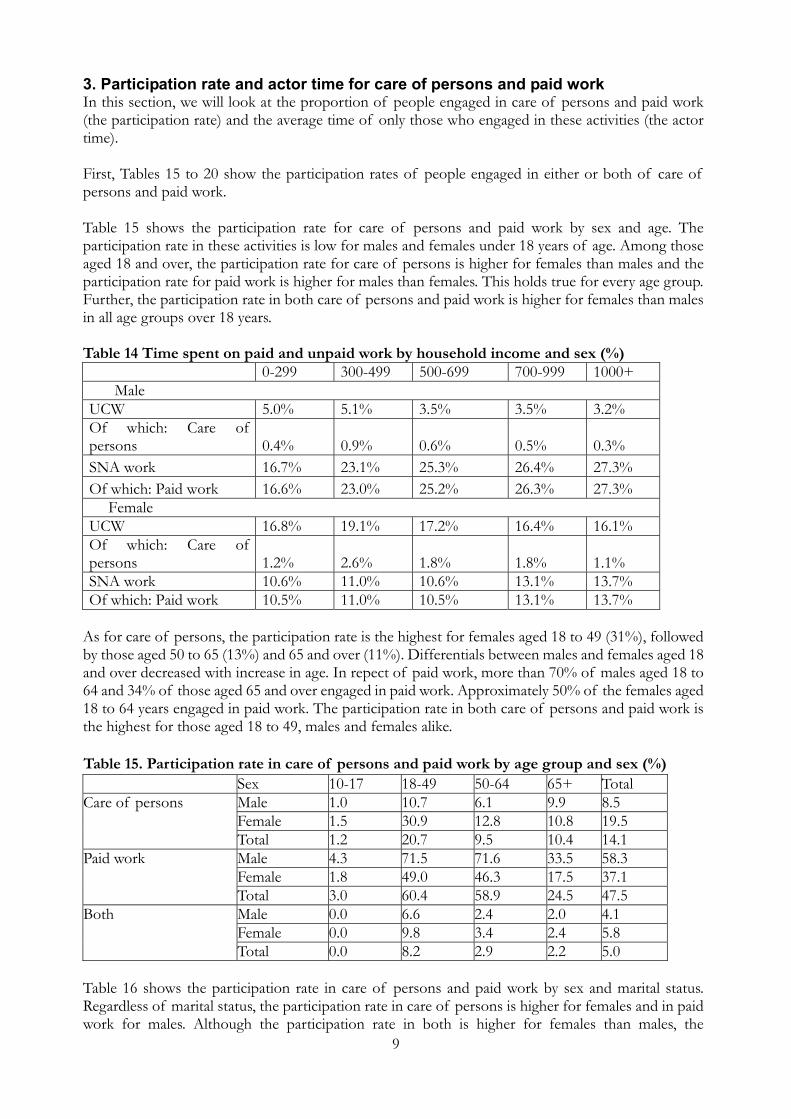
3. Participation rate and actor time for care of persons and paid work In this section, we will look at the proportion of people engaged in care of persons and paid work (the participation rate) and the average time of only those who engaged in these activities (the actor time). First, Tables 15 to 20 show the participation rates of people engaged in either or both of care of persons and paid work. Table 15 shows the participation rate for care of persons and paid work by sex and age. The participation rate in these activities is low for males and females under 18 years of age. Among those aged 18 and over, the participation rate for care of persons is higher for females than males and the participation rate for paid work is higher for males than females. This holds true for every age group. Further, the participation rate in both care of persons and paid work is higher for females than males in all age groups over 18 years. Table 14 Time spent on paid and unpaid work by household income and sex (%) 0-299 300-499 500-699 700-999 1000+ Male UCW 5.0% 5.1% 3.5% 3.5% 3.2% Of which: Care of persons 0.4% 0.9% 0.6% 0.5% 0.3% SNA work 16.7% 23.1% 25.3% 26.4% 27.3% Of which: Paid work 16.6% 23.0% 25.2% 26.3% 27.3% Female UCW 16.8% 19.1% 17.2% 16.4% 16.1% Of which: Care of persons 1.2% 2.6% 1.8% 1.8% 1.1% SNA work 10.6% 11.0% 10.6% 13.1% 13.7% Of which: Paid work 10.5% 11.0% 10.5% 13.1% 13.7%
As for care of persons, the participation rate is the highest for females aged 18 to 49 (31%), followed by those aged 50 to 65 (13%) and 65 and over (11%). Differentials between males and females aged 18 and over decreased with increase in age. In repect of paid work, more than 70% of males aged 18 to 64 and 34% of those aged 65 and over engaged in paid work. Approximately 50% of the females aged 18 to 64 years engaged in paid work. The participation rate in both care of persons and paid work is the highest for those aged 18 to 49, males and females alike. Table 15. Participation rate in care of persons and paid work by age group and sex (%) Sex 10-17 18-49 50-64 65+ Total
Male 1.0 10.7 6.1 9.9 8.5 Female 1.5 30.9 12.8 10.8 19.5
Care of persons
Total 1.2 20.7 9.5 10.4 14.1 Male 4.3 71.5 71.6 33.5 58.3 Female 1.8 49.0 46.3 17.5 37.1
Paid work
Total 3.0 60.4 58.9 24.5 47.5 Male 0.0 6.6 2.4 2.0 4.1 Female 0.0 9.8 3.4 2.4 5.8
Both
Total 0.0 8.2 2.9 2.2 5.0 Table 16 shows the participation rate in care of persons and paid work by sex and marital status. Regardless of marital status, the participation rate in care of persons is higher for females and in paid work for males. Although the participation rate in both is higher for females than males, the

10
male-female differential is smaller for single people than for married and widowed or divorced. The participation rate in care of persons is highest for those who are married, for males and females alike. Further, the participation rate in both care of persons and paid work is highest for those who are married, for males and females alike. Table 16. Participation rate in care of persons and paid work by marital status and sex (%)
Sex Single Married Widowed/Divorced Total
Male 1.1 12.6 5.9 8.5 Female 2.5 30.3 10.4 19.5
Care of persons
Total 1.7 21.3 9.3 14.1 Male 43.0 67.9 42.3 58.4 Female 35.9 40.2 27.4 37.1
Paid work
Total 39.6 54.3 31.2 47.5 Male 0.3 6.5 0.9 4.1 Female 0.8 8.7 4.2 5.8
Both
Total 0.5 7.6 3.4 5.0 Table 17 shows the participation rate in care of persons and paid work by sex, presence of children under 18 years of age and the age of the children. Regardless of the presence and age of children, the participation rate in care of persons is higher for females and paid work for males. The participation rate in both is slightly higher for males (21%) than females (19%) when they have children under seven years of age, but for those with children aged seven to 17, the rate is much higher for females (11%) than males (2%). When females live with small children who need care, the participation rate in paid work becomes lower and the participation rates in care of persons as well as in both become higher. The participation rate in care of persons or both also becomes higher for males when they live with children under seven years of age. Table 17. Participation rate in care of persons and paid work by child status and sex (%) Sex No children 7-17 <7 Total
Male 4.1 4.9 34.4 8.5 Female 7.4 23.9 72.3 19.5
Care of persons
Total 5.8 14.9 54.0 14.1 Male 53.0 72.3 68.5 58.3 Female 35.8 48.5 29.9 37.1
Paid work
Total 44.3 59.7 48.6 47.5 Male 1.4 1.5 20.8 4.1 Female 1.9 10.0 19.4 5.8
Both
Total 1.7 6.0 20.0 5.0 Table 18 shows the participation rate in care of persons and paid work by sex and employment status. Regardless of employment status, the participation rate in care of persons is higher for females, and in paid work is higher for males and in both it is higher for females. The participation rate in care of persons is the highest for females who are not employed (22%). The participation rate is lower for males even when they are not employed (6%) and higher for those employed (9%). The male-female differential in the participation rate in paid work is smaller than for care of persons and both.

11
Table 18. Participation rate in care of persons and paid work by work status and sex (%)
Sex Employed Not employed Total Male 9.4 6.2 8.5 Female 16.6 22.3 19.5
Care of persons
Total 12.4 16.7 14.1 Male 80.4 4.0 58.3 Female 73.0 3.0 37.1
Paid work
Total 77.3 3.3 47.5 Male 5.7 0.2 4.1 Female 11.4 0.5 5.8
Both
Total 8.1 0.4 5.0 Table 19 shows the participation rate in care of persons and paid work by sex and household income. Regardless of income, the participation rate in care of persons is higher for females and paid work for males. The participation rate in both is higher for females except for those with an income of three million to 4.99 million yen. The participation rate in care of persons is low when the annual income is below three million yen, for males and females alike. Above that income level, the rate decreases as annual income increases. Both males and females tend to engage more in paid work as their annual income increases. This tendency can be explained as household income rising with an increase in paid work. Table 19. Participation rate in care of persons and paid work by household income and sex (%) Sex 0-299 300-499 500-699 700-999 1000+ Total
Male 6.6 12.9 8.7 7.8 4.6 8.6 Female 14.3 25.6 23.2 18.9 13.9 19.7
Care of persons
Total 10.7 19.4 15.8 13.4 9.3 14.2 Male 46.2 58.1 60.6 62.1 67.9 58.4 Female 35.3 35.5 36.8 41.1 40.1 37.4
Paid work
Total 40.4 46.6 49.0 51.4 53.9 47.7 Male 3.4 6.3 4.2 3.8 2.1 4.2 Female 4.8 6.1 7.7 7.2 3.4 6.0
Both
Total 4.1 6.2 5.9 5.6 2.7 5.1 Table 20 shows the participation rate in care of persons and paid work by sex and household composition. Regardless of household composition, the participation rate in care of persons is higher for females, the participation rate in paid work is higher for males and the participation rate in both is higher for females. The only exception iss households composed only of old persons, in which the participation rate in both is equal for males and females (2%). The participation rates in care of persons and in both is higher for those who belong to households with children for males and females alike. However, although the male-female differential in the participation rate in both care of persons and paid work is small in the case of child + adult households, the differential widens for those who belong to households which also have elderly persons. In the case of three-generation households, the burden of child care seems to be somewhat lightened, especially for males.

12
Table 20. Participation rate in care of persons and paid work by household composition and sex (%)
Sex Child + Adult
Child + Adult + Old Adult
Adult + Old Old Total
Male 18.2 10.2 2.4 3.5 7.3 8.5 Female 47.0 23.3 7.2 7.1 10.5 19.5
Care of persons
Total 32.9 17.2 4.3 5.3 9.0 14.1 Male 58.7 51.7 65.4 65.8 49.3 58.3 Female 28.9 34.5 51.2 46.9 29.8 37.1
Paid work
Total 43.5 42.5 59.7 56.0 38.6 47.5 Male 11.1 4.4 1.6 1.3 2.1 4.1 Female 12.9 8.8 2.9 2.1 2.1 5.8
Both
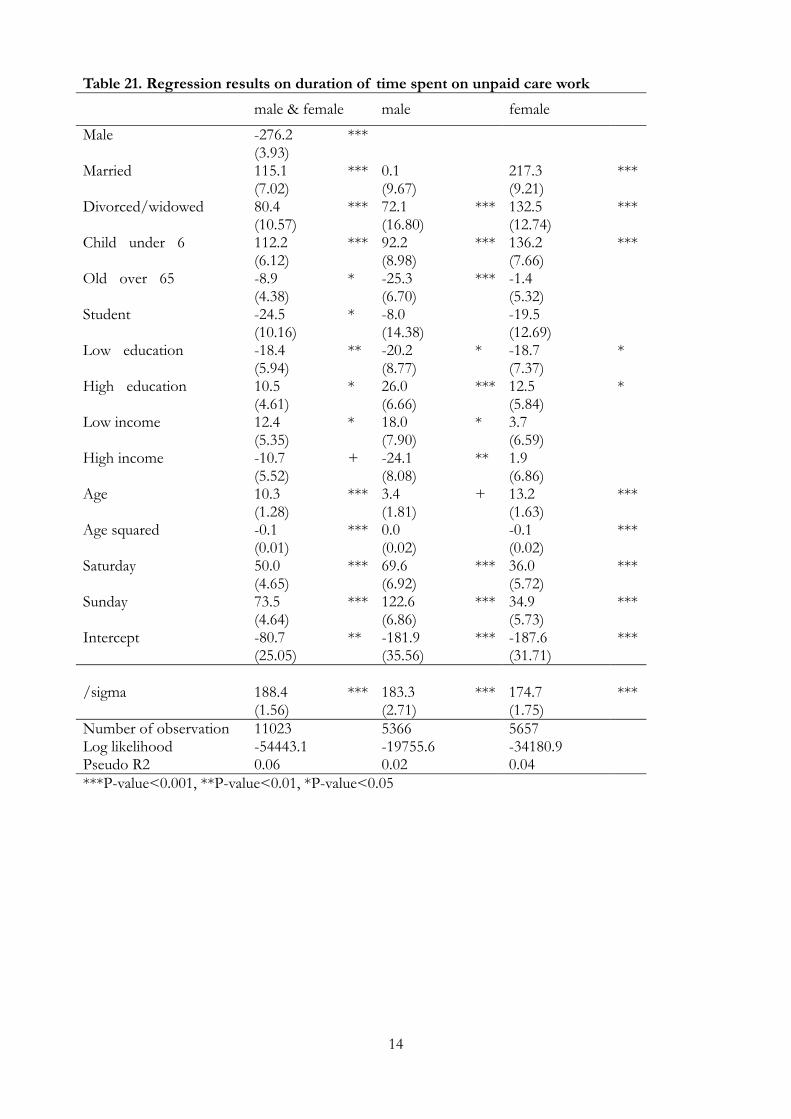
Total 12.0 6.8 2.1 1.7 2.1 5.0 4. Regression analysis Table 21 shows coefficients and standard errors of a regression analysis conducted on unpaid care work (UCW). The subjects of analysis were males and females between the ages of 15 and 64. As an econometric model, we set up three models, male, female and male & female and ran a Tobit estimation. We include in the regression cases in which time spent on care of persons is 0. As demographic explanatory variables, we used the dummy variables of sex, co-residing with a child aged under six, and co-residing with an elderly person aged 65 or over, the category variable of marital status, and age and the square of age. For marital status, we observed the effect of married and divorced/widowed, using single as reference category. As socio-economic explanatory variables, we used the category variables of being a student, educational achievement, and household income, and the variable of the day of the week for which the survey was conducted. For academic achievement, we observed the effect of university, junior college and junior high school, using high school as reference category. The analysis shows that for marital status, the time spent on UCW becomes significantly longer for those who are married in the case of females, but this effect is not observed for males. Further, living with children under six years of age significantly lengthens the time spent on UCW of both males and females. In contrast, living with elderly persons aged 65 years and over significantly shortens the time spent on UCW in the case of males, but has no significant effect for females. As for education and household income, while the time spent on UCW become longer for both males and females as their educational standard rises, it is shortened only for males when household income increases. Table 22 shows the result of an analysis focusing on the time spent on care of persons, conducted using the same method as for UCW above. The male & female model shows that the time spent on care of persons is significantly shortened for males. Further, time spent on care of persons is longer for those married and divorced/widowed in comparison with single people. Time spent on care of persons also becomes longer when living with children or the elderly. These results are similar to those produced by the separate analyses by gender. For education, household income and days of the week, results of the analyses differ between males and females. For education, while no significant effect was observed for males, time spent on care of persons becomes significantly longer for females when their educational achievement is high. In contrast, for household income, while no significant effect was observed for females, time spent on care of persons becomes significantly shorter for males when

13
their income is high. Additionally, while no significant difference for care of persons was observed between weekdays and weekends in the case of females, time spent on care of persons becomes significantly longer for weekends compared with weekdays in the case of males. Table 23 shows the result of a Tobit estimation of time spent on child care, conducted using the same method as the above analyses. Here the targets of analysis were males and females living with children under ten years of age.5 Variables used were single parent (dummy variable), the age of the youngest child, education (category variable), household income (category variable), Saturday/Sunday (category variable), number of children under ten years of age, number of members of household aged ten and over, and employment status (dummy variable). Single parents are defined as those who are unmarried and have children under 10 years of age. Single mothers spend significantly less time on child care than do married mothers. Time spent on child care becomes longer for both males and females when they are highly educated. Household income does not have a significant effect. As for days of the week, while time spent on child care becomes longer on Saturday/Sunday for males, it becomes shorter for females. With regard to the characteristics of children, while time spent on child care decreases as the age of the youngest child increases, no significant effect of the number of children aged under ten years was observed on time spent. Time spent on child care decreases when the number of household members aged ten and over increases, which suggests that an increase in the number of household members capable of performing child care shortens time spent on that activity for individuals. Finally, as expected, time spent on child care decreases for both males and females when they are working.
5 In order to obtain large enough samples for the analysis, we targeted children under ten years of age rather than six years of age.
14
Table 21. Regression results on duration of time spent on unpaid care work
male & female male female Male -276.2 *** (3.93) Married 115.1 *** 0.1 217.3 *** (7.02) (9.67) (9.21) Divorced/widowed 80.4 *** 72.1 *** 132.5 *** (10.57) (16.80) (12.74) Child under 6 112.2 *** 92.2 *** 136.2 *** (6.12) (8.98) (7.66) Old over 65 -8.9 * -25.3 *** -1.4 (4.38) (6.70) (5.32) Student -24.5 * -8.0 -19.5 (10.16) (14.38) (12.69) Low education -18.4 ** -20.2 * -18.7 * (5.94) (8.77) (7.37) High education 10.5 * 26.0 *** 12.5 * (4.61) (6.66) (5.84) Low income 12.4 * 18.0 * 3.7 (5.35) (7.90) (6.59) High income -10.7 + -24.1 ** 1.9 (5.52) (8.08) (6.86) Age 10.3 *** 3.4 + 13.2 *** (1.28) (1.81) (1.63) Age squared -0.1 *** 0.0 -0.1 *** (0.01) (0.02) (0.02) Saturday 50.0 *** 69.6 *** 36.0 *** (4.65) (6.92) (5.72) Sunday 73.5 *** 122.6 *** 34.9 *** (4.64) (6.86) (5.73) Intercept -80.7 ** -181.9 *** -187.6 *** (25.05) (35.56) (31.71) /sigma 188.4 *** 183.3 *** 174.7 *** (1.56) (2.71) (1.75) Number of observation 11023 5366 5657 Log likelihood -54443.1 -19755.6 -34180.9 Pseudo R2 0.06 0.02 0.04 ***P-value<0.001, **P-value<0.01, *P-value<0.05

15
Table 22. Regression results on duration of time spent on care of persons: males and females aged 15-64
male & female male female Male -102.0 *** (5.87) Married 193.1 *** 140.3 *** 223.1 *** (13.47) (21.40) (17.02) Divorced/widowed 145.2 *** 89.7 ** 181.4 *** (17.91) (34.24) (21.29) Child under 6 227.5 *** 228.0 *** 234.9 *** (7.68) (13.73) (9.23) Old over 65 -3.6 -11.0 3.8 (6.36) (11.67) (7.45) Student -29.4 -36.4 -17.1 (20.27) (32.61) (25.74) Low education 14.8 + 22.8 9.4 (8.43) (14.34) (10.12) High education 25.9 *** 14.3 34.1 *** (6.31) (10.87) (7.64) Low income -7.3 -7.1 -6.8 (8.12) (14.22) (9.64) High income -13.3 -26.3 + -8.4 (8.23) (14.46) (9.82) Age 0.1 -4.8 3.8 (2.04) (3.38) (2.52) Age squared 0.0 0.1 -0.1 * (0.02) (0.04) (0.03) Saturday 23.5 *** 74.4 *** -0.1 (6.69) (12.39) (7.87) Sunday 40.8 *** 119.5 *** -2.1 (6.64) (12.21) (7.94) Intercept -329.7 *** -370.3 *** -395.0 *** (41.00) (68.18) (51.21) /sigma 177.9 *** 187.6 *** 167.9 *** (3.26) (6.40) *** (3.64) *** Number of observation 11023 5366 5657 Log likelihood -14515.7 -4700.4 -9731.5 Pseudo R2 0.09 0.08 0.09
(__): standard error ***P-value<0.001, **P-value<0.01, *P-value<0.05, +…P-value<0.1

16
Table 23. Regression results on duration of time spent on child care: co-residence with own child aged under ten
male female Single parent 5.7 -53.8 + (80.5) (30.7) age of youngest child -28.2 *** -26.6 *** (3.4) (2.0) low education 24.8 -49.9 * (31.4) (21.6) high education 37.5 * 21.5 * (15.2) (9.9) low income -34.2 -11.1 (23.2) (14.9) high income 4.8 -4.4 (32.6) (20.4) Saturday 32.3 + -28.1 * (19.2) (11.8) Sunday 46.3 * -62.5 *** (20.5) (12.2) Working -122.5 *** -67.4 *** (17.0) (12.1) number of people<10 3.4 -3.6 (10.8) (7.5) number of people>=10 -36.6 ** -12.7 * (11.0) (6.1) Intercept 143.2 *** 264.5 *** (38.6) (23.4) /sigma 130.1 *** 153.9 ***
(3.84) (7.30) (__): standard error ***P-value<0.001, **P-value<0.01, *P-value<0.05, + P-value<0.1

17
5. Review of the analysis From the results of the analysis presented above, we observe the following tendencies in time spent on paid and unpaid work and participation in these activities. Females spent more time on unpaid work and males on paid work, regardless of their age, marital status, presence of children, age of children, employment status, household income or household composition. Time spent on care of persons was significantly shorter for males than females even after controlling for their attributes, which is confirmed by the result of the regression analysis. Further, the participation rate in care of persons was higher for females, and the participation rate in paid work was higher for males. Examining the different attributes, we see that the male-female differential was small among those aged under 18 years of age. In terms of marital status, the tendency for females to spend more time on UCW and males on SNA work was prominent among those who are married. Significantly more time was spent on care of persons by the married and divorced/widowed, which is confirmed by the result of the regression analysis. As for UCW, the time spent on this becomes significantly longer for married females, but this effect was not observed among males. The result of the analysis in terms of the presence of children aged under 18 years and the age of children was that both males and females spent more time on UCW and care of persons, and participated more in care of persons when they have children under seven years of age than when they have children aged seven to 17. The participation rate in both paid work and care of persons was almost the same for those with older children as for males and females with children under seven years of age. Both males and females who are not employed spent more time on UCW compared to those who are employed. The male-female differential in time spent on UCW was about four in each case, and larger than the differential in time spent on SNA work. The participation rate in care of persons was the highest for females who are not employed. This rate was lower for males even when they are not employed and somewhat higher among those who are employed. Although both males and females showed a tendency to spend less time on UCW as their income increased, there was no such tendency observed in child care and elderly care. The participation rate in care of persons was low among those whose annual income is less than three million yen, for males and females alike, but above that income level the participation rate decreased as annual income increased. In the regression analysis no significant effect was observed among females for household income, but time spent on care of persons and UCW was significantly shortened for males when their income was high. Both males and females spent more time on UCW and care of persons when they have one or more children. The time was shortest for males when they belonged to a three-generation household. Although the male-female differential in the participation rate in both care of persons and paid work is small for child + adult households, the differential is larger when there are also elderly persons. The regression analysis shows that both males and females spent significantly more time on care of persons when they co-resided with children or elderly persons. Further, co-residing with children under six years of age significantly lengthened the time spent on UCW for both males and females, and co-residing with elderly persons aged 65 or over significantly shortened the time spent on UCW by males, but no significant effect was observed among females. From these results, we can consider that three-generation households reduce the burden of child care on males through the older people assuming some of the UCW burden, rather than reducing the UCW burden of females.

18
II. Trends in the daily provision of child care and elderly care and the influence of policy in Japan: An analysis of time use survey data In this second half of this paper we examine how the amount of time Japanese men and women spent in child care and elderly care has changed between 1986 and 2006. Furthermore, we discuss how these changes may have been influenced by child care and elderly care policy in this period. In the following analysis, we use the data from Questionnaire A for 1986 to 2006 as these data retain the conventional precoding survey method, allowing comparison of more recent surveys with past ones. 1. Time spent on child care In this section, we first draw on comparative data to establish the special characteristics of Japan regarding time spent on child care for families with at least one child. Next, we examine long-term changes in the amount of time spent in caring for children under six years of age by sex of carer, household type and mother’s employment status. 1.1. An international comparison of daily time use by mothers and fathers with children Table 24 shows a twelve-country6 comparison of daily time use by married couples with at least one child aged six or under (given as the weekly average for each of the categories in the original data). The Japanese data are limited to those with children aged 0 to 5. Activities are divided into the following five categories: personal care, employment and related travel, domestic work, child care, leisure, study and others. The time taken up by these activities adds up to 1440 minutes (24 hours) per day. (Due to small errors resulting from the re-coding of international data into the above five categories, there are cases where the total time spent on the activities amounts to slightly more or less than 1440 minutes). In Japan’s case, while no major differences are observed between the male and female partners in the couples in time used concerning “personal care” and “leisure, study and others,” this is not the case with “employment and related travel,” “domestic work” and “child care.” Compared with mothers, fathers put five times more time into employment and related travel (517 minutes against 103), whereas fathers’ involvement in domestic work pales besides that of mothers (27 minutes against 258). The differential is also large in child care, where fathers spend 33 minutes against the 189 minutes spent by mothers in this activity. Placing these figures in a comparative context, we find that only German and Hungarian mothers spend less time in employment and related travel than their Japanese counterparts. Japanese mothers spend more time on housework than mothers in all other countries except Hungary, while they top the twelve-country list for time spent in child care. Among the countries included in the comparison, Japanese fathers invested most time in employment and related travel, but they devoted the least time on domestic work; child care; and leisure, study and others. Hence, by observing daily time use patterns, we find that among the twelve countries examined gender-based segregation of activities is most salient in Japan.
6 The analysis is conducted on twelve countries for which we could obtain comparable data.

19
Table24. Twelve-country comparison of daily time use among married couples with at least one child aged six or under (daily time use refers to weekly averages, and only couples with children under the age of six are included in the Japanese data)
Mothers
Sleep, Personal care and Meals
Work and Related travel
Housework,Caring and Shopping 1)
Child care Leisure, Study and Others 2)
BEL 648 158 206 114 314 EST 623 133 236 159 289 FIN 627 148 198 154 311 FR 699 146 225 117 253 GER 651 81 218 138 352 HU 641 102 260 176 262 NOR 602 152 181 137 354 SLV 603 200 210 143 284 SW 630 153 184 130 343 UK 620 133 219 142 325 US 604 174 203 168 282
Married couple with
youngest child
aged 0-6
JP 620 103 258 189 270
Fathers BEL 633 287 107 51 361 EST 630 299 96 50 365 FIN 607 339 100 63 331 FR 688 329 99 40 284 GER 618 305 105 59 353 HU 636 321 83 71 329 NOR 581 321 107 73 346 SLV 601 369 81 56 334 SW 597 318 122 67 336 UK 600 373 92 60 315 US 572 435 98 70 260
Married couple with
youngest child
aged 0-6
JP 605 517 27 33 259 1) Definition of "Housework" follows STULA.. "Caring" does not include child care. 2)"Others" refers to hobbies, entertainment, volunteer activities and travel. Source: European countries(1998 - 2002); Harmonised European Time Use Surveys (European Communities) Japan(2006); Survey on Time Use and Leisure Activities (Ministry of Internal Affairs and Communications) US(2003); American Time Use Survey (U.S. Bureau of Labor Statistics)
1.2. Changes in time spent on child care for mothers and fathers Next, we take a look at the change in time spent on child care by individuals in households with children in Japan. Table 25 shows daily time use data for households consisting of a married couple and at least one child under the age of six. From this we can see that over time both sexes are directing

20
more time towards child care. Mothers increased their involvement in this category by 41 minutes and fathers by 23 minutes. Despite the increase in fathers’ involvement in child care, the larger increase on the part of mothers resulted in the male-female differential growing from 137 minutes in 1986 to 155 minutes in 2006. In contrast to child care, mothers’ involvement in domestic work and fathers’ work engagement both saw a decrease, the former shrinking by 46 minutes (from 302 minutes in 1986 to 256 minutes in 2006), and the latter diminishing by 29 minutes (from 542 minutes in 1986 to 513 minutes in 2006). Following from the trend towards increased participation by fathers in both domestic work and child care, the male-female differential for participation in unpaid work shrank from 428 minutes in 1986 (when mothers participated for 448 minutes and fathers for 20 minutes) to 394 minutes in 2006 (when mothers participated for 452 minutes and fathers for 58 minutes). Table25. Trends in daily time use by mothers and fathers with at least one child under the age of six (1986-2006)
Sleep, Personal care and Meals
Work and Related travel
Housework,Caring* andShopping
Child care
Leisure, Study and Others
Mothers 1986 608 122 302 146 260 1991 601 109 300 162 266 1996 617 92 292 159 279 2001 615 88 275 180 282 2006 621 109 256 187 265
Fathers
1986 602 542 11 9 277 1996 604 508 20 17 291 2001 601 512 23 25 277 2006 607 513 26 32 260
* “caring” does not include child care. Note: 1991 data for fathers could not be retrieved. Source: STULA 1.3. Changes in time spent on child care for different household types In this section we examine how time used in child care has changed over time according to type of household. The two types we distinguish between are two-generation and three-generation households (where parents and children co-reside with one or more grandparent). Figure 1, which is based on data from the STULA surveys, shows how the relative share of these household types has changed between 1986 and 2006.7 Simply put, households consisting only of parents and children have increased (from 74.8 percent in 1986 to 87.7 percent in 2006) while three-generation households have seen a substantial decrease (from 25.2 percent to 12.3 percent). This trend is borne out by other surveys as well, and it applies to the whole of Japan. For example, the percentage of three-generation households with children aged under 18 years was 27.0% in 1986 but only 21.3% in 2006 (Ministry of Health, Labour and Welfare, 1986, 2006). Figure1. Changes in the relative share of two-generation and three-generation households
7 These data do not specify which parents of a married couple are co-residing in the family domicile.

21
with children under the age of six between 1986 and 2006 (STULA)
0%
10%
20%
30%
40%
50%
60%
70%
80%
90%
100%
1986 1996 2001 2006
Household consisting of a couple with child(ren) andgrandparent(s)Household consisting of a couple with child(ren)
Source: STULA Table 26 shows time use data for fathers8 of families with children under the age of six according to family type between 1986 and 2006. The data shows no significant difference in time spent in child care between fathers in two-generation and three-generation households. Those in the former spend a mere two to five minutes more taking care of children than those in the latter. No notable difference between fathers in these two types of families appears even if we consider changes over time. There are nevertheless disparities in the distribution of time use between these two groups: compared with two-generation families, fathers in three-generation households enjoy more personal care and leisure, study and other time even as they spend less time on child care, domestic work and paid work.
8 “Father” means the father of children, not a grandfather in a three-generation household.

22
Table26. Time use distribution of fathers in families with at least one child below six years of age by type of household (1986-2006)
Sleep, Personal care and Meals
Work and Related travel
Housework,Caring* andShopping
Child care
Leisure, Study and Others
total 1986 602 542 11 9 277 1996 604 508 20 17 291 2001 601 512 23 25 277 2006 607 513 26 32 260
Fathers in two-generation households: couple with child(ren)
1986 599 542 12 9 278 1996 601 510 20 18 292 2001 601 514 23 25 278 2006 605 517 27 33 259 Fathers in three-generation households: couple with child(ren) and
grandparent(s) 1986 611 537 9 7 275 1996 612 503 18 15 290 2001 611 501 19 22 289 2006 623 498 23 27 270
* “caring” does not include child care. Note: 1991 data for fathers could not be retrieved. Source: STULA Table 27 describes in similar fashion the time used by mothers9 in child care between 1986 and 2006 according to type of household. Compared to their peers in two-generation households, mothers in three-generation households spent between eight to 23 minutes less in child care over this period. Although in 1986 this gap was still small (149 against 141 minutes), child care participation by mothers in two-generation families grew significantly thereafter, leading to a greater difference between the two groups (189 against 172 minutes in 2006). As for time spent in paid work, mothers in three-generation households spent more time working than mothers living with their husband and children only, but this gap is shrinking (with the former working 154 minutes and the latter 103).
9 “Mother” means the mother of children, not a grandmother in a three-generation household.

23
Table27. Time use distribution of mothers in families with at least one child under the age of six by type of household (1986-2006)
Sleep, Personal care and Meals
Work and Related travel
Housework,Caring* andShopping
Child care
Leisure, Study and Others
Total 1986 608 122 302 146 260 1991 601 109 300 162 266 1996 617 92 292 159 279 2001 615 88 275 180 282 2006 621 109 256 187 265
Mothers in two-generation households: Couple with child(ren)
1991 602 86 306 167 277 1996 616 77 295 163 289 2001 614 80 278 183 285 2006 620 103 258 189 270
Mothers in three-generation households: Couple with child(ren) and grandparent(s)
1991 606 184 281 145 225 1996 621 157 279 140 241 2001 620 135 262 167 257 2006 625 154 245 172 246
* “caring” does not include child care. Source: STULA 1.4. Changes in time spent on child care by mother’s employment status Next, we examine changes in time spent in child care by mothers according not only to type of household but also labor force participation. To this end, Figure 2 illustrates how the employment rate of mothers has changed according to type of household using STULA data. While the overall female rate of employment decreased between 1986 and 1996, it increased thereafter. The employment rate for mothers in three-generation households was higher (by between 18 to 25 percentage points) than that for mothers living with only the husband and children throughout the observed period, but this difference is shrinking. All of these trends have also been detected by other surveys.

24
Figure2. Labor force participation of mothers with at least one child under the age of six by type of household (1986-2006)
0%
10%
20%
30%
40%
50%
60%
70%
80%
90%
100%
1986 1991 1996 2001 2006
Total
With child(ren)
With child(ren)andgrandparent(s)
Source: STULA Table 28 demonstrates how the time use of mothers with at least one child under the age of six has changed according to type of household and employment (two-generation vis-à-vis three-generation households, employed vis-à-vis non-employed mothers). We can see from this that time spent on child care has increased across all of these types. From 1986 to 2001, it was non-employed mothers in three-generation households who spent most time in child care, but in 2006 they were overtaken by non-employed mothers in two-generation families. No significant differences in time spent on child care are observed between employed mothers according to type of family (with the exception of 1996 when 100 minutes was spent by mothers in two-generation households against 79 minutes by mothers in three-generation households). Looking at overall time use, non-employed mothers spend relatively more time on child care, domestic work and leisure and related activities than their employed peers, regardless of family type.

25
Table 28. Time use distribution of mothers with one or more children under the age of six according to household type and employment status (1986-2006)
Sleep, Personal care and Meals
Work and Related travel
Housework,Caring* andShopping
Child care
Leisure, Study and Others
Total Employed
1986 602 318 229 84 206 1991 596 283 243 99 220 1996 612 268 232 94 233 2001 611 244 225 112 250 2006 618 260 208 128 224
Not employed 1986 612 4 345 185 294 1991 606 2 337 200 295 1996 619 1 323 192 304 2001 617 2 303 218 299 2006 622 1 291 230 295
Mothers in two-generation households: Couple with child(ren) Employed
1991 591 261 252 102 236 1996 609 253 237 100 241 2001 612 237 228 112 252 2006 618 259 209 128 228
Not employed 1986 612 4 344 179 301 1991 606 1 334 198 300 1996 619 1 320 190 307 2001 615 2 302 218 301 2006 622 1 290 230 299
Mothers in three-generation households: Couple with child(ren) and grandparent(s)
Employed 1991 602 327 227 92 191 1996 621 309 220 79 211 2001 611 273 212 112 233 2006 623 265 205 129 218
Not employed 1986 611 8 350 212 259 1991 610 4 372 212 263 1996 620 4 339 202 275 2001 629 1 310 222 277 2006 627 2 299 227 284
* “caring” does not include child care.
26
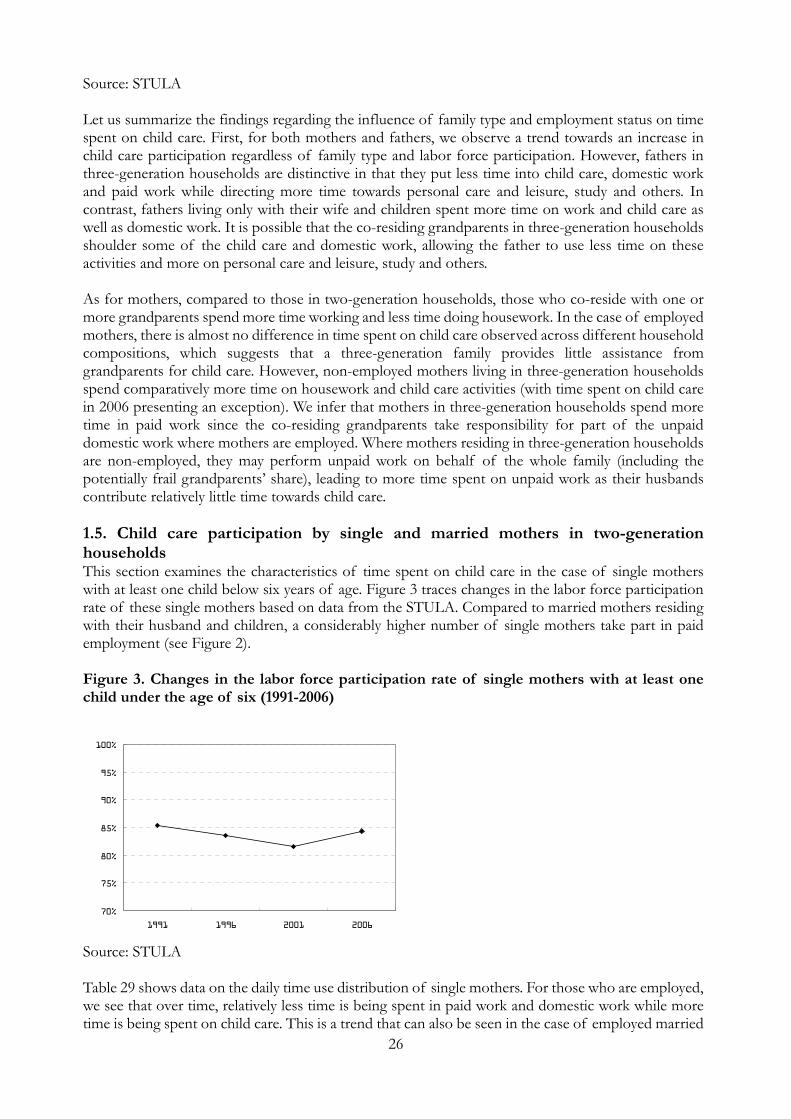
Source: STULA Let us summarize the findings regarding the influence of family type and employment status on time spent on child care. First, for both mothers and fathers, we observe a trend towards an increase in child care participation regardless of family type and labor force participation. However, fathers in three-generation households are distinctive in that they put less time into child care, domestic work and paid work while directing more time towards personal care and leisure, study and others. In contrast, fathers living only with their wife and children spent more time on work and child care as well as domestic work. It is possible that the co-residing grandparents in three-generation households shoulder some of the child care and domestic work, allowing the father to use less time on these activities and more on personal care and leisure, study and others. As for mothers, compared to those in two-generation households, those who co-reside with one or more grandparents spend more time working and less time doing housework. In the case of employed mothers, there is almost no difference in time spent on child care observed across different household compositions, which suggests that a three-generation family provides little assistance from grandparents for child care. However, non-employed mothers living in three-generation households spend comparatively more time on housework and child care activities (with time spent on child care in 2006 presenting an exception). We infer that mothers in three-generation households spend more time in paid work since the co-residing grandparents take responsibility for part of the unpaid domestic work where mothers are employed. Where mothers residing in three-generation households are non-employed, they may perform unpaid work on behalf of the whole family (including the potentially frail grandparents’ share), leading to more time spent on unpaid work as their husbands contribute relatively little time towards child care. 1.5. Child care participation by single and married mothers in two-generation households This section examines the characteristics of time spent on child care in the case of single mothers with at least one child below six years of age. Figure 3 traces changes in the labor force participation rate of these single mothers based on data from the STULA. Compared to married mothers residing with their husband and children, a considerably higher number of single mothers take part in paid employment (see Figure 2). Figure 3. Changes in the labor force participation rate of single mothers with at least one child under the age of six (1991-2006)
70%
75%
80%
85%
90%
95%
100%
1991 1996 2001 2006
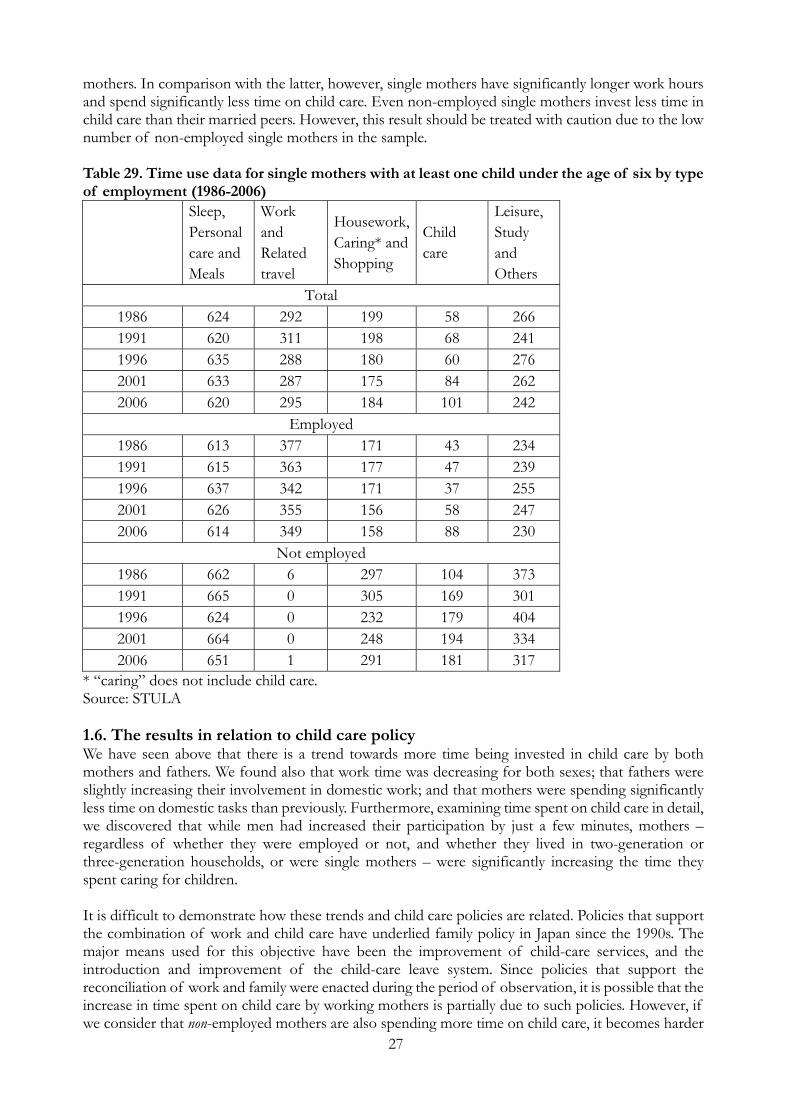
Source: STULA Table 29 shows data on the daily time use distribution of single mothers. For those who are employed, we see that over time, relatively less time is being spent in paid work and domestic work while more time is being spent on child care. This is a trend that can also be seen in the case of employed married
27
mothers. In comparison with the latter, however, single mothers have significantly longer work hours and spend significantly less time on child care. Even non-employed single mothers invest less time in child care than their married peers. However, this result should be treated with caution due to the low number of non-employed single mothers in the sample. Table 29. Time use data for single mothers with at least one child under the age of six by type of employment (1986-2006)
Sleep, Personal care and Meals
Work and Related travel
Housework,Caring* andShopping
Child care
Leisure, Study and Others
Total 1986 624 292 199 58 266 1991 620 311 198 68 241 1996 635 288 180 60 276 2001 633 287 175 84 262 2006 620 295 184 101 242
Employed 1986 613 377 171 43 234 1991 615 363 177 47 239 1996 637 342 171 37 255 2001 626 355 156 58 247 2006 614 349 158 88 230
Not employed 1986 662 6 297 104 373 1991 665 0 305 169 301 1996 624 0 232 179 404 2001 664 0 248 194 334 2006 651 1 291 181 317
* “caring” does not include child care. Source: STULA 1.6. The results in relation to child care policy We have seen above that there is a trend towards more time being invested in child care by both mothers and fathers. We found also that work time was decreasing for both sexes; that fathers were slightly increasing their involvement in domestic work; and that mothers were spending significantly less time on domestic tasks than previously. Furthermore, examining time spent on child care in detail, we discovered that while men had increased their participation by just a few minutes, mothers – regardless of whether they were employed or not, and whether they lived in two-generation or three-generation households, or were single mothers – were significantly increasing the time they spent caring for children. It is difficult to demonstrate how these trends and child care policies are related. Policies that support the combination of work and child care have underlied family policy in Japan since the 1990s. The major means used for this objective have been the improvement of child-care services, and the introduction and improvement of the child-care leave system. Since policies that support the reconciliation of work and family were enacted during the period of observation, it is possible that the increase in time spent on child care by working mothers is partially due to such policies. However, if we consider that non-employed mothers are also spending more time on child care, it becomes harder

28
to argue that this is a trend prompted by family policy. Furthermore, it is puzzling that time spent on child care should be increasing (regardless of family type or employment status) at a time when the number of children per household is diminishing. Recalling that domestic work participation is decreasing, it may be that mothers are simply transferring the excess time gained towards child care rather than being influenced by any family policy. Another explanation is that there is a tendency to assign higher importance to child care than housekeeping. The fact that single mothers spend conspicuously less time on child care compared to married mothers in two-generation households suggests that for this group the reconciliation of child care and work still presents great difficulties. Turning to the time spent on child care and domestic work by fathers, a slight increase is observed in both categories. It is possible that this trend reflects the influence of gender equality policies that are, to some extent, reconfiguring the previously fixed gender-based division of labor as well as changes in values. Alternatively, it may be the result of labor market policies, such as the increasing practice of allowing a two-day holiday from work per week and restrictions on long working hours. When it comes to mothers, the increase in part-time jobs results in many mothers allocating more time towards child care instead of to paid work. 2. Time spent on care for the elderly In this section we consider long-term trends in the amount of time that Japanese men and women spend on caring for the elderly. First, we look at changes in time used daily in this activity. Next, we make use of a survey conducted after the implementation of the Long-Term Care Insurance System to investigate how time spent on caring is influenced by the use or non-use of caring assistance. 2.1. Changes in time used for care for women and men Figure 4 draws on STULA to highlight the share of men and women who are caring for an elderly family member.10 Against a background of progressive demographic ageing, we observe slight increases in the share of those who provide care within the family. For each year that data are given, however, a larger percentage of women than men spend time for the elderly.
10 STULA classified respondents according to whether they usually care for their family members or not. A person who usually provides care is further classified according to the person/people for whom and where he/she is providing the care. The classification is thus as follow: Not usually providing care Usually providing care - Care provision for family members 65 years old and over Providing care at home/Care provided outside the home - Care provision for family members under 65 years old Providing care at home/Caring provided outside the home “Care” refers to helping a person to have a meal, take a bath, dress, move, or carry out other daily movements. “Care” also includes that for people who have not been recognized as persons who require care under the Long Term Care Insurance System. Caring for persons who are temporarily sick is excluded.

29
Figure 4. The participation rate of men and women who usually care for a family member (1991-2006)
0%
1%
2%
3%
4%
5%
6%
7%
1991 1996 2001 2006
Female
Male
Source: STULA Respondents who are caring for family members are classified into those who provide care at home and those who provide care outside the home. The latter are those who care for their parents or parents-in-law living in separate residences. Figure 5 shows the proportion of people providing care outside the home in 2001 and 2006 by sex. In 2006, the percentage of those providing care outside the home increased for both males and females. Note that, while care outside the home increased, more than 60% of males and females are providing care at home. Figure 5. The percentage of people caring for family members living in separate residence (2001-2006)
30%
35%
40%
45%
50%
Male Female
2001
2006
Source: STULA Table 30 gives a five-category breakdown of daily time use for men and women who provide family-based care for the elderly. We see that the amount of time women spend on caring has in fact decreased between 1991 and 2006, sliding from 72 to 60 minutes in this period. A major downward trend – from 73 to 62 minutes – is observed between 1996 and 2001 in particular. At the same time, men’s participation in care has increased over the examined period, albeit only very slightly. Table 30. The daily time use distribution of men and women who provide care for a family

30
member (1991-2006)
Sleep, Personal care and Meals
Work and Related travel
Housework,Shopping and Child care
Elderly care
Leisure, Study and Others
Female 1991 623 179 257 72 310 1996 634 158 254 73 320 2001 628 149 253 62 348 2006 621 151 266 60 341
Male 1991 622 392 41 29 356 1996 642 357 42 30 369 2001 634 327 50 29 400 2006 638 308 62 31 403
Source: STULA 2.2. The influence of caring assistance on time spent on care Let us now look at how the use or non-use of caring assistance influences the amount of time spent on care by women and men. Figure 6 shows how large a share of those who provide family-based care also use caring assistance. Overall, the share of assistance users has increased between 2001 and 2006. For both of these time points, a higher share of men than women made use of caring assistance. Table 31 highlights differences in caring time between caring assistance users and non-users. For both women and men alike, those who also use caring assistance appear to spend more time on care than those who do not use such assistance. It is likely that this is due to the higher care needs of the elderly who are being cared for by both family members and professional care workers. If we compare how much time women used on caring in 2001 and 2006, we find a marked decrease for those who were making use of caring assistance (from 85 to 76 minutes).

31
Figure 6. Percentage of carers for family members 65 years old and over using caring assistance
0%
20%
40%
60%
80%
100%
Male2001
Male2006
Female2001
Female2006
Not usingcaringassistanceUsingcaringassistance
Source: STULA Table31. The daily time use distribution of women and men who provide care to an elderly family member (or members) according to the use of caring assistance
Year
Sleep,
Personal
care and
Meals
Work and
Related
travel
Housework,
Shopping
and
Child care
Elderly care Others
female Using caring assistance 2001 626 145 248 85 335Using caring assistance 2006 629 137 267 76 331Not use caring assistance 2001 629 151 256 54 353Not use caring assistance 2006 619 158 265 53 346
male Using caring assistance 2001 634 308 55 38 403Using caring assistance 2006 642 283 70 42 404Not use caring assistance 2001 635 335 47 25 396Not use caring assistance 2006 637 319 58 26 400
Source: STULA 2.3. The influence of elderly care policies on time use One of the objectives of the new care insurance system, the Long-Term Care Insurance System, introduced in 2000, was the alleviation of the care burden on families via the provision of external (non-family) care services. Against a context of rapid ageing, lengthening life-spans and an attendant increase in the care needs of the elderly, the heavy care burden shouldered by elderly wives caring for their elderly husbands (and vice versa) and daughters-in-law furnishing care for their husband’s parents was viewed as a pressing concern prior to the enactment of the new insurance plan. This heavy burden that fell primarily on female carers reflected the strength of gender norms and role segregation that prescribed caring as primarily a women’s responsibility – one that surpassed even

32
child care in relative importance. Thus females accounted for 76.4% of main carers in 2001 and 71.9% in 2007 (Source; Ministry of Health, Labour and Welfare. 2001, 2007). So while there was some increase in the participation by men in this work, females still account for the overwhelming majority of carer. The data on daily time use in the period following the introduction of the Long-Term Care Insurance System suggests that the scheme has had differing effects for men and women regarding gender role change and care burdens. It is entirely possible that the decrease in women’s care provision observed between 1996 and 2001 was due to the introduction of the new insurance system. Crucially, when disaggregating the newer survey data into caring assistance users and non-users, we found that the former spent significantly less time on elderly care in 2001 than they did in 2006. Men, on the other hand, have slightly increased their involvement in care, with users of caring assistance spending four minutes longer on care in 2006 compared to 2001. To sum up, due to the introduction and entrenchment of the Long-Term Care Insurance System, female carers who also make use of caring assistance have been able to decrease their provision of care within the family. For men, the trend is towards a slight increase in involvement in care. Hence, it is possible that the Long-Term Care Insurance System has indeed alleviated the care burden on women, introducing at the same time slightly more fluidity into a gender-based division of labor that previously defined elderly care primarily as a female responsibility.
III. Discussion In this paper, we conducted an analysis of the time allocated to care by Japanese males and females, its determining factors and its change over time, by the use of time use surveys. Firstly, according to the analysis conducted in the first half of this paper, the time spent on paid and unpaid work and the participation rates in each of them are distinctly different between males and females. Males spend longer time on paid work than females, and females spend longer time on unpaid care work than males, which holds true even after controlling for the respective attributes of males and females. The result of a regression analysis on unpaid care work and care of persons by males and females is that two demographic variables, marital status and co-residence with children under six years of age, strongly affected the time spent on unpaid care work and care of persons in the case of females. As for socio-economic variables, while a higher educational standard lengthens the time spent on these in the case of females, no effect is observed with variation in household income. In the case of males, while no effect is observed with variation in marital status, time spent on unpaid care work becomes shorter when the individual co-resides with an elderly person aged 65 years or over, and the care of persons becomes longer with children under six years of age. As for socio-economic variables, while unpaid care work becomes longer with a higher male educational standard, unpaid care work decrease as household income increases. Secondly, in the second half of the paper, where time spent on child care and care for the elderly are examined using time series data, we first recognized the tendency that time spent on child care is increasing, regardless of sex, household composition (whether two-generation households comprising only of a married couple, three-generation households or single mother households) and employment status. A similar tendency toward longer time spent on child care is also recognized in other developed countries. While the employment rate of females is increasing and the number of children per household is decreasing, particularly in western countries, which might be expected to result in less time spent on child care, it is pointed out that in fact this is increasing for both males and

33
females (Gershuny 2000, Bianchi 2004, Gauthier, Smeeding and Furstenberg 2004, Sayer, Bianchi and Robinson 2004). Why is time spent on child care increasing? The regression analysis in which we analyze the determining factors of time spent on child care by using micro data from the 2001 survey (Table 23) reveals that time spent on child care becomes longer for both males and females who are highly educated. While higher education lengthens time spent on child care, no significant effect is observed with variation in household income. From the results concerning higher education and household income, we can consider that time spent on child care has increased as a result of the development of a “highly-educated person’s view of child rearing,” that is, a great deal of time and care is devoted to the upbringing of children regardless of one’s economic resources, not that higher education lengthens the time spent on child care because of an increase in one’s economic resources. Also, as for factors regarding the children themselves, the age of the youngest child, not the number of children, seems to be the main factor affecting time spent on child care. In addition, it is found that time spent on child care decreases with employment, being a single mother, or with the increase in the number of household members other than children. Finally, in respect of time spent on care for the elderly, following the introduction of the Long-Term Care Insurance System in 2000, the participation rate in elderly care increases for both males and females and the time spent on care decreases for females and slightly increases for males.11 This is especially the case among those who use nursing care assistance services. From this, we can consider that the Long-Term Care Insurance System has had the effect of reducing the burden of elderly care on females, while increasing male commitment to elderly care.
11 Regression analysis could not be conducted for time spent on nursing care due to the shortage of actors.
34
References Bianchi,Suzanne M. 2000,“Maternal Employment and Time with Children: Dramatic Change Or Surprising Continuity?”, Demography, 37 (4). Economic Planning Agency. 1998, “1996 nen no Musho Rodo no Kahei Hyouka (Valuation of Unpaid Work in 1996)”, http://www5.cao.go.jp/98/g-unpaid .html European Commission 2004, How Europeans spend their time, Everyday life of women and men, Data 1998-2002, Luxembourg: Office for Official Publications of the European Communities, http://epp.eurostat.cec.eu.int/cache/ITY OFFPUB/KS-58-04-998/EN/KS-58-04-998-EN.PDF Gauthier,Anne H,Timothy M.Smeeding,and Frank F. Furstenberg Jr. 2004, “Are Parents Investing Less Time in Children? Trends in Selected Industrialized Countries”, Population & Development Review,30 (4). Gershuny, Jonathan. 2000, Changing Times: Work and Leisure in Postindustrial Society, Oxford University Press. Hamada, Koji. 2006, “Musho Rodo to Syotoku Bunpqai (Unpaid work and Income Distribution)”, Kikan Kakei Keizai Kenkyu, No.26. Ministry of Education, Culture, Sports, Science and Technology. 2001, General Account Budget Statement of 2001. Ministry of Finance, 2001, Receipts and Payments of Treasury Funds. Ministry of Health, Labour and Welfare. 2001, Basic Survey on Wage Structure (Chingin Kozo Kihon Chosa). Ministry of Health, Labour and Welfare. 1986, 2001, 2006, 2007. Comprehensive Survey of Living Conditions of the People on Health and Welfare(Kokumin Seikatsu Kiso Chosa). Ministry of Internal Affairs and Communications. Survey on Time Use and Leisure Activities (Shakai Seikatsu Kihon Chōsa). National Institute of Population and Social Security Research. 2001, “The Cost of Social Security in Japan”. Shadan Hōjin Nihon Rinshō Kango Kasei Kyōkai (The Japan Clinical Nursing Housekeeping Association). 1995, Ippan Zaitaku tou Kinmusha no Chingin Jittai Chōsa (Survey on Home Worker’s Wage). Sayer, Liana, Suzanne M. Bianchi and John P. Robinson. 2004, “Are Parents Investing Less in Children? Trends in Mothers’ and Fathers’ Time with Children” American Journal of Sociology Vol.110, No.1.

35
Appendix 1: Outline of the Survey on Time Use and Leisure Activities for the period 1991-2006 1991 Survey dates Two consecutive days during the period from 28 September to 6 October Survey sample Approximately 99,000 households 1996 Survey dates Two consecutive days during the period from 28 September to 6 October Survey sample Approximately 99,000 households consisting of 270,000 household members of ten years of age or over 2001 Survey dates Two consecutive days during the period from 13 to 21 October Survey sample Approximately 77,000 households consisting of 200,000 household members of ten years of age or over. (Questionnaire A: 73,000 households, Questionnaire B: 4,000 households) Sampling The sample is selected through a two-stage stratified sampling method, with the primary sampling unit being the enumeration district (ED) of the Population Census, and the secondary sampling unit being the household. First, the whole country is divided into the regions of 47 prefectures, and a total of 6,440 sample EDs are selected in those regions. The sampling of EDs was done separately for the sample EDs for Questionnaire A and those for Questionnaire B, the number of sample EDs being 6,104 and 336, respectively. Survey method Enumerators deliver the questionnaires to each household to be surveyed, collect the completed questionnaires, and interview the households as necessary. The questionnaires are completed by household members who are ten years of age or over. 2006 Survey dates Two consecutive days during the period from 14 to 22 October Survey sample Approximately 80,000 households consisting of 200,000 household members of ten years of age or over. (Questionnaire A: 76,000 households, Questionnaire B: 4,000 households)

36
Appendix 2: Classification of Activities in the Survey on Time Use and Leisure Activities (Questionnaire A) Activities Examples and/or notes 1.Sleep Time from going to bed till getting up 2.Personal care Washing face, bathing, dressing, hair-dressing, etc. 3.Meals Includes drinking before or after meals. If the main purpose is
socializing, included in “18 Social life”. 4.Commuting to and from school or work
Going to work or school and returning
5.Work Work for pay or profit includes helping family business. Rest between work time should be classified according to the activity actually done.
6.Schoolwork Studying by students at school, such as high school, college and university. Homework is included.
7.Housework Cooking, table setting, cleaning house, caring for family members other than small children, keeping the family accounts, visits to government office on personal or family matters
8. Care of adults Helping family or related person to have a meal, take a bath, dress, and travel
9.Child care Caring for little child(ren) Including activities concerning education of the child(ren).
10.Shopping Purchase of food, clothes, or other goods. Includes window-shopping.
11. Travel Travel other than “4. Commuting to and from school or work”
12.Watching TV, listening to the radio, reading newspapers or magazines
Includes watching TV programs recorded on videotape
13.Rest and relaxation Conversation with family, office colleagues, etc. 14.Study and research Study and research other than “6. Schoolwork”. Those as a
part of work are included in “5. Work”. 15.Hobbies and amusements Seeing a movie or a play, playing or listening to music, caring
for pets, gardening, flower arrangement, chess, mahjong, etc. 16.Sports Athletic amusements such as baseball, volleyball, tennis, etc.
Includes light exercises and outdoor leisure such as jogging, hiking, etc.
17.Volunteer and social activities Voluntary activities or other social activities to promote social welfare by providing one’s effort, skill and time without pay
18.Social life Seeing friends, talking with neighbors, attending meetings, funerals, wedding, receiving friends at home, meals the main purpose is socializing, etc.
19.Medical examination or treatment Staying in bed due to illness, seeing a doctor for treatment, etc. 20.Other activities Activities not classified elsewhere
37
Appendix 3: Classification of Activities in the Survey on Time Use and Leisure Activities (Questionnaire B) 1. Paid work Commuting to and from school or work Main job Travel as part of or during main job Second job Travel as part of or during second job Rest from work or schoolwork: rest from work or schoolwork: breaks during working hours due to personal reasons, breaks or lunch breaks at work or school when no other activity is specified Activities connected with job seeking 2. Services for income and other production of goods not for establishment Building and repairing: renovation and minor change of house, making and repairing furniture and household goods, etc. 3. Household maintenance Management of meals Household upkeep Care of clothing Vehicle maintenance Accessing administrative services: use of services of city offices or public facilities Accessing commercial services: use of commercial services such as dry cleaners, banks, etc. Household management Shopping Travel related to household maintenance Other housework 4. Care of persons [Activities related to child care] Care of a baby or a small child Teaching a child Physical care or supervision of a baby or a small child Reading, playing and talking with a baby or a small child Accompanying a baby or a small child [Activities related to elderly care] Care of a family member excluding a baby or a small child [Other: Activities related to care of persons excluding child care and elderly care] Travel related to unpaid work excluding household maintenance Helping a family member: Helping and taking care of family members other than babies or small children (excepting housework, nursing care, nursing). Includes e.g. cutting a husband's hair, waking up husband, helping an elementary school 1st grader to get dressed. 5. Community services Volunteer activities Attending meetings : attending meetings free of charge or for a minor fee such as voting in an election, attending meetings and other organizational activities when not in a position of trust. Concerns all kinds of meetings, etc. arranged by society, such as being a witness in court, political meetings, informal clubs and groups, such as attending a women's meeting, attending a political activity. 6. Learning
38
Classes and other activities related to school Homework Study with a private teacher, in a cram school or in a preparatory school Study and research (excluding schoolwork) 7. Social and cultural activities Communication with a family member Entertainment and culture Arts Hobbies (collecting and computing) Games Driving for pleasure Other hobbies and amusements Aerobic sports Ball games Water sports Other sports Association by meeting someone Ceremonial occasions Telephone conversation Communication by computer and correspondence Worship or sutra-chanting 8. Mass media use Reading newspapers or magazines Reading books Watching TV and listening to the radio Watching videos and listening to recordings 9. Personal care Sleep Personal care (washing and dressing) Personal care (personal services) Meals Light meals Nap Resting Medical examination Medical treatment 10. Others Other travel (excluding commuting to and from school or work, travel as part of/during job, travel related to unpaid work and travel related to unpaid work excluding household maintenance) Activities related to STULA Other


