59
The Politi cal Econom y of India Paranjoy Guha Thakurta C-Change 2013, Golden Palms, Bangalore Friday 22 February 2013
| Date post: | 26-Dec-2015 |
| Category: |
Documents |
| Upload: | carmella-watkins |
| View: | 215 times |
| Download: | 2 times |

ThePolitical Economy of India
Paranjoy GuhaThakurta
C-Change 2013,Golden Palms,Bangalore
Friday 22 February 2013

Incredible India

A country with 1.2 billion people
Infrastructure bursting at the seams
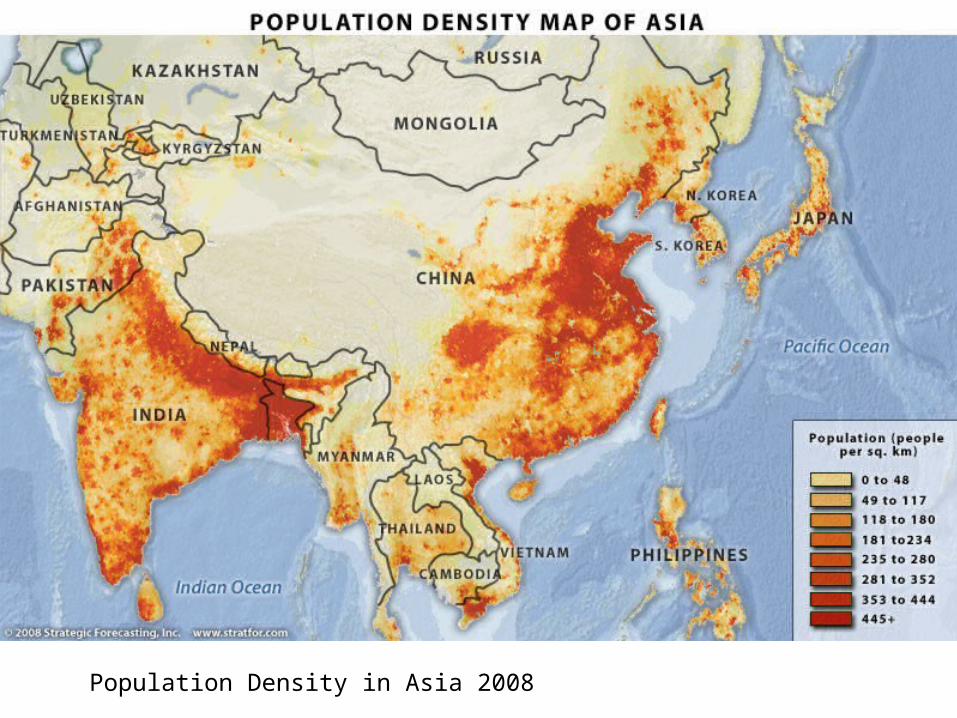
Population Density in Asia 2008

India’s population• India’s population rose from 1.03 billion to 1.21 billion
between 2001and 2011
• India’s population comprises 9,15,01,158 males and 8,99,54,828 females
• India accounts for 17.5% of the planet’s population
(with less than 2.5% of total land area)
• The country’s headcount is equal to the combined population of USA, Indonesia, Brazil, Pakistan, Bangladesh and Japan


India’s Late surge

Comparative India and China demographic profiles

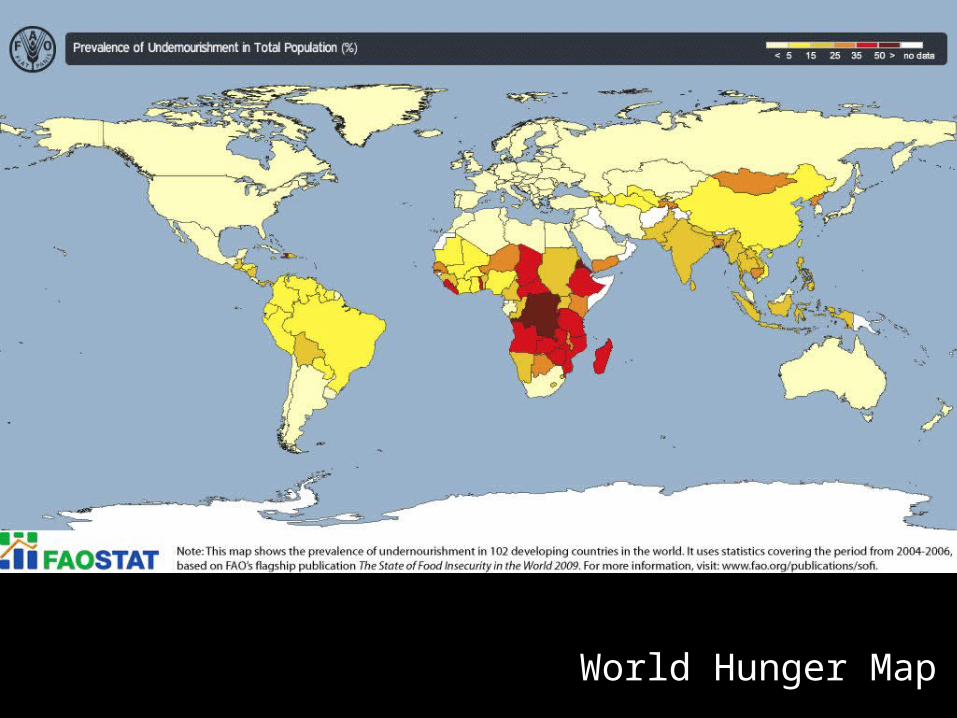
World Hunger Map
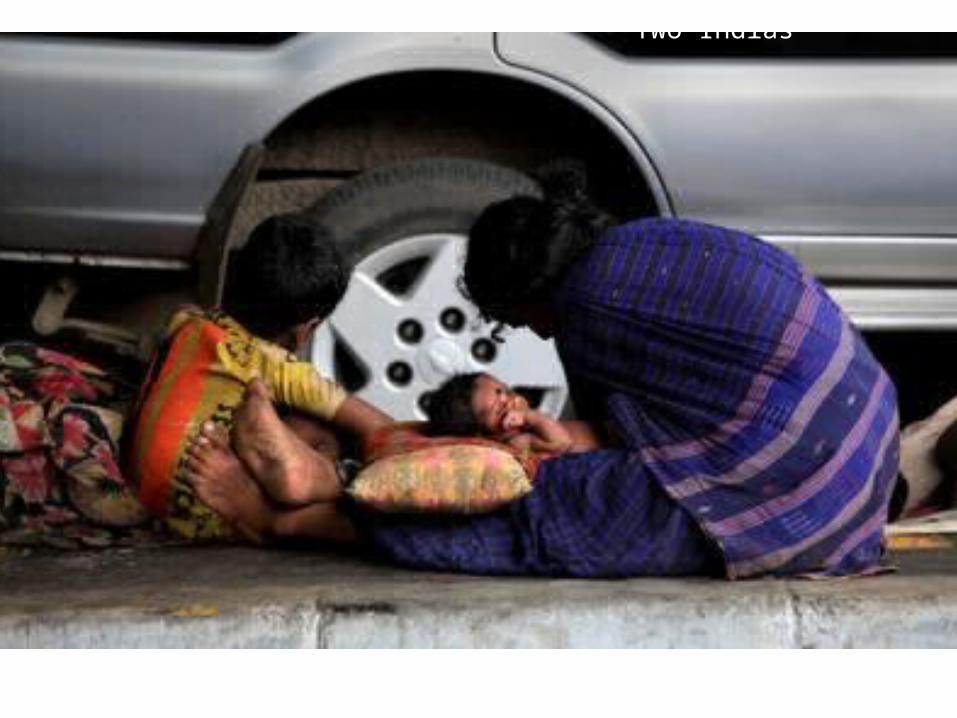
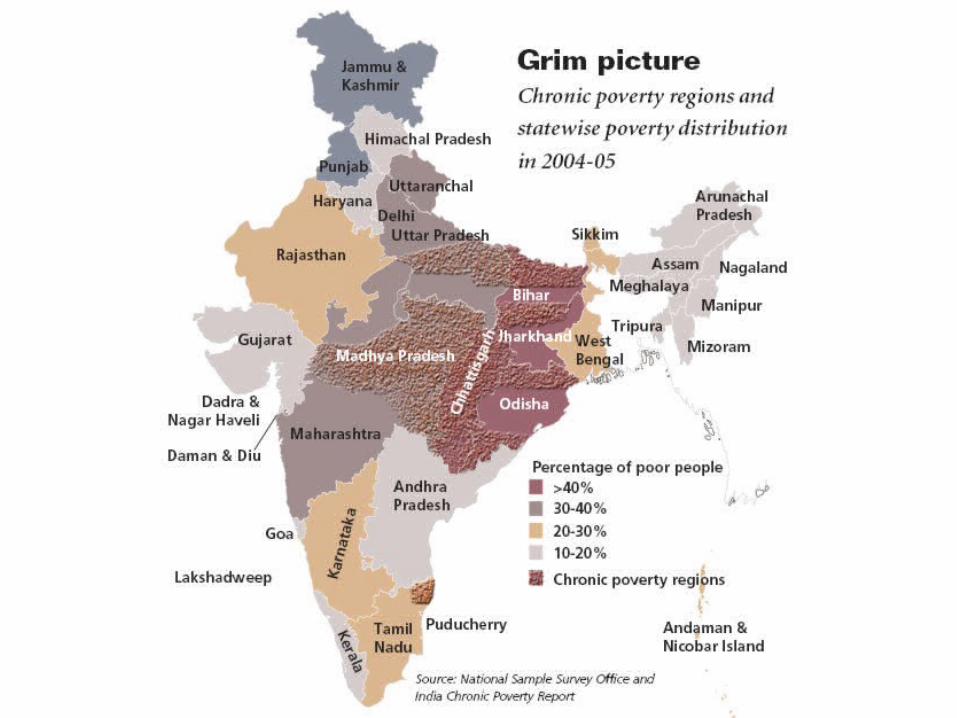
Two Indias

Literacy• The 2001-2011 period is the first
decade – with the exception of 1911-1921 – which has actually added lesser population compared to the previous decade.
• Among the states and territories Uttar Pradesh is the most populous state with 199 Million people and Lakshwadeep the least populated.
• According to the data, literates constitute 74% of the total population aged 7 and above and illiterates form 26%
• The literacy rate has gone up from 64.83% in 2001 to 74.04% in 2011, showing an increase of 9.21%

Female literacy still remains a challenge


World Economy: Reading Between the Lines
The Global Crisis

The World Economy GDP Growth Rates by
Country/Region2011 2012 2013 2014
(projections)
United States of America 1.8 2.3 2.0 3.0
Europe Part (Germany, France, Italy and Spain)
1.4 -0.4 -0.2 1.0
Japan -0.6 2.0 1.2 0.7
Russia 4.3 3.6 3.7 3.8
CIS 6.2 3.9 4.3 4.7
ASEAN + 5 (Indonesia, Malaysia, The Philippines, Thailand and Vietnam)
4.5 5.7 5.5 5.7
India 7.9 4.5 5.9 6.4
China 9.3 7.8 8.2 8.5
Source : World Economic Outlook – IMF, January 23, 2013
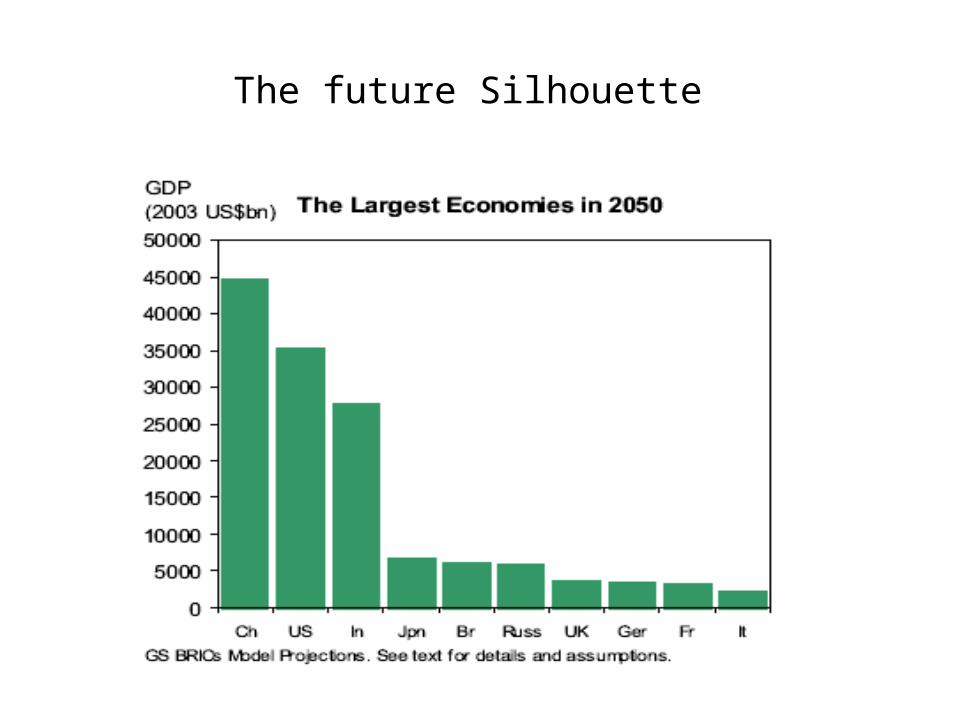
The future Silhouette

Good Prospects?


India’s GDP Growth

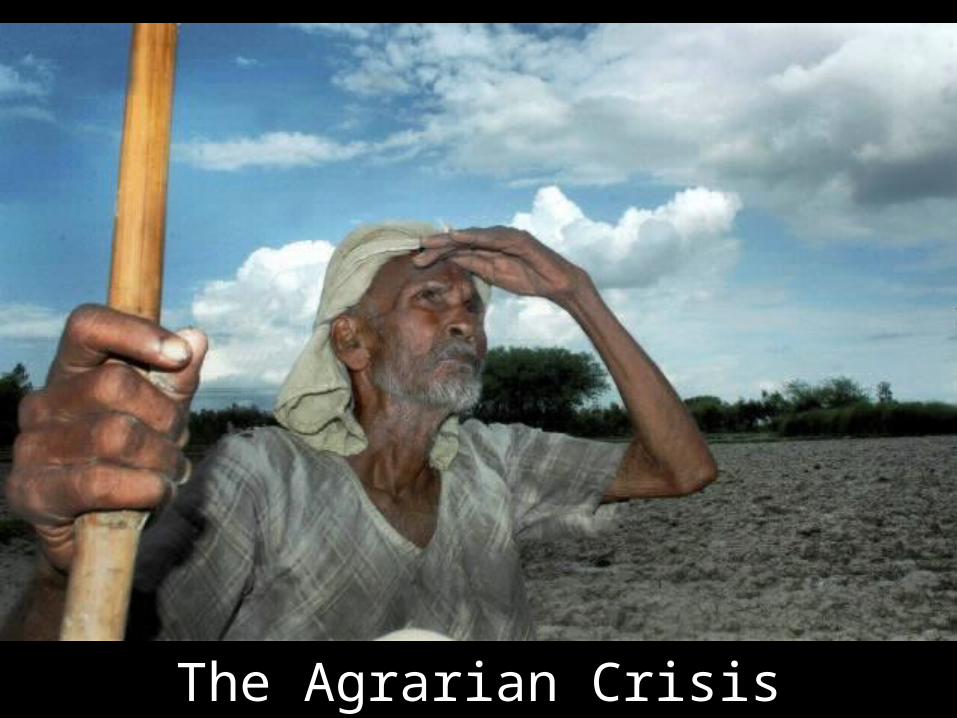
The Agrarian Crisis

-10
-5
0
5
10
15
20
2000-2001
2001-2002
2002-2003
2003-2004
2004-2005
2005-2006
2006-2007
2007-2008
2008-2009
2009-2010
Agriculture
Manufacturing
Trade
The Agrarian Crisis In India

©P. Sainath

Crisis in Indian Agriculture Share of agriculture in India’s GDP down from Share of agriculture in India’s GDP down from
50% to below 20% over the last four decades; 50% to below 20% over the last four decades; but share of population dependent on agriculture but share of population dependent on agriculture hardly down from over 70% to around 55%hardly down from over 70% to around 55%
Indian agriculture still dependent on munificence of Indra – 60% of cropped area in India not irrigated
Water management – one of the biggest problem areas of Indian economy
Average size of farm in India very small, less than 1.5 hectare
Indian Agriculture: Waiting for Lord Indra
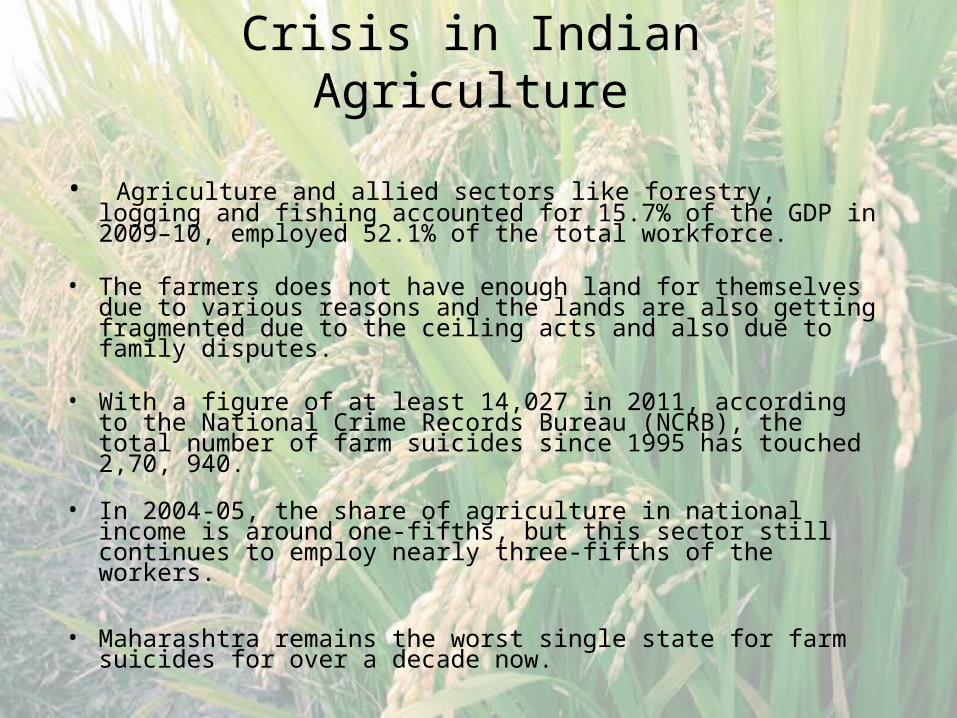
Crisis in Indian Agriculture
• Agriculture and allied sectors like forestry, logging and fishing accounted for 15.7% of the GDP in 2009–10, employed 52.1% of the total workforce.
• The farmers does not have enough land for themselves due to various reasons and the lands are also getting fragmented due to the ceiling acts and also due to family disputes.
• With a figure of at least 14,027 in 2011, according to the National Crime Records Bureau (NCRB), the total number of farm suicides since 1995 has touched 2,70, 940.
• In 2004-05, the share of agriculture in national income is around one-fifths, but this sector still continues to employ nearly three-fifths of the workers.
• Maharashtra remains the worst single state for farm suicides for over a decade now.

Changes in GDP structure (% share)
Sector 1980 1990 2000
Agriculture
China 39.2 27 18
India 42.8 31 28
Industry
China 38.2 42 49
India 21.9 28 26
Services
China 22.6 31 33
India 35.3 41 46
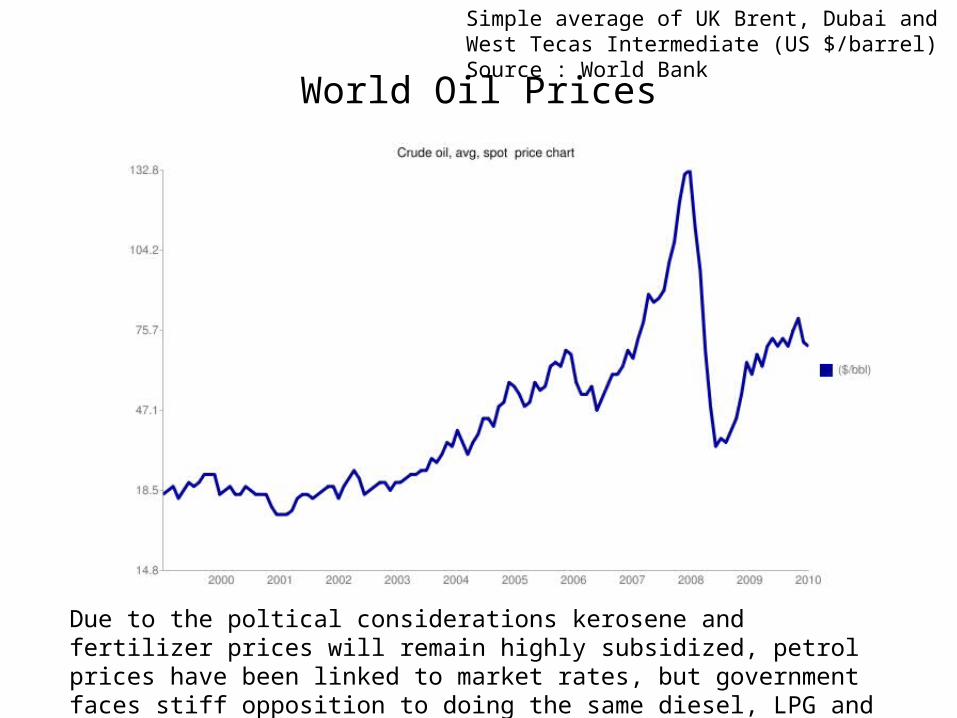
World Oil Prices
Simple average of UK Brent, Dubai and West Tecas Intermediate (US $/barrel) Source : World Bank
Due to the poltical considerations kerosene and fertilizer prices will remain highly subsidized, petrol prices have been linked to market rates, but government faces stiff opposition to doing the same diesel, LPG and kerosene prices.
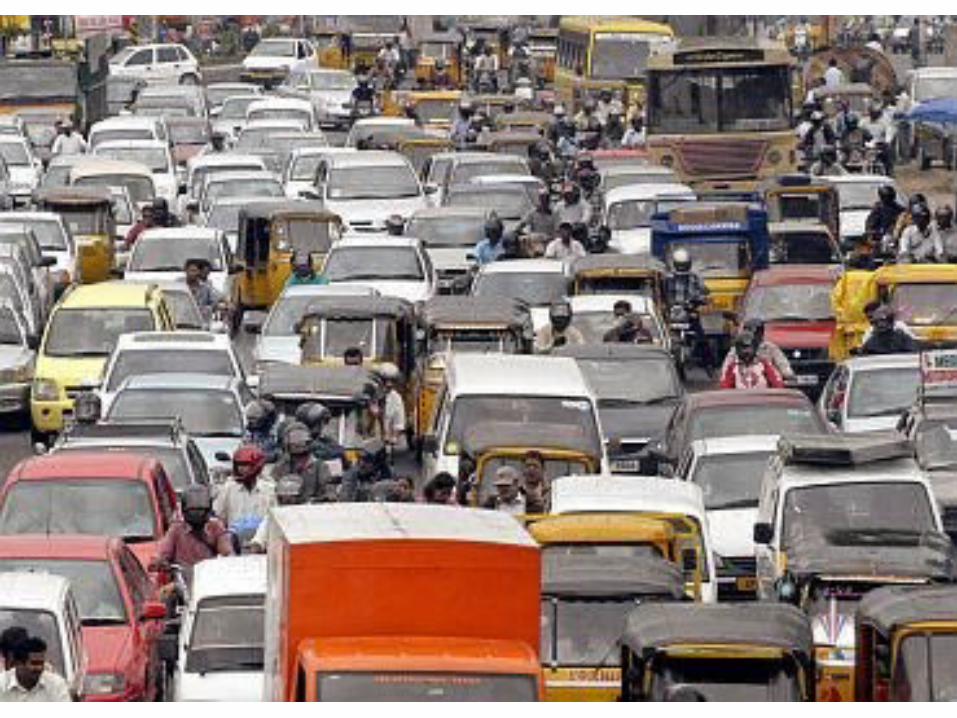

The Fuel Economy• India's passenger car and commercial vehicle manufacturing industry is
the seventh largest in the world, with an annual production of more than 3.7 million units in 2010 and one of the fastest growing globally.
• According to recent reports, India is set to overtake Brazil to become the sixth largest passenger vehicle producer in the world, growing 16-18 per cent to sell around three million units in the course of 2011-12.
• In 2009, India emerged as Asia's fourth largest exporter of passenger cars, behind Japan, South Korea, and Thailand.
• As of 2010, India is home to 40 million passenger vehicles. More than 3.7 million automotive vehicles were produced in India in 2010 (an increase of 33.9%), making the country the second fastest growing automobile market in the world.
• According to the Society of Indian Automobile Manufacturers, annual vehicle sales are projected to increase to 5 million by 2015 and more than 9 million by 2020. By 2050, the country is expected to top the world in car volumes with approximately 611 million vehicles on the nation's roads
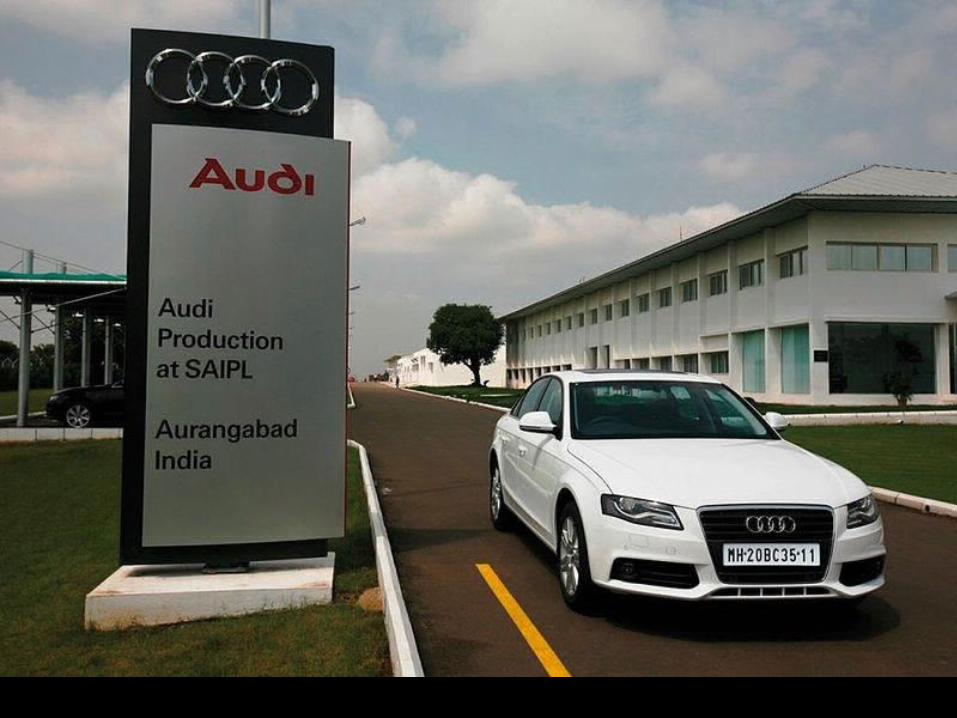

Mahindra Scorpio- India’s Indigenously produced SUV

The Indian IT Industry
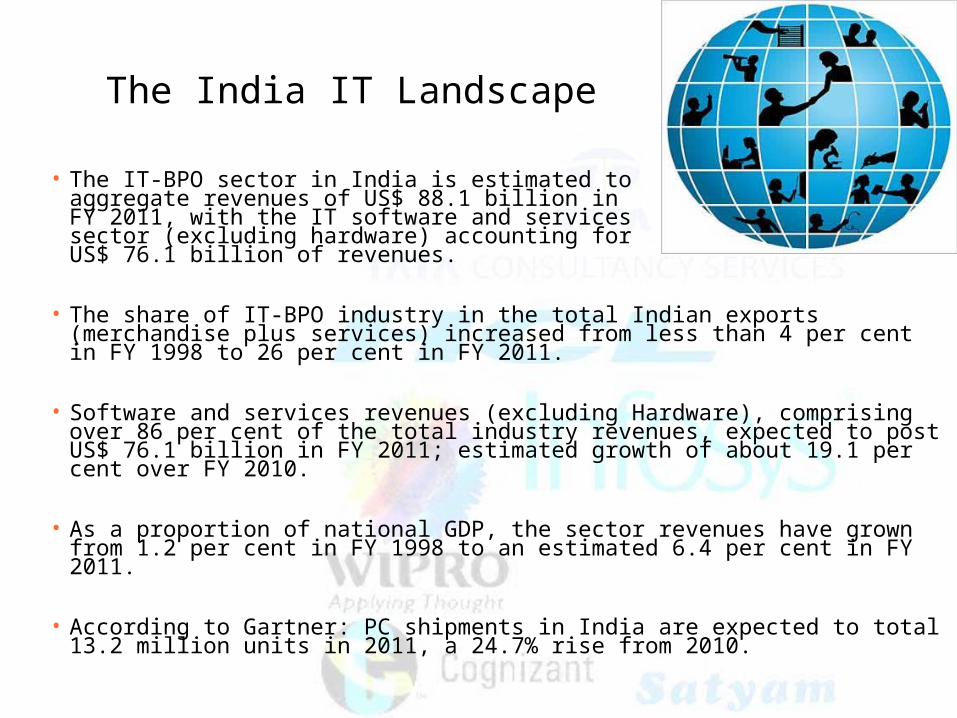
The India IT Landscape
• The IT-BPO sector in India is estimated to aggregate revenues of US$ 88.1 billion in FY 2011, with the IT software and services sector (excluding hardware) accounting for US$ 76.1 billion of revenues.
• The share of IT-BPO industry in the total Indian exports (merchandise plus services) increased from less than 4 per cent in FY 1998 to 26 per cent in FY 2011.
• Software and services revenues (excluding Hardware), comprising over 86 per cent of the total industry revenues, expected to post US$ 76.1 billion in FY 2011; estimated growth of about 19.1 per cent over FY 2010.
• As a proportion of national GDP, the sector revenues have grown from 1.2 per cent in FY 1998 to an estimated 6.4 per cent in FY 2011.
• According to Gartner: PC shipments in India are expected to total 13.2 million units in 2011, a 24.7% rise from 2010.

The Challenge: Role of the IT/ITeS Sector in Driving the India Growth Story, Further
• Challenges– Increasing competition from other countries with incentivisedlow costs– Rising costs in India with wage-push inflation– Increasing costs of relevant talent and skilled personnel Need to keep an
eye on developments in the economy and seriously devise a plan to handle manpower attrition and rising salary costs
• Opportunities– As a proportion of national GDP, IT/ITeS sector’s contribution have risen
from 1.2% in 1997-98 to an estimated 7.5% in 2011-12
– One area that provides considerable opportunities to the IT/ITeS sector is the Small and Medium Enterprises (SME) segment in India.
– Another area that has generated considerable interest is Cloud Computing, (dubbed as the next big thing) which is still in its nascent stage in India.
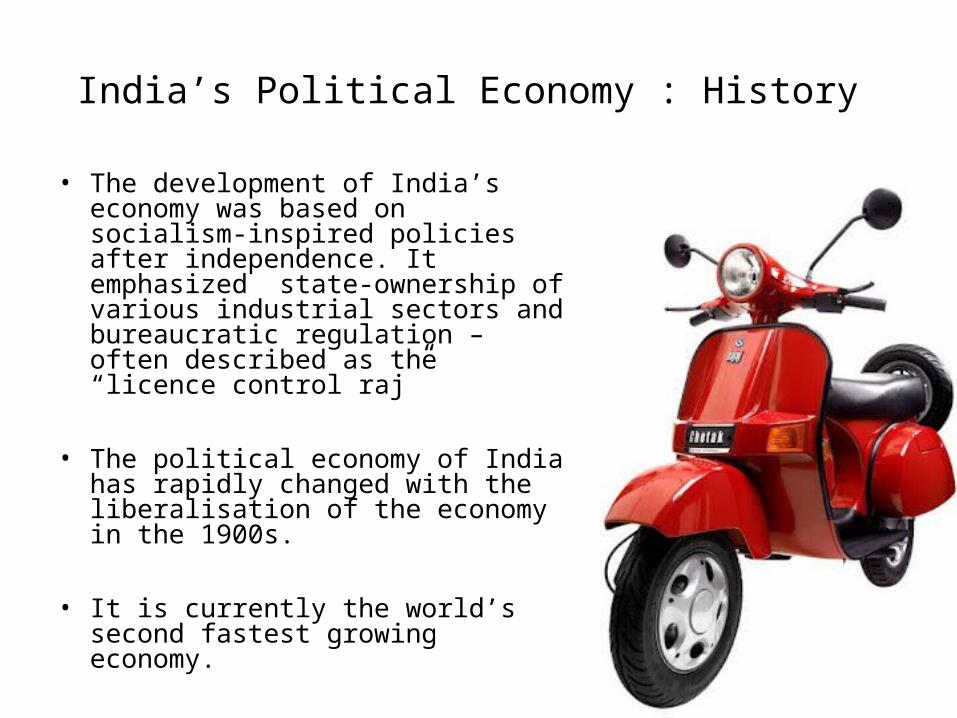
India’s Political Economy : History
• The development of India’s economy was based on socialism-inspired policies after independence. It emphasized state-ownership of various industrial sectors and bureaucratic regulation – often described as the “licence control raj”
• The political economy of India has rapidly changed with the liberalisation of the economy in the 1900s.
• It is currently the world’s second fastest growing economy.
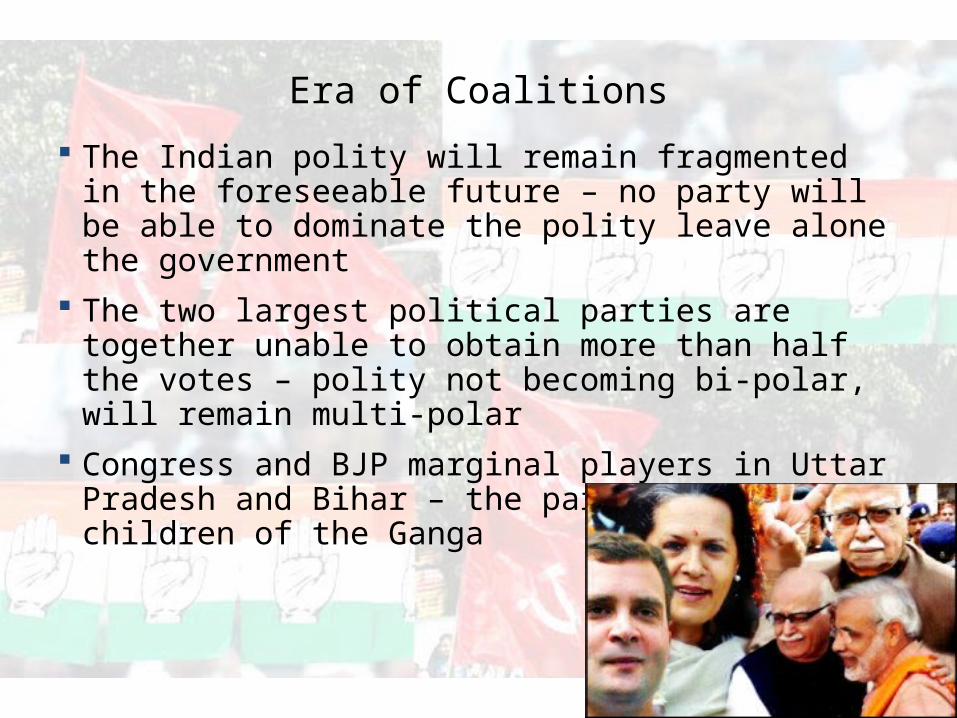
Era of Coalitions
The Indian polity will remain fragmented in the foreseeable future – no party will be able to dominate the polity leave alone the government
The two largest political parties are together unable to obtain more than half the votes – polity not becoming bi-polar, will remain multi-polar
Congress and BJP marginal players in Uttar Pradesh and Bihar – the paradox of the children of the Ganga
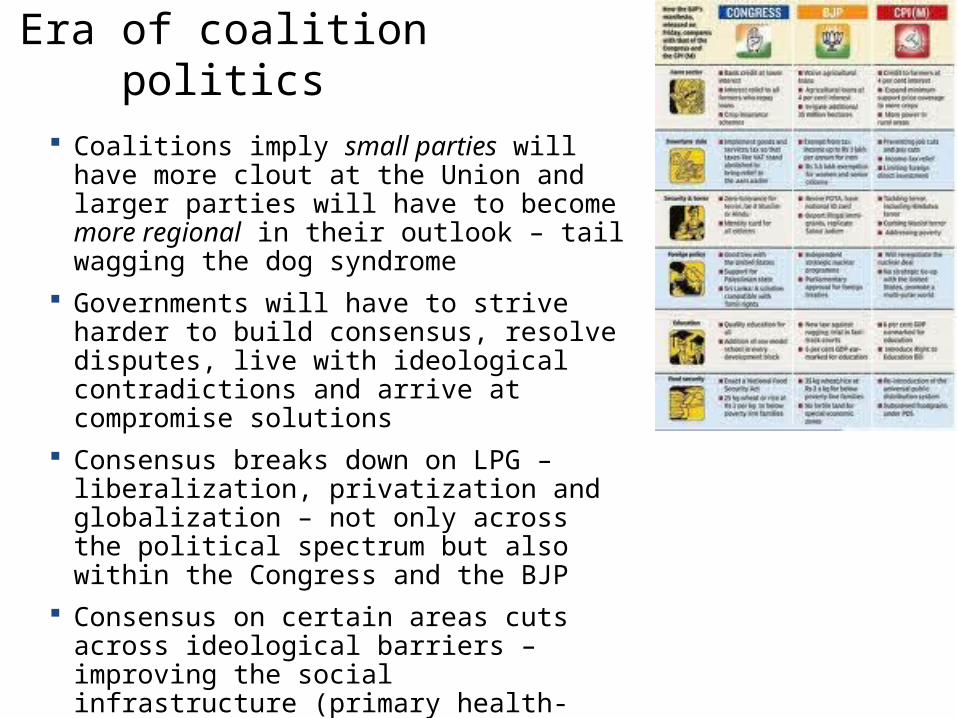
Coalitions imply small parties will have more clout at the Union and larger parties will have to become more regional in their outlook – tail wagging the dog syndrome
Governments will have to strive harder to build consensus, resolve disputes, live with ideological contradictions and arrive at compromise solutions
Consensus breaks down on LPG – liberalization, privatization and globalization – not only across the political spectrum but also within the Congress and the BJP
Consensus on certain areas cuts across ideological barriers – improving the social infrastructure (primary health-care, elementary education, rural development) and the physical infrastructure or the other BSP – bijli (electricity), sadak (roads), paani (water)
Era of coalition politics

Dominant players
The Congress and the BJP are poles of the polity in only 8 out of the 28 states in India; the two largest political parties would be lucky to remain where they are
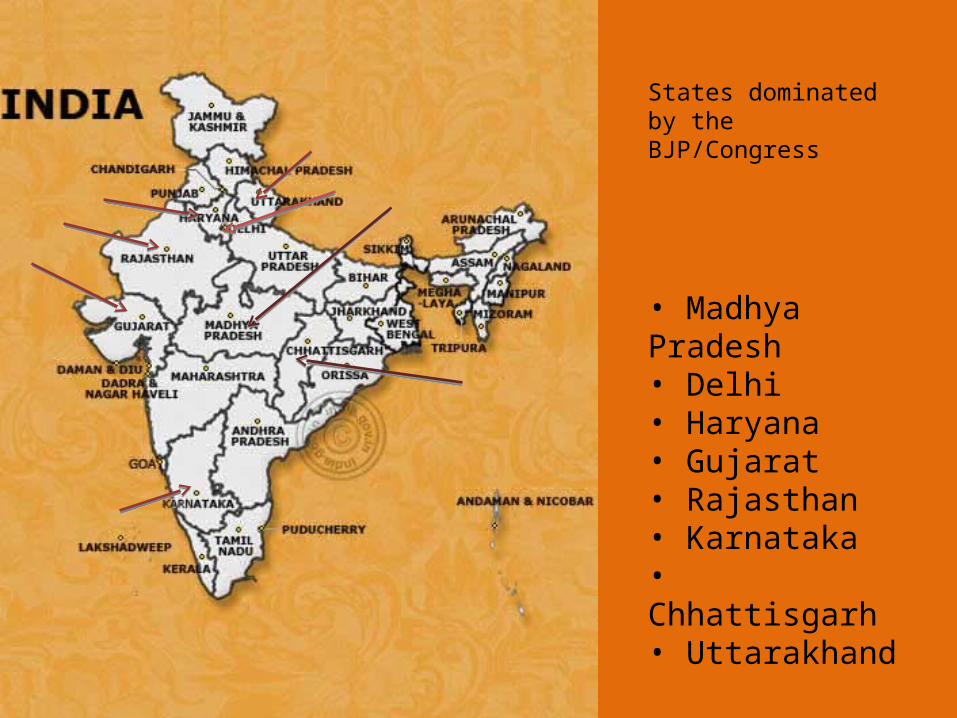
States dominated by the BJP/Congress
• Madhya Pradesh• Delhi• Haryana• Gujarat • Rajasthan• Karnataka• Chhattisgarh• Uttarakhand


India’s Mineral Map

Mining & Forest
Belt
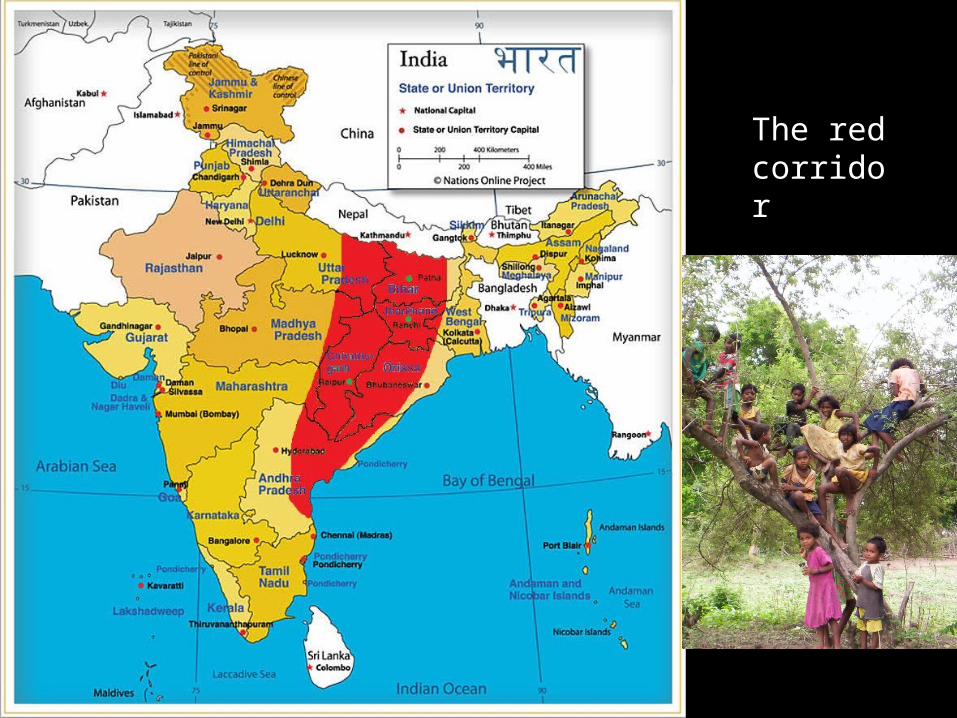
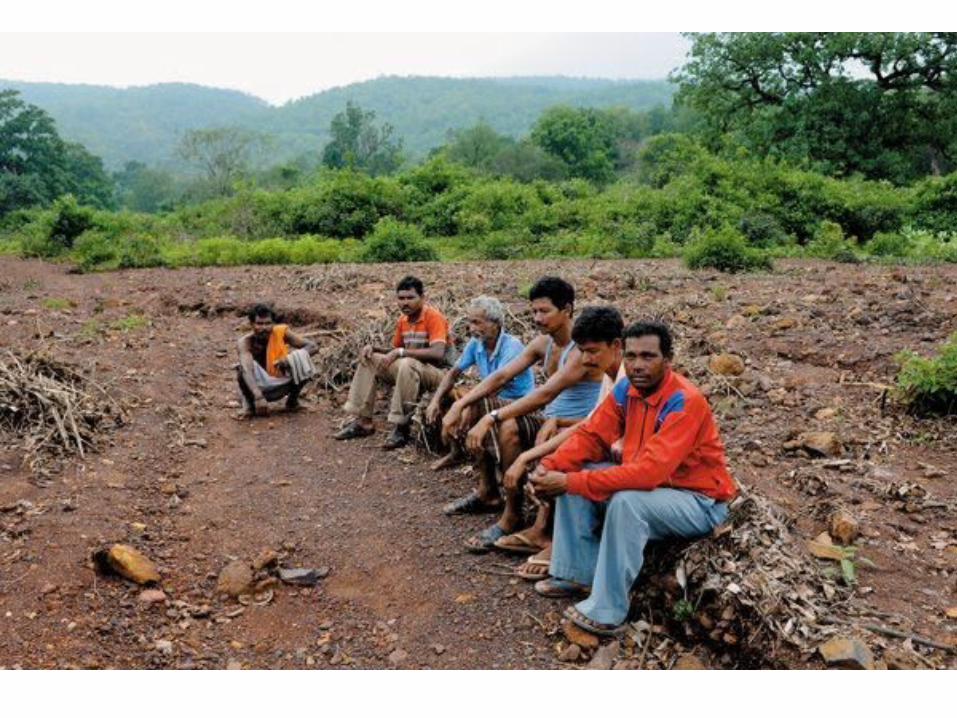
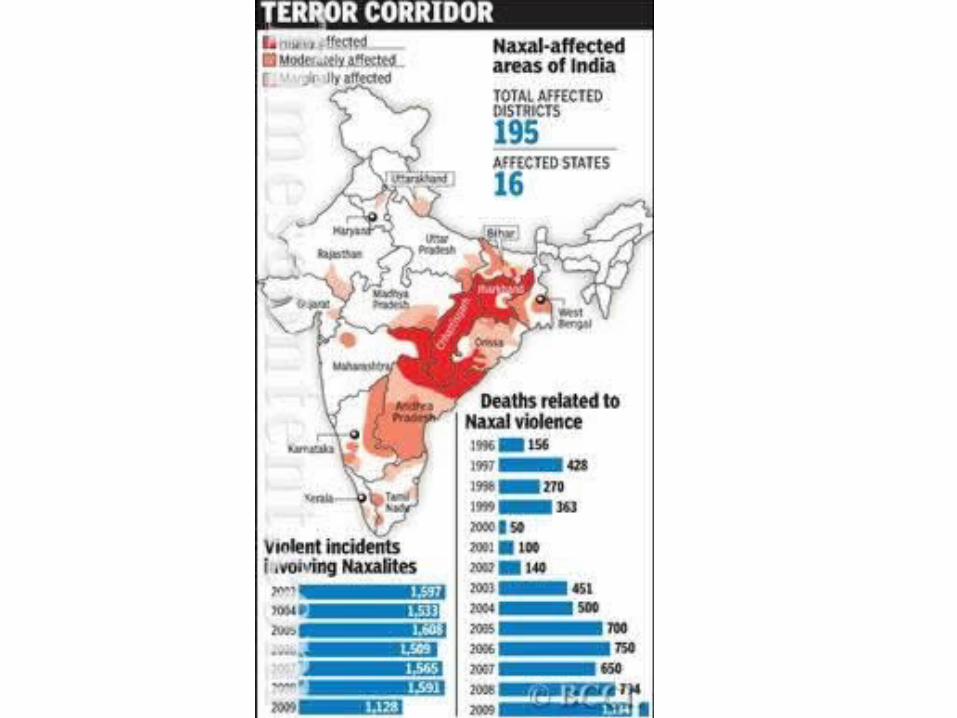
The red corridor


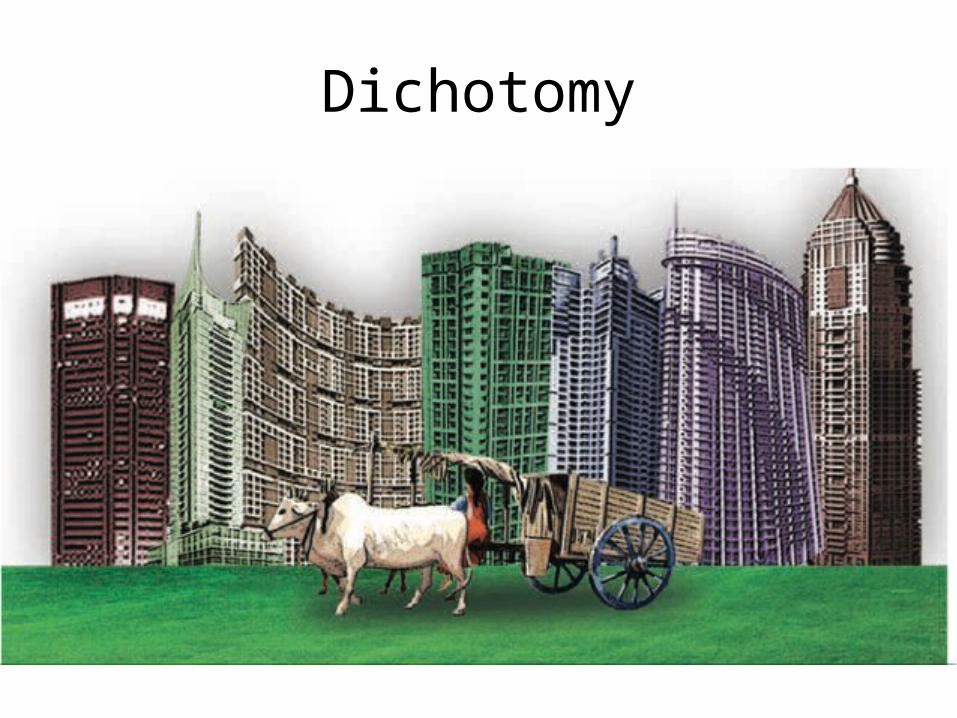
Dichotomy

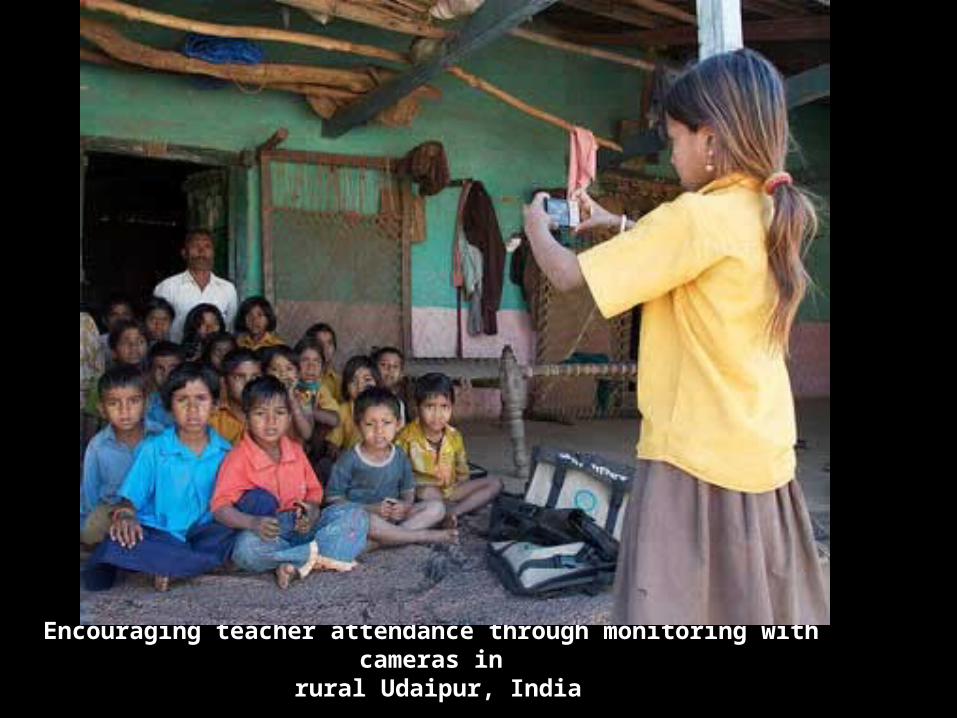
Encouraging teacher attendance through monitoring with cameras in rural Udaipur, India
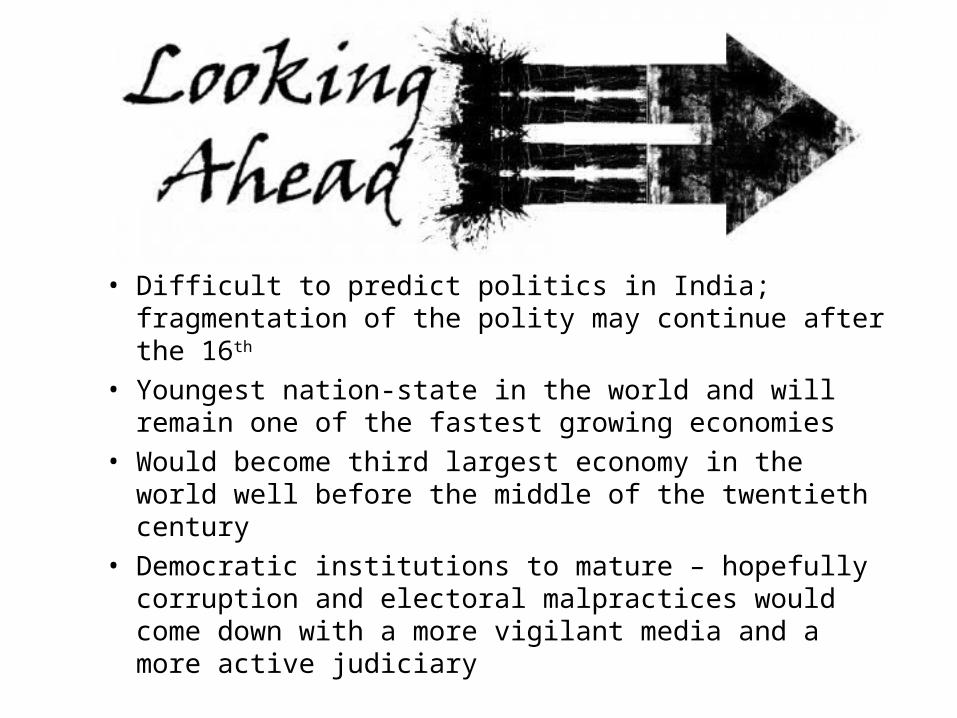
• Difficult to predict politics in India; fragmentation of the polity may continue after the 16th
• Youngest nation-state in the world and will remain one of the fastest growing economies
• Would become third largest economy in the world well before the middle of the twentieth century
• Democratic institutions to mature – hopefully corruption and electoral malpractices would come down with a more vigilant media and a more active judiciary


