The Political Economy of Public Employee Absence: Experimental Evidence from Pakistan * Michael Callen † Saad Gulzar ‡ Ali Hasanain § Yasir Khan ¶ First Version: March 30, 2013 This Version: February 16, 2014 Abstract In many developing countries, public sector absence is both common and resistant to reform. One explanation for this is that politicians provide public jobs with limited work requirements as patronage. We test this patronage hypothesis in Pakistan using: (i) a randomized controlled evaluation of a novel smartphone absence monitoring tech- nology; (ii) data on election outcomes in the 240 constituencies where the experiment took place; (iii) attendance recorded during unannounced visits and; (iv) surveys of connections between local politicians and health staff. Four results support this view. First, while doctors are present at 42 percent of clinics in competitive constituencies, they are present at only 13 percent of clinics in uncompetitive constituencies. Second, doctors who know their local parliamentarian personally are present at an average of 0.727 of three unannounced visits, while doctors without this connection are present at 1.309 of the three visits. Third, around 40 percent of inspectors and health admin- istrators report interference by politicians when they try to sanction doctors. Fourth, the effect of the smartphone monitoring technology, which almost doubled inspection rates, is highly localized to competitive constituencies. Last, we find evidence that program impact is in part due to the transmission of information to senior officers. We test this by manipulating the salience of staff absence in data presented to officials using an online dashboard. These effects are also largest in politically competitive constituencies. Our results have implications for the study of bureaucratic incentives in fragile states and are potentially actionable for policymakers trying to build state capacity. * Authors’ Note : We thank Farasat Iqbal, Asim Fayaz, and Zubair for assistance in implementation. Support is provided by the International Growth Centre (IGC) political economy program and the IGC Pakistan Country Office. We thank Eli Berman, Ali Cheema, Naved Hamid, Gordon Hanson, Asim Khwaja, Craig McIntosh, Ijaz Nabi, Gerard Padro´ -i-Miquel, Jacob N. Shapiro, Christopher Woodruff and various seminar participants for insightful comments. Excellent research assistance was provided by Muhammad Zia Mehmood, Haseeb Ali, and Arman Rezaee. We thank Ali Cheema and Farooq Naseer for kindly sharing their data on election outcomes. † University of California, Los Angeles. email: [email protected]‡ New York University. email: [email protected]§ Lahore University of Management Sciences. email: [email protected]¶ International Growth Centre - Pakistan. email: [email protected]1
Transcript
The Political Economy of Public Employee Absence:
Experimental Evidence from Pakistan∗
Michael Callen† Saad Gulzar‡ Ali Hasanain§ Yasir Khan¶
First Version: March 30, 2013
This Version: February 16, 2014
Abstract
In many developing countries, public sector absence is both common and resistant toreform. One explanation for this is that politicians provide public jobs with limitedwork requirements as patronage. We test this patronage hypothesis in Pakistan using:(i) a randomized controlled evaluation of a novel smartphone absence monitoring tech-nology; (ii) data on election outcomes in the 240 constituencies where the experimenttook place; (iii) attendance recorded during unannounced visits and; (iv) surveys ofconnections between local politicians and health staff. Four results support this view.First, while doctors are present at 42 percent of clinics in competitive constituencies,they are present at only 13 percent of clinics in uncompetitive constituencies. Second,doctors who know their local parliamentarian personally are present at an average of0.727 of three unannounced visits, while doctors without this connection are presentat 1.309 of the three visits. Third, around 40 percent of inspectors and health admin-istrators report interference by politicians when they try to sanction doctors. Fourth,the effect of the smartphone monitoring technology, which almost doubled inspectionrates, is highly localized to competitive constituencies. Last, we find evidence thatprogram impact is in part due to the transmission of information to senior officers.We test this by manipulating the salience of staff absence in data presented to officialsusing an online dashboard. These effects are also largest in politically competitiveconstituencies. Our results have implications for the study of bureaucratic incentivesin fragile states and are potentially actionable for policymakers trying to build statecapacity.
∗Authors’ Note: We thank Farasat Iqbal, Asim Fayaz, and Zubair for assistance in implementation.Support is provided by the International Growth Centre (IGC) political economy program and the IGCPakistan Country Office. We thank Eli Berman, Ali Cheema, Naved Hamid, Gordon Hanson, Asim Khwaja,Craig McIntosh, Ijaz Nabi, Gerard Padro-i-Miquel, Jacob N. Shapiro, Christopher Woodruff and variousseminar participants for insightful comments. Excellent research assistance was provided by Muhammad ZiaMehmood, Haseeb Ali, and Arman Rezaee. We thank Ali Cheema and Farooq Naseer for kindly sharingtheir data on election outcomes.†University of California, Los Angeles. email: [email protected]‡New York University. email: [email protected]§Lahore University of Management Sciences. email: [email protected]¶International Growth Centre - Pakistan. email: [email protected]
1
1 Introduction
Patronage politics often leads to the selection of inefficient policies. In clientelistic systems,
politicians win office by providing targeted benefits to supporters at the cost of services
which provide broader collective benefits, with negative implications for political stability,
economic, and human development.1 Government jobs are commonly used for patronage. In
developing countries, government employees are also frequently absent despite being gener-
ally well-compensated.2 Moreover, public sector absence also tends to be intractable. Many
policies aimed at improving attendance only work temporarily. We investigate whether the
persistence of public sector absence in developing countries is linked to the use of public jobs
as patronage.
Governments jobs are ideal for patronage; they can be targeted to individuals, provide a
credible stream of benefits, and are reversible (Robinson and Verdier 2002). This is partic-
ularly true if politicians can minimize the actual work required in the position. Historically,
jobs have been used as patronage in many settings. Chubb (1983) argues that, under the
control of the Christian Democrats in Naples and Palermo during the 1950s, politicians al-
located public sector jobs “on the basis of political favoritism, often having nothing to do
with effective work loads or even with the actual presence of the employee in his office.” So-
rauf (1956) describes a similar system for road workers in Centre County, Pennsylvania and
Johnston (1979) for unskilled public sector jobs in New Haven, Connecticut. Wilson (1961)
describes the centrality of public jobs in maintaining the Tammany Hall political machine
in New York and the Democratic Party machine in Chicago in the early 20th century. In all
1Bates (1981) provides the authoritative account relating to Africa’s development, arguing that Africangovernments deliberately overvalued their exchange rates in order to subsidize politically powerful urbanelites with cheaper imports at the expense of the rural poor. Khwaja and Mian (2005) and Fisman (2001)provide evidence that politicians provide preferential government benefits to firms and Dube et al. (2011) findpatterns in stock returns consistent with the U.S. government providing insider information to investors aboutfuture international interventions. Dahlberg and Johansson (2002) show that the Swedish central governmentallocated discretionary government grants for ecologically sustainable development based primarily on thenumber of swing voters.
2We find that 68.5 percent of doctors are absent prior to our intervention. This compares with the averageacross Bangladesh, Ecuador, India, Indonesia, Peru and Uganda of 35 percent reported in Chaudhury et al.(2006).
2
three settings, the beneficiaries commonly rewarded politicians with votes, party campaign
work, monetary contributions, and by swinging blocs of voters.3
The development literature identifies public worker absence as key obstacle to delivering
services to the poor (Banerjee and Duflo 2006; Chaudhury et al. 2006). With the notable
exception of a camera monitoring initiative in Udaipur, Rajasthan reported in Duflo et al.
(2012), absence appears unresponsive to increasing inspections, particularly when inspectors
are not assisted by technologies that limit their discretion. Banerjee and Duflo (2006) review
unsuccessful monitoring initiatives in Kenya and India, and Banerjee et al. (2008) details the
complicity of the local health administration in the failure of a monitoring initiative in rural
Rajasthan. These findings support the broader position that the effects of anti-corruption
initiatives tend to attenuate over time (Olken and Pande 2012).
These studies propose several solutions. Banerjee et al. (2008) encourage increasing
senior level ownership and improving incentives for senior managers to make sure their
subordinates are present. Chaudhury et al. (2006) explore the possibility of local monitoring,
acknowledging that decentralized management systems may be more prone to local capture.
We investigate whether public worker absence is linked to the usefulness of jobs with minimal
attendance requirements for political patronage.
We pursue five lines of analysis to investigate the links between clientelism and public
sector absence. First, we combine data on parliamentary election outcomes with indepen-
dently collected data on doctor absence. Second, we directly interview doctors to examine
whether their connections to politicians are related to their job performance and to the de-
sirability of their posting. Third, we interview both inspectors and health administrators,
directly inquiring about the frequency of interference. Fourth, we experimentally evaluate
a novel smartphone attendance monitoring program across 240 of the 297 (81 percent) of
the Provincial Assembly constituencies in Punjab, examining whether impact depends on
3Sorauf (1956) shows that the road crew organizers were more politically active than their subordinates,arguing that the strongest supporters should be placed in jobs where they have the most influence.
3
the degree of local political competition.4 Last, we manipulate the salience of health staff
absence in summaries presented to senior officials on an internet dashboard and check if the
response of politicians to these data depends on the outcomes of elections.
This investigation yields five main results which link health service provision to local
political outcomes. First, absence is more severe in less competitive political constituencies.
Second, politically connected doctors are more frequently absent. Third, reports of inter-
ference by politicians in bureaucratic decisions related to sanctioning health workers is very
common and is concentratedin politically uncompetitive constituencies. Fourth, while the
smartphone monitoring program almost doubled health worker attendance, the effects of the
program are highly localized to competitive districts. Last, we directly examine whether
impacts on doctor attendance result in part from the smartphone system channeling infor-
mation to senior health officials. We do this by selecting an arbitrary threshold at which
facilities are flagged as underperforming on an online dashboard visible to senior officials.
Flagging a facility reduces subsequent doctor absence by about 18 percent. These effects
are highly localized to competitive constituencies. Placebo tests of alternative arbitrary
thresholds support the causal interpretation of these findings.
We point to three central implications. First, our data link the finding in development
economics that absence is both severe and difficult to address to the observation in polit-
ical science that public jobs represent a core means of patronage. Second, remedying the
problem of absence faces the challenge of well-protected government jobs being an attractive
means of patronage, both for politicians and constituents. This suggests that lasting im-
provements to health worker attendance may require strictly limiting the ability of elected
politicians to interfere in the allocation of public sector jobs. Additionally, policies which
reduce politicians reliance on patronage may address the problem of absence. Last, our
smartphone monitoring system, which required only 90 smart phones to implement, more
than doubled health inspections in half of province with a population the size of Germany.
4There are 371 seats in the Punjab Provincial Assembly. Of these, 66 are reserved for women and eightare reserved for non-muslims, leaving 297 elected seats.
4
This suggests promise for Information Communications Technology as a means of improving
the monitoring of public service delivery.
The paper proceeds as follows: Section 2 provides institutional details of the public
health sector and describes the smartphone monitoring technology. Section 3 describes the
experimental evaluation. Section 4 reviews the primary data on absence. Section 5 presents
our non-experimental analysis of election outcomes and doctor absence. Section 6 provides
results from the experiment and Section 7 concludes.
2 Background
2.1 The Public Health System
In Punjab province, the provision of health care services is managed by the Department of
Health, which is based at the provincial headquarters in Lahore. There are five major types
of facilities: (1) Basic Health Unit (BHU); (2) Rural Health Center (RHC); (3) Tehsil Head-
We focus on Basic Health Units (BHUs). BHUs are the smallest public health care units.
They are designed to be the first stop for patients seeking medical treatment in govern-
ment facilities. (Hereafter in this paper, we use the word ‘clinic’ interchangeably to describe
BHUs). There are 2496 BHUs in Punjab.6 They largely serve rural populations; almost all
such clinics are exclusively operating in rural and peri-urban areas. These clinics provide
several services, including out-patient services, neo-natal and reproductive healthcare, and
vaccinations against diseases. Each facility is headed by a doctor, known as the Medical Offi-
cer, who is supported by a Dispenser, a Lady Health Visitor, a School Health and Nutrition
Supervisor, a Health/Medical Technician, a Mid-wife and other ancillary staff. Officially,
clinics are open, and all staff are supposed to be present, from 8am to 2pm.
5In Punjab, a Tehsil is the largest sub-division of a district6Each Basic Health Unit serves approximately one Union Council (Union Councils are smallest adminis-
trative units in Pakistan).
5
Health Secretary
Execu/ve District Officer (EDO)
Deputy District Officer (DDO)
Medical Officer (MO)
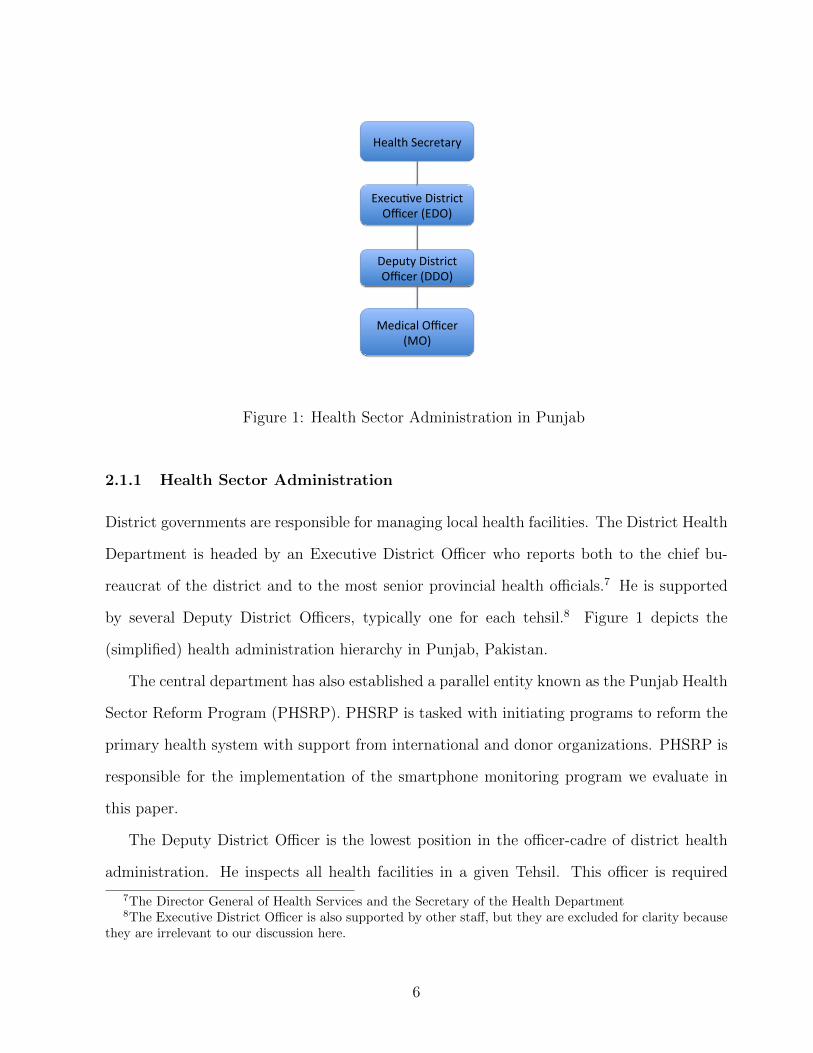
Figure 1: Health Sector Administration in Punjab
2.1.1 Health Sector Administration
District governments are responsible for managing local health facilities. The District Health
Department is headed by an Executive District Officer who reports both to the chief bu-
reaucrat of the district and to the most senior provincial health officials.7 He is supported
by several Deputy District Officers, typically one for each tehsil.8 Figure 1 depicts the
(simplified) health administration hierarchy in Punjab, Pakistan.
The central department has also established a parallel entity known as the Punjab Health
Sector Reform Program (PHSRP). PHSRP is tasked with initiating programs to reform the
primary health system with support from international and donor organizations. PHSRP is
responsible for the implementation of the smartphone monitoring program we evaluate in
this paper.
The Deputy District Officer is the lowest position in the officer-cadre of district health
administration. He inspects all health facilities in a given Tehsil. This officer is required
7The Director General of Health Services and the Secretary of the Health Department8The Executive District Officer is also supported by other staff, but they are excluded for clarity because
they are irrelevant to our discussion here.
6
to visit every clinic at least once a month and record information collected during the visit
on a standard form. The Deputy District Officer has authority to punish the clinic’s absent
staff by issuing a show-cause notice, suspension and withholding pay (in case of contract
staff). The Executive District Officer relies entirely on this subordinate officer to ensure
staff presence. As the administrative head of the health department in the district, the
Executive District Officer desires smooth functioning of the setup at minimum acceptable
level. He relies on the Deputy District Officer to ensure this smooth function by sanctioning
underperforming facilities in terms of staff attendance, medicine availability and cleanliness
etc.
2.1.2 Career Concerns and Internal Agency Problems
The Executive District Officer faces a severe agency problem in managing his deputy inspec-
tors. This is for several reasons. First, he has limited visibility into the inspectors’ activities.
Second, he has only two weak means of sanctioning an inspector. He can either issue a
verbal reprimand or, in serious cases, send a written request for investigation to provincial
authorities. The investigation process is long, highly bureaucratic, and prone to interference
by elected politicians.
The career concerns of the Executive District Officer and his deputy inspectors are also
fundamentally different. The Executive District Officer reports directly to senior provincial
authorities who face few bureaucratic hurdles to sanctioning and hold him directly account-
able for service delivery in his district. Performance for the Executive District Officer is
commonly rewarded with appointment to a higher office. In contrast, the Deputy District
Officers are neither officially nor practically accountable for health service delivery. Ap-
pointees to this position have to serve for years before they are considered for promotion
to the next level in the district. This lack of opportunity to move to a leadership position
outside of the district setup diminishes immediate interest in improving the outcomes in the
Tehsil, and creates misaligned interests between them and the Executive District Officers.
7
2.1.3 Doctors and Politicians
Influence over public sector positions provide politicians two means of patronage. First,
politicians help health officials obtain postings in their region of choice (often their home
union council). Second, once posted, health officials also appeal to politicians for protection
against suspension, transfer, and other sanctions for underperformance.
Many staff members belong to politically powerful clans and families. These staff can
provide three types of favors to politicians. First, they can activate their networks to mobilize
votes. Second, health staff are commonly recruited to assist the election commission with
drawing up voter lists and overseeing polling on election day. Third, they can provide
preferential care to supporters or condition care on support.
There are two different hiring processes for the Medical Officers currently in practice. The
first process of hiring is through Punjab Provincial Service Commission (PPSC). Through
this route the Medical Officer becomes part of the bureaucracy either temporarily or perma-
nently depending on the nature of positions that are being filled. PPSC is a statuary body
tasked with hiring of human resources for various arms of the provincial government. The
commission floats an advertisement with details of the hiring process[1]. Individuals who
have completed MBBS and are registered with Pakistan Medical and Dental Council are
eligible to apply to these positions. The top candidates are called in for a test and further
shortlisted candidates are interviewed by a selection committee. The committee consists of
senior officials from PPSC, the Health Department, and the Director General Health Ser-
vices office, and a senior medical expert. Merit lists generated based on performance in the
interview are then communicated to the Health Department by PPSC. The department then
decides on the postings based on these lists.
The second process for hiring Medical Officers is devolved at the District Level. The EDO
health office advertises vacant positions locally, and shortlisted applicants are interviewed
by the EDO himself. The candidates might also be given a test designed by the EDO on the
same day. Recommendations of the EDO are conveyed to the establishment division of the
8
Health Department, which then issues offer letters to the successful applicants. However,
these doctors are only hired on a contract basis. In order to become permanent, long term
contractual MOs have to clear a promotion exam at PPSC. EDOs also have the power to
hire and appoint temporary MOs during times of high demand of services such as in the case
of an outbreak of Dengue or flood prone epidemics. Some of these MOs can be considered
preferentially for filling vacancies once the demand normalizes. However, temporary MOs
also have to clear a test at PPSC in order to become permanent.
2.2 Smartphone Monitoring
Our project attempts to explore the use of audits by government monitors as a solution to
the problem of absence. As in Duflo et al. (2012), we explore a technology-based initiative
that seeks, in part, to detect absence. There is increasing interest in using ICT to rapidly
collect information that is useful to auditors. Solving intra-bureaucracy agency problems
is a potential application. We implement a smartphone-based solution that allows health
system inspectors to upload the results of their assigned visit to a basic health facility to
an aggregating website (dashboard), which instantly updates reports at different levels of
aggregation (zonal and provincial) with the information captured by this most recent visit.
The “Monitoring the Monitors” program replaced the traditional paper-based monitoring
system, which collects data on facility utilization, resource availability, and worker absence,
with an android-based smartphone application. Data are transmitted to a central database
using a General Packet Radio Service (GPRS) in real time. Data are then aggregated and
summary statistics, charts, and graphs are presented in a format designed in collaboration
with senior health officials. That data are: (i) aggregated in the province in real time;
(ii) geo-tagged, time-stamped, and complemented with facility staff photos to check for
reliability; and (iii) available in real time to district and provincial officers through an online
dashboard. Figure 2 shows one view of the online dashboard. It presents a bar chart that
gives the number of inspections as a proportion of total assigned inspections made by each
9
Figure 2: Online Dashboard - Summary of Inspection Compliance by District
of the treatment districts.
Application development started in August 2011. After developing the application and
linking it to a beta version of the online dashboard, the system was piloted in the district
of Khanewal. We remove Khanewal district from the experimental sample. Health adminis-
tration staff were provided with smartphones and trained to use the application. The main
purpose of the pilot was to ensure that the technology was working and to refine the appli-
cation and the dashboard. During the pilot, several inspectors requested that the program
require pictures of all staff in attendance, not just the inspector because they thought it
might reduce pressure from health staff to falsify attendance.
10
3 Experiment
Our experimental sample comprised all health facilities in the district of Punjab, which has
a population of 100 million. Tens of millions of public sector health users therefore stood to
benefit from the program. While we have administrative data for all facilities, we monitor
a subsample of 850 clinics, drawn to be representative of facilities in the province, using
independent inspections. We randomly implemented the program in 18 of the 35 districts
in our experimental sample. In assigning treatment we stratified on baseline attendance
and the number of clinics in a district to ensure a roughly even number of treatments and
controls. Figure 3 depicts control and treatment districts.
We randomized at the district level. The intervention channels information about in-
spections to district health officials; randomization at a finer level is therefore very likely to
generate externalities. The Department of Health also determined that sub-district random-
ization was not administratively feasible. Cluster randomization also allays some concerns
about externalities generated by interactions between inspectors in the same district. All
inspectors in a district are required to attend monthly meetings. While they typically have
frequent interactions within districts, these relations are much weaker across districts.
4 Data
4.1 Primary Data
We collected primary data on a representative sample of BHUs 850 (34 percent) of the
2,496 Basic Health Units in Punjab. We made unannounced visits to these facilities three
times, first in November 2011, then in June 2012 and in October 2012. BHUs were selected
randomly using an Equal Probability of Selection (EPS) design, stratified on district and
distance between the district headquarters and the BHU. Therefore, our estimates of absence
are self-weighting, and so no sampling corrections are used in the analysis. All districts in
11
Figure 3: Treatment and Control Districts
12
Punjab except Khanewal are represented in our data. To our knowledge, this is the first
representative survey of BHUs in Punjab. Figure 4 provides a map of the Basic Health Units
in our experimental sample along with the different Provincial Assembly constituencies in
Punjab.
In our sample of 850 clinics, we collected data through independent inspection. Our team
collected information on staff absence and facility usage. Our staff interviewed the Medical
Officer, the Dispenser or Health/Medical Technician, and the Lady Health Visitor before
physically verifying the attendence of the Mid-Wife and the School Health and Nutrition
Specialist. Our survey teams were trained at regional hubs (four in total) where they were
trained by senior enumerator trainers and our team members. Following these trainings, the
teams made visits to BHUs in their assigned districts and remained in regular contact with
their team leaders and our research team. Surveys took three weeks to field for each wave.
The attendance sheet for the staff was filled out at the end of the interviews and in private.
Data collection and entry followed backchecks and other validation processes consistent with
academic best practice.
4.2 Election Data
We also make use of election data for the 2008 Punjab Provincial Assembly elections.9 These
data provide candidate totals by constituency for all candidates running in the election. Con-
stituencies for the Punjab Provincial Assembly are single-member. In cases of by-elections,
we consider data from the election that most immediately preceded our program. Appendix
C describes the protocol for identifying the constituency corresponding to each health facility.
9We thank Ali Cheema and Farooq Naseer for kindly sharing this data. In cases where a by-election hashappened since 2008, we take the most recent election in advance of our study
13
Control Treatment
Figure 4: Locations of Basic Health Units in the Experimental Sample
14
5 Elections and Health Worker Attendance
To motivate our analysis, we present a few correlations which suggest a relationship between
the strength of local politicians and doctor attendance. During our doctor interviews, we
collected data on doctors’ tenure in their post, the distance of their post from their hometown,
and whether they know the local Member of the Provincial Assembly (MPA) personally. To
ensure sampling of doctors who were not present at their clinics during any of our three
visits, we pursued the absent doctors until we could find them and interview them. For this
analysis, we restrict ourselves to control districts to avoid reporting correlations induced by
our treatment.
Table 1 summarizes the data used for this analysis. The data reveal that doctor at-
tendance in our control districts is quite low. While our visits took place during normal
operating hours, we were able to locate doctors in only 22.3 percent of our visits. All BHUs
are supposed to have doctors posted. However, because of a combination of a shortage of
doctors, a lack of interest in rural postings, and perhaps misreporting to disguise absence,
we find that only 53.1 percent of BHUs have doctors posted. Even accounting for this low
rate of posting, doctor are present at only 42.1 percent of actual postings. Of the set of
doctors we observe, 24 percent report knowing the doctor personally.
Table 1: Summary Statistics
Variable Mean Standard Deviation # Observations
Doctor Present (=1) 0.223 0.417 1186Doctor Posted at Clinic (=1) 0.531 0.499 1186Doctor Knows Local MPA Personally (=1) 0.24 0.428 569Distance to Doctors Hometown (minutes) 123.222 302.738 203Doctor’s Months of Service 98.872 98.769 195Distance to District Headquarters (km) 49.226 28.748 1252Catchment Population (1,000) 24.767 8.567 1243Political Concentration (0 - 1) 0.664 0.151 1247Victory Margin Share 0.17 0.152 1253
Notes: Sample: Control district clinics, survey waves 1 - 3. Political Concentration is a Herfindahl index
computed as the sum of squared vote shares for each party in a Provincial Assembly constituency ranging from
0.272 in the most competitive district to one in uncontested districts.
15
As we describe in Section 4, we identified the provincial assembly constituency in which
each of our clinics are located. In our control districts, we have clinics in 123 constituencies.
We construct two measures of the degree of local electoral capture: “political concentration,”
a normalized Herfindahl index computed as the sum of squared vote shares for each party in
the constituency divided by the maximum Herfindahl score in our sample (0.52) and “Vic-
tory Margin Share” which is simply the victory margin for the winning candidate as a share
of total votes cast in the local election. We drop two clinics in parliamentary constituency
number 124 from our analysis as the Herfindahl-Hirschman Index is 0.786, which is 5.5 stan-
dard deviations from the mean and more than 3 standard deviations from the next highest
constituency. On this sample, our normalized political concentration ranges from 0.272 in the
most competitive constituency to one in the least competitive constituency.10 The victory
margin share in these 123 constituencies ranges from 0.0015 percent to one in uncontested
districts. Figure 5 maps the political concentration measure for each constituency in Punjab.
The degree of political contestation appears only weakly correlated with geography.
In Table 2 we report correlations between these measures of local political competition
and doctor attendance. Columns (1) - (3) report regressions using the normalized political
concentration measure as an explanatory variable and (4) - (6) report the same specifications
using victory margin share. We find that doctors attend work more often in competitive
constituencies. In all specifications, we include Tehsil (county) fixed effects, which restricts
our variation to geographically proximate political constituencies that should be broadly
similar in terms of remoteness, climate, and desirability of doctor postings. While there are
a range of plausible omitted variables prohibiting a causal interpretation, we find that the
correlation is robust to including controls for catchment population, distance to the district
center, and whether a doctor was reported by other staff to be posted.
The results in Table 2 are consistent with two theories. First, it may be that in highly
competitive districts politicians face stronger incentives to make sure health services are
10Before dividing by the maximum Herfindahl score in our sample, political concentration ranges from0.14 to 0.52
Tehsil County Fixed Effects No No Yes No No No NoConstituency Fixed Effects No No No Yes Yes Yes YesSample Controls Controls Controls Controls Controls Full Sample Full Sample# Doctors 213 212 149 212 149 505 355R-Squared 0.061 0.146 0.567 0.608 0.711 0.563 0.680
Notes: *p < 0.1, **p < 0.05, ***p < 0.01. Robust standard errors reported in parentheses. Sample: control district Basic Health Units (BHUs). All
regressions include Tehsil (county) and survey wave fixed effects.
These correlations suggest that local politicians may secure office by providing sinecures
to supporters. This theory has predictions for the effectiveness of our experiment. Politically
connected inspectors and doctors should be less sensitive to monitoring. While monitoring
innovations increase the probability they are detected shirking, these incentives will not be
binding for bureaucrats who are protected by their relations to local politicians.
19
5.1 Interference in Inspector Decisions
For politicians to influence the reporting requirements of doctors, they need to interfere in
bureaucratic decisions. In this section, we review the responses of inspectors and Executive
District Officers to the following questions:
• Have you personally ever been pressured by a person with influence to either (a) not
take action against doctors or other staff that were performing unsatisfactorily in your
tehsil or district or (b) assign them to their preferred posting?
• If yes, then identify the type of influential person from the following list:
Member of National Assembly; Member of Provincial Assembly; Other Politician; Se-
nior Bureaucrat; Police; Powerful private person; Other; No response
• How many of these incidents occurred in the last year?
The results are striking. Around 40 percent of both inspectors and administrators report
political interference in their decisions. In Table 4 we present results indicating that this
type of interference is much more common for inspectors overseeing politically uncompeti-
tive constituencies. On average, inspectors overseeing competitive constituencies report two
incidents of members of the provincial assembly interfering in their decision over the course
of two years. This number is twice as large (four incidents) in uncompetitive constituen-
cies. This result is robust to restricting our data to political constituencies which are wholly
contained with in a single inspector’s jurisdiction.
20
Table 4: Interference in Inspector Decisions and Political Competition
Dependent Variable: Instances of Political Interference(1) (2) (3) (4) (5) (6)
Notes: This table reports the frequency of interference by politicians in health inspectors decisions by the level political competition. The
unit of observation is a tehsil-constituency. The dependent variable is a count of the number of times that inspectors report Members of
the Provincial Assembly pressuring them to either (a) not take action against doctors or other staff that were performing unsatisfactorily
in their jurisdiction (tehsil) or (b) assign doctors to their preferred posting in the previous two years. Of the 122 inspectors covering our
experimental sample, 102 provided responses to this question. We drop three reports which indicate more than 100 instances of interference
(99th percentile). These three observations are more than four standard deviations from the mean. The remaining 99 inspectors are
responsible for facilities spanning 213 provincial assembly constituencies. 76 of the constituencies belong to multiple inspectors’ jurisdictions.
Columns (1) through (3) report OLS regressions of the instances of interference on indicator variables for the degree of political competition
in the full sample of 213 constituencies. Jurisdictions spanning multiple constituencies are repeated with the level of political competition
in each constituency providing an observation. Columns (4) through (6) drop constituencies spanning multiple jurisdictions. Results for
only experimental control districts are reported in Table A1 and further details about the frequency and source of political interference is
provided in Table A2. The political competition index is a Herfindahl index computed as the sum of squared candidate vote shares in each
constituency. Low competition is a dummy variable equal to one for constituencies in the top tercile of this index and medium competition
is a dummy variable for constituencies in the middle tercile. Level of significance: *p < 0.1, **p < 0.05, ***p < 0.01. Standard errors
clustered at the jurisdiction (tehsil) level reported in parentheses.
21
6 Experimental Results
With this motivation as background, we now present our experimental results. Table 5
verifies balance in our experiment. As we discuss in Section 3, we stratified treatment on
the share of staff present during our baseline interview. While this achieved balance for five
of the six categories of staff that are supposed to be present at BHUs, we have a large and
significant imbalance for doctors. Figure A2 reports a long time series of administrative
data on doctor attendance from paper records. We find that the difference in levels does
not reflect a difference in pre-treatment trends, allaying some concerns that our fixed effects
estimates are not causal.11
We begin by examining the impact of treatment on health worker attendance. We test
for impacts on inspectors, where the program provides the sharpest incentives, doctors, and
total staff.
We estimate regressions of the form:
Ydit = α + βTreatmentdit +3∑
i=1
δt + λi + εdit (2)
Ydit is health worker attendance or official inspection, where i refers to the clinic, d refers
to the district, and t to the survey wave. We cluster all standard errors at the district level.
With only 35 districts, we also use randomization inference. Figure A1 shows our actual
impact against impacts estimated from 1,000 hypothetical treatment assignments.
The first column verifies that the program increased inspections. The smartphone mon-
itoring system directly impacts health inspectors, as their activities are geostamped, times-
tamped, and observed in real time. We do not observe any significant average impacts on
doctor or overall staff attendance.
Panel B reports results splitting the treatment by survey wave 2 (May 2012) and wave 3
(October 2012). In column one, we see that the large impact on inspection has attenuated
11Note that this depicts the sample average. The effects we find on doctor attendance are localized to thesubsample of clinics in competitive districts.
District FEs No Yes No Yes# Observations 523 523 178 178# Staff 348 348 152 152R-Squared 0.025 0.149 0.050 0.334Sample Full Full Discontinuity Discontinuity
Doctor Absent in Unannounced Visit (=1)Panel B - Placebo Flags (1) (2) (3) (4)
Placebo Flag -0.047 0.014 0.123 0.145(0.071) (0.069) (0.098) (0.094)
District FEs No Yes No Yes# Observations 523 523 121 121# Staff 348 348 105 105R-Squared 0.014 0.143 0.080 0.334Sample Full Full Discontinuity Discontinuity
Notes: *p < 0.1, **p < 0.05, ***p < 0.01. Standard errors clustered at the clinic level reported in parentheses. The
Discontinuity sample are facility-month observations where either two or three (the threshold to trigger the underreporting red
flag) are recorded on the dashboard. All regressions include survey wave fixed effects. Explanatory variables reflect data from
the most recent official inspection recorded on the dashboard the month before our unannounced visit.
32
Table 10: The Effect of Flagging by Political Concentration
Doctor Absent in Unannounced Visit (=1)(1) (2) (3) (4)
District FEs No Yes No Yes# Observations 523 523 178 178# Staff 348 348 152 152R-Squared 0.036 0.153 0.080 0.358Sample Full Full Discontinuity Discontinuity
Notes: *p < 0.1, **p < 0.05, ***p < 0.01. Standard errors clustered at the clinic level reported in parentheses.
The Discontinuity sample are facility-month observations where either two or three (the threshold to trigger the
underreporting red flag) are recorded on the dashboard. All regressions include survey wave fixed effects.
7 Conclusion
In clientelistic systems, politicians gain office by providing targeted goods to supporters
instead of by effectively providing public goods. We examine a particular case: doctors
may be absent and unavailable to provide health care because their position is a sinecure
provided in return for political support. Four findings support this explanation for public
worker absence. First, absence is significantly more severe in less competitive districts.
Second, politically connected workers are absent more frequently. Third, the effects of a
novel monitoring technology on the performance of government monitors remain localized to
competitive districts. Fourth, highlighting employee absence to senior managers only results
in subsequent decreases in absence in competitive districts.
Doctor, teacher, and other public worker absence is a serious obstacle to effective public
service delivery in developing countries (Banerjee and Duflo 2006; Chaudhury et al. 2006).
In many cases, it is also highly resistant to interventions aimed at promoting attendance.
33
Understanding the political rationale for public worker absence opens a broader set of inter-
ventions to combat the problem. First, professionalizing the civil service, and eliminating
politicians involvement in decisions related to bureaucratic hiring, firing, promotion, and
posting would remove the opportunity to use these positions as patronage. Second, increas-
ing voters awareness of public worker absence might amplify the political costs from voters
not motivated by patronage.12
Our experiment also demonstrates the promise of using Information Communication
Technology to improve public sector monitoring. These technologies can rapidly gather and
aggregate information useful to an auditor at very low cost. Our intervention was cheap
and straightforward to implement and more than doubled inspections in a country where
they were happening at only 22 percent of the officially prescribed rate. Moreover, such
approaches require little if any international support, and may be incentive-compatible, and
so sustainable, for senior policymakers and politicians who would like to reduce absence but
merely lack the information to do so.
More generally, anti-corruption efforts often face challenges in sustaining effect. Our
findings suggest that in some cases the resilience of public sector corruption may be because
it is maintained for reasons of political expedience. Given the huge potential payouts to
politicians from facilitating corruption, future research in the economics of corruption might
consider the political rationale for corruption. Such investigations could broaden the set of
anti-corruption policies and increase their impact.
References
Banerjee, Abhijit and Esther Duflo, “Addressing Absence,” The Journal of Economic
Perspectives, 2006, 20 (1), 117–132.
12Along these lines, Wilson (1961) states “organized guardians of the civic purse will not permit corruptpoliticians to increase city expenditures through certain kinds of projects (for example, urban renewal, street-lighting, street-cleaning, building inspection, fire and police protection) but not through others (increasingthe staffs of aldermen, multiplying executive secretariats, and hiring men to do jobs which machines can dobetter—such as operating elevators, sweeping streets, etc.)”
34
Banerjee, Abhijit V., Esther Duflo, and Rachel Glennerster, “Putting a Band-Aid
on a Corpse: Incentives for Nurses in the Indian Public Health Care System,” Journal of
the European Economic Association, 04-05 2008, 6 (2-3), 487–500.
Bates, Robert H., Markets And States In Tropical Africa: The Political Basis Of Agri-
cultural Policies California Series on Social Choice & Political Economy, University of
California Press, 1981.
Chaudhury, Nazmul, Jeffrey Hammer, Michael Kremer, Karthik Muralidharan,
and F. Halsey Rogers, “Missing in Action: Teacher and Health Worker Absence in
Developing Countries,” Journal of Economic Perspectives, Winter 2006, 20 (1).
Chubb, J., Patronage, Power and Poverty in Southern Italy: A Tale of Two Cities Cam-
bridge Studies in Modern Political Economies, Cambridge University Press, 1983.
Dahlberg, Matz and Eva Johansson, “On the Vote-Purchasing Behavior of Incumbent
Governments,” The American Political Science Review, March 2002, 96 (1), 27 – 40.
Dube, Arindrajit, Ethan Kaplan, and Suresh Naidu, “Coups, Corporations, and
Classified Information,” The Quarterly Journal of Economics, 2011.
Duflo, Esther, Rema Hanna, and Stephen P. Ryan, “Incentives Work: Getting Teach-
ers to Come to School,” The American Economic Review, 2012, 102 (4), 1241–1278.
Fisman, Raymond, “Estimating the Value of Political Connections,” American Economic
Review, 2001, 91 (4), 1095–1102.
Johnston, Michael, “Patrons and Clients, Jobs and Machines: A Case Study of the Uses
of Patronage,” The American Political Science Review, 1979, 73 (2), 385–398.
Notes: This table reports the frequency of interference by politicians in health inspectors decisions by the level political competition.
The dependent variable is a count of the number of times that inspectors report Members of the Provincial Assembly pressuring them
to either (a) not take action against doctors or other staff that were performing unsatisfactorily in their jurisdiction (tehsil) or (b) assign
doctors to their preferred posting in the previous two years. Of the 122 inspectors covering our experimental sample, 102 provided
responses to this question. We drop three reports which indicate more than 100 instances of interference (99th percentile). These three
observations are more than four standard deviations from the mean. The remaining 99 inspectors are responsible for facilities spanning
213 provincial assembly constituencies. 63 of the constituencies belong to multiple inspectors’ jurisdictions. Columns 1 through 3 report
OLS regressions of the instances of interference on indicator variables for the degree of political competition in the full sample of 213
constituencies. Columns 4 through 6 drop constituencies spanning multiple jurisdictions. Level of significance: *p < 0.1, **p < 0.05,
***p < 0.01. Standard errors clustered at the jurisdiction (tehsil) level reported in parentheses.
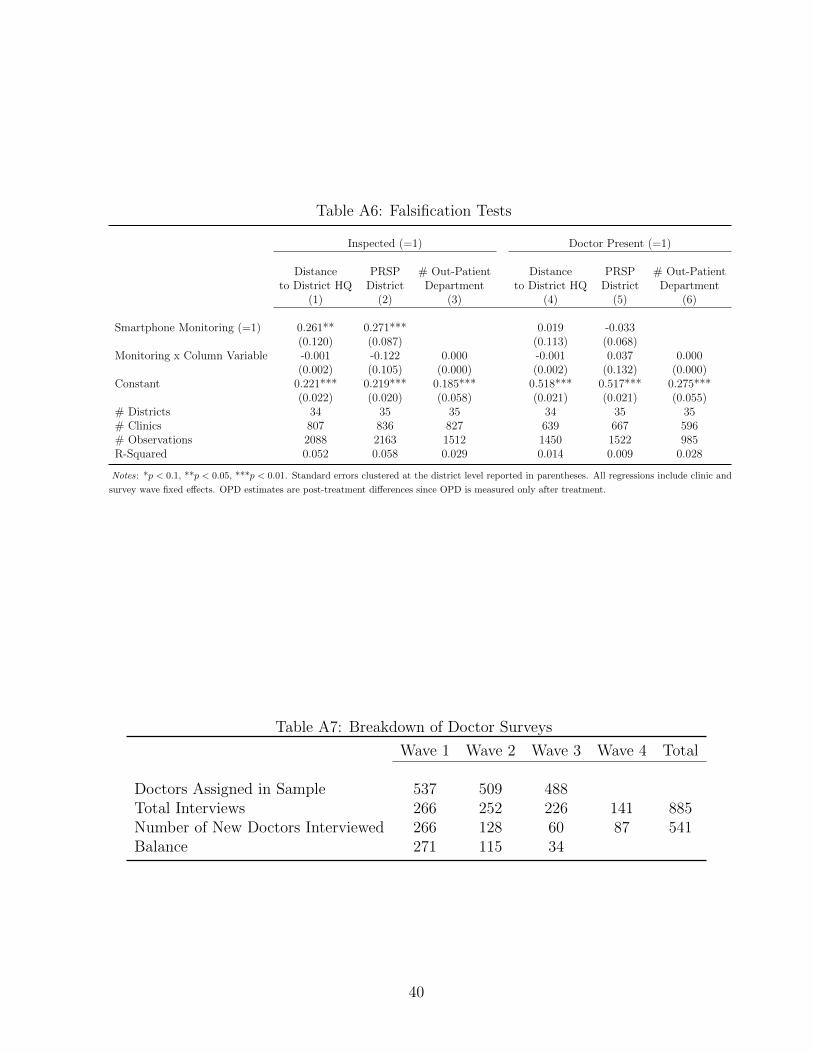
B Finding Doctors
Doctors were frequently absent during our unannounced visits. Consequently, we had to
make a concerted effort to find all of the doctors assigned in our sample. We tracked down
541 doctors after the completion of our three unannounced field visits and an additional
announced visit that was specifically carried out to interview doctors that were absent in
the previous waves. Table A7 describes the breakdown of our sample.
37
Table A2: Political Interference in Service Delivery
Inspectors SupervisorsMean SD N Mean SD N
Colleague ever influenced? 0.479 0.502 117 0.537 0.502 67by MNA 0.857 0.353 56 0.889 0.319 36by MPA 0.893 0.312 56 0.889 0.319 36by other Politician 0.161 0.371 56 0.306 0.467 36by senior Bureaucrat 0.143 0.353 56 0.222 0.422 36by Police 0.054 0.227 56 0.056 0.232 36by Private Person 0.125 0.334 56 0.167 0.378 36# of times pressure, last year 7 56.761 55 10 19.019 35# of times decision not changed, last year 2 14.765 52 1 25.871 33# of times pressure, last 2 years 14 85.219 55 10 21.607 33# of times decision not changed, last 2 years 3 23.282 52 2.500 27.050 30
Notes: We trim all variables in the lower panel at the 99 percentile.
Table A3: Summary Statistics for Doctor Cross-section
Variable Mean Standard Dev. # Obs.
Doctor Present (Max = 3) 1.22 0.847 214Doctor Knows Local MPA Personally (=1) 0.154 0.362 214Patients Treated Monthly 1397.897 664.72 214Catchment Population (1,000) 26.757 8.871 214Distance to District Headquarters(km) 44.709 27.707 213
Notes: Sample: Control district clinics with doctors responding to question on connection to the
local MPA. Survey waves 1 - 3 are collapsed to a single doctor cross-section.
38
Table A4: Randomization VerificationHigh Political Competition Mid Political Competition Low Political Competition
Control Treatment p-value Control Treatment p-value Control Treatment p-valueBHU open during visit (=1) 0.893 0.907 0.813 0.912 0.934 0.590 0.976 0.953 0.383
[0.310] [0.291] [0.284] [0.250] [0.153] [0.212]DDO Has Visited in the Last Month (=1) 0.160 0.209 0.472 0.276 0.229 0.612 0.262 0.198 0.467