57
The potential of fillers to mitigate GHG in Cement-based materials Vanderley M. John Maria Alba Cincotto Rafael G Pileggi .....
The potential of fillers to mitigate GHG in
Cement-based materials
Vanderley M. John
Maria Alba Cincotto
Rafael G Pileggi
.....

Background
• Prospective studies: • RoadMap Cement Industry - Brazil
• UNEP SBCI Working Group
• A candle-light guiding to a desirable the future.
• Our achievements are limited by our ambitions
• “Moore’s Law”
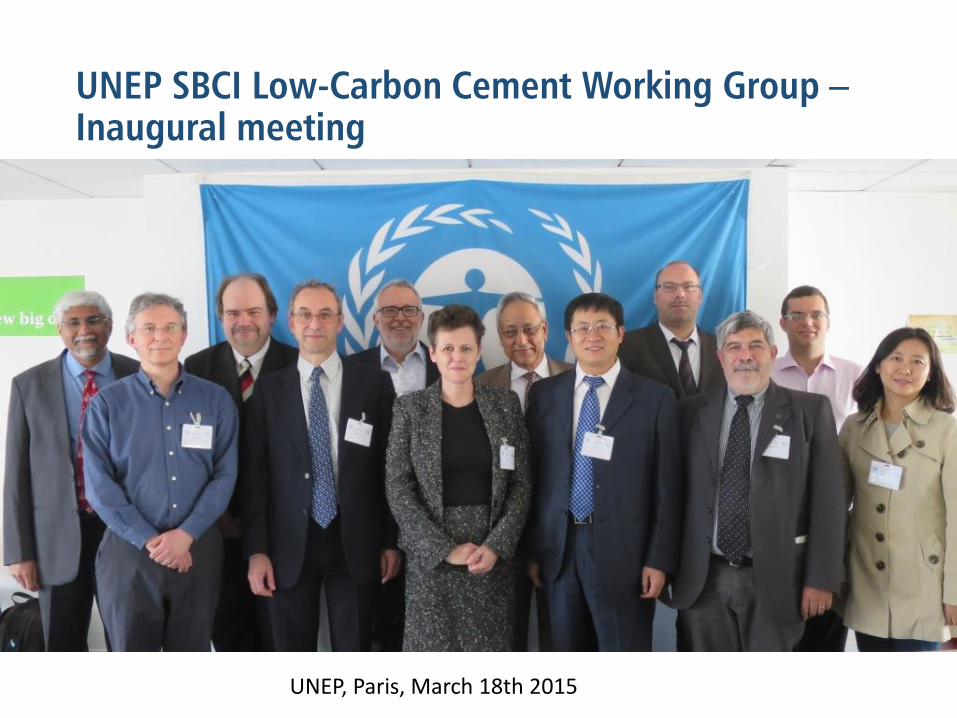
UNEP SBCI Low-Carbon Cement Working Group – Inaugural meeting
UNEP, Paris, March 18th 2015
Slag + Fly ash are not enough
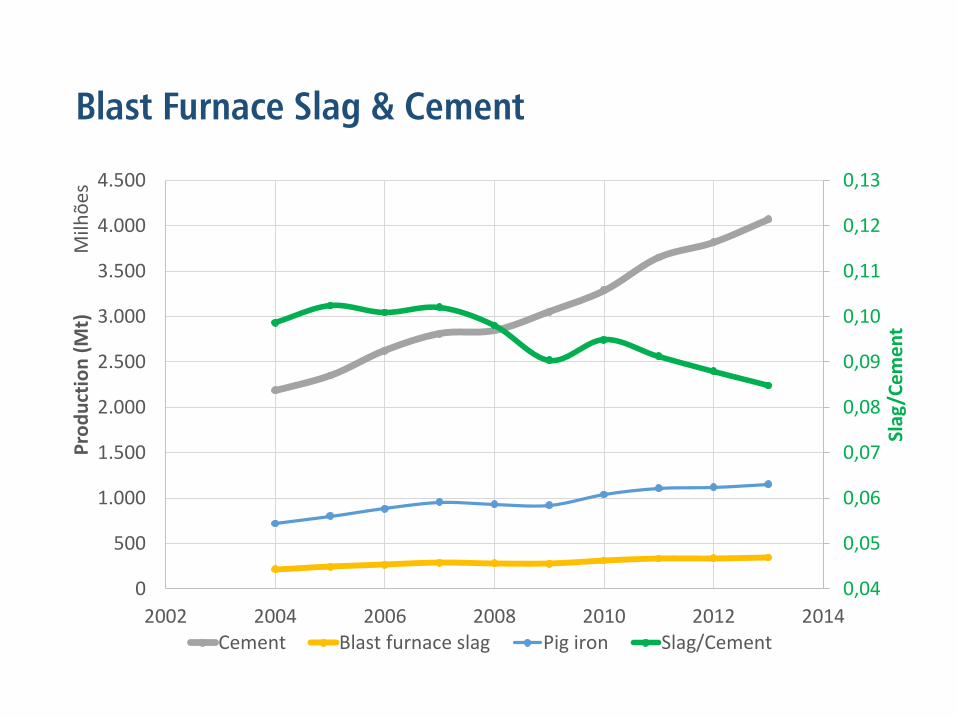
Blast Furnace Slag & Cement
0,04
0,05
0,06
0,07
0,08
0,09
0,10
0,11
0,12
0,13
0
500
1.000
1.500
2.000
2.500
3.000
3.500
4.000
4.500
2002 2004 2006 2008 2010 2012 2014
Slag
/Ce
me
nt
Pro
du
ctio
n (
Mt)
M
ilhõ
es
Cement Blast furnace slag Pig iron Slag/Cement
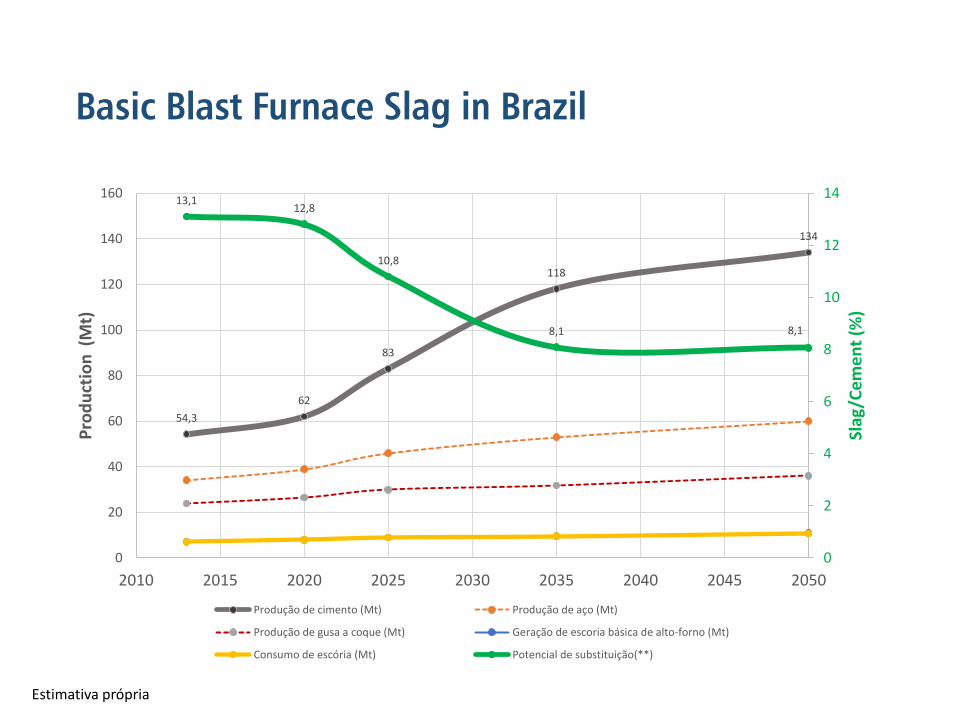
Basic Blast Furnace Slag in Brazil
54,3
62
83
118
134
13,1 12,8
10,8
8,1 8,1
0
2
4
6
8
10
12
14
0
20
40
60
80
100
120
140
160
2010 2015 2020 2025 2030 2035 2040 2045 2050
Slag
/Ce
me
nt
(%)
Pro
du
ctio
n (
Mt)
Produção de cimento (Mt) Produção de aço (Mt)
Produção de gusa a coque (Mt) Geração de escoria básica de alto-forno (Mt)
Consumo de escória (Mt) Potencial de substituição(**)
Estimativa própria
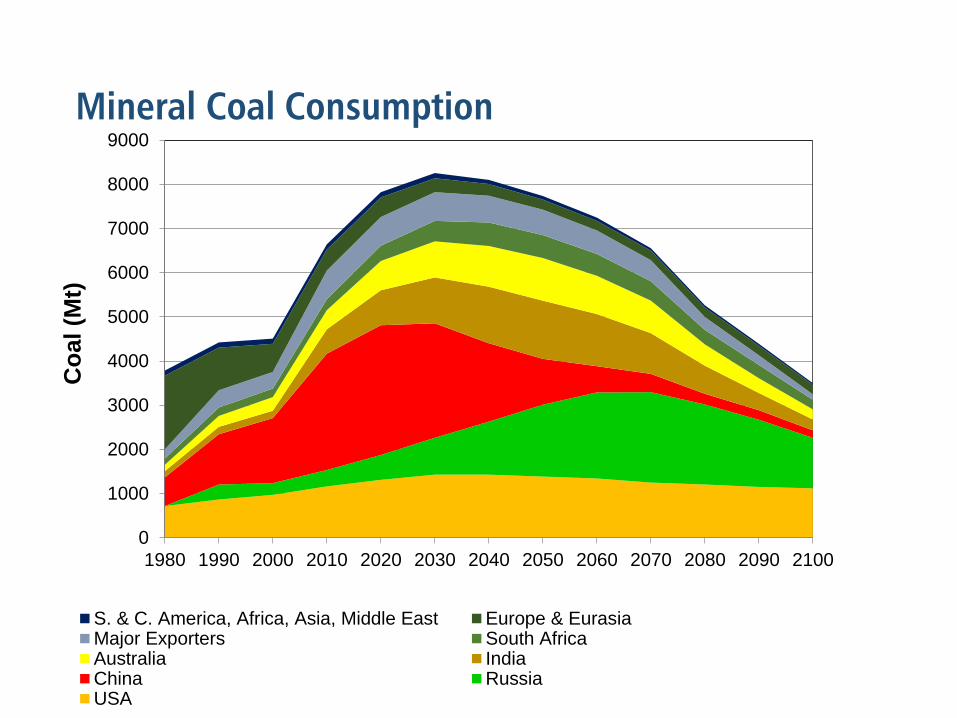
Mineral Coal Consumption
0
1000
2000
3000
4000
5000
6000
7000
8000
9000
1980 1990 2000 2010 2020 2030 2040 2050 2060 2070 2080 2090 2100
Co
al (M
t)
S. & C. America, Africa, Asia, Middle East Europe & EurasiaMajor Exporters South AfricaAustralia IndiaChina RussiaUSA
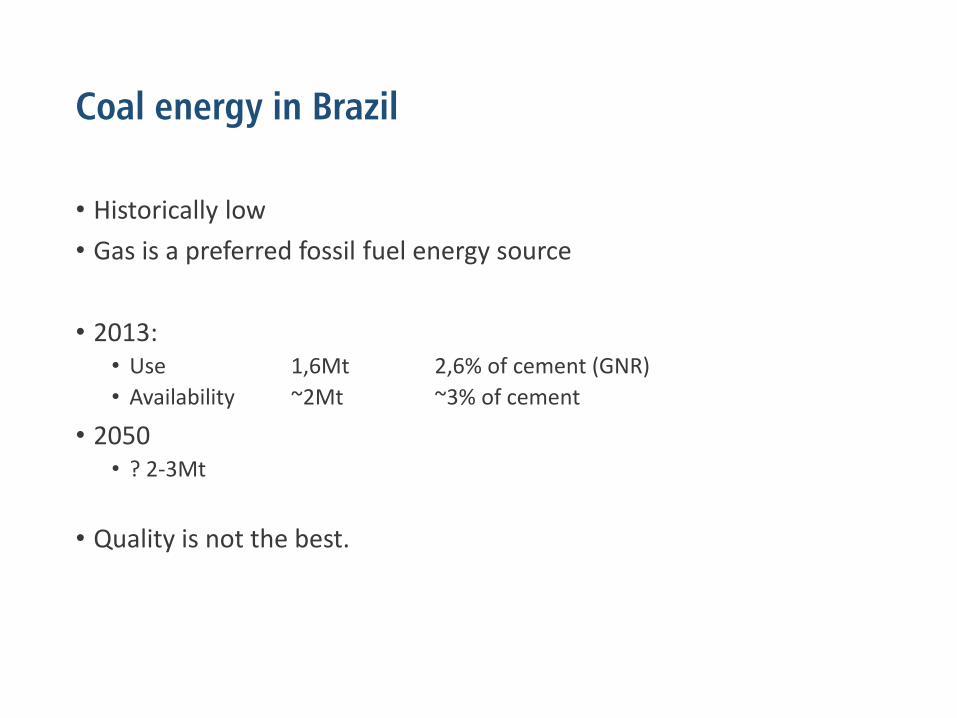
Coal energy in Brazil
• Historically low
• Gas is a preferred fossil fuel energy source
• 2013: • Use 1,6Mt 2,6% of cement (GNR)
• Availability ~2Mt ~3% of cement
• 2050 • ? 2-3Mt
• Quality is not the best.
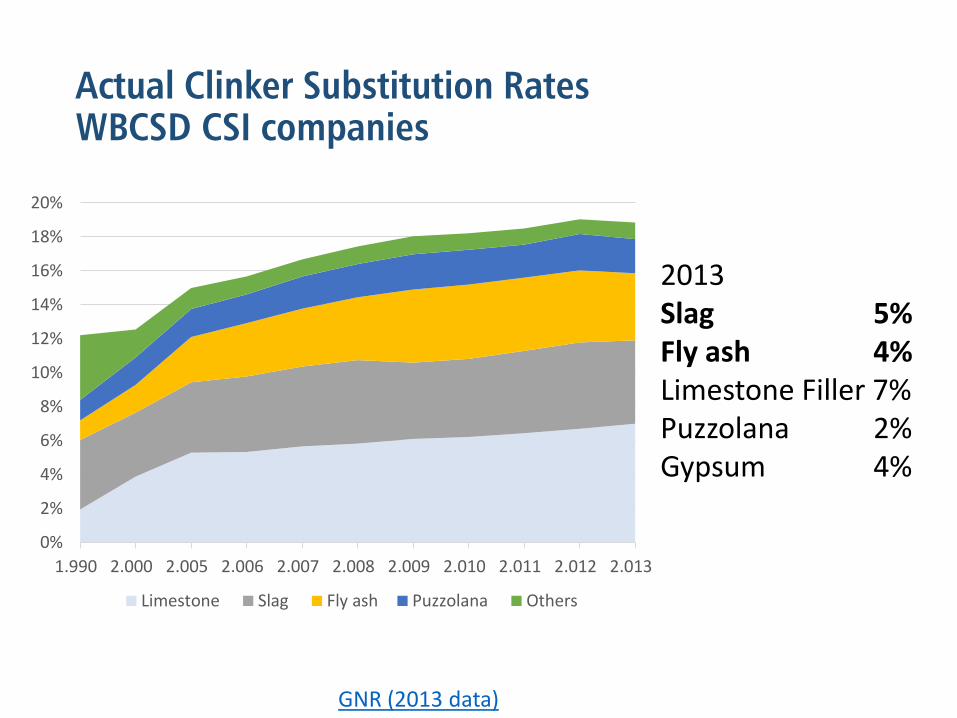
Actual Clinker Substitution Rates WBCSD CSI companies
GNR (2013 data)
0%
2%
4%
6%
8%
10%
12%
14%
16%
18%
20%
1.990 2.000 2.005 2.006 2.007 2.008 2.009 2.010 2.011 2.012 2.013
Limestone Slag Fly ash Puzzolana Others
2013 Slag 5% Fly ash 4% Limestone Filler 7% Puzzolana 2% Gypsum 4%

Fly Ash + Slag
• Global shortage & eventual local abundance
• <15% of cement
• Quality, contamination and logistics are crucial.
• Brazil: • shortage of slag and fly ash
• ~ 10%
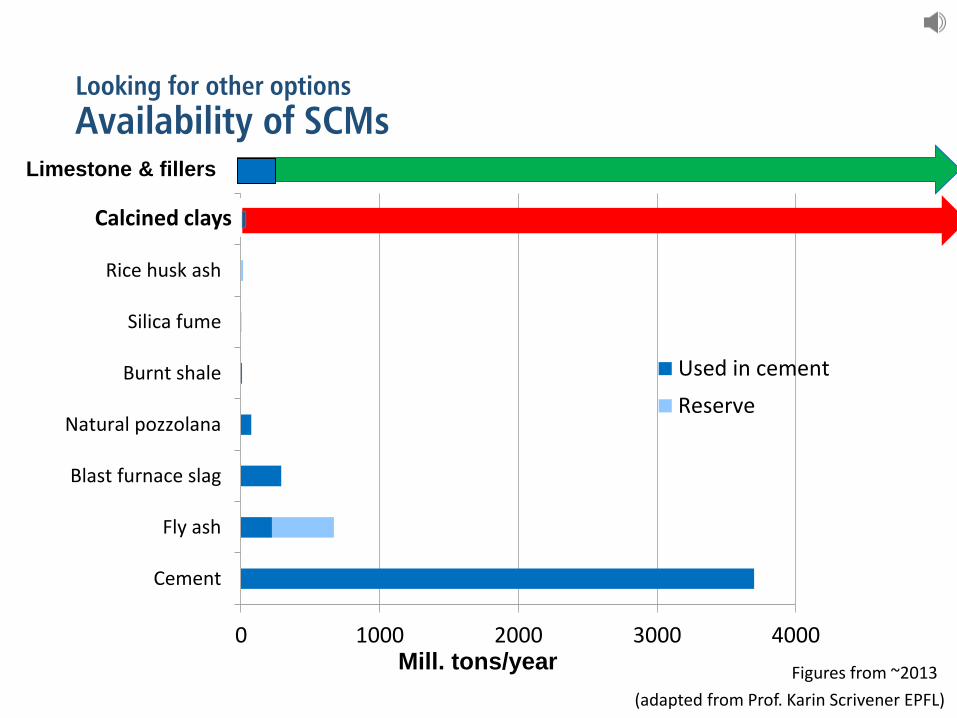
Looking for other options
Availability of SCMs
0 1000 2000 3000 4000
Cement
Fly ash
Blast furnace slag
Natural pozzolana
Burnt shale
Silica fume
Rice husk ash
Metakaolin
Mill. tons/year
Used in cement
Reserve
Limestone & fillers
Figures from ~2013
(adapted from Prof. Karin Scrivener EPFL)
Calcined clays
Why fillers?

100 years old successful experience
Arrowrock Dam – USA – 1916
50% clinker subtitution by grounde granite (quartz)
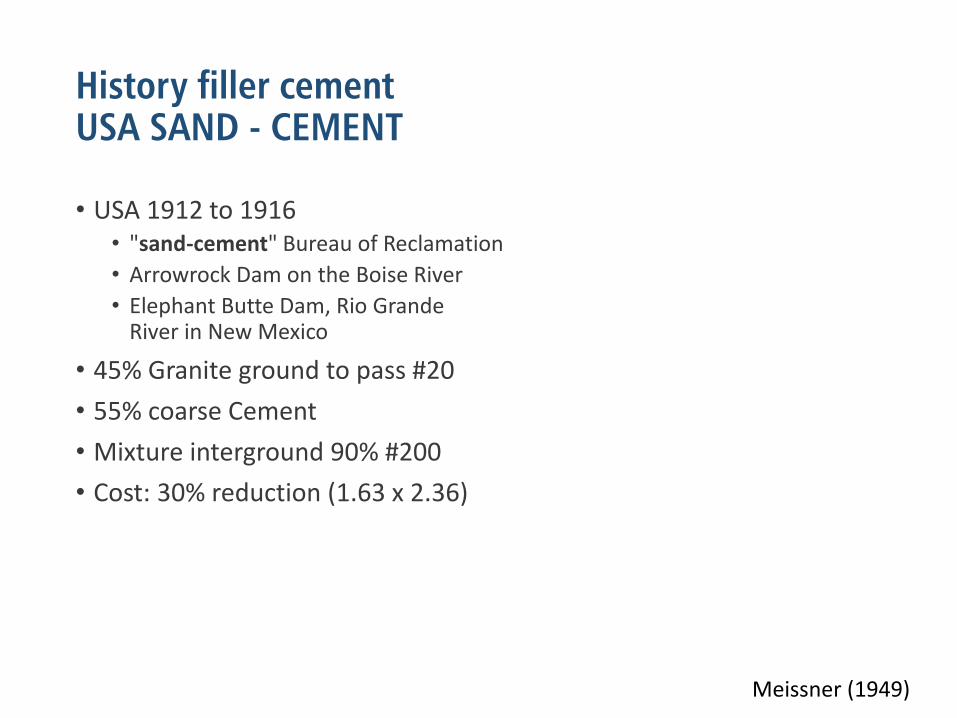
History filler cement USA SAND - CEMENT
• USA 1912 to 1916 • "sand-cement" Bureau of Reclamation
• Arrowrock Dam on the Boise River
• Elephant Butte Dam, Rio Grande River in New Mexico
• 45% Granite ground to pass #20
• 55% coarse Cement
• Mixture interground 90% #200
• Cost: 30% reduction (1.63 x 2.36)
Meissner (1949)
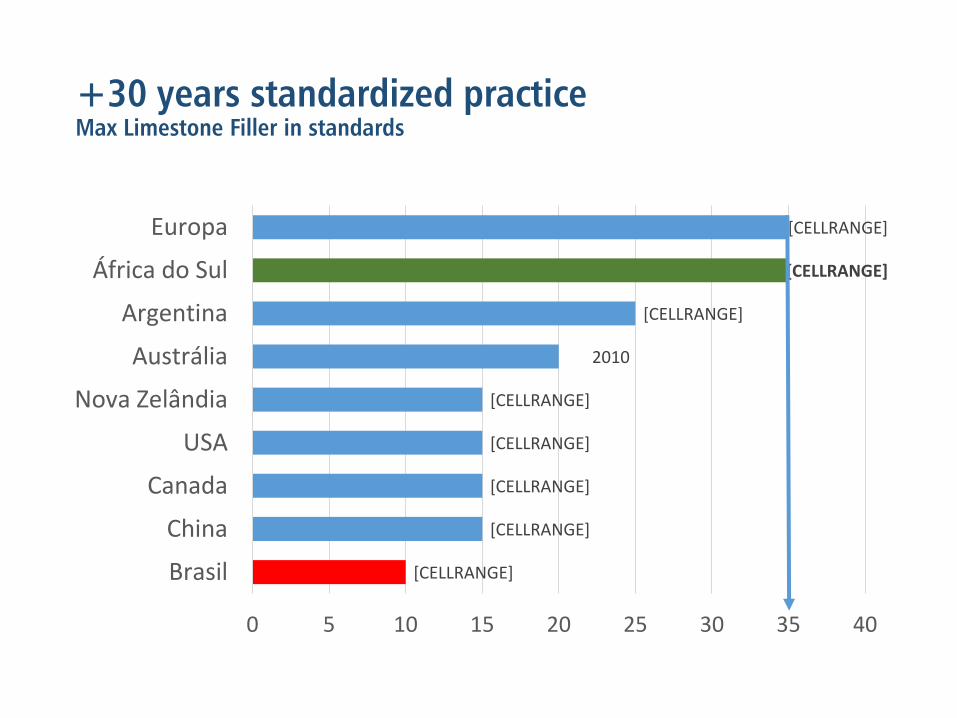
+30 years standardized practice Max Limestone Filler in standards
[CELLRANGE]
[CELLRANGE]
[CELLRANGE]
[CELLRANGE]
[CELLRANGE]
2010
[CELLRANGE]
[CELLRANGE]
[CELLRANGE]
0 5 10 15 20 25 30 35 40
Brasil
China
Canada
USA
Nova Zelândia
Austrália
Argentina
África do Sul
Europa
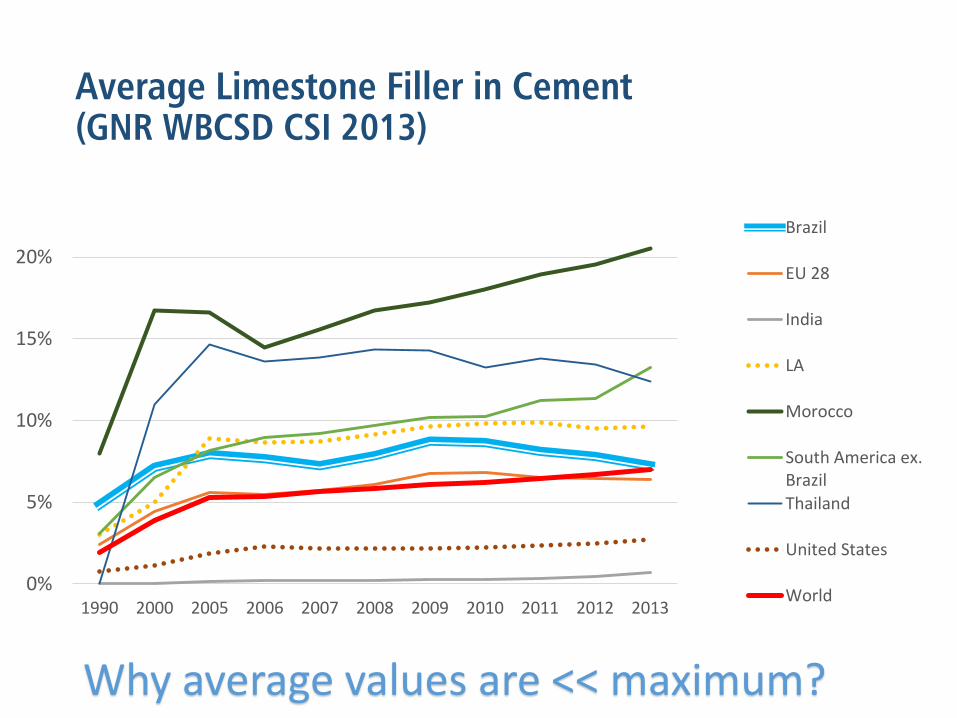
Average Limestone Filler in Cement (GNR WBCSD CSI 2013)
0%
5%
10%
15%
20%
1990 2000 2005 2006 2007 2008 2009 2010 2011 2012 2013
Brazil
EU 28
India
LA
Morocco
South America ex.Brazil
Thailand
United States
World
Why average values are << maximum?
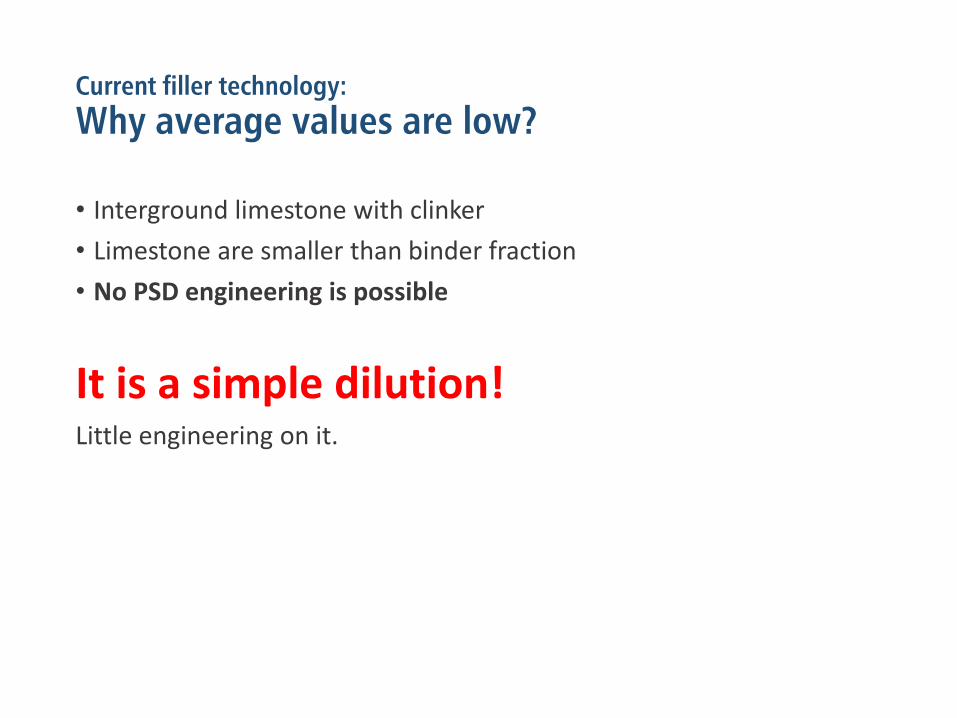
Current filler technology:
Why average values are low?
• Interground limestone with clinker
• Limestone are smaller than binder fraction
• No PSD engineering is possible
It is a simple dilution! Little engineering on it.

Binder Dilution increases Porosity
0,30
0,35
0,40
0,45
0,50
1,00
1,01
1,02
1,03
1,04
1,05
1,06
0 10 20 30 40
Pas
te p
oro
sity
(v/
v)
Re
ativ
e p
aste
vo
lum
e (
v/v)
Filler Content (% w/w)
Density: Cement 3.1 g/cm³; Filler 2,6 g/cm;
Combined Water : 0,24g/g binder, w/solids constant

Porosity controls strength
0,29 0,39 0,49 0,59 0,69 0,79 0,89
10
20
30
40
50
60
0,1 0,2 0,3 0,4 0,5 0,6 0,7
Water/Binder
Co
mp
ress
ive
Str
en
gth
28
d (
MP
a)
Cement paste Porosity (v/v)

Dilution effect: Blended cements = lower strength
32 32
32
32
32
40 40
40
40
50
0%
20%
40%
60%
80%
100%
CPIIF CPIIE CPIIZ CPIII CPIV CPV
6-10% 6-44% 6-24% 40-75% 20-55% <5%
Class strength frequency of Brazilian Cements – A Google Search Daniel Reis, Pedro Abrão, VM John. June 2016. ©VM John
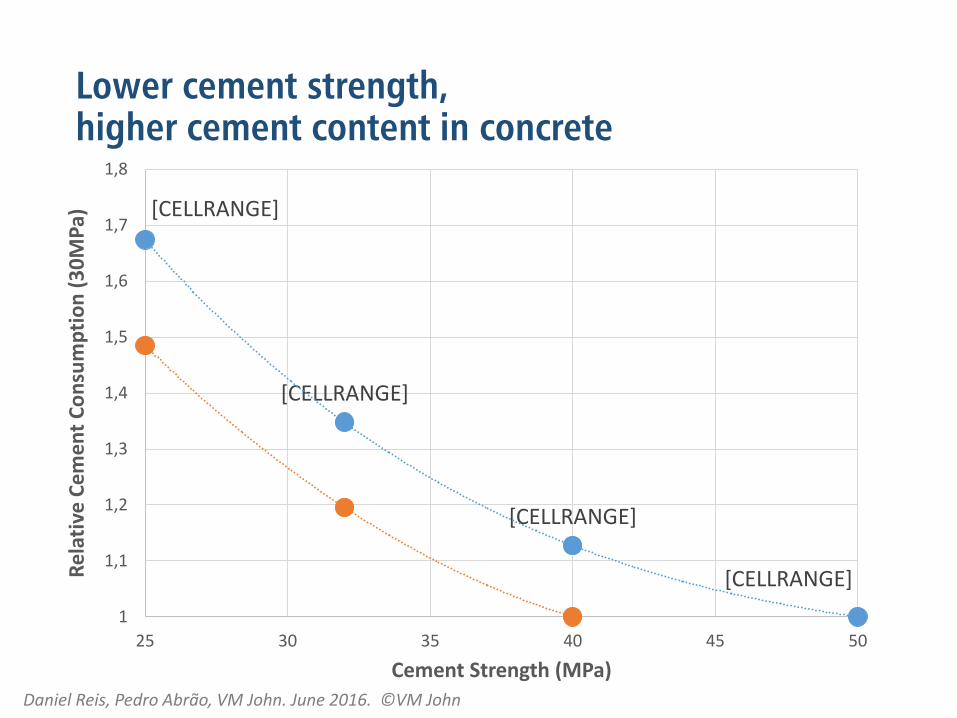
Lower cement strength, higher cement content in concrete
[CELLRANGE]
[CELLRANGE]
[CELLRANGE]
[CELLRANGE]
1
1,1
1,2
1,3
1,4
1,5
1,6
1,7
1,8
25 30 35 40 45 50
Re
lati
ve C
eme
nt
Co
nsu
mp
tio
n (
30
MP
a)
Cement Strength (MPa)
Daniel Reis, Pedro Abrão, VM John. June 2016. ©VM John

Simple clinker dilution may
Increase CO2 footprint of concrete
Clinker Mín Med Máx
CPII F 32 10,7 10,9 11,2
CPII F 40 8,9 9,1 9,3
CPII E 32 6,4 8,8 11,2
CPII E 40 5,4 7,4 9,3
CPII Z 32 8,9 10,0 11,2
CPII Z 40 7,5 8,4 9,3
CPIII 32 2,6 5,1 7,6
CPIII 40 2,2 4,3 6,3
CPV 40 9,4 9,7 10,0
CPIV 32 5,1 7,6 10,0
CPV 50 8,4 8,6 8,8
CO2 (kgCO2.m-3.MPa-1)
Model is conservative. Neglects differences in water demand for workability and SCMs. SCMs are carbon neutral. Cement demand for a 30MPa. Abrams curves from ABCP.
Daniel Reis, Pedro Abrão, VM John. June 2016. ©VM John
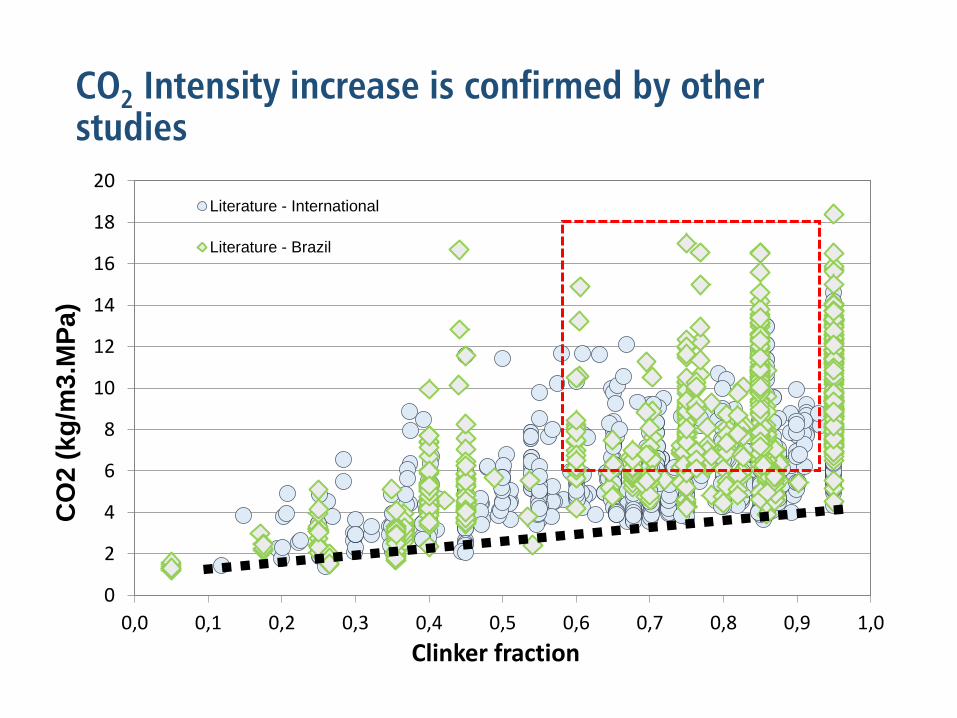
CO2 Intensity increase is confirmed by other studies
0
2
4
6
8
10
12
14
16
18
20
0,0 0,1 0,2 0,3 0,4 0,5 0,6 0,7 0,8 0,9 1,0
CO
2 (
kg
/m3
.MP
a)
Clinker fraction
Literature - International
Literature - Brazil

Dilution compensation
LEAP cements concept Low Emission, Advanced Performance
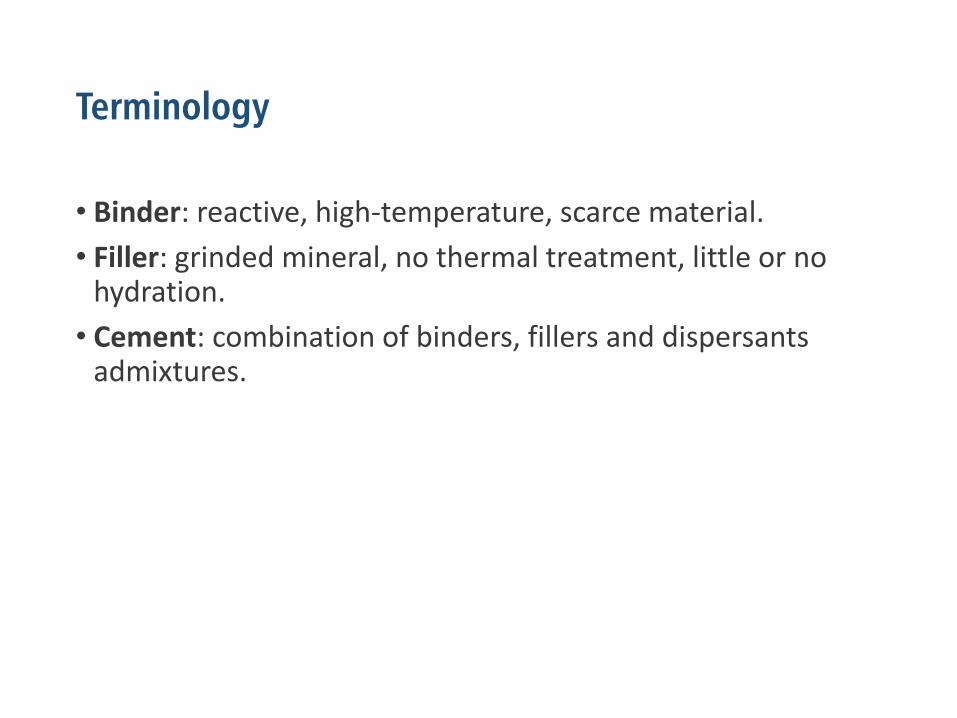
Terminology
• Binder: reactive, high-temperature, scarce material.
• Filler: grinded mineral, no thermal treatment, little or no hydration.
• Cement: combination of binders, fillers and dispersants admixtures.
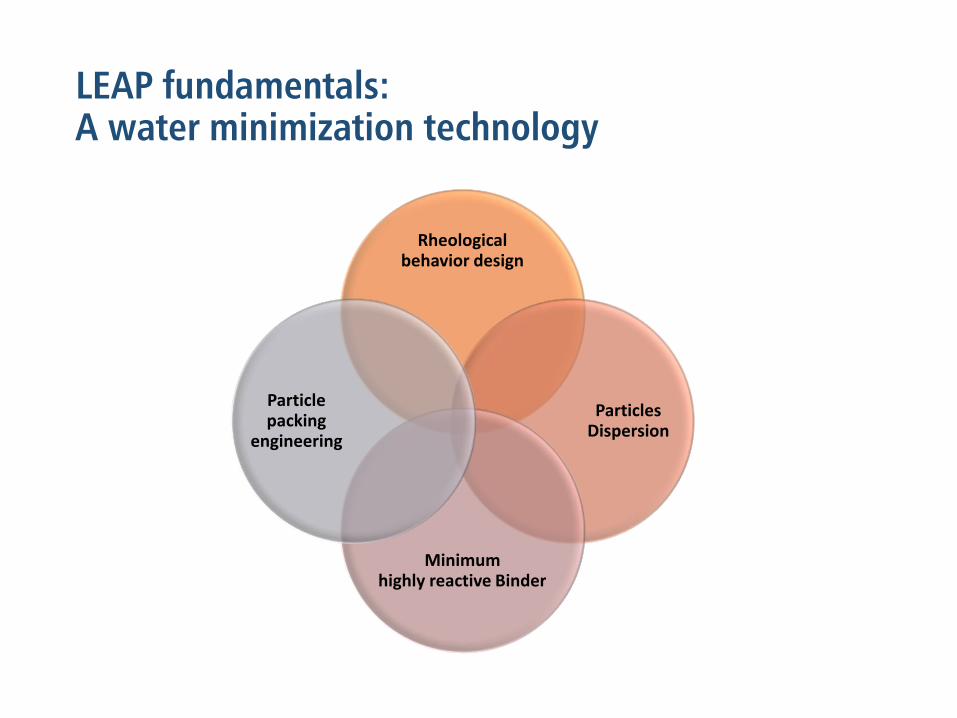
LEAP fundamentals: A water minimization technology
Rheological behavior design
Particles Dispersion
Minimum highly reactive Binder
Particle packing
engineering

LEAP at the cement industry
• Separate grinding (multi-modal PSD) • Minimum Binder (clinker, slag, fly-ash)
• Maximization of inert fillers
• Disperser Admixture added during powder mixing
• Market segmentation • Cement mix-design accordingly to clients needs
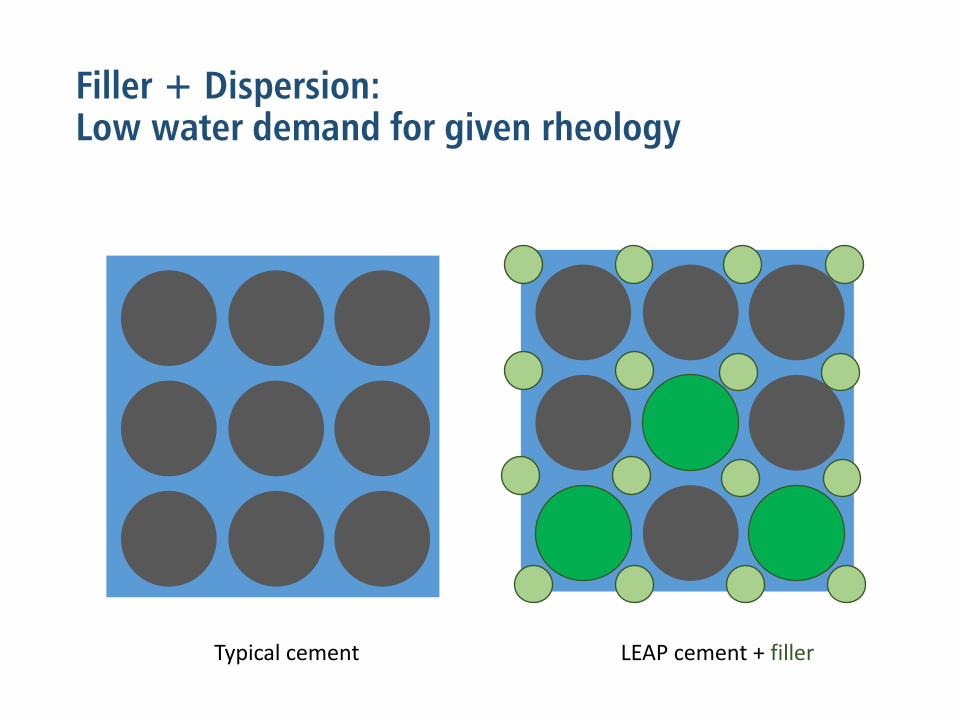
Filler + Dispersion: Low water demand for given rheology
Typical cement LEAP cement + filler
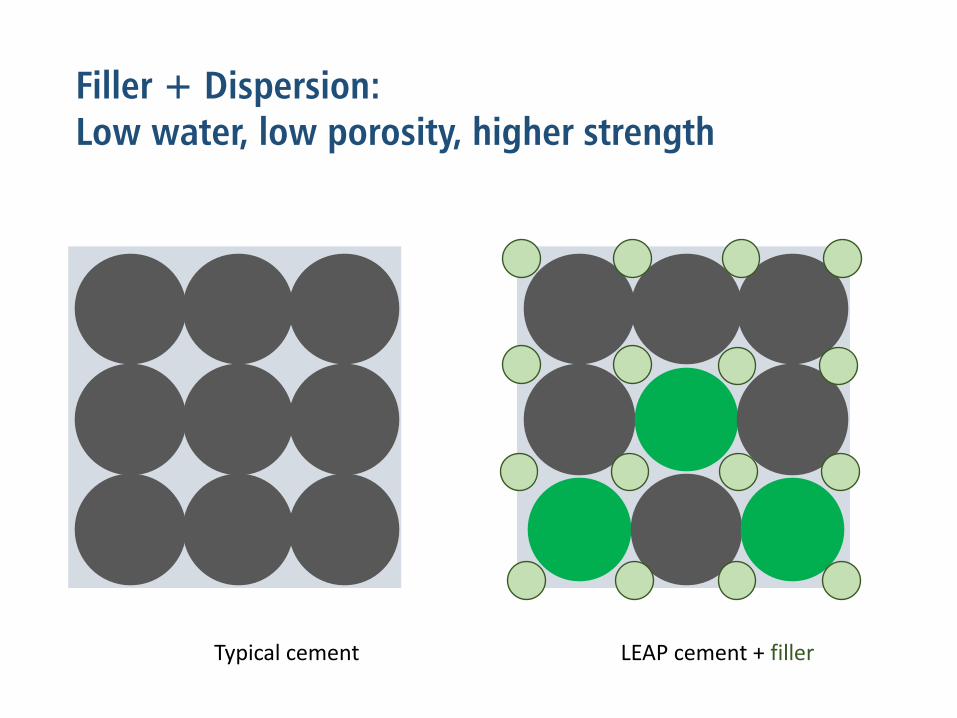
Filler + Dispersion: Low water, low porosity, higher strength
Typical cement LEAP cement + filler

Lafarge low-binder concrete and pre-mix
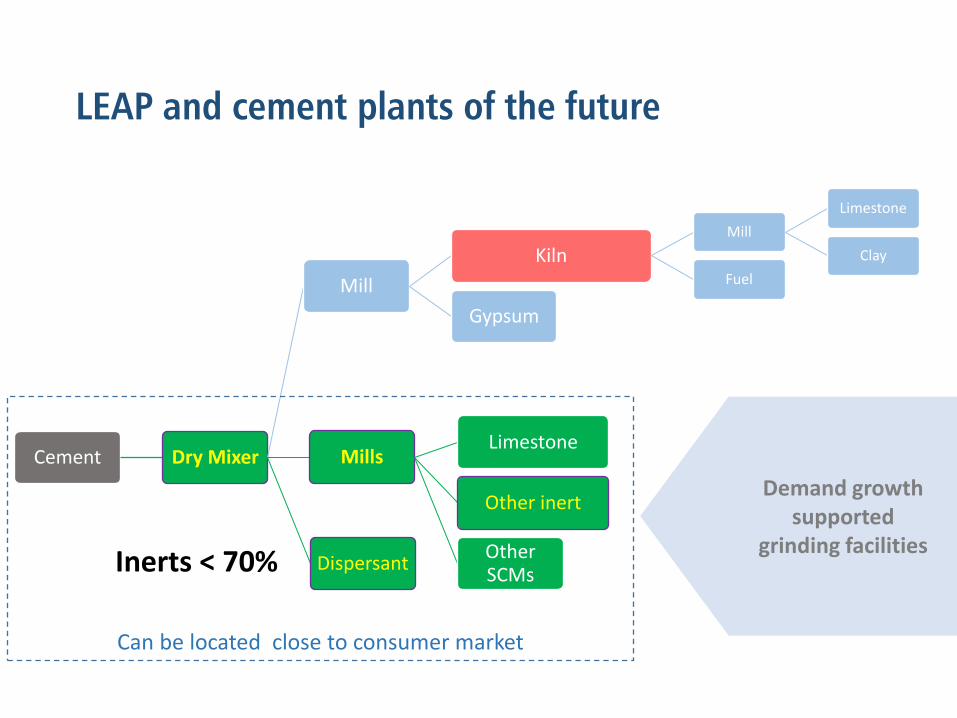
LEAP and cement plants of the future
Cement Dry Mixer
Mill
Kiln Mill
Limestone
Clay
Fuel
Gypsum
Mills Limestone
Other inert
Other SCMs
Dispersant Inerts < 70%
Can be located close to consumer market
Demand growth supported
grinding facilities

Filler & CO2
• Filler reduces thermal energy
• Do not affect electricity consumption • Clinker require 2 grinding steps.
• Filler one, more sophisticated grading
• Filler ~0,02 tCO2/t
• Clínquer ~0,85 tCO2/t
• For every 10% filler, 8,3% less CO2, same or higher strength

Filler & CAPEX
• IEA GHG Cost Model
• Filler (% pure cement cost) • CAPEX <37%
• Operational <33%
• Dispersant: 1-2% of the cost?
• Every 10% of filler 6,5% cost reduction
IEA GHG R&D Programme. CO2 capture in the Cement Industry. (International Energy Agency(IEA), 2008). at <http://ieaghg.org/docs/General_Docs/Reports/2008-3.pdf>

LEAP Approach HOW MUCH FILLER?
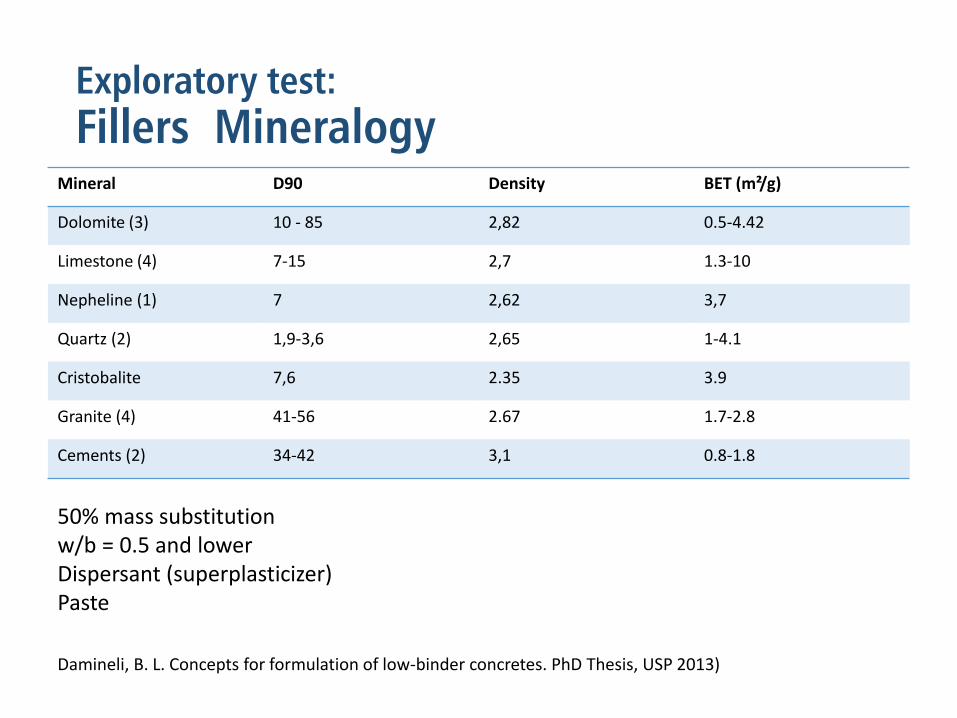
Exploratory test:
Fillers Mineralogy Mineral D90 Density BET (m²/g)
Dolomite (3) 10 - 85 2,82 0.5-4.42
Limestone (4) 7-15 2,7 1.3-10
Nepheline (1) 7 2,62 3,7
Quartz (2) 1,9-3,6 2,65 1-4.1
Cristobalite 7,6 2.35 3.9
Granite (4) 41-56 2.67 1.7-2.8
Cements (2) 34-42 3,1 0.8-1.8
50% mass substitution w/b = 0.5 and lower Dispersant (superplasticizer) Paste
Damineli, B. L. Concepts for formulation of low-binder concretes. PhD Thesis, USP 2013)
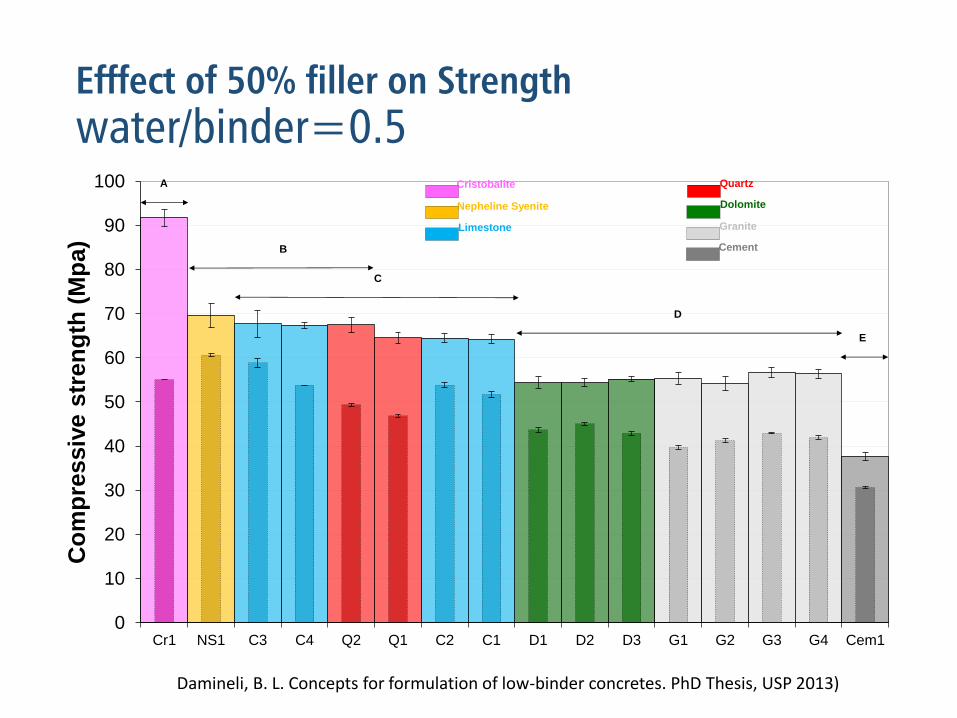
Efffect of 50% filler on Strength
water/binder=0.5
0
10
20
30
40
50
60
70
80
90
100
Cr1 NS1 C3 C4 Q2 Q1 C2 C1 D1 D2 D3 G1 G2 G3 G4 Cem1
Co
mp
ressiv
e s
tren
gth
(M
pa)
Limestone
Dolomite
Quartz
Granite
Cristobalite
Nepheline Syenite
Cement
A
B
C
D
E
Damineli, B. L. Concepts for formulation of low-binder concretes. PhD Thesis, USP 2013)
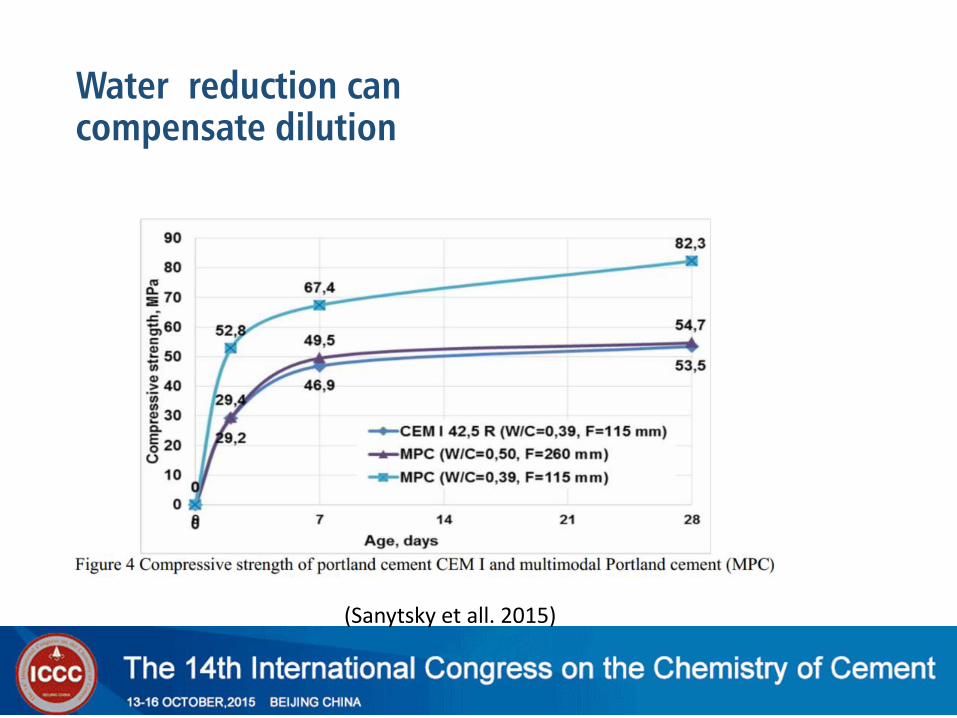
Water reduction can compensate dilution
(Sanytsky et all. 2015)
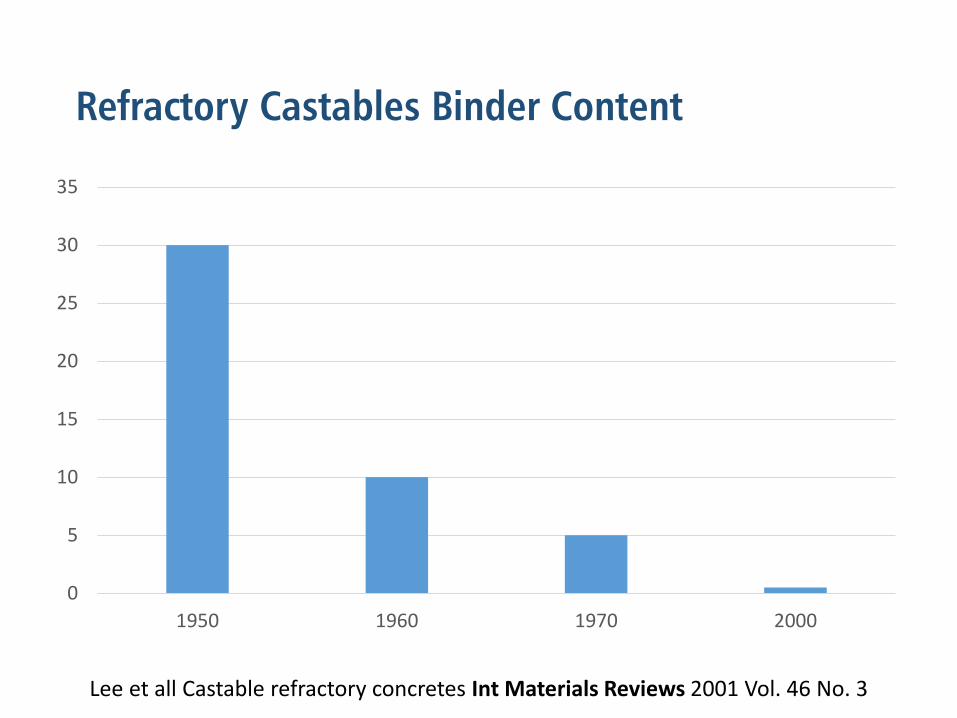
Refractory Castables Binder Content
0
5
10
15
20
25
30
35
1950 1960 1970 2000
Lee et all Castable refractory concretes Int Materials Reviews 2001 Vol. 46 No. 3

LEAP approach in structural concretes How much binder is needed for structural ?concrete
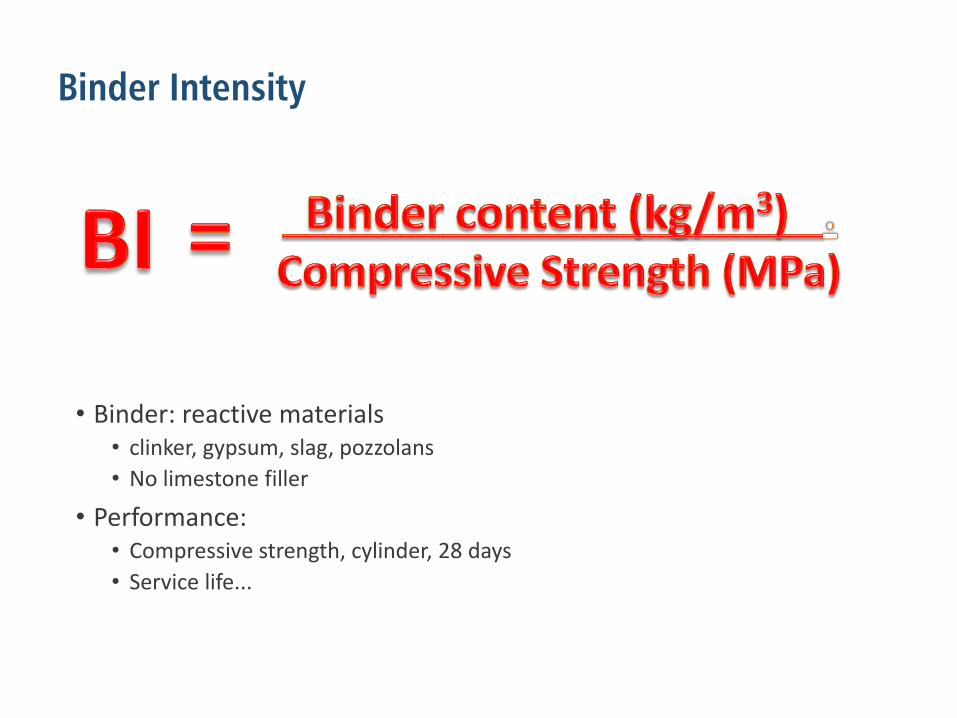
Binder Intensity
• Binder: reactive materials • clinker, gypsum, slag, pozzolans
• No limestone filler
• Performance: • Compressive strength, cylinder, 28 days
• Service life...
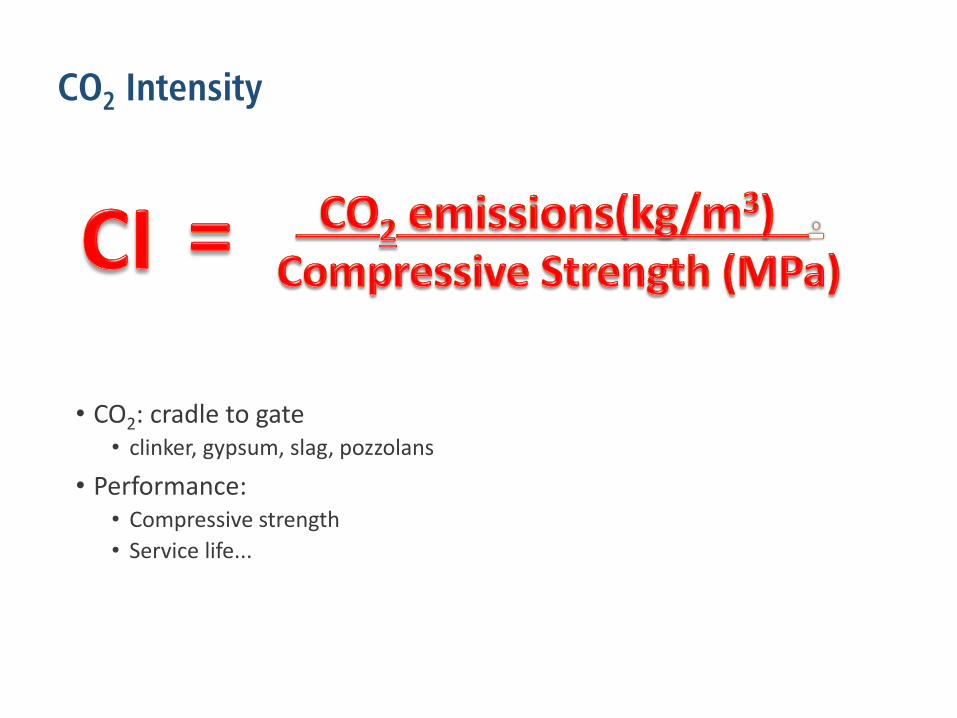
CO2 Intensity
• CO2: cradle to gate • clinker, gypsum, slag, pozzolans
• Performance: • Compressive strength
• Service life...
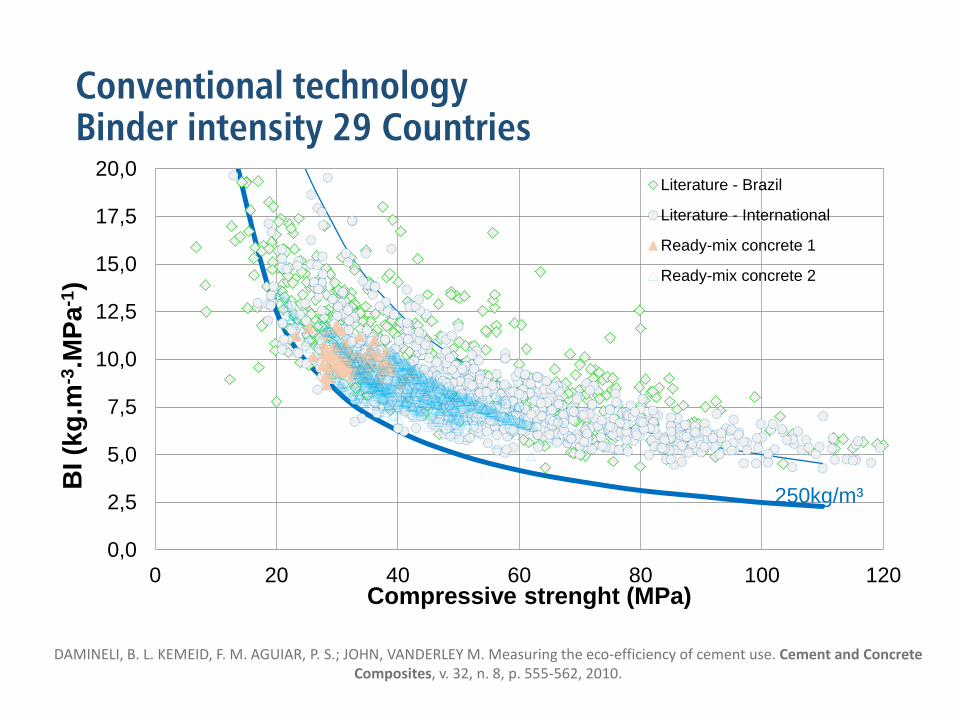
0,0
2,5
5,0
7,5
10,0
12,5
15,0
17,5
20,0
0 20 40 60 80 100 120
BI
(kg
.m-3
.MP
a-1
)
Compressive strenght (MPa)
Literature - Brazil
Literature - International
Ready-mix concrete 1
Ready-mix concrete 2
250kg/m³
Conventional technology Binder intensity 29 Countries
DAMINELI, B. L. KEMEID, F. M. AGUIAR, P. S.; JOHN, VANDERLEY M. Measuring the eco-efficiency of cement use. Cement and Concrete Composites, v. 32, n. 8, p. 555-562, 2010.
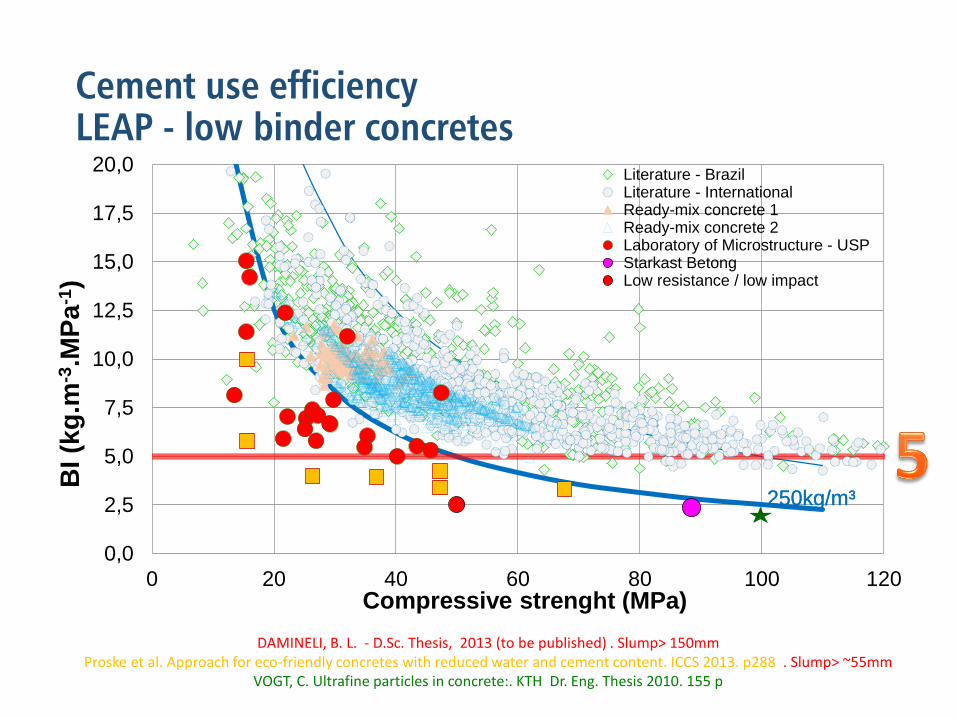
Cement use efficiency LEAP - low binder concretes
0,0
2,5
5,0
7,5
10,0
12,5
15,0
17,5
20,0
0 20 40 60 80 100 120
BI
(kg
.m-3
.MP
a-1
)
Compressive strenght (MPa)
Literature - BrazilLiterature - InternationalReady-mix concrete 1Ready-mix concrete 2Laboratory of Microstructure - USPStarkast BetongLow resistance / low impact
250kg/m³ 250kg/m³
DAMINELI, B. L. - D.Sc. Thesis, 2013 (to be published) . Slump> 150mm Proske et al. Approach for eco-friendly concretes with reduced water and cement content. ICCS 2013. p288 . Slump> ~55mm
VOGT, C. Ultrafine particles in concrete:. KTH Dr. Eng. Thesis 2010. 155 p
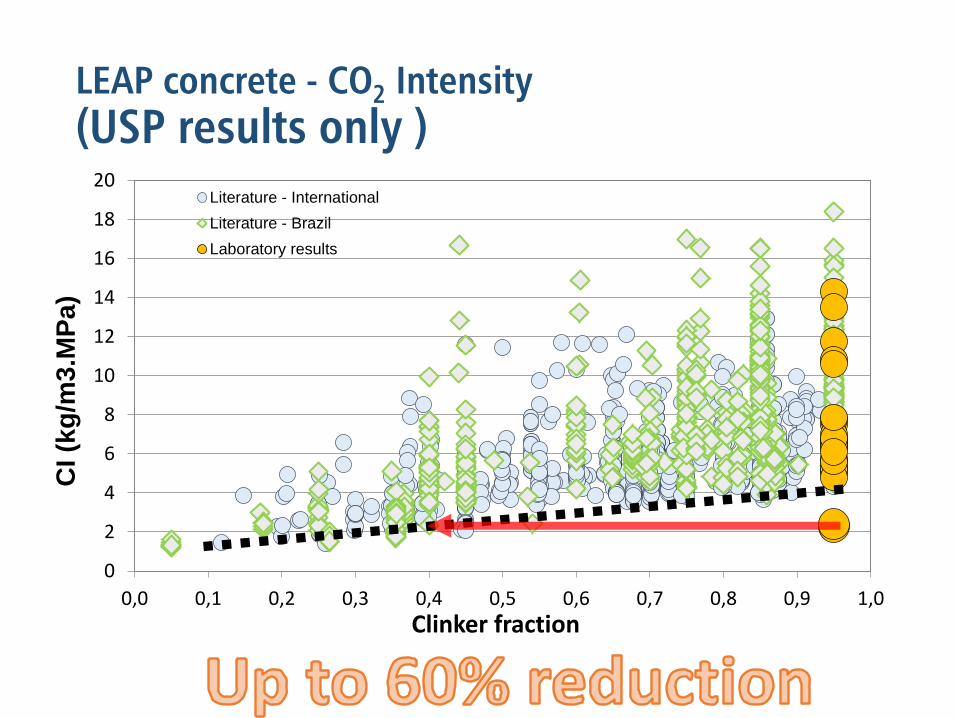
LEAP concrete - CO2 Intensity
(USP results only )
0
2
4
6
8
10
12
14
16
18
20
0,0 0,1 0,2 0,3 0,4 0,5 0,6 0,7 0,8 0,9 1,0
CI (k
g/m
3.M
Pa
)
Clinker fraction
Literature - International
Literature - Brazil
Laboratory results
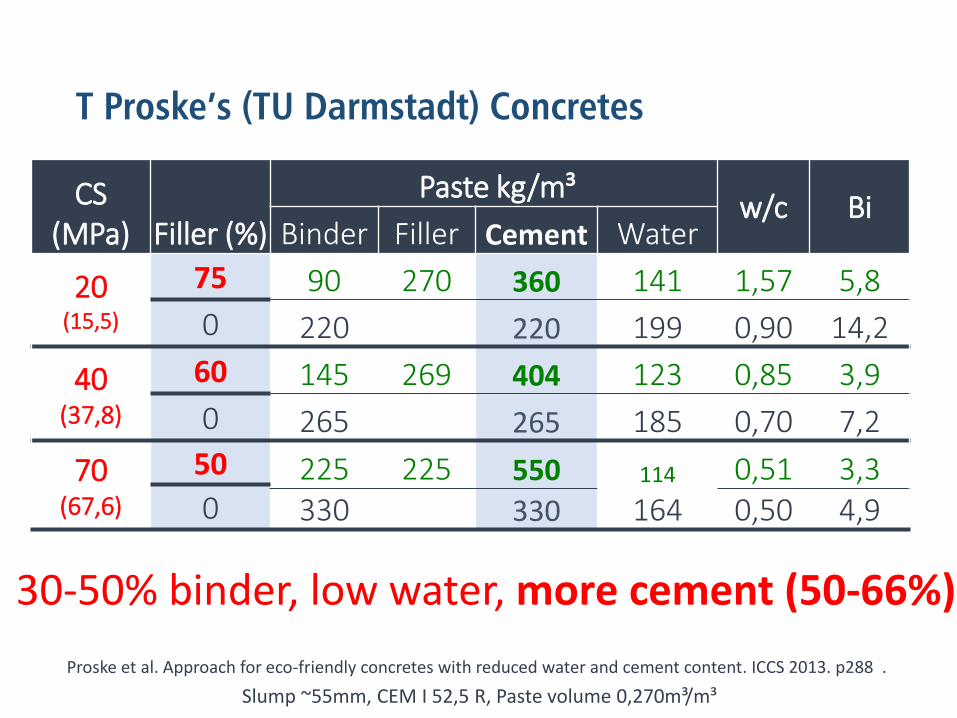
T Proske’s (TU Darmstadt) Concretes
CS (MPa) Filler (%)
Paste kg/m³ w/c Bi
Binder Filler Cement Water
20 (15,5)
75 90 270 360 141 1,57 5,8
0 220 220 199 0,90 14,2
40 (37,8)
60 145 269 404 123 0,85 3,9
0 265 265 185 0,70 7,2
70 (67,6)
50 225 225 550 114 0,51 3,3 0 330 330 164 0,50 4,9
Proske et al. Approach for eco-friendly concretes with reduced water and cement content. ICCS 2013. p288 .
Slump ~55mm, CEM I 52,5 R, Paste volume 0,270m³/m³
30-50% binder, low water, more cement (50-66%)
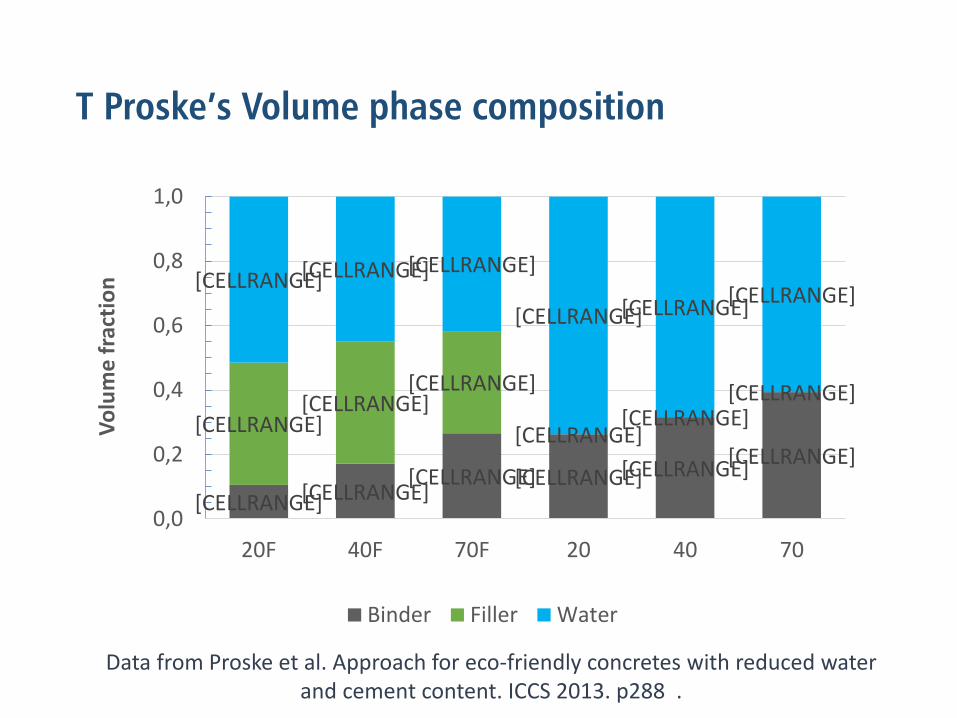
T Proske’s Volume phase composition
[CELLRANGE] [CELLRANGE] [CELLRANGE] [CELLRANGE] [CELLRANGE]
[CELLRANGE]
[CELLRANGE] [CELLRANGE]
[CELLRANGE]
[CELLRANGE] [CELLRANGE]
[CELLRANGE]
[CELLRANGE] [CELLRANGE] [CELLRANGE]
[CELLRANGE] [CELLRANGE] [CELLRANGE]
0,0
0,2
0,4
0,6
0,8
1,0
20F 40F 70F 20 40 70
Vo
lum
e f
ract
ion
Binder Filler Water
Data from Proske et al. Approach for eco-friendly concretes with reduced water and cement content. ICCS 2013. p288 .
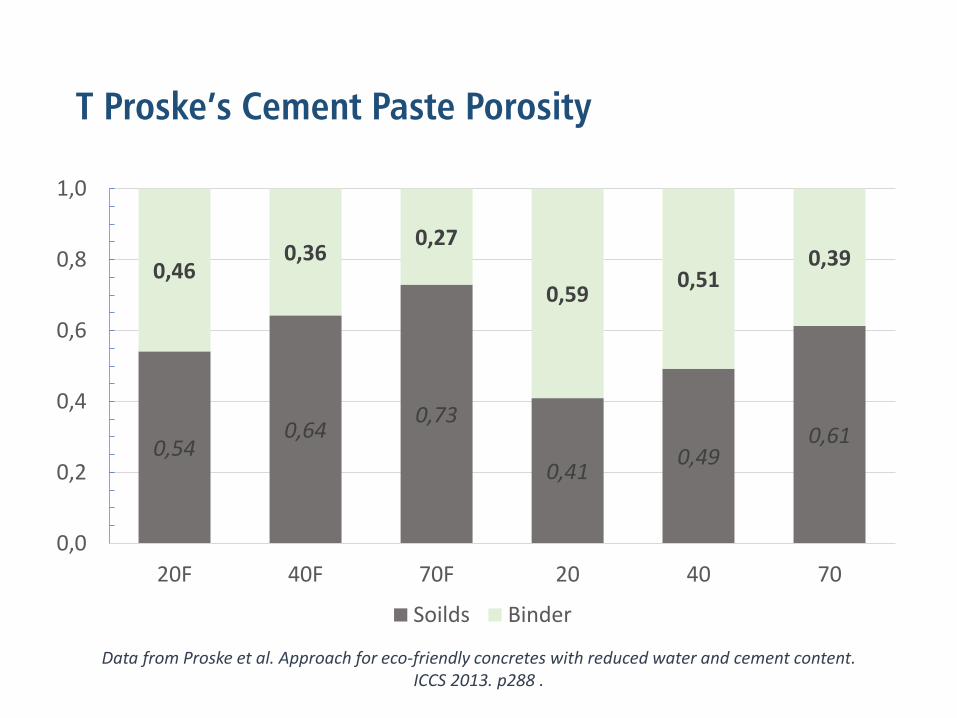
T Proske’s Cement Paste Porosity
0,54 0,64
0,73
0,41 0,49
0,61
0,46 0,36
0,27
0,59 0,51
0,39
0,0
0,2
0,4
0,6
0,8
1,0
20F 40F 70F 20 40 70
Soilds Binder
Data from Proske et al. Approach for eco-friendly concretes with reduced water and cement content. ICCS 2013. p288 .
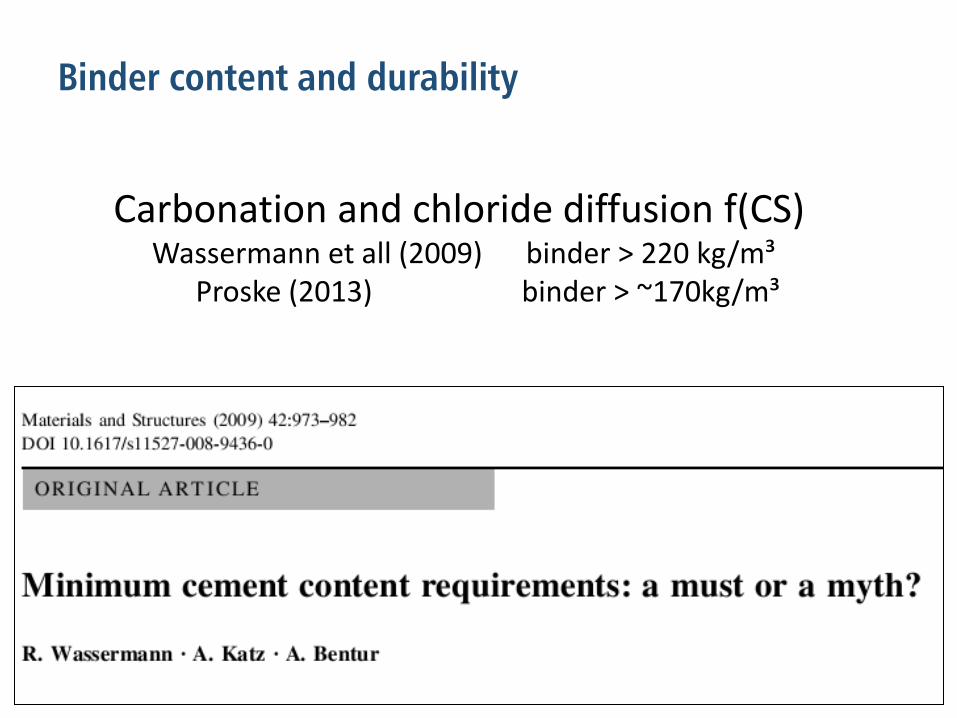
Binder content and durability
Carbonation and chloride diffusion f(CS) Wassermann et all (2009) binder > 220 kg/m³
Proske (2013) binder > ~170kg/m³

Binder content and Carbonation
Desirable for concrete not steel reinforced Mortar
Fibre-cement
Pavements
Can capture up to 60% of CO2 from cement production!
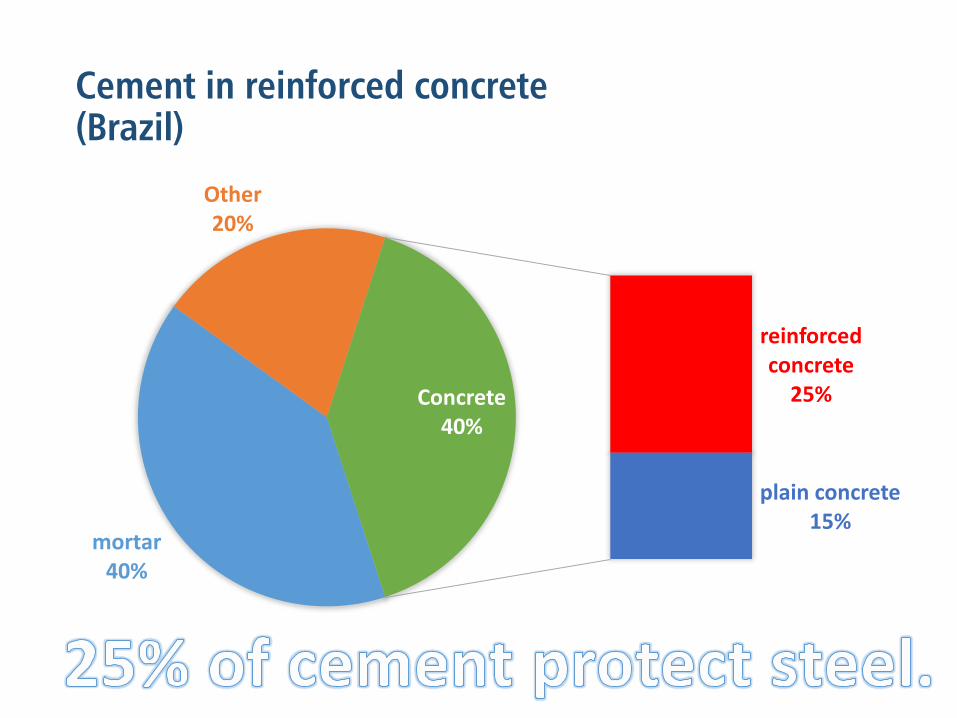
Cement in reinforced concrete (Brazil)
mortar 40%
Other 20%
reinforced concrete
25%
plain concrete 15%
Concrete 40%

How much filler can we add?
Conventional dilution
• Up to 30-35%
• All major players do have international experience
• It is not reasonable keep filler amount bellow 35%
• We have a social responsibility of an immediate action
LEAP technology
• Depends on market
• Up to 70% • Mortar
• Unreinforced structural concrete (even 70 MPa)
• Reinforced concrete in dry environment
• A progressive approach: learn, improve, advance.
LEAP technology may be captured by filler producers
• Cost reduction on products formulation • Cement R$350-400/t
• Filler R$160/t
• Admixture
• Some filler suppliers

Calcined clay + limestone filler
• Rheology improvement: less water, better strength
• Chemical reaction – monocarboaluminate
A + CĈ + 3CH + H ⇒C3ACĈH12
• Proportion • Stoichiometric > 2 pozzolan : 1 limestone
• Rheology ?
• Need to adjust standard immediately
Antoni et all. Cement substitution by a combination of metakaolin and limestone Cem Concr Res 42 (2012) 1579–1589 http://dx.doi.org/10.1016/j.cemconres.2012.09.006

CO2 mitigation Calcined Clay + Limestone Filler
55
Sanchez, UCLV Cuba, K. Scrivener EPFL, Emission reduction for two trial production in Cuba (Siguaney and Cienfuegos)
www.lc3.ch

High-filler & CO2
• Lower CO2 in cement production (up to 65%).
• Lower CO2 in cement-based materials.
• Lower production costs (~35%).
• Higher CO2 capture rate.
• Higher cement sales.
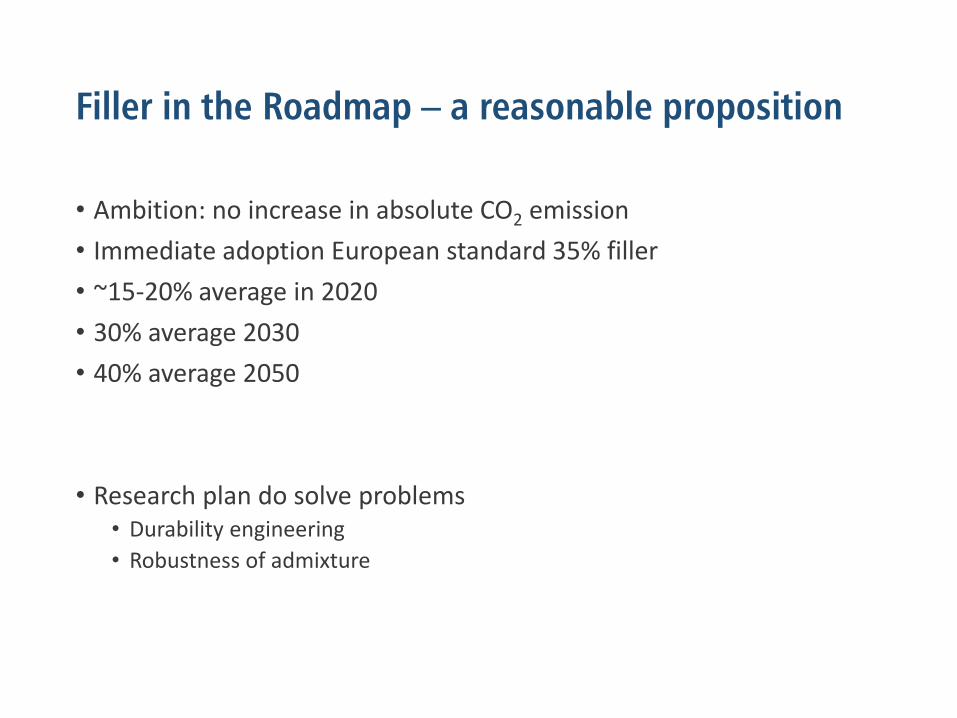
Filler in the Roadmap – a reasonable proposition
• Ambition: no increase in absolute CO2 emission
• Immediate adoption European standard 35% filler
• ~15-20% average in 2020
• 30% average 2030
• 40% average 2050
• Research plan do solve problems • Durability engineering
• Robustness of admixture


