Copyright of Shell South Africa Upstream B.V. January 2013 Copyright of Shell South Africa Upstream B.V. THE POTENTIAL OF GAS IN SOUTH AFRICA – SHELL’S PERSPECTIVE Jan Willem Eggink General Manager - Shell South Africa Upstream B.V.
Transcript
Copyright of Shell South Africa Upstream B.V. 1 January 2013
Copyright of Shell South Africa Upstream B.V.
THE POTENTIAL OF GAS IN SOUTH AFRICA – SHELL’S PERSPECTIVE
Jan Willem Eggink General Manager - Shell South Africa Upstream B.V.
Copyright of Shell South Africa Upstream B.V. 2 January 2013 Copyright of Shell South Africa Upstream B.V. 2
CAUTIONARY NOTE
The companies in which Royal Dutch Shell plc directly and indirectly owns investments are separate entities. In this presentation “Shell”, “Shell group” and “Royal Dutch Shell” are sometimes used for convenience where references are made to Royal Dutch Shell plc and its subsidiaries in general. Likewise, the words “we”, “us” and “our” are also used to refer to subsidiaries in general or to those who work for them. These expressions are also used where no useful purpose is served by identifying the particular company or companies. The term “Shell interest” is used for convenience to indicate the direct and/or indirect (for example, through our 24% shareholding in Woodside Petroleum Ltd.) ownership interest held by Shell in a venture, partnership or company, after exclusion of all third-party interest.
This presentation contains forward-looking statements concerning the financial condition, results of operations and businesses of Royal Dutch Shell. All statements other than statements of historical fact are, or may be deemed to be, forward-looking statements. Forward-looking statements are statements of future expectations that are based on management’s current expectations and assumptions and involve known and unknown risks and uncertainties that could cause actual results, performance or events to differ materially from those expressed or implied in these statements. Forward-looking statements include, among other things, statements concerning the potential exposure of Royal Dutch Shell to market risks and statements expressing management’s expectations, beliefs, estimates, forecasts, projections and assumptions.
These forward-looking statements are identified by their use of terms and phrases such as ‘‘anticipate’’, ‘‘believe’’, ‘‘could’’, ‘‘estimate’’, ‘‘expect’’, ‘‘intend’’, ‘‘may’’, ‘‘plan’’, ‘‘objectives’’, ‘‘outlook’’, ‘‘probably’’, ‘‘project’’, ‘‘will’’, ‘‘seek’’, ‘‘target’’, ‘‘risks’’, ‘‘goals’’, ‘‘should’’ and similar terms and phrases. There are a number of factors that could affect the future operations of Royal Dutch Shell and could cause those results to differ materially from those expressed in the forward-looking statements included in this presentation, including (without limitation): (a) price fluctuations in crude oil and natural gas; (b) changes in demand for the Shell’s products; (c) currency fluctuations; (d) drilling and production results; (e) reserve estimates; (f) loss of market share and industry competition; (g) environmental and physical risks; (h) risks associated with the identification of suitable potential acquisition properties and targets, and successful negotiation and completion of such transactions; (i) the risk of doing business in developing countries and countries subject to international sanctions; (j) legislative, fiscal and regulatory developments including potential litigation and regulatory measures as a result of climate changes; (k) economic and financial market conditions in various countries and regions; (l) political risks, including the risks of expropriation and renegotiation of the terms of contracts with governmental entities, delays or advancements in the approval of projects and delays in the reimbursement for shared costs; and (m) changes in trading conditions. All forward-looking statements contained in this presentation are expressly qualified in their entirety by the cautionary statements contained or referred to in this section. Readers should not place undue reliance on forward-looking statements.
Additional factors that may affect future results are contained in Royal Dutch Shell’s 20-F for the year ended 31 December, 2011 (available at www.shell.com/investor and www.sec.gov ). These factors also should be considered by the reader. Each forward-looking statement speaks only as of the date of this presentation, 4th March 2013. Neither Royal Dutch Shell nor any of its subsidiaries undertake any obligation to publicly update or revise any forward-looking statement as a result of new information, future events or other information. In light of these risks, results could differ materially from those stated, implied or inferred from the forward-looking statements contained in this presentation.
The United States Securities and Exchange Commission (SEC) permits oil and gas companies, in their filings with the SEC, to disclose only proved reserves that a company has demonstrated by actual production or conclusive formation tests to be economically and legally producible under existing economic and operating conditions. We use certain terms in this presentation, such as resources and oil in place, that SEC's guidelines strictly prohibit us from including in filings with the SEC. U.S. Investors are urged to consider closely the disclosure in our Form 20-F, File No 1-32575, available on the SEC website www.sec.gov. You can also obtain these forms from the SEC by calling 1-800-SEC-0330.
Copyright of Shell South Africa Upstream B.V. 3 January 2013 Copyright of Shell South Africa Upstream B.V. 3 January 2013
GLOBAL ENERGY OUTLOOK
ENERGY DEMAND +60% 2010 – 2050
HYDROCARBONS DOMINATE OUTLOOK
NATURAL GAS WILL PLAY A KEY ROLE
OIL
NATURAL GAS
BIOMASS
WIND
COAL
NUCLEAR
SOLAR
OTHER RENEWABLES
Copyright of Royal Dutch Shell plc.
Copyright of Shell South Africa Upstream B.V. 5 January 2013 Copyright of Shell South Africa Upstream B.V. 5
DRAMATIC IMPACT OF US TIGHT GAS REVOLUTION
Source: EIA Annual Energy Outlook 2011 Early release
bcm
Imports
2005
800
2010
Tight gas
Shale gas
Alaska
0
200
400
600
1990 2000 2020 2030
Associated gas
Offshore
Conventional
CBM
Conventional
Tight
Copyright of Shell South Africa Upstream B.V. 6 January 2013 Copyright of Shell South Africa Upstream B.V. 6 January 2013 Copyright of Shell South Africa Upstream B.V.
Copyright of Shell South Africa Upstream B.V. 7 January 2013 Copyright of Shell South Africa Upstream B.V. 7
SHARE OF GAS IN PRIMARY ENERGY MIX
THE SHARE OF NATURAL GAS IN THE PRIMARY ENERGY MIX IS EXPECTED TO INCREASE IN THE 3 LARGEST GAS MARKETS (MODERATE INCREASE IN OECD)
Source: WoodMac for USA and Europe, WoodMac and Shell analysis for China
USA EUROPE CHINA
Others Coal Natural Gas Oil
2010 2030 2010 2030 2010 2030
~16,000 ~19,500
~14,000 ~16,000 ~17,000
~31,000 Total primary energy (mln boe)
16%
38%
24%
22%
20%
33%
23%
24%
23%
36%
16% 25%
28%
31%
13%
28%
13% 17%
66%
4%
14%
25%
51%
10%
Copyright of Shell South Africa Upstream B.V. 8 January 2013 Copyright of Shell South Africa Upstream B.V. 8
RSA ENERGY SUPPLY - GAS
Its not an either-or discussion A mix of energy sources provides flexibility of supply Gas is the best back-up to intermittent sources Early gas would be imports – LNG (or pipeline) Shale gas will take some 10 years for material start-up It is key to find out soonest whether shale gas is there
-> is South Africa spending enough efforts on energy efficiency/saving ?
Copyright of Shell South Africa Upstream B.V. 9 January 2013 Copyright of Shell South Africa Upstream B.V. 9
LNG
Copyright of Shell South Africa Upstream B.V. 10 January 2013 Copyright of Shell South Africa Upstream B.V. 10
WHAT IS LNG?
WORLD LNG PRODUCTION IN 2011 = ~244 MILLION TONNES
Natural Gas production and separation from oil and water (when present)
Natural Gas cooled to liquid state at -160oC and atm. pressure (volume reduced 600 fold)
LNG transported over long distances in purpose built carriers
LNG returned to gas state and injected into the transport pipeline network for distribution and sales
PRODUCTION LIQUEFACTION SHIPPING REGASIFICATION
COST EFFECTIVE ALTERNATIVE TO PIPELINE
Copyright of Shell South Africa Upstream B.V. 11 January 2013 Copyright of Shell South Africa Upstream B.V. 11
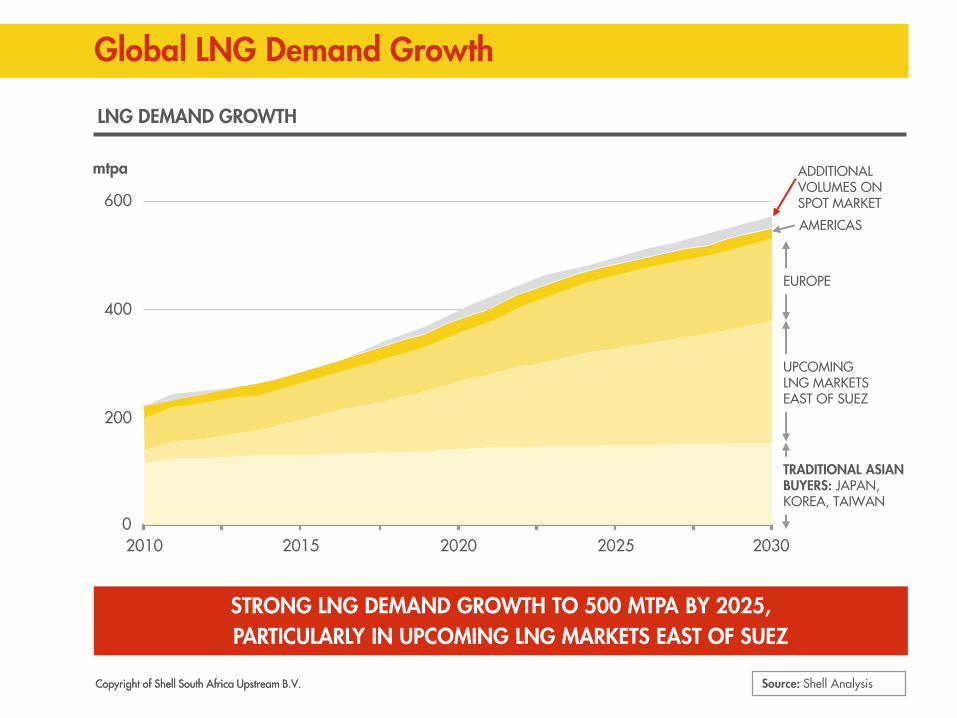
Global LNG Demand Growth
600
2020
0
200
400
2010 2015 2025 2030
TRADITIONAL ASIAN BUYERS: JAPAN, KOREA, TAIWAN
LNG DEMAND GROWTH
STRONG LNG DEMAND GROWTH TO 500 MTPA BY 2025, PARTICULARLY IN UPCOMING LNG MARKETS EAST OF SUEZ
mtpa ADDITIONAL VOLUMES ON SPOT MARKET
UPCOMING LNG MARKETS EAST OF SUEZ
EUROPE
AMERICAS
Source: Shell Analysis
Copyright of Shell South Africa Upstream B.V. 12 January 2013 Copyright of Shell South Africa Upstream B.V. 12
GLOBAL LNG MARKET DEVELOPMENTS
LNG IMPORTERS LNG EXPORTERS
2010 2020
NUMBERS OF COUNTRIES IMPORTING LNG EXPECTED TO ALMOST DOUBLE BETWEEN 2010 AND 2020
# COUNTRIES 1990 2000 2010 2011* 2020 EST
EXPORTERS 8 12 18 18 ~25
IMPORTERS 9 11 24 25 ~40
Source: Wood Mackenzie LNG (April 2010)
* Source: PFC Energy (2011 Actuals)
Copyright of Shell South Africa Upstream B.V. 13 January 2013 Copyright of Shell South Africa Upstream B.V. 13
GLOBAL LNG LEADERSHIP
SHELL GLOBAL LNG CAPACITY GROWTH SHELL LNG LEADERSHIP
0
5
10
15
20
25
30
Shell Exxon Chevron BG Total BP
Year end mtpa
2017 2011
~90% Long-term contracted ~80% of portfolio oil price linked
mtpa
CONSTRUCTION ONSTREAM OPTIONS
2011 ~2020+
0
5
10
15
20
25
30
35
40
45
Pluto T1 (Woodside)
Gorgon T1-3
Wheatstone & Prelude
SHELL
PROJECTS IN OPERATION OR UNDER CONSTRUCTION
Copyright of Shell South Africa Upstream B.V. 14 January 2013 Copyright of Shell South Africa Upstream B.V. 14 January 2013
SPAIN HAZIRA BAJA DUBAI ELBA ISLAND ALTAMIRA COVE POINT AC
CES
S
TO K
EY
STRA
TEG
IC
MA
RKET
S
ARKAT
SHIPPING
GREEN CORRIDOR
LNG FOR TRANSPORT
Copyright of Shell South Africa Upstream B.V. 15 January 2013 Copyright of Shell South Africa Upstream B.V. 15 January 2013
PRELUDE FLNG
2011: FIRST INDUSTRY FID ON FLNG ON PRELUDE
CONSTRUCTION SOUTH KOREA: OPTIONS FOR FURTHER PROJECTS
TARGETING NEW EXPLORATION FOR FLNG
FLOATING LNG LEADERSHIP
Dec 2012
10
Copyright of Shell South Africa Upstream B.V. 16 January 2013 Copyright of Shell South Africa Upstream B.V. 16
LNG FOR TRANSPORT OVERVIEW
Conventional
LNG carrier FSRU / Import terminal Power plant
LNG trailer truck LNG refuelling station LNG fuelled truck
Small-scale liquefaction
(e.g. MMLS, bio-LNG)
LNG bunker vessel LNG fuelled vessel Small terminal
Small LNG carrier
Marine
Road
Mining Rail
Copyright of Shell South Africa Upstream B.V. 17 January 2013 Copyright of Shell International Exploration and Production MOST CONFIDENTIAL Copyright of Shell International Exploration and Production
SHELL INNOVATION: Moveable Modular Liquefaction Station
Solution for Mini or ‘Small Scale’ LNG Production
Can Unlock Coal Bed Methane/Shale Gas Reserves
Construction times: FID to 1st LNG < 24 months for first unit and ~12 months for repeat systems
Standardized and Fully-Modularized & Re-Deployable
Capacity 0.1 - 0.25 MPTA (~150-400K LNG g/d)
Cost Competitive and LNG Supply
All equipment, including pipe-racks
come in skids which fit on ‘regular’
trucks
Copyright of Shell South Africa Upstream B.V. 18 January 2013 Copyright of Shell South Africa Upstream B.V. 18
Shale Gas
Copyright of Shell South Africa Upstream B.V. 19 January 2013 Copyright of Shell South Africa Upstream B.V. 19
KAROO SHALE GAS IN SOUTH AFRICA
Cape Town
Mossel Bay Port Elizabeth
East London
Queenstown
Bloemfontein
Johannesburg
Sutherland Beaufort West
Oil Gas Refined Products Pipelines:
Falcon ER Application Bundu ER
Shell TCP
Shell ER Applications
Copyright of Shell South Africa Upstream B.V. 20 January 2013 Copyright of Shell South Africa Upstream B.V. 20 January 2013
Permeable Sandstone Shale Tight Sandstone
Oil Window
Gas Window
Shale Gas Potential
Liquids-Rich Potential Oil Window
Gas Window
Low Permeability
Stratigraphically Trapped Oil
CONVENTIONAL OIL VS. LIQUIDS-RICH SHALES
Copyright of Shell South Africa Upstream B.V.
Copyright of Shell South Africa Upstream B.V. 21 January 2013 Copyright of Shell South Africa Upstream B.V. 21 January 2013
Copyright of Shell South Africa Upstream B.V. 22 January 2013 Copyright of Shell South Africa Upstream B.V. 22
KEY EXPERIENCE AND TECHNOLOGIES
Sweet Spotting
Well Design to protect water resources Pad Drilling to reduce surface foot print
Copyright of Shell South Africa Upstream B.V. 23 January 2013 Copyright of Shell South Africa Upstream B.V. 23 January 2013
Copyright of Shell South Africa Upstream B.V. 24 January 2013 Copyright of Shell South Africa Upstream B.V. 24 January 2013
ECONOMETRIX ECONOMIC STUDY
Source: Econometrix March 2012 – based on constant 2010
20 tcf 50 tcf
Potential Life of Resource (years) 25 years 25 years
Potential Contribution to GDP (ZAR bn) ZAR 35bn ZAR 90bn
Potential Permanent Employment 300,000 700,000
Copyright of Shell South Africa Upstream B.V. 25 January 2013 Copyright of Shell South Africa Upstream B.V. 25
SHALE GAS EXPLORATION AND DEVELOPMENT
Nine year exploration period (>ZAR 1.5 Bln, limited jobs) Followed by 30 year production period (ZAR xx Bln, jobs) Development concept is through multi-well ‘well pads’ Volume potential 0 to >> 100 Tcf (EIA estimate = 485 Tcf) 6 Tcf development would generate > 40,000 GWh from 6 GW base-
load at 80% load South Africa needs 56 GW of new electricity generation by 2030 (IRP 2010)
Need operator with high standards – environmentally safe High energy intensity/footprint : energy from a single 20 well pad
equates ~180 2MW wind turbines or 8-10 sqkm solar PV
Copyright of Shell South Africa Upstream B.V. 26 January 2013 Copyright of Shell South Africa Upstream B.V. 26 January 2013
LOCATION MAP – ORANGE BASIN & SHELL BLOCK
Kudu
DSDP 361
Copyright of Shell South Africa Upstream B.V. 27 January 2013 Copyright of Shell South Africa Upstream B.V. 27
OVERALL GAS SUMMARY
Energy demand in South Africa will more than double by 2050, CO2 becomes a challenge
LNG allows early access to gas with its advantages (clean, available, multiple sources, fast)
Shale gas may be a game changer to South Africa (self-sufficiency in energy?)
Mix of Energy required, with flexible supply options Demand growth can be reduced through energy
efficiency/savings
Copyright of Shell South Africa Upstream B.V. 28 January 2013 Copyright of Shell South Africa Upstream B.V. 28 January 2013 28