‘ International Seminar on Economics and Marketing of Tropical and Subtropical Fruits ‘ THE POTENTIAL OF MALAYSIAN THE POTENTIAL OF MALAYSIAN FRUITS IN MEETING GLOBAL FRUITS IN MEETING GLOBAL DEMAND DEMAND By : Tuan By : Tuan Haji Haji Samah Samah Bin Bin Hasan Hasan Deputy Director General Deputy Director General FAMA FAMA 16 July 2007 16 July 2007
Transcript
‘ International Seminar on Economics and Marketing
of Tropical and Subtropical Fruits ‘
THE POTENTIAL OF MALAYSIAN THE POTENTIAL OF MALAYSIAN FRUITS IN MEETING GLOBAL FRUITS IN MEETING GLOBAL
DEMAND DEMAND
By : Tuan By : Tuan HajiHaji SamahSamah Bin Bin HasanHasan Deputy Director General Deputy Director General
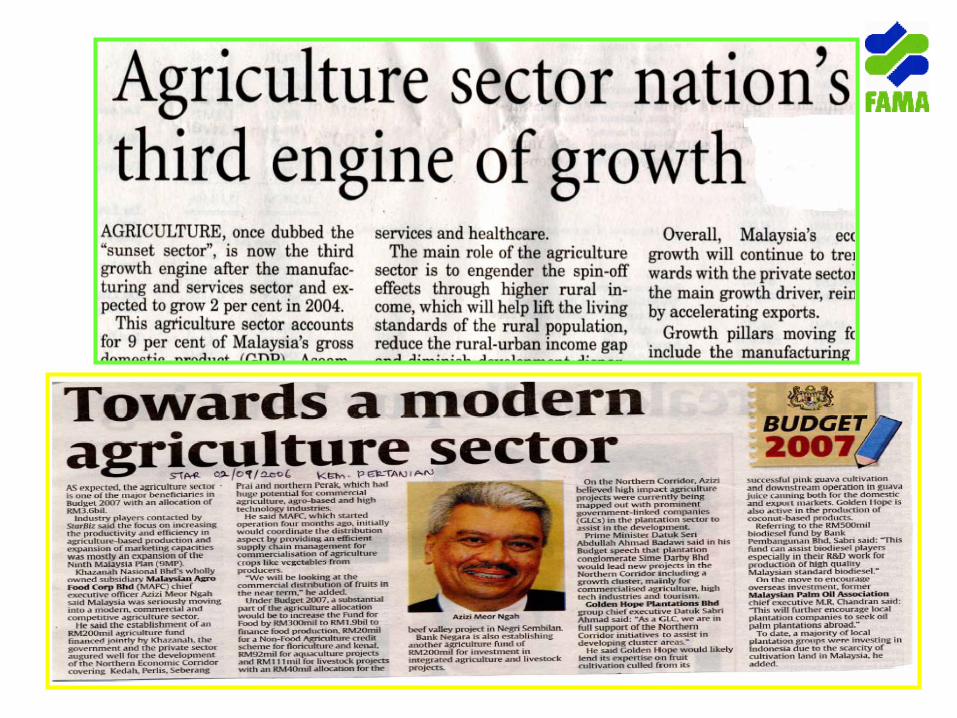
THE GOVERNMENT’S ASPIRATIONS FOR THE AGRICULTURAL SECTOR
Develop the Agriculture Sector as the 3rd engine of growth.To be a prominent player in food production by the year 2010Net exporter of food by 2010 Agriculture is a Business
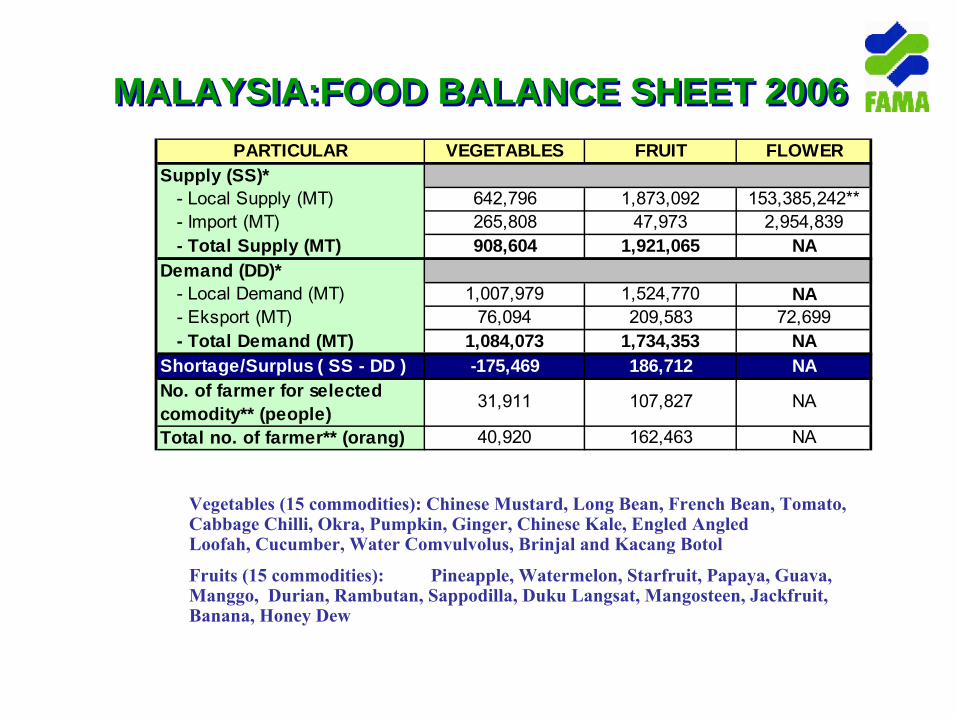
PARTICULAR VEGETABLES FRUIT FLOWERSupply (SS)* - Local Supply (MT) 642,796 1,873,092 153,385,242** - Import (MT) 265,808 47,973 2,954,839 - Total Supply (MT) 908,604 1,921,065 NADemand (DD)* - Local Demand (MT) 1,007,979 1,524,770 NA - Eksport (MT) 76,094 209,583 72,699 - Total Demand (MT) 1,084,073 1,734,353 NAShortage/Surplus ( SS - DD ) -175,469 186,712 NANo. of farmer for selected comodity** (people)
31,911 107,827 NA
Total no. of farmer** (orang) 40,920 162,463 NA
*Source: FAM A 2006**Source: Jab. Perangkaan M alaysia 2005
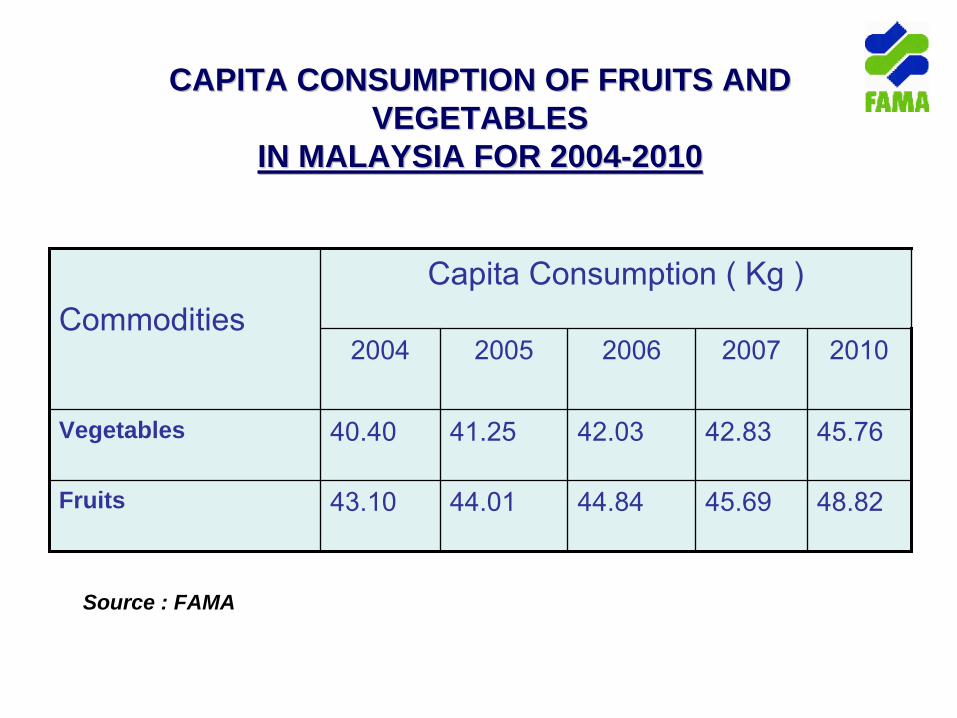
CAPITA CONSUMPTION OF FRUITS AND CAPITA CONSUMPTION OF FRUITS AND VEGETABLESVEGETABLES
IN MALAYSIA FOR 2004IN MALAYSIA FOR 2004--20102010
CommoditiesCapita Consumption ( Kg )
2004 2005 2006 2007 2010
Vegetables 40.40 41.25 42.03 42.83 45.76
Fruits 43.10 44.01 44.84 45.69 48.82
Source : FAMA
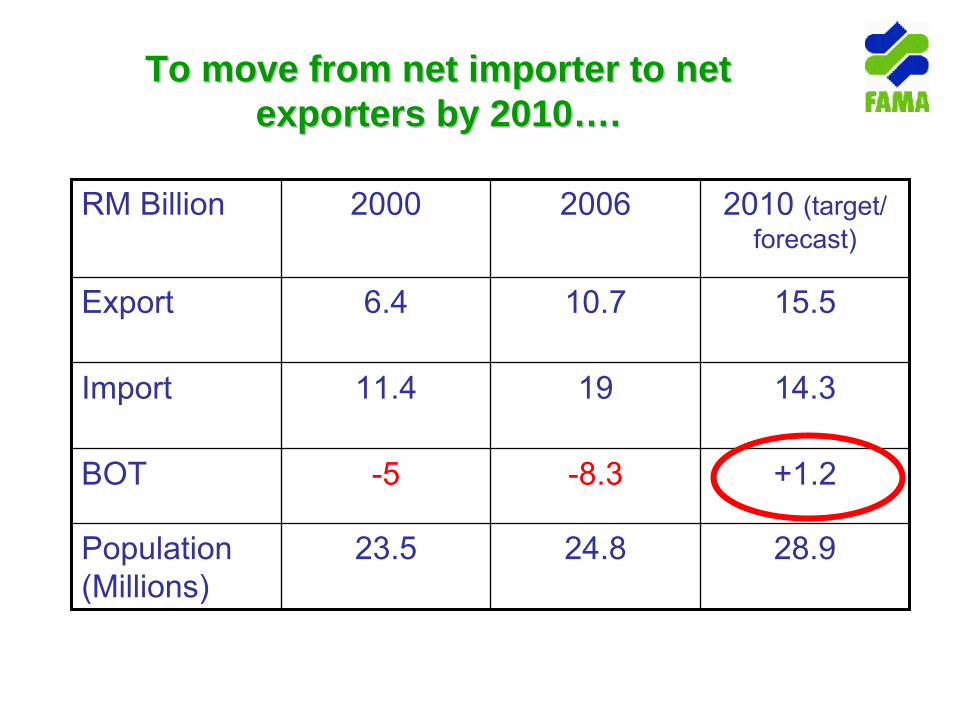
To move from net importer to net To move from net importer to net exporters by 2010exporters by 2010……..
RM Billion 2000 2006 2010 (target/ forecast)
Export 6.4 10.7 15.5
Import 11.4 19 14.3
BOT -5 -8.3 +1.2
Population (Millions)
23.5 24.8 28.9
BALANCE OF TRADE PLAN (2005 -2010)
…ambitious plan to reduce deficit in food import bill to net exporter by the year 2010
Commodity 2005 2006 2007 2008 2009 2010
Fruits
Vegetables
TOTAL
ProductionValue
1,587 211
1,746 317
1,920 463
2,112 666
2,323952
2,5561,353
ProductionValue
77196
833134
900173
972215
1,047263
1,133319
ProductionValue
2,358 308
2,579 451
2,820 636
3,084 881
3,3701,215
3,6891,672
Production – ‘000 ton ; Value – RM’ Mil
OF HORTICULTURAL CROPS
IMPORT AND EXPORT VALUES OF SEVEN AGRICULTURAL PRODUCE, 2001-2006
Seven (7) types of agriculture produce comprise cereals and cereal preparations, vegetables, fruits, sugar, sugar preparations and honey, coffee, cocoa, tea and its products; animal feeds, other food and its preparationsSource: Ministry of Agriculture and Agro-Based Industry (Jan, 2007)
Ω
= Provisional Data
Ω Ω
Issues Issues
Issue 1
HIGH COST PRODUCER
Imported inputsImported labourCompetition of Land useSmall scaleLow technology
Issue 2Inconsistency of Supply
Small farmScattered farmSmall commercial farmersSuitable varieties
Issue 3 :
PRODUCT PRESENTATION AND DEVELOPMENT
Little product differentiation- Products marketed as commoditiesUse of traditional packaging standardsMinimum grading and labeling practicesMinimal value adding and product development.
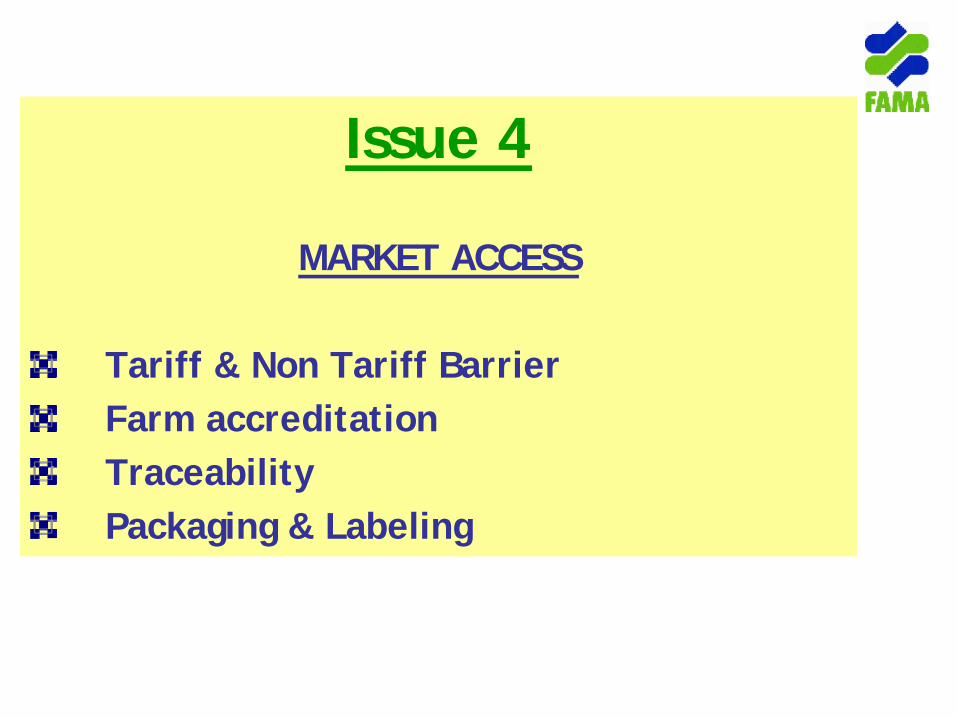
Issue 4
MARKET ACCESS
Tariff & Non Tariff BarrierFarm accreditationTraceabilityPackaging & Labeling
Issue 5
Food Safety and Quality Standards
i) More demanding consumers
-Changing lifestyle and consumer preferences
ii) Farmers slow in adopting Good Agricultural Practices (GAP) or the
Skim Akreditasi Ladang Malaysia (SALM)iii) International markets require compliance to food safety standards
a. Improve ProductivityModern farming – mechanize , new technology, Cluster Farming – all facilities in one area Precise farming – variety, time, quantitiesLess wastage – post harvest handling , logistic
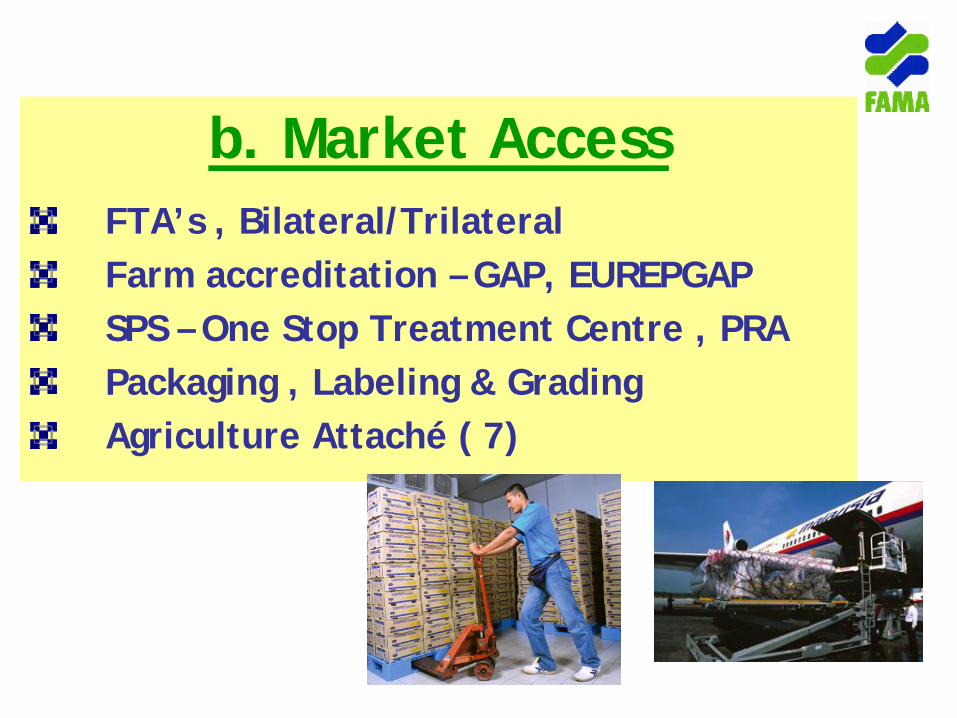
b. Market AccessFTA’s , Bilateral/TrilateralFarm accreditation – GAP, EUREPGAPSPS – One Stop Treatment Centre , PRAPackaging , Labeling & Grading Agriculture Attaché ( 7)
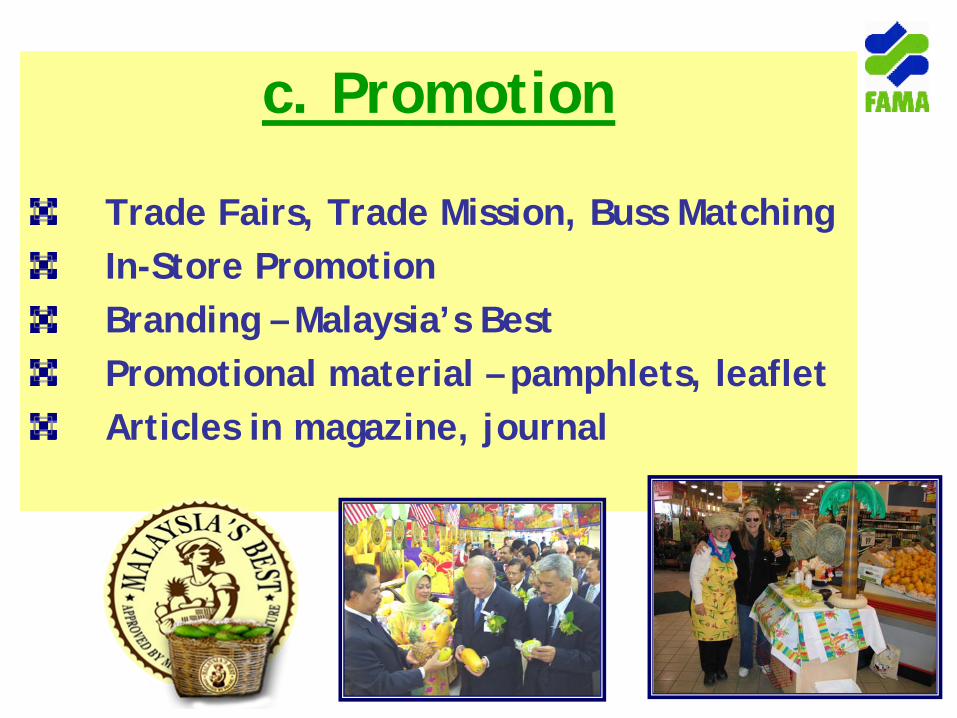
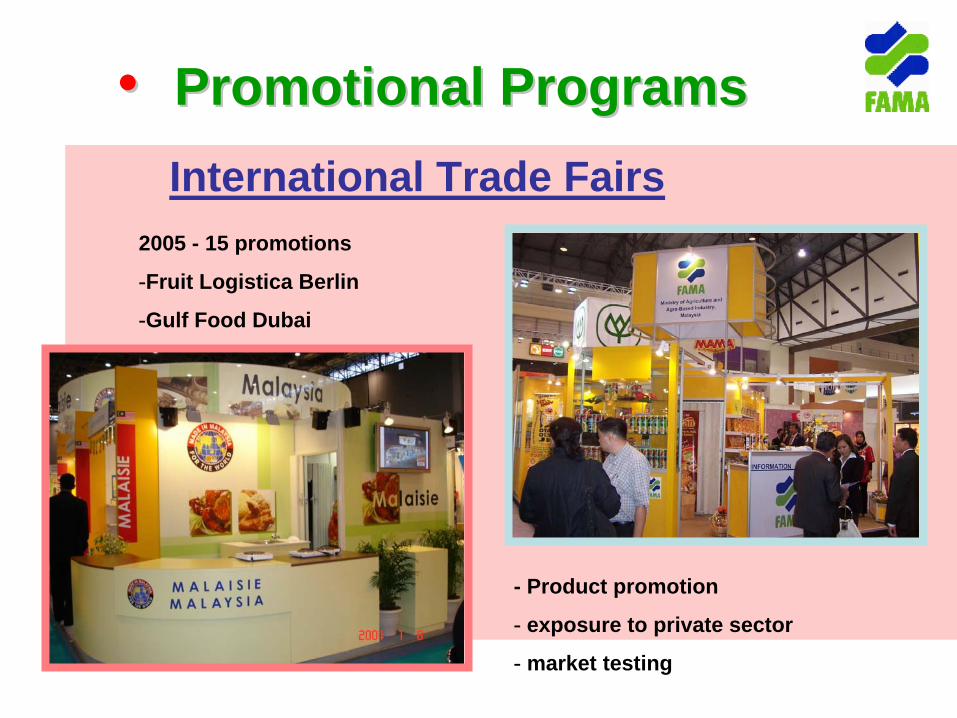
c. Promotion
Trade Fairs, Trade Mission, Buss MatchingIn-Store PromotionBranding – Malaysia’s BestPromotional material – pamphlets, leafletArticles in magazine, journal
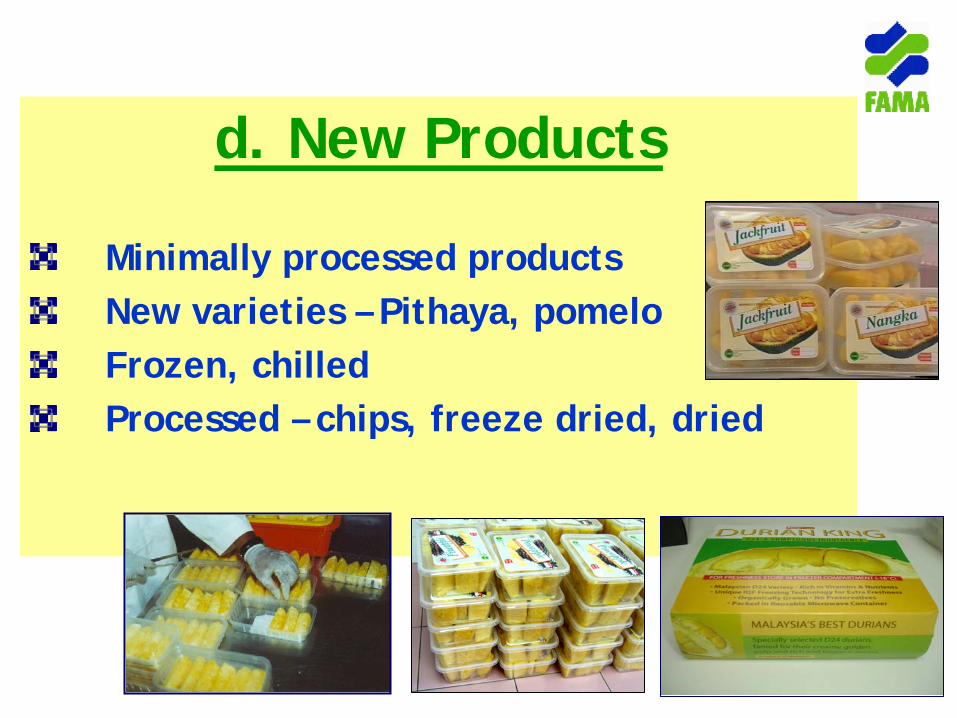
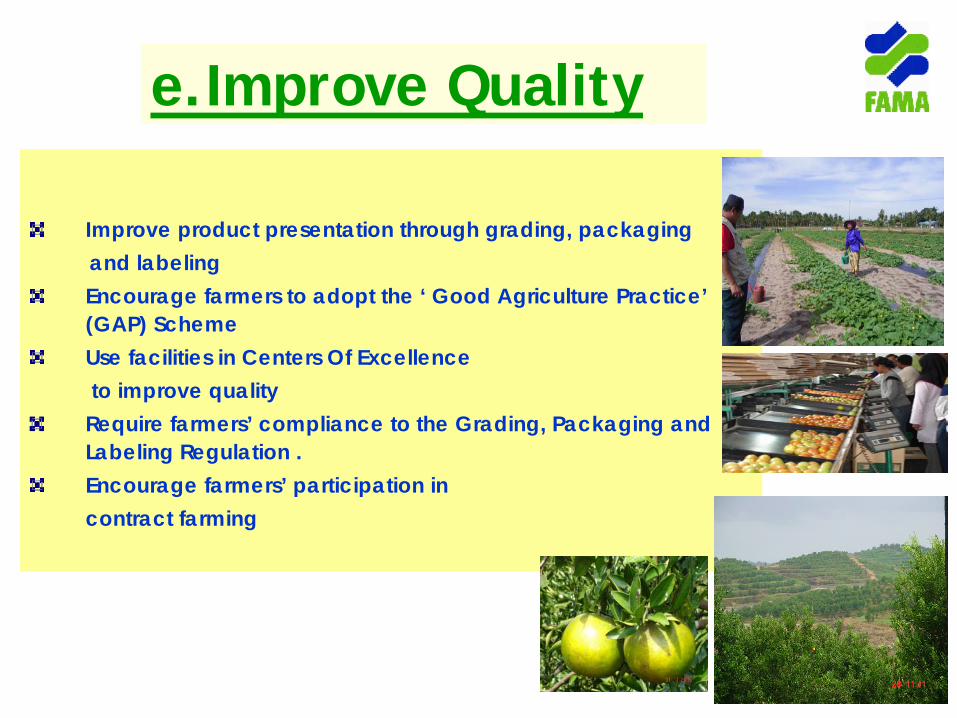
Improve product presentation through grading, packaging and labeling Encourage farmers to adopt the ‘ Good Agriculture Practice’ (GAP) Scheme Use facilities in Centers Of Excellence to improve quality
Require farmers’ compliance to the Grading, Packaging and Labeling Regulation .Encourage farmers’ participation in contract farming
e.Improve Quality
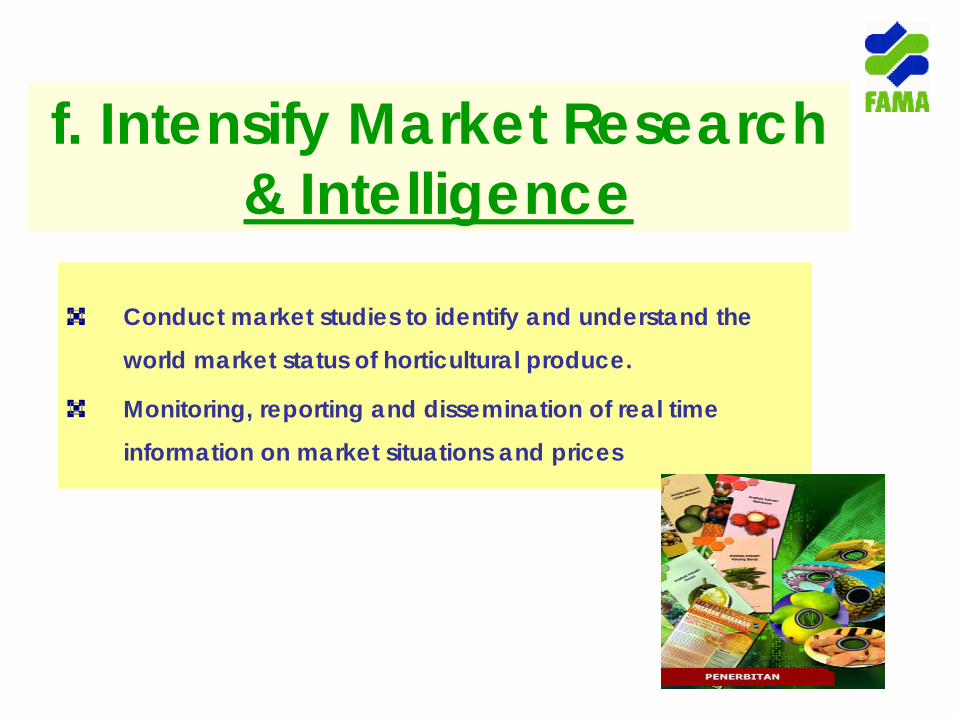
Conduct market studies to identify and understand the
world market status of horticultural produce.
Monitoring, reporting and dissemination of real time
information on market situations and prices
f. Intensify Market Research & Intelligence
g. Regional Approachg. Regional Approach
Common interest, products, season, market
Challenges
Spirit of ASEANShare of market and production informationTF Net as a medium of communicationExchange of expert (production, technical )Regional market access initiatives
h. Formation of Business h. Formation of Business Council Among TF Net Council Among TF Net
MembersMembers
Follow-up by the business people Active participation by private sector in regional business meetingShare of market information among members
ConclusionConclusion
ConclusionConclusionVast potential for Malaysian tropical fruits to cater global demand for exotic segment.The success lies on the ability to produce at cost competitive, high quality, comply to international accreditation, innovative product and market access.