Page 1
P.O. Box 1390, Skulagata 4
120 Reykjavik, Iceland Final Project 2007
THE POTENTIAL OF THE ARTISANAL HILSA FISHERY IN
BANGLADESH: AN ECONOMICALLY EFFICIENT FISHERIES
POLICY
Masud Ara Mome
Evaluation Officer
Department of Fisheries
Matshya Bhaban, Ramna, Dhaka-1000
Bangladesh
[email protected]
Supervisor
Professor Ragnar Arnason
Department of Economics, University of Iceland
[email protected]
ABSTRACT
The hilsa shad (Tenualosa ilisha) fishery is by far the largest single species fishery in
Bangladesh. In this paper, a simple bio-economic year-class based model is developed
to describe the fishery and examine its properties. With the help of this model, the
optimum sustainable yield of the fishery is calculated and compared to the existing
situation. In addition, the model is used to locate a socially and economically
reasonable dynamic path from the current situation to the optimal one. The results
indicate that the fishing effort (measured in standardised boat units) required to make
the hilsa fishery attain sustainable maximum economic benefits is about one-third of
the current fishing effort. At this sustainable fishing effort level, annual net economic
benefits from the fishery would be worth about US $260 million according to my
calculations compared to virtually nothing today. The present value of the fishery
along a moderate effort adjustment path to this long-term equilibrium position is US
$3,650 million at a 6% rate of discount. The dynamic path that maximises the present
value of the fishery involves quite dramatic effort reductions for the first two years.
Such a path would increase the present value of the fishery by perhaps 10-15%.
Page 2
Mome
UNU – Fisheries Training Programme i
LIST OF ABRRIBIATIONS
ARDMCS : Aquatic Resources Development, Management and Conservation
Studies
BFRI : Bangladesh Fisheries Research Institute
BBS : Bangladesh Bureau of Statistics
CPUE : Catch Per Unit Effort
DoF : Department of Fisheries, Bangladesh
EEZ : Exclusive Economic Zone
FRSS : Fisheries Resources Survey System
FIQC : Fish Inspection and Quality Control
FFP : Fourth Fisheries Project
GDP : Gross Domestic Product
GEF : Global Environmental Facility
HP : Horse Power
MSY : Maximum Sustainable Yield
MT : Metric ton
MB : Mechanised Boat
NMB : Non-Mechanised Boat
NFP : National Fisheries Policy
NFS : National Fisheries Strategy
OSY : Optimum Sustainable Yield
PV Present Value
Page 3
Mome
UNU – Fisheries Training Programme ii
TABLE OF CONTENTS
LIST OF ABRRIBIATIONS ................................................................................................................. I
LIST OF FIGURES ............................................................................................................................. III
LIST OF TABLES ............................................................................................................................... III
LIST OF APPENDICES ..................................................................................................................... IV
1 INTRODUCTION ......................................................................................................................... 1
2 BACKGROUND ............................................................................................................................ 3
2.1 OVERVIEW OF BANGLADESH ................................................................................................... 3 2.2 FISHERIES SECTOR OF BANGLADESH ........................................................................................ 4 2.3 HILSA FISHERY IN BANGLADESH: ............................................................................................ 8
2.3.1 Biology of hilsa ................................................................................................................... 8 2.3.2 Economic profile of the hilsa fishery ................................................................................ 10
2.4 THE ARTISANAL HILSA FISHERY IN BANGLADESH .................................................................. 13 2.5 EXISTING MEASURES FOR CONSERVATION AND MANAGEMENT OF THE ARTISANAL HILSA
FISHERY .............................................................................................................................................. 16
3 MODELING ................................................................................................................................. 18
3.1 CHOICE OF MODEL ................................................................................................................. 19 3.2 BIOLOGICAL PART OF THE MODEL .......................................................................................... 19 3.3 ECONOMICAL PART OF THE MODEL ........................................................................................ 21 3.4 THE LINK BETWEEN THE BIOLOGICAL AND ECONOMIC PARTS ................................................ 21
4 DATA AND PARAMETER ESTIMATIONS ........................................................................... 22
4.1 DATA SOURCES ...................................................................................................................... 23 4.2 TIME UNIT AND THE BASE YEAR ............................................................................................. 23 4.3 BIOLOGICAL DATA AND PARAMETERS ................................................................................... 23 4.4 ECONOMIC PARAMETERS ESTIMATION ................................................................................... 26
5 NUMERICAL ANALYSIS AND RESULTS............................................................................. 29
5.1 OPTIMUM SUSTAINABLE YIELD (OSY) FOR THE HILSA FISHERY IN BANGLADESH.................. 29 5.2 COMPARE WITH THE CURRENT SITUATION ............................................................................. 31 5.3 DYNAMIC ADJUSTMENT PATH OF HILSA FISHERY ................................................................... 32
5.3.1 Present value (PV) or profit maximising path .................................................................. 33 5.3.2 A moderate path ................................................................................................................ 35
5.4 DISCUSSION ........................................................................................................................... 38
6 SUMMARY AND POLICY RECOMENDATIONS ................................................................ 41
ACKNOWLEDGEMENTS ................................................................................................................. 43
LIST OF REFERENCES ..................................................................................................................... 44
Page 4
Mome
UNU – Fisheries Training Programme iii
LIST OF FIGURES
FIGURE 1: GEOGRAPHIC LOCATION OF BANGLADESH WITH MAJOR RIVERS ............................................... 3 FIGURE 2: TOTAL FISH PRODUCTION IN BANGLADESH (1996 TO 2007) ..................................................... 5 FIGURE 3: MAJOR FISHING GROUNDS IN THE SOUTHERN PART OF BANGLADESH ....................................... 7 FIGURE 4: TENUALOSA ILISHA (HILSA) ........................................................................................................ 8 FIGURE 5: MOVEMENT PATTERN OF TENUALOSA ILISHA (HILSA) INTO DIFFERENT HABITATS (HALDAR
2005) ................................................................................................................................................ 9 FIGURE 6: MAJOR SPAWNING GROUND OF HILSA IN THE SOUTHERN PART OF BANGLADESH ................... 10 FIGURE 7: TOTAL HILSA HARVEST FROM BOTH MARINE AND INLAND SECTORS IN BANGLADESH (1987-
2007) .............................................................................................................................................. 11 FIGURE 8: TRENDS OF HILSA HARVEST BOTH INLAND AND MARINE SECTOR IN BANGLADESH (1987 TO
2007) .............................................................................................................................................. 12 FIGURE 9: CONTRIBUTION OF HILSA FISHERY IN ARTISANAL FISHERY IN BANGLADESH .......................... 13 FIGURE 10: CATCH PER UNIT EFFORTS OF MECHANISED AND NON-MECHANISED BOATS ......................... 16 FIGURE 11: TYPICAL BEVERTON-HOLT RECRUITMENT FUNCTIONS (KING 1995) .................................... 21 FIGURE 12: SUSTAINABLE YIELD OF THE HILSA FISHERY (PER ½ YEAR) .................................................. 30 FIGURE 13: SUSTAINABLE YIELD OF THE HILSA FISHERY (PER YEAR) ...................................................... 30 FIGURE 14: THE SUSTAINABLE HILSA FISHERY (PER ½ YEAR) ................................................................. 31 FIGURE 15: THE FISHING EFFORT DURING THE PV MAXIMISING PATH FOR SIX MONTHS. ......................... 33 FIGURE 16: RESPONSE OF HILSA STOCK TO FISHING EFFORT DURING THE PV OF PROFIT MAXIMISING PATH
FOR SIX MONTHS. ............................................................................................................................ 34 FIGURE 17: STATUS OF HARVEST DURING THE PV OF PROFITS MAXIMISING PATH FOR SIX MONTHS........ 34 FIGURE 18: PROFIT OF THE HILSA FISHERY DURING THE PV OF PROFITS MAXIMISING PATH FOR SIX
MONTHS .......................................................................................................................................... 35 FIGURE 19: THE FISHING EFFORT DURING THE MODERATE PATH. ............................................................ 36 FIGURE 20: RESPONSE OF THE HILSA STOCK TO FISHING EFFORT DURING THE MODERATE PATH. ............ 36 FIGURE 21: STATUS OF HARVEST DURING THE MODERATE PATH FOR SIX MONTHS. ................................. 37 FIGURE 22: PROFIT OF THE HILSA FISHERY DURING THE MODERATE PATH FOR SIX MONTHS. .................. 37
LIST OF TABLES
TABLE 1: ANNUAL (2005-2006) PRODUCTION AND AREA PRODUCTIVITY OF FISHERIES BY DIFFERENT
RESOURCE TYPES. DEPARTMENT OF FISHERIES (DOF) (2005-2006). ................................................ 6 TABLE 2: EXPORT QUANTITY AND VALUE OF FROZEN AND CHILLED HILSA IN THE LAST FIVE YEARS
(DEPARTMENT OF FISHERIES (DOF) 2007). .................................................................................... 12 TABLE 3: TOTAL NO. OF HILSA FISHERMEN IN DIFFERENT AREAS OF BANGLADESH (HALDER 2004B). .... 14 TABLE 4: ESTIMATED RESULTS FOR THE NUMBER OF FISH AT TIME T ...................................................... 24 TABLE 5: RELATIONS OF INDIVIDUAL AGE, LENGTH AND WEIGHT OF HILSA (BFRI 2000). ...................... 24 TABLE 6: HISTORICAL MORTALITY DATA OF HILSA FISH IN BANGLADESH (HALDER 2004B)................... 25 TABLE 7: NATURAL MORTALITY AND FISHING MORTALITY AT DIFFERENT AGES ..................................... 25 TABLE 8: COST CALCULATION FOR NON-MECHANISED AND MECHANISED BOATS PER YEAR HILSA CATCH
(IN YEAR 2005-2006). ..................................................................................................................... 27 TABLE 9: NUMERICAL COMPARISON BETWEEN THE OPTIMUM SITUATION AND CURRENT SITUATION (6
MONTHS). ....................................................................................................................................... 32
Page 5
Mome
UNU – Fisheries Training Programme iv
LIST OF APPENDICES
APPENDIX 1: TOTAL HILSA HARVEST FROM BOTH INLAND AND MARINE SECTOR OF BANGLADESH (1987-
2006) ............................................................................................................................................... 47
APPENDIX 2: THE TOTAL NUMBER OF MECHANIZED AND NON MECHANIZED BOATS (MB AND NMB)
OPERATED IN THE MARINE SECTOR AND CATCH/BOAT/YEAR. (FRSS, DOF: 1984 TO 2006) ............. 48
APPENDIX 3: OUTPUT OF THE MODEL RUN FOR CALCULATION OF OSY.................................................... 49
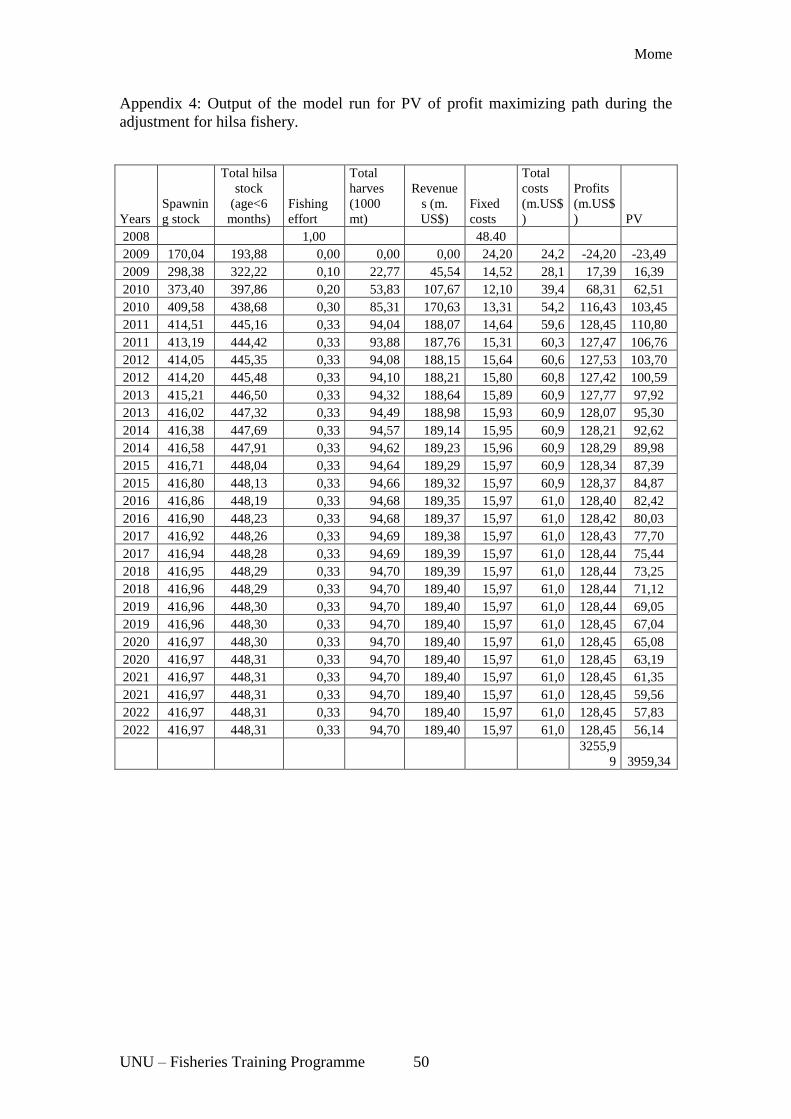
APPENDIX 4: OUTPUT OF THE MODEL RUN FOR PV OF PROFIT MAXIMIZING PATH DURING THE
ADJUSTMENT FOR HILSA FISHERY. ................................................................................................... 50
APPENDIX 5: OUTPUT OF THE MODEL RUN FOR CALCULATES THE MODERATE PATH OF ADJUSTMENT FOR
HILSA FISHERY. ................................................................................................................................ 51
APPENDIX 6: NATIONAL LEGISLATION FOR MARINE ZONES AND FISHING ............................................... 52
Page 6
Mome
UNU – Fisheries Training Programme 1
1 INTRODUCTION
Bangladesh has established a credible record of sustained growth within a stable
macroeconomic framework. The country has made substantial progress in the fight
against poverty, and the devastating impact of frequent cyclones and floods. The huge
population of the country is now becoming a strength full resource.
Bangladesh is criss-crossed by hundreds of rivers and blessed by rich marine and
fresh water resources. Fisheries play quite an important role in Bangladesh society in
terms of protein supply, generation of employment and earning of foreign currency.
The country‟s most important aquatic resource is the ilish, or the hilsa shad. It is the
largest and single most valuable fishery in Bangladesh. In the year 2005-06, about
11% of the country‟s total fish production came from hilsa. Average hilsa production
is about 215 thousand mt which is valued at about US $380 million. Hilsa contributes
1.0% to the GDP (DoF 2006). Until 1972 the hilsa fishery was restricted to the
upstream rivers, mainly the rivers Padma, Meghna, Karatoya, Rupsa, Shibsa and
Payra. Since 1972, the fishery has severely declined in the upstream areas and is now
mainly in downstream rivers, estuaries, coastal areas and the sea. Low water discharge
from the river Ganga at the Farraka barrage (which is a dam located 10 km from the
Indian side of the border between India and Bangladesh) and associated heavy
siltation, indiscriminate exploitation of juveniles (jatka), disruption of their migration
routes, loss of spawning, feeding and nursery grounds and increased fishing pressure
have all contributed to a decline in the catch per unit effort in both the marine and
river hilsa fishery. The radical decrease of catches of both mechanised and non-
mechanised boats indicates the excess of fishing effort, which could lead to over-
exploitation and vulnerability of the fishery. The declining trend of catch per unit
effort of hilsa fishing is threatening the livelihoods of about 464 thousand hilsa
fishermen. Fish stocks are renewable and a pragmatic approach is essential to
maximise the sustainable benefits they can generate. It must be ensured that the
resources are protected from irreversible damage and managed on a sustainable basis.
The existing situation of the hilsa fishery suggests that proper assessment is necessary
and finding a way to stimulate the recovery the fishery and make it sustainable while
maximising economic benefits.
The hilsa fishery of Bangladesh is characterised by the usual common property
conditions where the available resources are exploited by a large number of
fishermen. As expected the number of fishermen and fishing effort increased so long
as the fish catches and market prices were sufficiently high. In certain upstream areas
this process has ended and even reversed itself because of lack of fish. The social
implications are severe. Hilsa fishing intensity has been increasing in downstream
areas and especially the inshore waters where sufficient concentrations of hilsa are
now found. Sufficient limitations and controls on fishing vessels and fishing effort
have not been put in place to counter this. However, a study in 2004 pointed out that
over time high level of fishing effort would seriously reduce the fish stock and
consequently the rate of catch per unit of effort in both river and marine hilsa fisheries
(Halder 2004b)
In Bangladesh both the marine and river hilsa fisheries are important. Unfortunately,
due to the unavailability of reliable data for the river fishery, it was not possible to
Page 7
Mome
UNU – Fisheries Training Programme 2
include both sectors in the study. Therefore, this study is restricted to the marine hilsa
fishery in Bangladesh. Presumably, however, because of the upstream spawning
migrations of the hilsa, what is good for the marine fishery is also good for the river
fishery.
The marine hilsa fishery is an artisanal type of fishery. Socio-economic conditions of
the coastal fishermen communities are characterised by lack of alternative sources of
subsistence. The sector is further characterised by open access with crowding of effort
in the coastal waters. This crowding is often attributed to the absence of technical
skills and capital on the fishermen side to go beyond the inshore water to exploit other
resources. This is a problem that shows lack of enforcement of existing management
measures and lack of appropriate policies against over-fishing. Therefore, it is most
timely to examine as far as possible whether the fisheries can be sustained at the
current level of exploitation and whether society could gain from a change in current
fishing effort.
In spite of the importance of the hilsa fishery, up-to-date studies are not available and
there are practically no studies of the economics of the fishery. To maintain and
enhance the hilsa stock many biologically based management controls have been
implemented. However, as we have seen, these measures have not been entirely
successful in preventing decline in the stock. More importantly, these measures are
not capable of maintaining or generating the flow of net economic benefits from
utilising the stock or even informing the managers of the socially and economically
optimal fishing effort levels.
The knowledge which would be obtained through the application of a bio-economic
model to the hilsa fishery could be utilised in future projects for conservation and
management of the fishery and socio-economic development of hilsa fishers‟
communities. The model development skill through this project will be used to
conduct other fisheries studies in the country.
The aim of this study is to develop a bio-economic model of the hilsa fishery which
can be used as a first step towards improved management of this fishery. More
precisely, the objectives of the present study are:
To calculate the optimal sustainable yield for the hilsa fishery in Bangladesh.
To compare the current situation with the optimal fishery.
To find an economically and socially reasonable path from the current level of
fishing effort to the optimal sustainable yield level.
To attain these objectives a simple bio-economical model has developed. On the basis
of this model, the optimal sustainable yield will be calculated and compared to the
existing situation. In addition, the model will be used to locate a socially and
economically reasonable path from the current situation to the optimal one. Measures
of the social gains from doing this will be calculated.
This study will provide baseline information concerning the bio-economics of the
hilsa fishery. The results will provide some preliminary answers to questions
concerning the utilisation of the hilsa stock. On that basis, recommendations for
regulating the fishing effort over time leading to the hilsa recovery process may be
Page 8
Mome
UNU – Fisheries Training Programme 3
derived. On the basis of my findings, policy makers will be able to design
management policies based on a sound optimal sustainable yield level for the hilsa
fishery, and thus, hopefully, prevent further biological and economic deterioration of
the hilsa fishery.
2 BACKGROUND
2.1 Overview of Bangladesh
Bangladesh is situated in the northeast corner of South Asia. It is located between
latitude 20º-34' and 26
º-39' north and longitude 88
º-01' and 92
º -41' east. It borders
with India in the west, north, and east, with Myanmar in the southeast, and with the
Bay of Bengal in the south. The country‟s area is 144.000 square kilometres (55.598
square miles), and it is divided into six administrative divisions (Dhaka, Chittagong,
Khulna, Barisal, Rajshahi and Sylhat).
Figure 1: Geographic location of Bangladesh with major rivers
Page 9
Mome
UNU – Fisheries Training Programme 4
The population of Bangladesh was estimated at 150 million in July 2007, making
Bangladesh the 10th
most populous state in the world. Its population has almost
doubled since the 1960s (CIA 2007). The Bangladesh population is relatively
homogeneous. Religion plays a very important role in this country and the main
division is between Islam and Hinduism. There are three main seasons in Bangladesh,
winter, summer and monsoon. Winter lasts only for about 2 months in the country.
Temperature and rainfall ranges from 7º C to 40
ºC and 1170 to 3400 mm respectively.
The climate and geography of Bangladesh is well suited for fish culture and various
kinds of fisheries resources.
Bangladesh is a predominantly agricultural nation. The country‟s economy is based
on agriculture. Within the agricultural sector fisheries is the most important sub sector
of the country. Fisheries have made up 5-6% of the country‟s GDP for the past several
years.
2.2 Fisheries sector of Bangladesh
Bangladesh possesses an immense wetland area comprising a multi-species
ecosystem. Numerous rivers, streams and tidal creeks intersect the vast alluvial tract,
which are largely, formed by the fertile deltaic region of three mighty rivers the
Ganges, the Brahmaputra and the Meghna. The large rivers flowing from the
Himalayas, the Ganges unites with the Jamuna (main channel of the Brahmaputra)
and later joins the Meghna to eventually empty into the Bay of Bangladesh. About
230 rivers and their tributaries with a total length of 24.000 km flow down through the
country. There are about 54 rivers shared with India (Bangladesh Bureau of Statistics
1991).
The fisheries sector has played a vital role in the economy of Bangladesh. This sector
has high potential from the perspective of economic development of the country. The
fisheries sector contributes about 4,9% of the national GDP and 20% to the total
agricultural production. Also 5,7% of the country‟s total export earnings come from
this sector. Fish alone contribute about 63% of the animal protein in the daily dietary
requirements of Bangladeshi people. Per capita fish consumption is 16 kg/year. The
average growth rate of this sector for the last five years was about 5.2%. The sector
provides full time employment for about 1.3 million professional fishermen and 12
million part time fisherfolk, which is about 10% of the total population (DoF 2005a).
The country‟s total fish production has nearly doubled since 1996, reaching 2.2 mt in
2007 (Figure 2).
Page 10
Mome
UNU – Fisheries Training Programme 5
Figure 2: Total fish production in Bangladesh (1996 to 2007)
Fisheries in Bangladesh fall broadly into four categories: (i) inland capture (open
water), (ii) inland culture (closed water), (iii) marine industrial or trawl fishing, and
(iv) marine artisanal or small-scale fishing. Fishing techniques are mainly categorised
as traditional, artisanal and commercial. Traditional and artisanal fisheries in rivers,
beels, haor and baor as well as in freshwater is primarily inshore which is done by
independent fishermen in small boats usually using simple gear like traps, gillnets,
beach seines, purse seines, dip nets, cast nets and small long lines. Most of the catch is
consumed locally either processed or fresh. There is no effective central marketing
agency in the villages.
There is a wide variety of fish species in Bangladesh which can be grouped into five
broad categories: hilsa, carp, catfish, prawn and others. In the inland open water
system, there are 260 native species, 13 exotic fish species and 20 species of shrimp
(Rahman 1989). Besides this, 31 species of turtles and tortoises are found of which 24
live in fresh water (Sarker and Sarker 1988). In the upper Bay of Bengal, 475 species
of finfish are known to occur, of which about 65 species are commercially important.
In the upper Bay of Bengal there are 38 species of marine prawn (Ali 1992). Of all
fish species, the most important one is hilsa.
Present status of water resources and production fisheries in Bangladesh
There are different types of water bodies in Bangladesh. The soil, water and climate
of Bangladesh are very favourable for inland fisheries, both open and closed water.
Various kinds of fish culture practices have been done for many years. The following
table (Table 1) depicts the picture of total catch and productivity in the fisheries sub-
areas of the country.
Page 11
Mome
UNU – Fisheries Training Programme 6
Table 1: Annual (2005-2006) production and area productivity of fisheries by
different resource types. Department of fisheries (DOF) (2005-2006). Resource type Water area
(ha)
Production
(MT)
Production/area
(Kg/ha)
% of total
production
A. Inland fisheries
Inland open water fisheries
River and estuaries 1.031.563 1.378,59 134
Sundarbans - 16.423 -
Beel* 114.161 76.365 669
Kaptai Lake 68.800 7.548 110
Flood land & haor** 2.832.792 718.491 254
Total Inland open water 4.047.316 956.686 41,1
Inland closed fisheries
Pond and ditch 305.025 759.628 2.490
Baor*** 5.488 449,8 820
Coastal shrimp farm 217.877 127.923 587
Total inland closed water 528.390 892.049 38,3
Total inland fishery 4.560.900 1.848.735 - 79,4
B. Marine fisheries
Industrial fisheries - 34.084 -
Artisanal fisheries - 445.726 -
Total marine 479.810 20,6
Total fisheries 2.328.545 100
*Beel: Lake, a deeper area or pocket where water remains throughout the year or for a longer period.
**Haor: Big depression or low-lying floodplain area in Northeast Bangladesh which is inundated
during monsoon and becomes a vast sheet of water.
***Baor: Oxbow lake.
It is evident from the above figures that the contribution of capture fisheries with
respect to the total fish catch of the country is the highest (41%) followed by fish
farming (38%), while the contribution of marine fisheries is only 21% although
166.000 square kilometres is under the economic jurisdiction of the country for
exploration, exploitation, conservation and management of marine living and non-
living resources.
The coastline of the country is about 480 km in length. The area of the sea that makes
up the Bangladesh Exclusive Economic Zone (EEZ) is estimated to be about 125.000
sq km. Three major fishing grounds have been discovered in the Bay of Bengal (i)
South Patches (6.200 sq km) (ii) Middle Ground (4.600 sq km) (iii) Swatch of no
Ground (3.800 sq km). Of these three fishing grounds, the South Patches are found to
be the most productive, with an estimated standing stock of 11.4-16.0 mt per sq km,
followed by 10.2-14.4 mt in the Swatch of no Ground and 8.4-12.0 mt in the Middle
Ground. Potential fish (hilsa and other fin fish) and shrimp grounds have been
identified and demarcated within the area of the continental shelf up to the depth of 40
fathom.
Page 12
Mome
UNU – Fisheries Training Programme 7
Figure 3: Major fishing grounds in the southern part of Bangladesh
There are two types of Marine fisheries in Bangladesh: (a) artisanal fisheries, which
have 22.500 non-mechanised boats and 21.400 mechanised boats used for hilsa and
shrimp (post larvae and juveniles) catch, and (b) industrial fisheries which have 122
industrial trawlers engaged in demersal fish and shrimp catching. There is a vast area
Fishing
ground
Page 13
Mome
UNU – Fisheries Training Programme 8
of the artisanal fisheries sector in Bangladesh. At present, 93% of the catch comes
from artisanal fisheries and 7% of the catch comes from the industrial fishery.
2.3 Hilsa fishery in Bangladesh:
2.3.1 Biology of hilsa
The Indian shad, Tenualosa ilisha, belongs to the family Clupeidae (herring family).
The scientific name of the species, Hilsa ilisha has been revised recently to Tenualosa
ilisha (Fisher and Bianchi 1984), but the popular name “hilsa” has been used for more
than a century.
Hilsa has a wide range of distribution and occurs in marine, estuarine and riverine
environments. The fish is found in the Persian Gulf, Red Sea, Arabian Sea, Bay of
Bengal, Vietnam Sea and China Sea. The riverine habitat covers the Satil Arab, and
the Tigris and Euphrates of Iran and Iraq, the Indus of Pakistan, the rivers of Eastern
and Western India, the Irrawaddy of Myanmar, and the Padma, Jamuna, Meghna,
Karnafully and other coastal rivers of Bangladesh. The major portion of hilsa (about
95%) is caught by Bangladesh, India and Myanmar (Banglapedia 2007).
Figure 4: Tenualosa ilisha (hilsa)
Hilsa shad (T. ilisha) is anadromous in nature. It is capable of withstanding a wide
rang of salinity and travelling great distances up-stream. Hilsa lives in the sea for most
of its life but migrates up to 1,200 km inland through rivers in the Indian sub-
continent for spawning. Distances of 50-100 km are usually normal in the Bangladesh
rivers (Wikipedia 2007). Hilsa may reach up to 60 cm in total length, but commonly
found specimens measure 35 to 40 cm. A large-sized hilsa weighs about 2.5 kg. The
hilsa is known to be a fast swimmer (Southwell and Prashad 1918).
Some conflicting views have been expressed on the minimum size of hilsa at first
maturity. Day (1873) observed that the hilsa may attain first maturity at the end of the
first year or at the beginning of the second year. In Bangladesh waters (Meghna
River), Shafi et al. (1978) observed that, the size at first maturity is 21 cm in the case
of males and 32 cm in the case of females.
In Bangladesh, hilsa is available almost throughout the year in the major rivers. Hilsa
starts spawning migration to upstream during the southwest monsoon and consequent
Page 14
Mome
UNU – Fisheries Training Programme 9
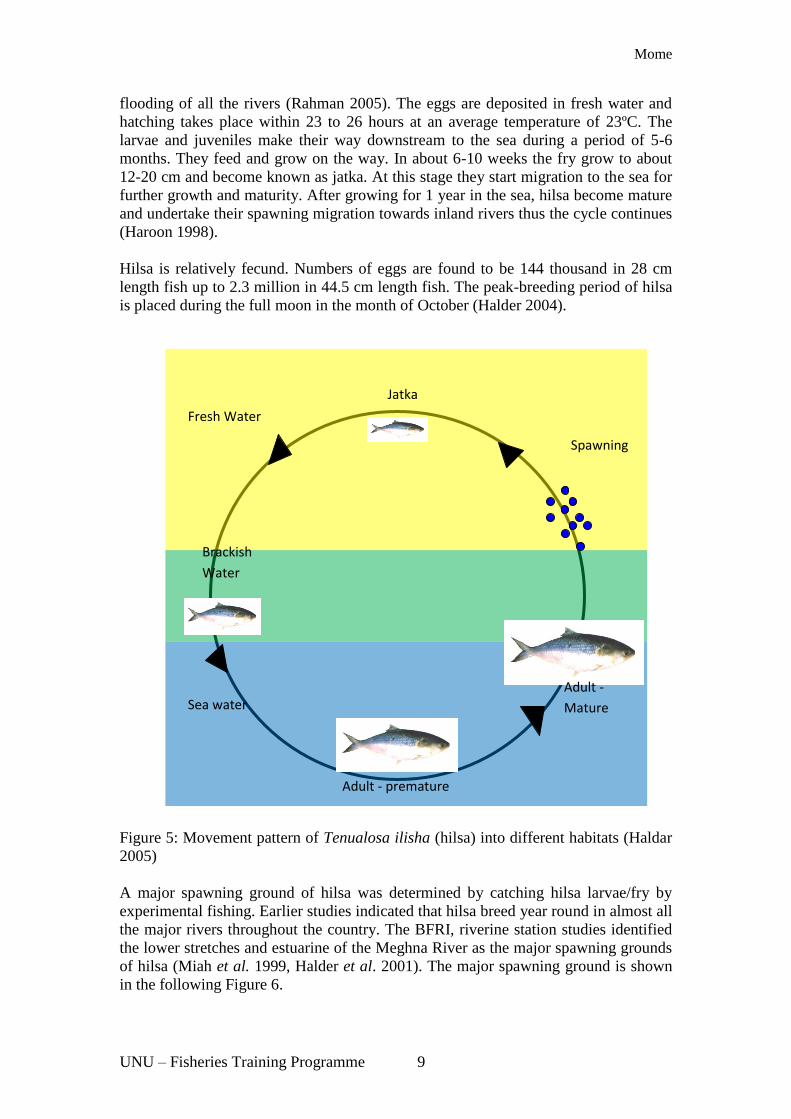
flooding of all the rivers (Rahman 2005). The eggs are deposited in fresh water and
hatching takes place within 23 to 26 hours at an average temperature of 23ºC. The
larvae and juveniles make their way downstream to the sea during a period of 5-6
months. They feed and grow on the way. In about 6-10 weeks the fry grow to about
12-20 cm and become known as jatka. At this stage they start migration to the sea for
further growth and maturity. After growing for 1 year in the sea, hilsa become mature
and undertake their spawning migration towards inland rivers thus the cycle continues
(Haroon 1998).
Hilsa is relatively fecund. Numbers of eggs are found to be 144 thousand in 28 cm
length fish up to 2.3 million in 44.5 cm length fish. The peak-breeding period of hilsa
is placed during the full moon in the month of October (Halder 2004).
Figure 5: Movement pattern of Tenualosa ilisha (hilsa) into different habitats (Haldar
2005)
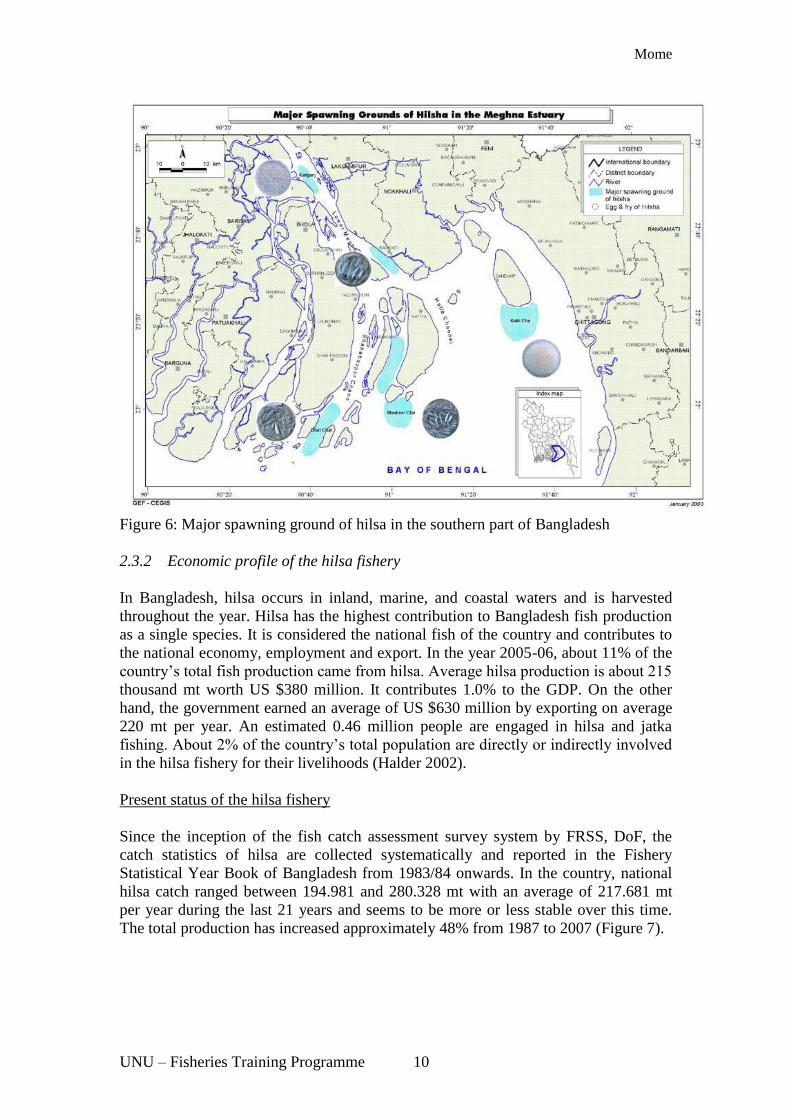
A major spawning ground of hilsa was determined by catching hilsa larvae/fry by
experimental fishing. Earlier studies indicated that hilsa breed year round in almost all
the major rivers throughout the country. The BFRI, riverine station studies identified
the lower stretches and estuarine of the Meghna River as the major spawning grounds
of hilsa (Miah et al. 1999, Halder et al. 2001). The major spawning ground is shown
in the following Figure 6.
Fresh Water
Jatka
Sea water
Spawning
Adult - premature
Adult -
Mature
Brackish
Water
Page 15
Mome
UNU – Fisheries Training Programme 10
Figure 6: Major spawning ground of hilsa in the southern part of Bangladesh
2.3.2 Economic profile of the hilsa fishery
In Bangladesh, hilsa occurs in inland, marine, and coastal waters and is harvested
throughout the year. Hilsa has the highest contribution to Bangladesh fish production
as a single species. It is considered the national fish of the country and contributes to
the national economy, employment and export. In the year 2005-06, about 11% of the
country‟s total fish production came from hilsa. Average hilsa production is about 215
thousand mt worth US $380 million. It contributes 1.0% to the GDP. On the other
hand, the government earned an average of US $630 million by exporting on average
220 mt per year. An estimated 0.46 million people are engaged in hilsa and jatka
fishing. About 2% of the country‟s total population are directly or indirectly involved
in the hilsa fishery for their livelihoods (Halder 2002).
Present status of the hilsa fishery
Since the inception of the fish catch assessment survey system by FRSS, DoF, the
catch statistics of hilsa are collected systematically and reported in the Fishery
Statistical Year Book of Bangladesh from 1983/84 onwards. In the country, national
hilsa catch ranged between 194.981 and 280.328 mt with an average of 217.681 mt
per year during the last 21 years and seems to be more or less stable over this time.
The total production has increased approximately 48% from 1987 to 2007 (Figure 7).
Page 16
Mome
UNU – Fisheries Training Programme 11
Figure 7: Total hilsa harvest from both marine and inland sectors in Bangladesh
(1987-2007)
It is evident that the hilsa fishery is experiencing recruitment over-fishing and growth
over-fishing. A study in 2004 pointed out that current fishing is close to the MSY
level. In the year 2003, the estimated standing stock size and MSY was 218 thousand
tons and 235 thousand tons respectively. The annual catch of hilsa was 229.000 mt in
the year 2003, which is very close to MSY level (Department of fisheries (DOF
2005b). This indicates the over-fishing of the hilsa stock. Not only this, the
exploitation rate of hilsa was 0.33 (under-exploitation) in 1985 but it has since
increased to 0.66 (over-exploitation) in 2002. The present exploitation rate is about 2
times that of 1985, and the hilsa are over-exploited by 0.16 times i.e. 32 % higher than
the optimum level (0.5). The length of first
capture hilsa has decreased from 38 cm in
1985 to 20 cm in 2002 (Halder 2002). The total inland and marine sectors hilsa
landings from 1984 to 2007 are shown in Appendix 1.
Comparison between inland and marine of hilsa landings
In Bangladesh, hilsa exist in inland, marine and coastal waters and are harvested
throughout the year. Until the introduction of mechanised boats and nylon twine in
early 1980s, the catches of hilsa were mainly concentrated in the inland waters and in
the estuaries and very little in the coastal zones. Although the total hilsa harvest is
more or less steady, the inland hilsa catches have decreased by about 15% during the
period 1987 to 2006. After the introduction of nylon twine and mechanised boats in
the marine sectors (Raja 1985 and Hall & Kasem 1994), the intensity of marine hilsa
catches have been increased. In spite of this, marine production has been increased by
about 26% during 1986 to 2006. During 1986/87 to 2006/07, the catches ranged
between 104 thousand to 198 thousand mt with an average of 137 thousand mt since
the base year 1986/87, the increase in marine hilsa landings is about 45%. Such a
robust increase of hilsa production from the marine sector may be due to increased
fishing effort, expansion of fishing areas and may also be due to a decrease in
abundance and fishing areas in the inland waters (Figure 8).
Page 17
Mome
UNU – Fisheries Training Programme 12
Figure 8: Trends of hilsa harvest both inland and marine sector in Bangladesh (1987
to 2007)
Export of hilsa
A considerable amount of hilsa is exported from Bangladesh. The minimum size of
exportable hilsa is about 1.0 kg. Hilsa is mainly exported to West Bengal, India and
some other countries in the Far East and Middle-East, European Union, America and
Australia. In Europe, USA and some other countries hilsa is available at the
Bangladeshi grocery stores. In the year 2002-2003 Bangladesh exported 1148 mt of
hilsa, and in 2005-2006 it was increased to 3672 mt DOF (2007) (Table 2).
Table 2: Export quantity and value of frozen and chilled hilsa in the last five years
(Department of Fisheries (DoF) 2007). Year Export volume (MT) Export earning (million Tk.)
2002-2003 1.148 15.000
2003-2004 1.930 79.000
2004-2005 3.584 51.950
2005-2006 3.672 63.610
2006-2007 5,20 3.700
From the above Table 2, it could be seen that in 2006-2007 the exports suddenly
dropped. The reason is that the Government of Bangladesh banned the hilsa export for
this year. The whole year catch both inland and marine are locally consumed.
Page 18
Mome
UNU – Fisheries Training Programme 13
2.4 The artisanal hilsa fishery in Bangladesh
The artisanal fisheries are by far the most important fisheries in the marine sector of
Bangladesh. In the year 2006, about 93% of the catch comes from the artisanal fishery
and about 7% comes from the industrial fishery. Among the artisanal sector the hilsa
fishery contributes over 41% of the total catch (Figure 9).
Figure 9: Contribution of hilsa fishery in artisanal fishery in Bangladesh
The artisanal sector is characterised by use of local, traditional and primitive methods
of fishing. By implication, the characteristics of the sector are supposed to be low
level of mechanisation, labour intensive fishing methods, and the prevalent use of
unsophisticated techniques.
The artisanal hilsa fishery is mainly a gill net fishery. Several traditional fishing
techniques are employed in this sector. Artisinal fishing for hilsa can be done almost
throughout the year. The peak season is September/October, some minor peaks occur
in February, April and June. The catch from the estuarine sector was sold mostly at
the fishing ground itself to carrier boats; hence the shore landings are poor.
In the artisanal gill net fishery, mechanised and non-mechanised boats are engaged for
hilsa fishing. As per statistics of FRSS, the total numbers of mechanised boats (MB)
and non-mechanised boats (NMB) and gears were 2.887.380,2 and 6.682 respectively
in 1984/85. In 2005/06, these figures had increased to 18.992 6.377 and 106.316
respectively. A survey was conducted by GEF in 2002/03. According to this survey,
three types of boats engaged in marine hilsa catching in Bangladesh. These are
trawlers (around 15 feet long) and tempo (around 10 feet long) boats used in
commercial hilsa fishing. Both types of boats are called trawlers or mechanised boats
with around 8-12 HP engine capacities. And the other most important non-
mechanised boats used in the artisanal sector are Chandhi boats which have existed
for a long period of time.
The hilsa stocks are exploited by a variety of gears, the most common of which are
the clap net, gillnet, driftnet, seine net, barrier net, and fixed bag net; the largest
contribution, however, comes from gill/drift nets. Mechanised fishing with gillnets
accounts for the bulk of the landings from the sea. For this reason the number of
fishing vessels and gears increased day by day.
Page 19
Mome
UNU – Fisheries Training Programme 14
Number of hilsa fisherman in artisanal sector in Bangladesh
Number of fishers involved in a fishery is an important aspect towards sustainable
development and management of the fishery. In a country-wide survey, the total
number of fishermen involved in hilsa fishing was found to be about 464 thousand
belonging to 184 thousand families and of them 68% are full time and 32% are part
time (Table 3).
Table 3: Total no. of hilsa fishermen in different areas of Bangladesh (Halder 2004b). Name of
division
Total
district
Total
fishermen
Total
hilsa
village
Total
hilsa
fisher
family
Total hilsa
fishermen
Occupation
Full time
(%)
Part
time
(%)
Dhaka 12 75.687 579 8.902 17.454 26 74
Chittagong 8 257.715 773 66.608 142.649 56 44
Barisal 6 308.270 1.743 100.270 285.001 65 35
Rajshahi 7 27.636 307 2879 6.372 24 76
Khulna 5 78.268 260 4.570 11.783 10 90
Sylhet 2 9.500 41 383 825 10 90
Total 40 757.076 3.706 183..630 464.084 32 68
Among those hilsa fishermen (Table 3) 439 thousand belonging to 171 thousand
families are artisanal fishers. From 1987 to 2007, with an increase of boats and gears,
the numbers of hilsa fishers have been increased in the marine sector. The number of
hilsa fishermen from the inland sector may have decreased because of less abundance
of hilsa in the riverine habitats and habitat loss.
Socio-economic conditions of fishermen
Usually, it is told that the fishers are the poorest group of people in the country. But
little is known about their poverty level because very little work on the livelihood of
the fishers has been done in the country. Like other fishermen, hilsa fishers are poor.
There are three major categories of hilsa fishers: the boat owner, head mazhi (skipper)
and the crew. Usually the boat owners own the boats and nets and offer their boats
and nets for fishing to the head mazhi. The usual share of the above categories of the
fishers are that the boat owner gets 50-70% of the total catch, the head mazhi gets 2-
3% share, assistant head mazhi and the boat driver get 1.5% share and the crew or
labour fishers, deducting the cost of fishing get only 1% shares for the fishing
operation. The annual expenditure for livelihood (except capital cost) of the artisanal
hilsa fishers was found to average Tk. 76.045 and for consumption it was an average
of Tk 38, 300 (BFRI 2000). So the overall socio-economic conditions of the hilsa
fisher-folk in both the upper and lower regions are very poor. If the production or
CPUE decline, the socio-economic conditions of the hilsa fisher folk will worsen
further.
Marketing system of artisanal hilsa fishery
Hilsa is marketed and consumed all over Bangladesh. According to Kleih et al.
(2003), 88% of hilsa is marketed internally for domestic consumption while the
remaining 12% is exported. Most of the catch is consumed locally either processed or
Page 20
Mome
UNU – Fisheries Training Programme 15
fresh. The catch from the artisanal hilsa fishery is sold directly to local agents. There
is no effective central marketing agency in the villages. Traders buy fish at low prices
from fishers located far from major urban centres. The traders visit different fish
landing sites daily buy fish and transport to markets in major towns. The local price is
set depending on the demand for fish and distances of villages from the major coastal
towns. Hence, the price of fish is attributed to the variable cost of transportation.
Prices tend to be lower farther away from the towns. Local agents supply the fish to
the town market and some fish are transported to processing factories. The market
price of hilsa depends on quality, size and weight, season, market structure, supply
and demand. Hilsa prices are known to follow a seasonal pattern, with the demand
period around festivals not necessarily coinciding with bumper harvest. Prices also
vary from market to market. Prices in town markets tend to be higher than in coastal
markets due to a larger concentration of consumers and superior family income
(Ahmed 2007). In comparison with the year 1984, the producer price of hilsa has
increased about seven times (Tk 20.0/kg in 1984 to Tk 130 in 2003) (Department of
Fisheries (DOF) 2007.
Present situation of the artisanal hilsa fishery
The artisanal hilsa sector now a days is characterised by open access with crowding of
fishing effort. Hilsa experts now fear that the most productive sites for hilsa remain
exploited. The study 2004 also stated that artisanal fishery resources have already
reached an upper level of exploitation.This is believed to be due to fishermen fishing
in the same areas since time immemorial because of open excess with crowding of
fishing effort and due to lack of proper management practices (Halder 2004b). As a
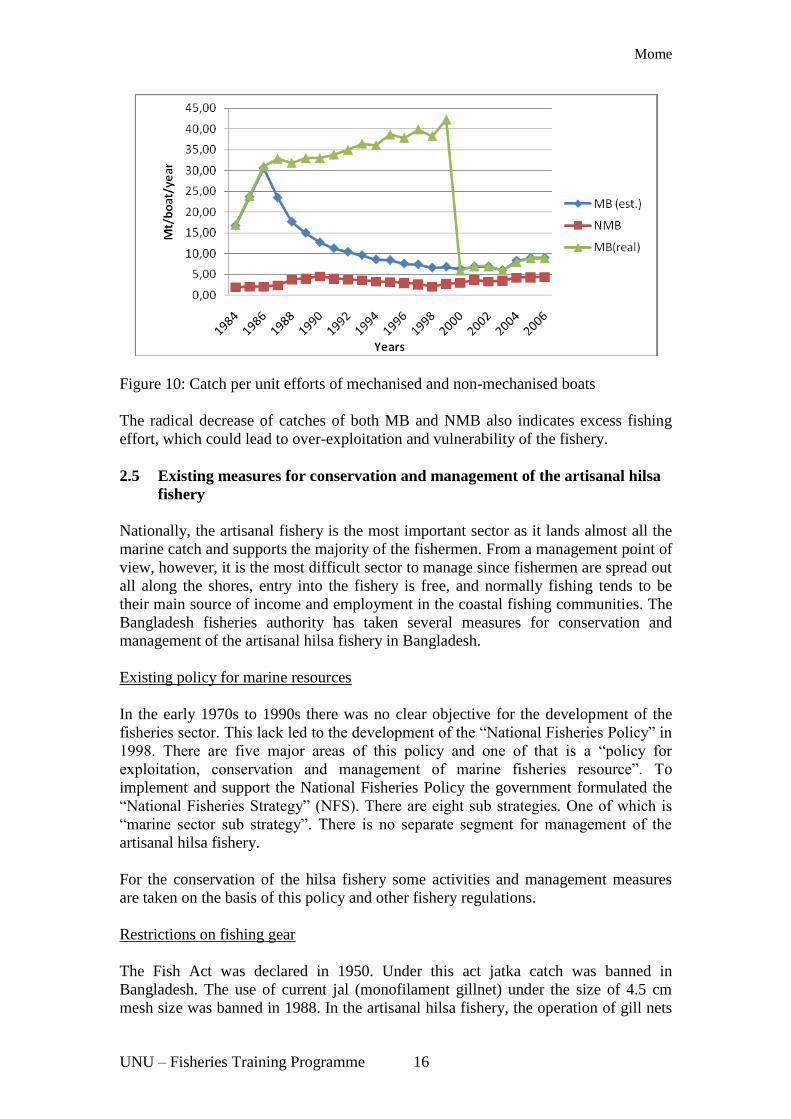
result CPUF has been seriously declineing for the last couple of years. The catch of
mechanised boats per year is estimated to be 33 mt in 1989/90 and subsequently
decreased to only 9 mt in 2005/06. The catch of non-mechanised boats per year
ranged from 5.3 to 4 mt from 1989/90 to 2005/06.
For this study the data on the number of boats over time are not reliable. Therefore the
number of vessels and CPUE is calculated on an average basis. Such a huge increase
of boats and gears in the sector may result in over-exploitation of the fishery, a
decrease in catch/unit effort landing to unsustainable conditions of the fishery and
ultimately a decrease of hilsa production. The total number of fishing gears and crafts
is shown in Appendix 2. The catch per unit effort of mechanised and non-mechanised
boats (MB and NMB) in the artisanal hilsa fishery is radically declining (Figure 11).
Page 21
Mome
UNU – Fisheries Training Programme 16
Figure 10: Catch per unit efforts of mechanised and non-mechanised boats
The radical decrease of catches of both MB and NMB also indicates excess fishing
effort, which could lead to over-exploitation and vulnerability of the fishery.
2.5 Existing measures for conservation and management of the artisanal hilsa
fishery
Nationally, the artisanal fishery is the most important sector as it lands almost all the
marine catch and supports the majority of the fishermen. From a management point of
view, however, it is the most difficult sector to manage since fishermen are spread out
all along the shores, entry into the fishery is free, and normally fishing tends to be
their main source of income and employment in the coastal fishing communities. The
Bangladesh fisheries authority has taken several measures for conservation and
management of the artisanal hilsa fishery in Bangladesh.
Existing policy for marine resources
In the early 1970s to 1990s there was no clear objective for the development of the
fisheries sector. This lack led to the development of the “National Fisheries Policy” in
1998. There are five major areas of this policy and one of that is a “policy for
exploitation, conservation and management of marine fisheries resource”. To
implement and support the National Fisheries Policy the government formulated the
“National Fisheries Strategy” (NFS). There are eight sub strategies. One of which is
“marine sector sub strategy”. There is no separate segment for management of the
artisanal hilsa fishery.
For the conservation of the hilsa fishery some activities and management measures
are taken on the basis of this policy and other fishery regulations.
Restrictions on fishing gear
The Fish Act was declared in 1950. Under this act jatka catch was banned in
Bangladesh. The use of current jal (monofilament gillnet) under the size of 4.5 cm
mesh size was banned in 1988. In the artisanal hilsa fishery, the operation of gill nets
Page 22
Mome
UNU – Fisheries Training Programme 17
of less than 100 mm mesh size is legally prohibited, but fishermen are still using
smaller mesh sizes.
Restricting fishing time
In Bangladesh about 60-70% of hilsa are caught during the peak-breeding season and
almost 70% of them are sexually mature. For uninterrupted spawning, every year 15
to 24 October (peak spawning season) for ten days catch of brood hilsa has been
banned in all major spawning grounds.
Closed fishing area
To achieve the desired development of the hilsa fishery four sites in the coastal areas
of the country have been declared as hilsa sanctuaries under the „Protection and
Conservation of Fish Act 1950‟. In these four hilsa sanctuaries, all types of fish
catches have been banned during certain periods of time in every year. The ban period
of three sanctuaries is March to April and the other one is November to January.
Zone restriction
The Marine Fisheries Ordinance, 1983 made provisions for the management,
conservation and development of marine fisheries for water bodies with a depth in
excess of 50 metres. This is done to minimise or avoid potential conflict between
industrial vessels and artisanal fishers. Any body of water under 50 metres in depth is
reserved for small-scale fisheries. All trawlers are allowed to fish within the 200
nautical mile maritime boundary of Bangladesh. Each trawler must be granted sailing
permission from the Directorate of Fisheries for every voyage.
Regulation on fishing vessels
Mechanised boats have been brought under a licensing system in accordance with
Amendment 92 of the Marine Fisheries Ordinance, 1983. Since January 2000, all non-
mechanised boats have also been included under the licensing system. In the artisanal
hilsa fishery, all fishing vessels are subjected to registration fees which are paid when
vessels are commissioned for the first time and vessel and fishing licences are paid
annually. Registration fees are aimed to keep track of how many vessels enter the
industry and also to collect revenues, while licence fees are seen as a means to control
entry to some extent, keep track of how many vessels are actively engaged in fishing
activities each year and also as a way to collect revenue. In the case of the artisanal
fishery, the only way to control the vessels (mechanised and non-mechanised boats) is
through registration. Registration of the vessels is given by the Mercantile Marine
Department. This department also monitors these vessels during the fishing period. In
the artisanal gillnet hilsa fishery, every fishing unit needs to get a license after
registration, which is renewable each year. If there is failure to renew a license within
2 years of issuing the license, a new license has to be taken. Fishing vessels licence
rates vary with vessel size and engine capacity.
All those biological management measures alone are not able to predict the collapse
of fishery or to provide the optimum level of the fishery or even any indication about
the profit maximising level. Despite all the management measures which have been
Page 23
Mome
UNU – Fisheries Training Programme 18
put in place, fishing effort continues to increase and many more entrants demand to
join the fishery. Currently the fisheries authorities are not issuing new licences for
artisanal hilsa fishing; however, there is an increasing pressure from those who want
to join the fishery. The decision to stop issuing new licences for the hilsa fishery is
made due to concerns that the fishery is not sustainable. Therefore, now it is necessary
to assess the current status of hilsa and determine the policy that will maximise
economic benefits while ensuring sustainable development of the country‟s hilsa
resources.
3 MODELING
The purpose of fisheries management is to find ways to maximise the benefits from
the fish resources. Predictive models of the fishery are necessary for fisheries
administrators to foresee the evolution of the resource abundance and to predict their
response to fisheries management (Garcia and Le Reste 1981). Such models must
contain information on the biological processes of the resources as well as the socio-
economic processes associated with the utilisation of the resource. Therefore, they are
generally referred to as bio-economic models (Clark 1973). Availability of
information alone does not guarantee sound management unless the information is
prepared in a way that can be used in the decision making process. A bio-economic
model of the fishery organises the available information and thus helps to predict the
outcome of different management policies.
Bio-economic models generally consist of three main components: (i) the biological
part describing the dynamics of the resource stock, (ii) an economic part describing
the economic benefits and costs of harvesting and (iii) a link between the biological
and economic part describing how fisheries actions generate harvests (and thus
impinge upon the stock dynamics as well as the generation of benefits). Every
reasonable bio-economic model contains variables which can be directly controlled by
humans. Typically, these variables are fishing effort, harvests and investments in
fishing capital and so on. The manipulation of these variables constitutes a fisheries
policy. According to Padilla and Charles (1994) “the value of bio-economic
modelling can be judged both by its generation of useful „theoretical‟ insights into the
operation of fisheries systems, and by its application to real-world fisheries”. Also, “to
be truly useful, a bio-economic model must be „accessible‟ in that (a) its use must be
less demanding of detailed knowledge than its original creation, and (b) it should be
directly usable (or easily adapted) to analyse fisheries that differ in their
characteristics and their information availability from those for which the model was
developed”.
In this study, I develop a bio-economic model of the Bangladesh hilsa fishery to
explore the bio-economic implications of different utilisation policies. In particular I
will be most interested in policies which maximise the flow of economic benefits
from the resources. More precisely, I will use my bio-economic model to:
Calculate the optimal sustainable yield
Compare the current situation with optimal fishery
Devise a socially beneficial fisheries policy over time.
Page 24
Mome
UNU – Fisheries Training Programme 19
3.1 Choice of model
The level of sophistication of a bio-economic model is constrained by the amount of
data available. The level of sophistication desired depends on the intended use of the
model. In the case of the Bangladesh hilsa fishery, the availability of useable
information severely limits my ability to build a complicated model.
The key components of my bio-economical model are set out below: the model
consists of a biological part, a harvest function and a profit function. The last
component describes the economic benefits from fishing. The harvest function
constitutes the link between the economic and biological parts of the model. The
control variable, i.e. the item subject to fisheries management and policy is fishing
effort:
(1) ( ) ( , )dx
x G x Y e xdt
(Biomass
growth function)
(2) ( , )y Y e x (Harvesting function)
(3) ( , ) ( )p Y e x C e (Profit function)
Where x is the biomass change, G(x) is the biomass growth function, Y(e,x) is the
harvest function and C(e) the cost function. The variable x represents the stock size, y
the harvest, e fishing effort, profits (taken to be equivalent to social benefits) and p
landings price of fish.
There are two types of variables present in this model: endogenous variables and
exogenous variables. The main endogenous variables are x, y and , representing
biomass, harvest and profits respectively. These variables are determined within the
fishery. The main exogenous variables are landings price, which is determined by
market conditions outside the fishery, and fishing effort which is a control variable.
The bio-economic model we construct builds on this basic framework. However, as
will become apparent, the actual model will considerably extend the above
components of this basic framework, especially the biological part on which there is
most data. It will also, because of the nature of the data, move to a discrete time
presentation.
3.2 Biological part of the model
The biological part the model is based on the theoretical framework set out by
Beverton and Holt (1957). This framework is fundamentally cohort disaggregated and
dynamic. Since its inception, it has dominated fisheries population studies and is still
the main tool in practical fish stock research worldwide.
The key variables in the Beverton-Holt model are:
n(i,t): number of fish in cohort i at time t
m(i,t): natural mortality of fish in cohort i at time t
Page 25
Mome
UNU – Fisheries Training Programme 20
f(i,t): fishing mortality of fish in cohort i at time t
w(i,t): average weight of fish in cohort i at time t
ma(i,t): average maturity of fish in cohort i at time t
r(t): recruitment of the youngest cohort at time t
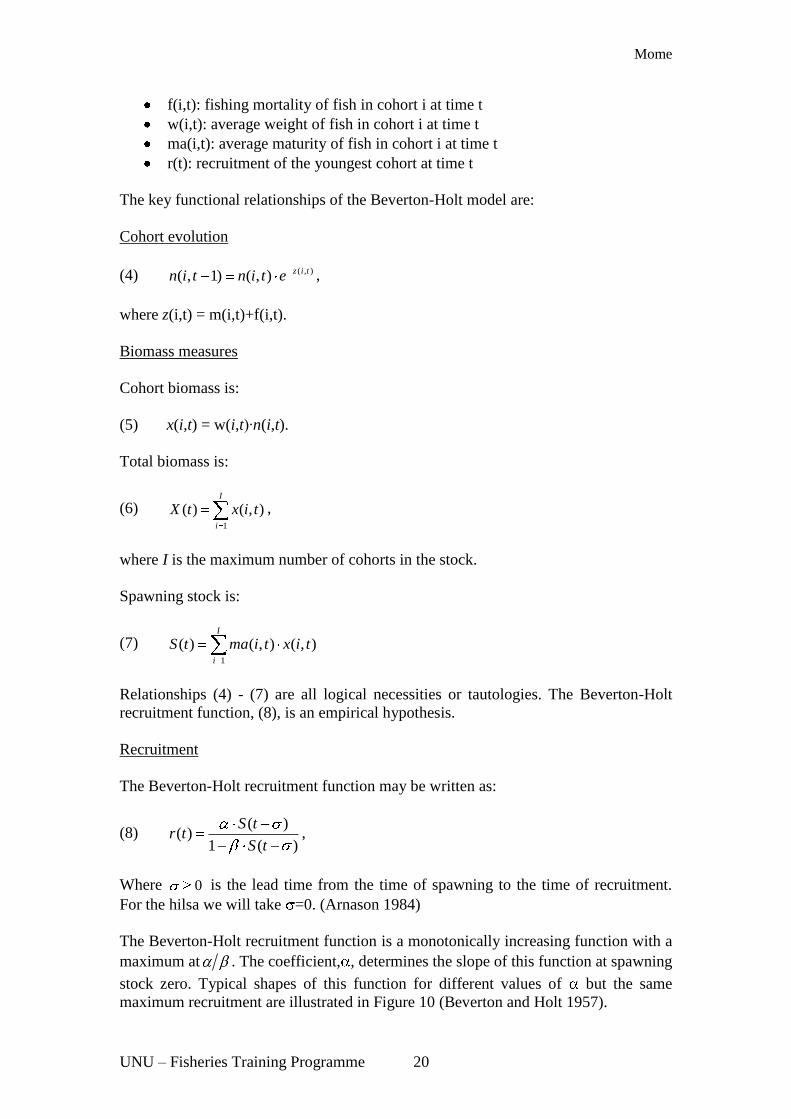
The key functional relationships of the Beverton-Holt model are:
Cohort evolution
(4) ( , )( , 1) ( , ) z i tn i t n i t e ,
where z(i,t) = m(i,t)+f(i,t).
Biomass measures
Cohort biomass is:
(5) x(i,t) = w(i,t)∙n(i,t).
Total biomass is:
(6) 1
( ) ( , )I
i
X t x i t ,
where I is the maximum number of cohorts in the stock.
Spawning stock is:
(7) 1
( ) ( , ) ( , )I
i
S t ma i t x i t
Relationships (4) - (7) are all logical necessities or tautologies. The Beverton-Holt
recruitment function, (8), is an empirical hypothesis.
Recruitment
The Beverton-Holt recruitment function may be written as:
(8) ( )
( )1 ( )
S tr t
S t,
Where 0 is the lead time from the time of spawning to the time of recruitment.
For the hilsa we will take =0. (Arnason 1984)
The Beverton-Holt recruitment function is a monotonically increasing function with a
maximum at . The coefficient, , determines the slope of this function at spawning
stock zero. Typical shapes of this function for different values of but the same
maximum recruitment are illustrated in Figure 10 (Beverton and Holt 1957).
Page 26
Mome
UNU – Fisheries Training Programme 21
Figure 11: Typical Beverton-Holt recruitment functions (King 1995)
3.3 Economical part of the model
The aggregate costs of fishing effort:
(9)
C(e) is the cost per effort, is the fixed cost and is the variable cost. For long
run calculation we assumed that will become variable so the long run cost
function would be:
(10) ( ) ( )C e fk vc e
The aggregate profits at time t are:
(11) ( ) ( ) ( ) ( )t p t y t C e
Here p(t) is the price of landings and y(t) the harvest both at time t. In the
empirical implementation of the model price may vary across cohorts.
3.4 The link between the biological and economic parts
Harvesting function
In this bio-economic model, the link between the biological and economic parts is the
harvesting function. According to Beverton and Holt (1957) derivations, this
harvesting function for a single cohort i over time period [t, t+1] is given by:
0 500 10000
2000
4000
Recruitment
Sp
awn
ing s
tock
Page 27
Mome
UNU – Fisheries Training Programme 22
(12) ( , ) ( , )( , ) ( , ) ( , ) (1 )
( , )
z i t f i ty i t w i t n i t e
z i t,
where w(i,t), m(i,t) and f(i,t) are averages over the fishing period.
The total harvest then is just the summation over all the cohorts as:
(13) 1
( ) ( , )I
i
Y t y i t
Fishing mortality depends on fishing effort and special measures to
protect young cohorts. We assume that fishing mortality for year class i at time t is a
linear function of fishing effort. In the base year, t*, we have a column in vector of
fishing mortality:
F = [ f(1,t*) , f(2,t*),….f(I,t*) ·········]
Therefore, fishing mortality for any cohort at any time t is:
(14) ( )
( , ) ( , *) ( , )( *)
e tf i t f i t pr i t
e t
Where pr(i,t) is the year class protection parameters. pr (i) [0,1] 0 means fully
protected and 1 means no protection.
4 DATA AND PARAMETER ESTIMATIONS
In order to carry out the study, it was necessary to estimate the parameters of the
model outlined above. For that various data are needed. The necessary data are of two
types, biological data and economic data.
More precisely, we need estimates of the following:
Variables and parameters Names of the
parameters
Biological
Maturity rates ma(i,t)
Numbers of fish in base year n(i,t*)
Average individual weights Natural mortality Fishing mortality in base year ( , *)f i t
Recruitment function parameters α , β
Economic
Fishing effort in base year Fixed costs
Page 28
Mome
UNU – Fisheries Training Programme 23
Variable costs Landings price P
In addition to this we need data on the life span of hilsa (to determine i). Obviously
also we need to decide on the time interval to use and the base year of the
calculations, t*.
4.1 Data sources
For estimating the current model secondary and tertiary data will be utilised. The
secondary data has been collected from the Fisheries Resources Survey System
(FRSS) and Fish Inspection and Quality Control (FIQC) section in Bangladesh and
tertiary data from different websites and from various working reports.
FRSS is an important section of the Department of Fisheries under the administrative
control of the Ministry of Fisheries and Livestock. In every district of Bangladesh
there is a government officer for data collection. Government officers go to fish
markets, ponds, lakes (haors, baors) and other water areas for collecting the data.
Every month, data are compiled and sent to the FRSS for final compilation. Every
year, DoF publishes the Fisheries Statistical Year Book with these data. FIQC is also
an important section of DoF. All export products are inspected by this section in
different ports (DoF 2005).
All biological data for this study were collected from “Aquatic Resource
Management, Development and Conservation Studies” (ARDMCS), GEF component
of the Fourth Fisheries Project (FFP) under the administration of the DoF (Halder
2004b).
4.2 Time unit and the base year
We opt to use half-years as our basic time unit. This is because the hilsa grow fast and
natural mortality is high. Therefore, added accuracy is obtained by using half years in
the calculations rather then whole years.
The year 2005-2006 is considered as the base year for this study. All the necessary
data have been collected for this year.
4.3 Biological data and parameters
Life span: Many biological studies have been done on hilsa fish. According to Halder
(2004), the maximum length, 58 cm, is attained at 6.5 years of age and indicates that
the hilsa are a moderately sized and moderately long-lived fish. But very few fish are
left in the stock of more than 4 years. So, for reasons of simplicity, we considered the
life span of hilsa to be 4 years with 8 cohorts in a population.
Maturity rates: The minimum size of maturing hilsa is reported to be 19 cm (Halder
2002). Thus, it may be said that hilsa mature at 1 year of age. As basic data for our
model it is considered that 1 cohort of hilsa is immature and 2 cohorts of hilsa is 80%
mature and the whole population of hilsa mature at age 1.
Page 29
Mome
UNU – Fisheries Training Programme 24
Numbers of fish in base year: Up-to-date data for the stock of hilsa in Bangladesh is
not available. Stock assessment of the hilsa fishery of Bangladesh was introduced in
1983 under the BOBP project; hilsa investigation in Bangladesh (Funded by UNDP
and FAO). Later on, the initiative was continued by BFRI until 2000. Under the
ARDMCS, GEF component a two-year (2002 and 2003) study was conducted to
continue the previous initiatives. (Halder 2004b).
For this study, we estimate the number of fish (n) of different year class (i) at time (t)
in the total fish population of hilsa. This estimation is done by the constructed simple
hilsa model.
We assumed the model by using the number of fish that will give us an idea about the
stock of hilsa. Furthermore, we assumed that landing and biomass in 2005 has been
represented as equilibrium ( x = 0). After that we use the model to calculate the
corresponding number of fish by cohorts. Of course these are not the true numbers but
make a good and possibly best guess.
Table 4: Estimated results for the number of fish at time t Year Number of fish (i) (million)
1 2 3 4 5 6 7 8
2005 24.928 456,6 88,6 17,2 3,3 0,6 0,1 0,0
Average individual weight: Age determination of hilsa from their hard parts (scales,
otoliths) is not yet developed and adopted in Bangladesh (Halder 2004b) and hence
the age of hilsa was determined by inverse von Bertalanffy,s growth equation.
The von Bertalanffy,s equation, in terms of length-frequency, is:
Lt = L∞ (1 – exp [-K (t-t )])
Where Lt is the length at age t, L∞ is the asymptotic length, and K is a growth
coefficient.
As per von Bertalanffy,s growth equation hilsa attains 25-30 cm size at one year of
age. According to Haldar (2005), the age-length relationship of hilsa is shown in
Table 5. For this study we calculate individual weight, by using the Le Cren
(1951) equation.
The formula is as follows:
W= a Lb
Where “a” is a constant and “b” is an exponent, its value is a = 0,01351 and b = 2,974.
Table 5: Relations of individual age, length and weight of hilsa (BFRI 2000). Age(year) Length(cm) Weight(gm)
0.5 15-16 0,051
1.0 27-28 0,272
1.5 36-37 0,623
2.0 42-43 0,974
2.5 47-48 1,351
Page 30
Mome
UNU – Fisheries Training Programme 25
3.0 51-52 1,714
3.5 53-54 1,918
4.0 54-55 2,137
4.5 55-56 2,144
5.0 56-56,5 2,194
5.5 56,5-57 2,252
6.0 57-57,25 2,282
6.5 57,25-58 2,372
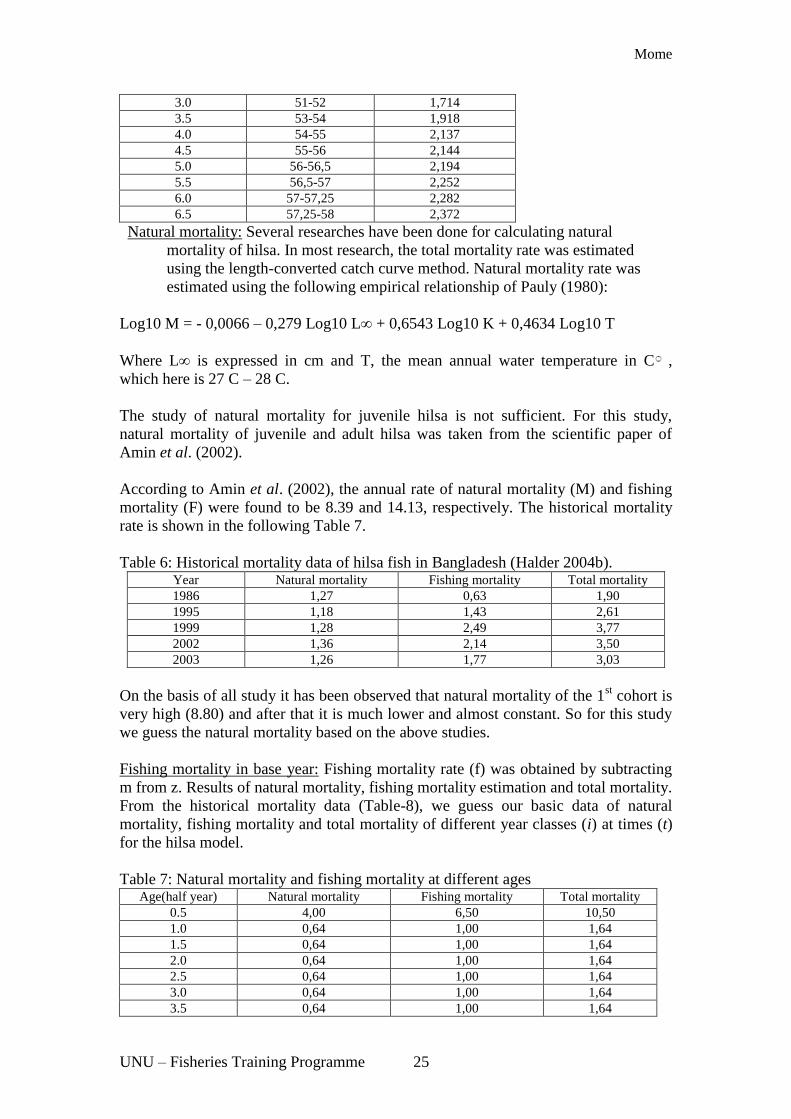
Natural mortality: Several researches have been done for calculating natural
mortality of hilsa. In most research, the total mortality rate was estimated
using the length-converted catch curve method. Natural mortality rate was
estimated using the following empirical relationship of Pauly (1980):
Log10 M = - 0,0066 – 0,279 Log10 L∞ + 0,6543 Log10 K + 0,4634 Log10 T
Where L∞ is expressed in cm and T, the mean annual water temperature in C ,
which here is 27 C – 28 C.
The study of natural mortality for juvenile hilsa is not sufficient. For this study,
natural mortality of juvenile and adult hilsa was taken from the scientific paper of
Amin et al. (2002).
According to Amin et al. (2002), the annual rate of natural mortality (M) and fishing
mortality (F) were found to be 8.39 and 14.13, respectively. The historical mortality
rate is shown in the following Table 7.
Table 6: Historical mortality data of hilsa fish in Bangladesh (Halder 2004b). Year Natural mortality Fishing mortality Total mortality
1986 1,27 0,63 1,90
1995 1,18 1,43 2,61
1999 1,28 2,49 3,77
2002 1,36 2,14 3,50
2003 1,26 1,77 3,03
On the basis of all study it has been observed that natural mortality of the 1st cohort is
very high (8.80) and after that it is much lower and almost constant. So for this study
we guess the natural mortality based on the above studies.
Fishing mortality in base year: Fishing mortality rate (f) was obtained by subtracting
m from z. Results of natural mortality, fishing mortality estimation and total mortality.
From the historical mortality data (Table-8), we guess our basic data of natural
mortality, fishing mortality and total mortality of different year classes (i) at times (t)
for the hilsa model.
Table 7: Natural mortality and fishing mortality at different ages Age(half year) Natural mortality Fishing mortality Total mortality
0.5 4,00 6,50 10,50
1.0 0,64 1,00 1,64
1.5 0,64 1,00 1,64
2.0 0,64 1,00 1,64
2.5 0,64 1,00 1,64
3.0 0,64 1,00 1,64
3.5 0,64 1,00 1,64
Page 31
Mome
UNU – Fisheries Training Programme 26
4.0 0,64 1,00 1,64
Note: All mortality rates indicate half years.
Spawning parameters, α and β:
The spawning parameters are determined so as to replicate as closely as possible the
available data of the fishery, especially harvest rates, and available estimates of stock
size. This, while somewhat adhoc, is equivalent to a simple minded maximise
likelihood procedure.
These assumptions are:
α = 390
β = 0,01
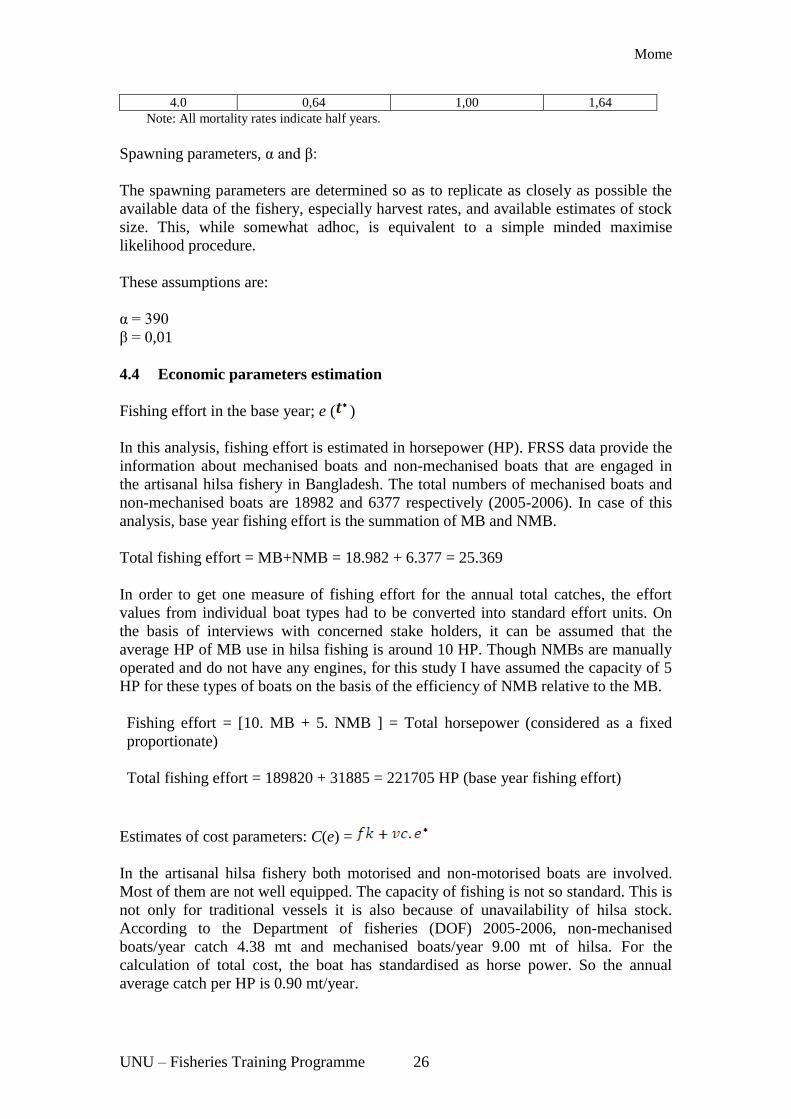
4.4 Economic parameters estimation
Fishing effort in the base year; e ( )
In this analysis, fishing effort is estimated in horsepower (HP). FRSS data provide the
information about mechanised boats and non-mechanised boats that are engaged in
the artisanal hilsa fishery in Bangladesh. The total numbers of mechanised boats and
non-mechanised boats are 18982 and 6377 respectively (2005-2006). In case of this
analysis, base year fishing effort is the summation of MB and NMB.
Total fishing effort = MB+NMB = 18.982 + 6.377 = 25.369
In order to get one measure of fishing effort for the annual total catches, the effort
values from individual boat types had to be converted into standard effort units. On
the basis of interviews with concerned stake holders, it can be assumed that the
average HP of MB use in hilsa fishing is around 10 HP. Though NMBs are manually
operated and do not have any engines, for this study I have assumed the capacity of 5
HP for these types of boats on the basis of the efficiency of NMB relative to the MB.
Fishing effort = [10. MB + 5. NMB ] = Total horsepower (considered as a fixed
proportionate)
Total fishing effort = 189820 + 31885 = 221705 HP (base year fishing effort)
Estimates of cost parameters: C(e) =
In the artisanal hilsa fishery both motorised and non-motorised boats are involved.
Most of them are not well equipped. The capacity of fishing is not so standard. This is
not only for traditional vessels it is also because of unavailability of hilsa stock.
According to the Department of fisheries (DOF) 2005-2006, non-mechanised
boats/year catch 4.38 mt and mechanised boats/year 9.00 mt of hilsa. For the
calculation of total cost, the boat has standardised as horse power. So the annual
average catch per HP is 0.90 mt/year.
Page 32
Mome
UNU – Fisheries Training Programme 27
A new boat fully equipped costs 1.500.000 Tk. The cost of boat and engine
(Tk.1.340.000 and 160.000) includes cost price, sales tax or customs duty, and
installation charge. The working life of the boat varies between 8-10 years and engine
6-8 years. Every day the fishing time is around 16 hrs. The fishing boats consumed 1
litre of diesel for every 2 hrs running. Average diesel required for each trip is around
24 litres per day.
The number of fishing days, for both motorised and non-motorised crafts has been
about 288 days per year (about 24 days per month). Sometimes fishermen can not
harvest because of bad weather. In case of calculation of fishing days, it is considered
an average of 275 days per year. The number of labours are the same in mechanised
and non-mechanised boats. There are 10 crew/fishermen in each boat. For wages of
labour, a share system has been calculated for both motorised and non-motorised
boats.
Table 8: Cost calculation for non-mechanised and mechanised boats per year hilsa
catch (in year 2005-2006). Item of cost (Tk) Non-mechanised boats Mechanised boat
1. Investment cost
Price of boat 500.000 1.000.000
Price of engine - 200.000
Price of net 50.000 70.000
Total investment cost 550.000 1.270.000
2. Operation cost
Fuel and oil (24 liter/days/35Tk) - 231.000 (275 days)
Food (80 Tk/day/man) 220.000 (10 person) 220.000 (10 person)
Crew share:
(Gross earning- food)*0.5 174.700
(Gross earning-food-fuel)*0.375 269.625
Gear repair/replacement 25.000 30.000
Engine repair 80.000
Hull repair 10.000 20.000
Total 439.700 850.625
3. Depreciation cost
Hull (10 years) 50.000 100.000
Engine (8 years) 25.000
Total cost (Tk) 489.700 975.625
From the total cost we need to separate the fixed cost and the variable cost.
Non-mechanised boat = Depreciation cost of hall and hall repair cost is considered as
a fixed cost (50.000 + 10,000= 60.000 Tk)
Mechanised boat = Depreciation cost of hall, engine and hall repair cost is considered
as fixed cost (100.000+25.000+20.000 =145.000 Tk)
Wages of boat owner
Generally in Bangladesh the boat owner plays a vital role in managing the boat. In
most of the cases they also involve themselves in managing fishing. They actively
participate in the maintenance of the boat, monitor the accounts alone, and deal with
fishermen for all rental issues, paying the government fees and performing in all other
official jobs. If the work of the boat owner might have been done by others, some cost
Page 33
Mome
UNU – Fisheries Training Programme 28
would occur. We assume a salary for the job of a boat owner is US $2.000 (as
National Pay Scale, 2005) per year for 25.369 boats. From this number we can derive
the calculation for wages of the boat owner for six months. The wages is US $114 per
HP regarding the fishing fleet (total HP 221.705) for six months. Since the boat owner
does not claim for extra hours, the cost represented here is definitely a fixed cost. This
fixed cost is added separately with the total cost as fixed cost.
Cost function C(e) = fk + vc · e
For long run calculation we assumed that fk would become variable because we
cannot reduce the fleet with effort, so the long run total cost is calculated by:
TC = (fk + vc)·e
In this study for determining the adjustment path we calculated fk by the following
formula:
fk (t)= e(t) · fk + a. (e(t) · fk - fk(t-1)
Where a is the adjustment parameter. This means that fixed costs are gradually
adjusted to reduce the effort with the speed of adjustment depend on. If a=1 this
means no adjustment and if a=0 immediate adjustment.
Result of cost parameter estimation:
Total HP for hilsa fishing per year = 221.705 HP
Total fixed cost of non-mechanised boat = 60.000*6377 = 382,62 million Tk
Total variable cost of non-mechanised boat = 429.700*6.377= 2.740,2 million Tk
Total fixed cost of mechanised boat =145.000*18.982 = 2.752,39 million Tk
Total variable cost of mechanised boat = 830.625*18.982 = 15.766,92 million Tk
Total fixed cost= (NMB+MB) = 382,62+2.752,39 = 3.135,01 million Tk
Total variable cost = (NMB+MB) =2740.2 +15766.92= 18507.12 million Tk.
Annual fixed cost per HP = 14.140 Tk (US $208)
Annual fixed cost for wages of boat owner per HP = 15.562 Tk (US $228)
Annual variable cost per HP= 83.476 Tk (US $1.228)
Price of hilsa at base year, P( )
Page 34
Mome
UNU – Fisheries Training Programme 29
According to the Halder 2002 the landing price of hilsa has increased about 7 times
from the year 1985. In 1985 the price of hilsa was 20Tk/kg and 130Tk/kg (US $2 /kg)
in 2005-06. (68 Tk = US $1).
For the present study, the weight of fish is shown in metric tons (1 MT= 1000 kg).
The landing price shown is only for hilsa of above 6 months. The price of small fish is
low considered to big fish. The price of hilsa is US $2 where as jatka (1st cohort) is
US $1.
Price of jatka = 1 MT jatka price is 65.000 Tk (US $956).
Price of hilsa = 1 MT hilsa price is 130.000 Tk (US $1912).
5 NUMERICAL ANALYSIS AND RESULTS
In this section we use the hilsa bio-economic model developed in the previous section
to identify optimal fisheries policies. First we work out the optimal (profit
maximising) sustainable policy and compare it with the current state of the fishery.
Then we try to determine an economically efficient adjustment path of the fishery
from its current position to the optimal sustainable one. We work out two paths of this
kind. One of them simply tries to maximise the present value of economic returns
from the fishery. This path is quite dramatic in terms of shifts in fishing effort and
harvests. The other path is moderate in the sense that it adjusts fishing effort and
catches relatively moderately each year until the optimal sustainable levels are
attained.
5.1 Optimum sustainable yield (OSY) for the hilsa fishery in Bangladesh
The sustainable fishery is a steady state or equilibrium stage of any fishery. The
optimum means maximisation of the total sustainable output from the fishery.
According to King (1995), optimum sustainable yield refers to “a level of yield
consistent with the biological capacity of the stock (therefore usually less than MSY),
which takes into account economic, sociological and environmental factors”.
Applying this model, we have calculated the optimum sustainable yield of the hilsa
fishery. In this optimum yield level, the corresponding harvest is 94,7 thousand mt
and the optimum sustainable fishing effort occurs at 0,33 effort level (73.163 HP). It
is important to notice that it is less than the maximum sustainable effort level. This
catch is lower than the current effort level but not so much. At the same effort level
our spawning stock and total hilsa stock (age< 6 months) will be higher than the
current situation as 417 thousand mt and 448 thousand mt respectively. At this effort
level hilsa stock will be stable up to a long period of time and harvest will also be
steady. We can call this yield level optimum sustainable yield of the hilsa fishery.
Calculated total harvest of OSY is less than maximum sustainable yield. Sustainable
yield is shown in the following Figure 12.
Page 35
Mome
UNU – Fisheries Training Programme 30
Figure 12: Sustainable yield of the hilsa fishery (per ½ year)
In the above figure e* is the OSY effort level and e is the current effort level. For all
calculations the effort level 1 indicates the total number (100%) of fishing vessels as
well as horse power. This above figure shows a sustainable yield curve for a six
month harvest. The following figure can express the full years sustainable yield more
precisely.
Figure 13: Sustainable yield of the hilsa fishery (per year)
From the above figure (Figure 13) the effort level of maximum sustainable yield
(MSY) is 0.6. The current effort level is far from the MSY effort level. The MSY
effort level is 40% less than the current effort level. According to the model
calculation MSY is 211 thousand mt whereas current harvesting is 199 thousand mt
which is very close to MSY. This situation indicates an over-fishing condition of the
hilsa stock. So, immediate steps should be taken to control the present level of fishing
pressure.
The main purpose of OSY calculation is to find a sustainable policy for hilsa fishery
management. The main management objectives are to maximise the economic benefit,
Page 36
Mome
UNU – Fisheries Training Programme 31
maximise the sustainable harvest, sustainable revenue and cost of the hilsa fishery that
is calculated after running the model. The sustainable hilsa fishery is shown in Figure
14.
Figure 14: The sustainable hilsa fishery (per ½ year)
The revenue, profit and cost curves are depicted in Figure14. Here e* is expressed as
the optimum effort level for maximising the profits of the hilsa fishery. And e is
expressed as current effort level where the hilsa fishery is close to equilibrium point.
In this diagram profits are defined as the difference between revenues and costs. In
terms of the sustainable fisheries diagram, this occurs where the distance between the
revenue curve and the cost curve is greatest.
According to the calculation, OSY level of the hilsa fishery in Bangladesh is 94.7
thousand mt and its value is US $189 million for 6 months. From that level of effort
the profit will be maximised at up to US $128,5 million also for 6 months. This
sustainable resource and economic growth can only be possible when the fishery is
properly organised to provide for sustainable growth and maximising economic
benefit. One way of achieving this is through managing the fishery at a level where a
sustainable level and maximum economic benefit can be obtained. For this purpose
we need to find the dynamic path of fishing efforts over time to bring the fishery to an
equilibrium point.
5.2 Compare with the current situation
Without proper management policy, the hilsa fishery is generally not expected to
make profits even if the fishermen act rationally. Since the net present value of the
fishery is small, its contribution to economic growth will be small as well. In base
year (2005) total harvested hilsa was 198 thousand mt at current effort level (221.705
HP) and its value was US $190,6 million. But in our study we consider half of the
year for all calculation. So at the current effort level our half year harvesting was 99.3
thousand mt. Applying this total harvesting in our model at the same effort level, we
Page 37
Mome
UNU – Fisheries Training Programme 32
got the current situation of the hilsa fishery. At the current situation the spawning
stock and total hilsa stock (age < 6 month) are 177 thousand mt and 202 thousand mt
respectively. According to Figure 14, fishing cost is relatively high (US $184,7
million) and the distance between revenues and costs is low and its value is US $13.8
million. This outcome should be compared to the maximum attainable profits at the
optimal effort level, e*. Clearly, at this level of effort substantial economic profits are
generated. The current situation of the hilsa fishery is very close to “0” profit level
(competitive equilibrium point). That means this fishery makes little profit. Not only
this, the current harvesting is very close to the maximum sustainable yield (MSY)
level. If fishing effort expands like previous years, it will eventually lead to zero profit
in the industry. So the present situation of the hilsa fishery wastes these rents by
applying too much fishing effort.
In an open access fishery or where there is no fisheries management, individualistic
competition may run down the stock causing the fishery to collapse. The current
situation of the hilsa fishery is very close to open access. If the fishermen act more
irrationally by tending to expect profits then the hilsa fishery may lead to resource
collapse with the consequence of economic losses which will also lead to no profits in
the long run. This may have a negative effect not only on the hilsa industry but also
on other supporting industries and may cause large economic losses for the nation as a
whole.
Table 9: Numerical comparison between the optimum situation and current situation
(6 months).
Hilsa
fishery
Fishing
effort
(HP)
Spawning
stock
(1000 mt.)
Total hilsa
stock
(age>6 m)
Total harvest
(1000 mt)
Revenues
(million
US$)
Costs
(million
US$)
Profits
(million
US$)
Optimal
fishery 0,33 417 448 95 189 61 129
Current
fishery 1 177 202 99 199 185 14
5.3 Dynamic adjustment path of hilsa fishery
Once being defined, the optimal sustainable position of the fishery takes place the
design of the dynamic adjustment path towards it. While running the model, we may
select a path of fishing vessels that may generate fisheries outcomes (biomass, harvest
and profits) over time. The objective of the study is to find an appropriate policy for
the recovery of the hilsa fishery. For this the selection of a dynamic adjustment path is
required. The path for the number of fishing vessels horse power will maximise the
economic return from the fishery measured as present value of profits. This
incidentally leads to a comparatively large and sustainable biomass. It also maximises
the contribution of the hilsa fishery to the GDP and can explore better opportunities of
employment for the country.
In the dynamic context the appropriate fisheries objective is to maximise the present
value of profits from the fishery forever. Invariably, this implies choosing a time path
Page 38
Mome
UNU – Fisheries Training Programme 33
for the available fisheries controls, e.g. fishing effort or harvest, so as to bring the
fishery on to an optimal evolutionary path. In our simple hilsa fishery model we can
describe the optimal time paths of fishing effort.
The dynamic adjustment path of the hilsa fishery can be done in two ways: present
value (PV) of profits maximising path and a more moderates path. Both the paths are
described in the following sections.
5.3.1 Present value (PV) or profit maximising path
The key finding of this exercise illustrates that the number of horse power as well as
fishing vessels should be drastically reduced from the current number. This will build
up the biomass and also generate substantial profits in the fishery. The PV or profit
maximising policy for the hilsa fishery is to reduce fishing effort from the current
level of 221.705 HP (25.369 vessels) to 73.163 HP (8372 vessels). This reduction of
fishing effort has to be done drastically. It has to be done in five steps and every step
will be taken every six months. In this path first six months is our control period.
During this period, the first half of the first year we totally cut the fishing effort at 0
effort level. Then from 0 effort level we shall gradually increase the effort level every
half year. For the second six months the effort level will be increased up to 0,10, for
the third six months to 0,20, the fourth six months to 0,30 and finally in the fifth six
months to 0,33 which means the optimal level. The main outcome of this policy is
founded in the PV of profit maximising path as shown in the following figures (Figure
15, Figure 16, Figure 17, Figure 18) and detailed numerical outcomes are shown in
Appendix 4 for every six months.
Figure 15: The fishing effort during the PV maximising path for six months.
Page 39
Mome
UNU – Fisheries Training Programme 34
Figure 16: Response of hilsa stock to fishing effort during the PV of profit
maximising path for six months.
Figure 17: Status of harvest during the PV of profits maximising path for six months
Page 40
Mome
UNU – Fisheries Training Programme 35
Figure 18: Profit of the hilsa fishery during the PV of profits maximising path for six
months
Although the long term harvest rate corresponding to this policy is slightly less than
the current level, but the stock of hilsa fish will increase significantly. After the
control period the gradual increase of fishing fleets compared to the long run level is
to hasten the build up of the hilsa stock (age<6 months) to the long run rent
maximising level of around 448 thousand mt compared to the initial level of 194
thousand mt. Within two and half years we will reach to the optimum sustainable
fishing effort level as well as the equilibrium hilsa fishery. Within this adjustment
period the first six month harvest will be relatively lower and some losses will occur
because of fixed cost. By adjusting this fishing effort drastically, the long run net
present value of the hilsa fishery will be increased significantly. The present value of
this dynamic path is found to be US $3.960 million which brings maximum economic
benefits.
5.3.2 A moderate path
The moderate dynamic path for the hilsa fishery is to reduce fishing effort from the
current level gradually and smoothly down to the 0,33 level for long run equilibrium
of the fishery. In this path the current effort level of 221.705 HP (25.369 vessels) has
been reduced to 73.163 HP (8.372 vessels). This reduction has been done in seven
steps over a period of three and half years. The first six months of this policy cut the
effort of 199,535 HP and then gradually to 177.364 HP, 155.194 HP, 133.023 HP,
110.853 HP, 88.682 HP and finally 73.163 HP which is the estimated optimum level
of fishing effort. The main outcome of this policy is illustrated in the moderate path
shown in the following figures (Figures 19, 20, 21 and 22) and detailed numerical
outcomes half year by half year are shown in Appendix 5.
Page 41
Mome
UNU – Fisheries Training Programme 36
Figure 19: The fishing effort during the moderate path.
Figure 20: Response of the hilsa stock to fishing effort during the moderate path.
Page 42
Mome
UNU – Fisheries Training Programme 37
Figure 21: Status of harvest during the moderate path for six months.
Figure 22: Profit of the hilsa fishery during the moderate path for six months.
The gradual reduction of fishing fleets compared to the long run level is to hasten the
build up of the hilsa stock (age<6 months) to the long run economic benefit
maximising level of around 448 thousand mt in comparison with the initial level of
194 thousand mt. This increased biomass level will ensure the sustainability of the
hilsa fishery. It is observed that by applying this policy the hilsa stock is expected to
fluctuate at a low scale along the path toward the long run optimal equilibrium. Under
this policy the harvest is also gradually reduced and expected to be 95 thousand mt
per six months at a long run optimal equilibrium due to adjusting the fishing fleet.
This hilsa recovery policy of gradually reducing fishing effort could also be expected
to improve economic benefits from the fishery. These economic benefits will oscillate
at a low magnitude and reach an equilibrium state at US $128 million. This policy
will also create a long-term net present value of US $3.650 million.
Page 43
Mome
UNU – Fisheries Training Programme 38
Summary of two dynamic paths
Present value maximising path A moderate path
Drastic reduction of fishing effort Gradual reduction of fishing effort
It has to be done in 5 steps and each step takes
6 months
It has to be done in 7 steps and each step
takes 6 months
1st step our control period (no fishing) This path does not have a control period
From the second 6 months we introduce
fishing boats in the fishery
First 6 months 10% effort decrease from the
current effort level
Second 6 months 2.537, third 6 months 5.077,
fourth 6 months 7.611, finally 8.372 boats
(optimum number) will operate in the fishery.
Then gradually reduce 20%, 30%, 40%,
50%, 60% and finally 66% (optimal level).
At the beginning the policy will give us a loss
because of fixed costs.
At the beginning of the policy it will give
some profit.
In the control period harvest will be “0” then
very slowly go up.
Not much change in harvest during the path.
In this path within 12 years the fishery will
reach the sustainable equilibrium level
In this path within 15 years the fishery will
reach the sustainable equilibrium level
Net present value – US $3.960 million Net present value – US $3.650 million
This path is economically superior to the
moderate path.
Moderate path is more reasonable for the
fishermen as well as society.
5.4 Discussion
According to the above results, the current hilsa fishery suffers greatly from excessive
fishing effort and, consequently, overexploited stocks and much reduced flow of net
economic benefits. This is not surprising. The hilsa fishery is essentially an open
access, common pool fishery. Moreover, it is a well-established mature fishery. Both
theory and the experience from numerous real fisheries have established that such
fisheries invariably exhibit these features. The only real question in particular cases is
the extent of the economic inefficiency and stock over-utilisation.
The model calculations indicate that the optimal equilibrium fishing effort for hilsa is
only about one-third of the current fishing effort. This corresponds to a reduction in
the number of fishing boats from about 25.000 to 8.400. Moreover, in sustainable
equilibrium, all jatka fishing (first half year cohort) should be ended. According to the
calculations; if this is not done, the fishery is in serious danger of collapse.
At the optimal sustainable equilibrium, fishing effort the calculations suggest that the
total stock of hilsa is more than doubled. The spawning stock increases even more. At
the same time the harvest rate is about the same, so downstream activities in the hilsa
industry, landings, processing, trading, transportation etc. is largely unchanged. In fact
the above calculations ignore the possibility of increased unit prices of hilsa due to
higher average landing sizes and therefore prices and wider distribution of landings as
the stock extends its range. Most importantly, however, according to the above, the
net economic benefits derived from the hilsa fishery will greatly increase from
virtually zero to over US $260 million per year. This gain, annually on a sustainable
basis, can, if properly used, go a long way towards permanently improving the
economic and social situation of the fishing communities.
Page 44
Mome
UNU – Fisheries Training Programme 39
The model shows that the average annual production of hilsa is 198 thousands mt and
the estimated MSY is 210 thousand mt. The current effort level is 33% higher than the
MSY effort level. The OSY (optimal sustainable yield) effort level is less than the
MSY level and the sustainability of any fishery occurring at this level. From an
economic point of view, MSY doesn‟t imply efficient harvesting relating efficiency to
maximise the net benefit from the use of economic resources, i.e. maximising the
resource rent (Hartwick and Olwiler 1998). Resource benefit is maximised at a lower
level of effort, OSY level (Figure 14).
To move from the current hilsa exploitation level to the long run optimal takes time.
Initially, in order to rebuild the hilsa stock, harvest rates will have to be reduced.
Dynamic adjustment paths which maximise the present value of economic benefits
over time involve quite drastic reductions in fishing effort and harvests during the first
two to three and a half years. However, as demonstrated above, it is possible to define
more moderate adjustment paths which maintain fairly high catch levels every year
while attaining the long run OSY within a reasonable time (i.e. 10 years) and without
much loss in the present value of economic benefits (perhaps 10%). Such paths may
well be socially more acceptable and, therefore, feasible.
Limitations of the study
The simple hilsa model that we have built and used for this study is not a true
model. It is a supplementary model. This model only considers fishing effort
as a factor influencing the hilsa catch. Other determinants of fish catch such as
annual changes in weather were excluded. In the future it is necessary to study
other factors influencing fishing. Besides this, the model developed here can
later be extended and refined by more reliable data.
It must be pointed out that much of the data used in the model can cause data
error. These assumed data and parameters might reflect a false result creating a
great concern for the reliability and accuracy of the data. For future study the
emphasis should be given to get the real data in a uniform way.
The benefits and findings of the study will not be static forever. It is not
reliable in the course of time as there is a possibility of change in the
biological and ecological conditions of hilsa. If such change occurs the
outcome will not be reliable. This is the uncertainty of the policy.
The fishing effort levels and profits generated by the study depend to a large
extent on the price of fish and cost of fishing assumed in the analysis. Any fall
in price or an increased cost of effort, for instance, may substantially reduce
the value of estimated profits. Vice versa the same thing will happen.
Similarly the possibility of cost reduction is less rather it will increase. In the
future, study that will produce accurate and variable fish and effort prices will
be helpful.
Although, the model used here is quite simple and the estimates of the empirical
parameters in many respects are not particularly reliable, the overall tenor of these
outcomes is quite believable. Because the hilsa fishery is open access, common pool
character with over crowding fishing efforts is similar to other artisanal fisheries.
Page 45
Mome
UNU – Fisheries Training Programme 40
Benefits from the policy implementation
We assume that the model we used to construct the dynamic path is true. The policy
which is created through model simulation is implemented in the hilsa fishery, we will
get social and economic benefits. The impact of optimum sustainable yield and
corresponding dynamic paths with maximising the present value of profits of the hilsa
fishery can be described as follows:
Economic benefit: By reducing the fishing effort by two third (66%), we will gain 258
million US$ annually. This profit is nine times higher than the base year (US $28
million). The policy of reducing the fishing effort is not only expected to improve
profits of the fishery but also to create a long run net present value of US $3.959
million. The expected net present value can be used by the government or by fishing
companies as collateral for loans to meet difficulties during the period of stock
rebuilding and to fund investment opportunities. The government can utilise the
excess profit for funding management activities such as data collection and storage,
management and dissemination, research activities, monitoring, control and
surveillance, extension, awareness, quality control and others. The profit can also
contribute to the national coffers and social development activities. Giving 8.372 boat
owners‟ registration (license) or individual quotas through their vessel of 12 mt per
half year may encourage some companies to invest in processing factories to process
hilsa and increase value added to the product for a higher price in the international
market or even the local market. Processing companies will create more employment
for the community. The labourers who are unemployed by cutting fishing effort can
be re-absorbed in the fish processing factories. Thus, economically, there is no net
loss to the community and fishing industry. Overall, this policy will stimulate fast
development of the fishery. Hence, social welfare and development of the hilsa and
jatka fishers‟ community will be established.
Control the over-fishing of hilsa: A fishery is not sustainable if total catch exceeds the
MSY level. In this study the current effort level is 33% higher than the MSY effort
level. In the base year, the average catch of hilsa was 198 thousand mt and estimated
MSY was 210 thousand mt (Figure 12b) which indicates over-fishing of the fishery.
By reducing effort level to the OSY point, the fishery will be sustainable for the long
run. Thus control of over-fishing could be possible.
Increase of CPUE: According to the previous description, the hilsa fishery has
suffered by serious declining of CPUE in both river and marine sectors. The base year
CPUE was around 8 mt per year. By implementing this policy, the CPUE will
significantly increase. CPUE at OSY effort level will be 23 mt per year.
Employment impacts of effort reduction: A reduction in fishing effort to attain OSY
will raise productivity of the hilsa fishery. On the other hand, it will also result in the
unemployment of fishermen. In view of the social and equity considerations people
need to be accommodated within the fishing sector. However, withdrawing fishing
would mean a reduction in costs as well as an increase in the resource rent, which
could be used to compensate the unemployed fishing people. Furthermore,
diversification of skills could be done to make them more suitable for non-fishing
sectors.
Page 46
Mome
UNU – Fisheries Training Programme 41
Rehabilitation of fishermen: Through implementation of the policy, the sustainable
hilsa fishery will be making a good profit. But at the same time many fishermen will
be out of work. We calculated that 253.690 fishermen employed in 25.369 fishing
vessels at the present time. When we will reduce the fishing effort to 8.372 vessels, a
number of 169.970 fishermen will lose their jobs. With this excess profit, it can be
easy to rehabilitate the jobless fishermen. According to the optimum sustainable hilsa
fishery, the profit will be US $129 million per year. If the average income of hilsa and
jatka fishermen was US $800, we can easily rehabilitate 161.250 fishermen within
this sector by creating other alternative jobs.
Utilisation of fishing vessels: A comprehensive plan must be chalked out to make the
best use of vessels which will be banned. It can be organised in different ways. A
major portion of vessels should be utilised for carrying people and seasonal goods
from one place to another. A good number of these vessels must be utilised for
tourism. And also some of these vessels should be utilised for research and education.
We should always consider keeping people of fisheries in the relevant field. To
employ them in the same field will help the industry grow bigger than before
exploring many more opportunities for the economy of the country.
6 SUMMARY AND POLICY RECOMENDATIONS
The Government of People‟s Republic of Bangladesh has taken very effective action
plans to stop catch of jatka. But no real effort until now has taken place to reduce the
continuous rise in fishing effort. If the number of fishing boats increases as the
population grows at an alarming rate, it appears that the biomass will also fall. In the
artisanal gill net fishery (hilsa fishery), the major concern is the presence of an
oversized effort capacity. Given that effort could be reduced to economically efficient
levels (represented by the results of the base model) the existing marine hilsa fishery
is capable of generating substantial net present value of economic benefits.
The purpose of this study is to assess the artisanal hilsa fishery of Bangladesh and
determine an effective policy that will maximise economic benefits while ensuring the
sustainability of the fishery. The bio-economic model developed here shows that the
fishing effort required to make the hilsa fishery attain maximum economic benefit and
ensure sustainable biomass growth is 73.163 (HP) standard units (8.372 vessels) and
also compare it to the current state of the fishery. For this purpose we determined an
economically efficient dynamic adjustment path of the fishery. Dynamic adjustment
path which maximises the present value of economic benefits is US $3.960 million
which over time involves quite drastic reductions in fishing effort and harvests during
two and half years. On the other hand, a moderate adjustment path maintains
reasonably high catch levels every year while attaining the long run OSY without
much loss in the present value of economic benefits. It indicates that the best fishery
policy is to reduce the current fishing effort of 25.369 vessels to 8.372 fishing vessels.
For the Fisheries Division to achieve its objective, the policy of reducing 16.997
fishing vessel (148.542 HP) from the current 25.369 (221.705 HP) vessels is the best
policy for ensuring good biomass growth and maximise the profits.
However, as discussed above the reduction of fishing effort by reducing fishing
vessels in most cases does not keep effort down due to inherent behavior of fishers to
Page 47
Mome
UNU – Fisheries Training Programme 42
invest more and more in technology to elude regulations to reduce effort. This policy
must, therefore, be supported by other measures to ensure that effort reduction does
not translate into increased competition among the remaining vessels.
While effort reduction should be a primary goal in the artisanal fisheries, the impact
of such reduction in terms of equity is important. That is, there should be a strong
balance between efficiency and equity objectives. An isolated policy to simply lower
effort will likely to be more difficult to implement because artisanal fishing is largely
subsistence in nature and a matter of survival for the fishermen community (Waters
1991). Forcing them out of their livelihood without an acceptable alternative
employment program will be viewed by many as inequitable and morally
unacceptable. Hence, retaining an employment program will be necessary.
A potential option is for the government and private sector is to pool their resources
and organise such programs as promotion of eco-tourism and dispersion of industrial
development into the rural coastal areas where more fishermen are employed in these
establishments, the less will be the fishing effort.
The government should chalk out a comprehensive plan for the best use of banned
vessels. The best use of the banned vessels will be for transportation of people and
seasonal goods from one place to another, tourism and for research and education.
Policies that recognise and incorporate indigenous fishing communities will most
likely be successful if sufficient authority and power are delegated to the local level
(Charles 2001). These will help the local communities acquire the direct responsibility
for management and protection of the hilsa fishery and other marine resources. The
emphasis should be placed on educating local fishing communities on the effects of
unsustainable fishing and the benefits of managed fishery resources. In this case, a
community-based management and conservation approach, where the local people are
integrated into the management system and their indigenous knowledge of fishes and
other marine resources is utilised in designing management, is a good example. Apart
from these, the effective enforcement of existing fishery regulations must be pursued.
To implement the current policy, management measures need to be imposed mainly to
preserve the fish stock from depletion and to protect the economic position of the
fishing society. To protect the stock and improve the economic performance of the
fishery in the longer term, a number of management options are available. The most
appropriate options should be taken for a sustainable hilsa fishery. Finally, in order to
shed more light on the current traditional exploitation, qualitative and quantitative
studies have to be conducted at smaller scales to record more detailed information. In
addition, better monitoring of fish landings is necessary for the formulation of viable
management. Thorough understanding of the exploitation patterns by regular
monitoring of resources provides suitable baseline information which is a vital
requirement for rational use, especially at this time when there is a growing gap
between population increase and the availability of food (fish supply).
Page 48
Mome
UNU – Fisheries Training Programme 43
ACKNOWLEDGEMENTS
The research was carried out under the supervision of Prof. Ragnar Arnason,
Department of Economics, University of Iceland. I would like to express my gratitude
to my supervisor for his excellent technical and professional guidance, criticism and
comments during the time of developing and preparing this report. I am similarly
grateful to the Director of the United Nations University-Fisheries Training
Programme, Dr. Tumi Tomasson and his deputy Mr. Thor Asgeirsson for their
support and guidance while developing the work.
I would like to thank the board of UNU-FTP and the United Nations University for
offering me the opportunity to participate in this course and funding my studies and to
the Directors of the Marine Research Institute and Icelandic Fisheries Laboratory,
management and staff for their very good support, for hosting us and ensuring that our
learning environment was both of the highest quality and enjoyable.
I would moreover like to thank my fellow colleagues in the UNU-FTP 2007 for their
support and making our time here in Iceland memorable and my colleagues from the
Department of Fisheries (DoF) for sending me crucial information without which I
wouldn‟t be able to finish this work.
Finally, I would like to thank the Director General of DoF Bangladesh for allowing
me to participate on this course. And also thanks to my family for their never-ending
love and moral support.
Page 49
Mome
UNU – Fisheries Training Programme 44
LIST OF REFERENCES
Ali, S. 1992. Chingree: Bangladesher chingree utpadon o chasah (in Bengali)
(Cultivation and production of prawn in Bangladesh). Bangla Academy: Dhaka.
Arnason. R. 1984. Efficient fisheries: The case of the Icelandic Demarsal fisheries.
Ph. D thesis. University of British Colambia.
Ahmed, N. 2007. Value chain analysis for hilsa marketing in coastal Bangladesh.
Aquaculture news, 33:14-29.
Amin, S. M., Rahman, M. A., Haldar, G. C., Mazid, M.A., and Milton, D. 2002.
Population dynamics and stock assessment of Hilsa shad, Tenualosa ilisa in
Bangladesh. Asian Fisheries Science. 15:123-128
Beverton, R.J.H. and Holt, S.J. 1957. On the dynamics of exploited fish populations.
Fisheries Investigations, Ministry of Agriculture, Fisheries and Food, United
Kingdom. Series 2, 19.
Bangladesh Bureau of Statistics, 1991. Report of the Upazila Development
Monitoring Project 1990, Vol. - II, June.
Bangladesh Bureau of Statistics (BBS) 1999. Statistical Pocket Book of Bangladesh,
1999. Statistical Division, Ministry of Planning, Government of the People's Republic
of Bangladesh, Dhaka, Bangladesh.
Bangladesh Fisheries Research Institute (BFRI), 2000. Hilsa Fisheries Research in
Bangladesh. Annul report, 2000 (unpublished).
Banglapedia, 2007. Hilsa. Banglapedia National Encyclopaedia of Bangladesh.
[December 17, 2007] < http://banglapedia.org/ht/H_0123.HTM>
Clark, C. W. 1973. Profit Maximisation and the Extinction of Animal Species.
Journal of Political Economy 81(4): 950-961.
Charles A. 2001. Sustainable Fishery Systems. United Kingdom: Blackwell Science
Ltd, Oxford.
Central Intelligence Agency (CIA), 2007. The World Factbook-Bangladesh. USA
[December 28, 2007] https://www.cia.gov/library/publicatons/the-world-
factbook/geos/bh.html
Department of fisheries (DoF), 2005-2006. Fish Catch Statistics, various issues.
Department of Fisheries, Government of the People's Republic of Bangladesh.
Department of fisheries (DoF), 2005a. Annual Report. Department of Fisheries,
Government of the People's Republic of Bangladesh.
Page 50
Mome
UNU – Fisheries Training Programme 45
Department of fisheries (DoF). 2005b. Fishery Statistical Yearbook of Bangladesh
2003–2004. Fisheries Resources Survey System, Department of Fisheries, Ministry of
Fisheries and Livestock, Matshya Bhaban, Dhaka, 46 pp.
Department of Fisheries (DOF) 2007. Fishery Statistical Yearbook of Bangladesh
2005-2006. Fisheries Resources Survey System, Department of Fisheries (DOF),
Ministry of Fisheries and Livestock, Dhaka, Bangladesh.
Day, F. 1873. Report on the Freshwater Fish and Fisheries of India and Burma.
Calcutta: India.
Garcia, S. and Le Reste, L. 1981. Life Cycles Dynamics, Exploitation and
Management of Coastal Penaeid Shrimp Stocks. FAO Fishery Technical Paper
203.FAO: Rome
Halder, G.C., 2002. Hilsa fishery management action plan for Bangladesh.
Completion report of the studies conducted under the ARDMCS, GEF component;
and FFP. Report No. 38.9, Department of Fisheries, Dhaka, Bangladesh.
Hartwick, J. M. and Olewiler, N. D., 1998. The Economics of Natural Resources Use,
Second edition. USA: Addison-Wesley Educational Publishers Inc.
Haroon, Y, 1998. Hilsa shad: Fish for the teeming millions, new management
alternatives needed for the hilsa young. Shad Journal, 3:7
Halder, G.C. 2004a. Ilish Mach Songrokhon abog Unnoun Baboshthapona Bastobaon
koushol (In Bengali) (The Implementation of Hilsa Conservation, Development and
Management Technique) Department of Fisheries (DoF) Dhaka, Bangladesh.
Haldar, G.C., and M.A. Rahman, 1998. Ecology Hilsa, Tenualosa ilisha (Hamilton).
In: Proc. Hilsa Fisheries Research in Bangladesh BFRI/ACIAR/CSIRO Workshop,
BARC, Dhaka (eds) M.A. Mazid & S.J.M. Blabber, BFRI.
Haldar, G. C., Mazid, M.A, Rahman, M. A. and Amin, S. M. N. 2001. The present
status of Hilsha (Tenualusa ilisha) fishery in Bangladesh. In: Proceedings of the
International Terubok Conference, (eds) Stephen Blaber, David Brewer, David Milton
and Chirista Baino. Sarawak Development Institute (SDI), 93000 Kuching, Sarawak,
Malaysia.
Halder, G.C. 2004b. Present status of the hilsa fishery in Bangladesh. Completion
report of the studies conducted under the ARDMCS, GEF component; and FFP.
Report No. 38.8, Department of Fisheries, Dhaka, Bangladesh.
Hall, R. and Kasem, M.A. 1994. Chandi boat motorization project in Bhola,
Bangladesh and their impacts. BOBP/REP/64.
Halder, G.C. 2005. Strategy Report for Introduction of Selective Fishing of Hilsa,
Bangladesh Fisheries Research Institute, Chandpur, Bangladesh.
Page 51
Mome
UNU – Fisheries Training Programme 46
King, M. 1995. Fisheries Biology, Assessment and Management. Blackwell
publishing. Oxford, United kingdom.
Kheih, U., Alam K., Dastidar R., Datta U., Oudwater N. and Word A. 2003.
Livelihoods in coastal fishing communities and the marine fish marketing systems of
Bangladesh. NRI report NO, 2712, National Resources Institute (NRI), Greenwich
University, London.
Le Cren, E.D. 1951. The length-weight relationships and seasonal cycle in gonad
weight and condition in perch (Perca fluviatilis). Journal of Anima Ecology. 20 (2):
201-219.
Miah, M.S., Rahman. M.A. and Haldar, G.C., 1999. Analytical approach to the
spawning grounds of Hilsa, Tenualosa ilisha (Ham.) in Bangladesh. Indian Journal of
Animal Science; 6a (2).
Pauly, D.1980. On the interrelationship between natural mortality, growth parameters
and mean environmental temperature in 175 fish stocks. Journal for Central Institute
for economic Management 39(3): 175-192.
Padilla, J. E. and Charles, A. T. 1994. Bioeconomic Modelling and the Management
of Capture and Culture Fisheries, NAGA (The ICLARM Quarterly), 1 (1).
Raja, B.T. A. 1985. A review of the biology and fisheries of hilsa in the upper Bay of
Bengal. Marine Fishery Resource Management in the Bay of Bengal.
BOBP/WP/37:66.
Rahman A.K.A. 1989. Freshwater Fishes of Bangladesh. Zoological Society of
Bangladesh. Department of Zoology, University of Dhaka. Bangladesh.
Rahman, M. 2005. The story of the Hilsa shad. [12 November 2007]
<http://asiaarecipe.com/banchad.html>
Shafi, M., Quddus, M.M.A and Islam N. 1976. Maturation, spawning, sex-ratio and
fecundity of Hilsa ilisha (Hamilton-Buchanan) of the river Padma. Proc. First
Bangladesh Sci. Conf., 45.
Sarker, M.S. and Sarker, N.J. 1988. Wildlife of Bangladesh – A Systematic List. Rico
Printers. Dhaka.,Bangladesh.
Southwell, T. and B. Prashad, 1918. On Hilsa investigations in Bengal, Bihar and
Orissa. Ibid., 11: 1-12.
Waters, J. R. 1991. Toward More Effective Regulation of Fishing Effort, Marine
Fisheries Review, 53 (3).
Wikipedia, 2007. Hilsa. [26 November, 2007] < http://en.wikipedia.org/wiki/Hilsa>
Page 52
Mome
UNU – Fisheries Training Programme 47
Appendix 1: Total hilsa harvest from both inland and marine sector of Bangladesh
(1987-2006)
Year Hilsa catch
Inland Fisheries Marine Fisheries Total
1986-1987 91.167 103.814 194.981
1987-1988 78.551 104.950 183.501
1988-1989 81.641 110.311 191.952
1989-1990 112.408 113.943 226.351
1990-1991 66.809 115.358 182.167
1991-1992 68.356 120.106 188.462
1992-1993 74.715 123.115 197.830
1993-1994 71.370 121.161 192.531
1994-1995 84.420 129.115 213.535
1995-1996 80.625 126.660 207.285
1996-1997 83.230 131.204 214.434
1997-1998 81.634 124.105 205.739
1998-1999 73.809 140.710 214.519
1999-2000 79.165 140.367 219.532
2000-2001 75.060 154.654 229.714
2001-2002 68.250 152.343 220.593
2002-2003 62.944 136.088 199.032
2003-2004 71.001 184.838 255.839
2004-2005 77.499 198.363 275.862
2005-2006 78.273 198.850 277.123
2006-2007 80.453 199.875 280.328
Page 53
Mome
UNU – Fisheries Training Programme 48
Appendix 2: The total number of mechanized and non-mechanized boats (MB and
NMB) operated in the marine sector and catch/boat/year. (FRSS, DoF: 1984 to 2006)
years Number of boats Hilsa catch (MT) Av. Catch/boat/year
MB NMB Total MB NMB Total MB NMB Total
1983/84 3.347 - 3.347 56.000 0 56.000 16,7 0 16,7
1984/85 3.000 - 3.000 71.050 0 71.050 23,7 0 23,7
1985/86 2.887 3.802 6.682 88.389 7.905 96.294 30,6 2,08 14,4
1986/87 2.887 3.800 6.680 94.851 8.963 103.814 32,9 2,36 15,5
1987/88 2.882 3.509 6.389 91.723 13.227 104.950 31,9 3,76 16,4
1988/89 2.880 3.509 6.389 94.990 15.321 110.311 33,0 4,37 17,3
1989/90 2.880 3.509 6.389 95.285 18.658 113.943 33,1 5,32 17,8
1990/91 2.880 3.509 6.389 97.573 17.785 115.358 33,9 5,06 18,1
1991/92 2.880 3.509 6.389 102.036 18.070 120.106 35,4 3,14 18,8
1992/93 2.880 3.509 6.389 105.128 17.997 123.115 36,5 5,13 19,3
1993/94 2.880 3.509 6.389 103.839 17.322 121.161 36,1 4,94 19,0
1994/95 2.880 3.509 6.389 111,475 17.640 129.115 38,7 5,03 20,2
1995/96 2.880 3.509 6.389 109.282 17.378 126.660 37,9 4,95 19,8
1996/97 2.880 3.509 6.389 114.921 16.283 131.204 39,9 4,64 20,5
1997/98 2.880 3.509 6.389 110.440 13.059 124.105 38,3 3,72 1,40
1998/99 2.880 3.509 6.389 121.909 18.761 140.710 42,3 5,35 22,0
1999/00 18.982 7.177 2.616,9 119.295 21.072 140.367 6,3 2,94 5,40
2000/01 18.982 6.377 2.536,9 131.254 23.400 154.654 6,91 3,67 6,00
2001/02 18.982 6.377 2.536,9 131.619 20.724 152.343 6,93 3,24 5,90
2002/03 18.982 6.377 2.536,9 114.274 21.814 136.088 6,02 3,42 5,36
2003/04 18.982 6.377 2.536,9 157.570 27.268 184.838 8,30 4,28 7,29
2004/05 18.982 6.377 2.536,9 170.756 27.607 198.363 9,00 4,33 7,82
2005/06 18.982 6.377 2.536,9 170.945 27.905 198.850 9,00 4,38 7,84
Page 54
Mome
UNU – Fisheries Training Programme 49
Appendix 3: Output of the model run for calculation of OSY
Fishing
effort (HP)
Spawning
stock
(1000 mt.)
Total hilsa
stock
(age>6 m)
Total harvest
(1000 mt)
Revenew
(Million US$)
Costs
(million US$)
Profits
(Million US$)
0 806,6 841,2 0,0 0,0 0,0 0,0
0,1 645,3 679,0 48,0 95,9 18,5 77,5
0,2 527,3 559,9 75,8 151,5 36,9 114,6
0,3 439,0 470,7 91,5 183,1 55,4 127,7
0,31 431,5 463,0 92,7 185,3 57,3 128,1
0,32 424,1 455,6 93,7 187,4 59,1 128,3
0,33 417,0 448,3 94,7 189,0 61,0 128,5
0,34 410,0 441,2 95,6 191,3 62,8 128,5
0,35 403,2 434,3 96,5 193,0 64,6 128,3
0,4 371,7 402,3 100,1 200,1 73,9 126,2
0,5 319,4 349,0 104,1 208,2 92,4 115,9
0,6 278,1 306,6 105,1 210,9 110,8 100,1
0,7 244,9 272,5 105,1 210,1 129,3 80,8
0,8 217,9 244,5 103,1 207,3 147,8 59,5
0,9 195,6 221,4 101,6 203,3 166,2 37,0
1 177,1 202,0 99,3 198,5 184,7 13,8
1,1 161,6 185,6 96,7 193,5 203,2 -9,7
1,2 148,4 171,7 94,2 188,3 221,6 -33,3
1,3 137,2 159,7 91,6 183,3 240,1 -56,9
1,4 127,6 149,4 89,2 178,3 258,6 -80,3
1,5 119,2 140,4 86,8 173,6 277,1 -103,4
Page 55
Mome
UNU – Fisheries Training Programme 50
Appendix 4: Output of the model run for PV of profit maximizing path during the
adjustment for hilsa fishery.
Years
Spawnin
g stock
Total hilsa
stock
(age<6
months)
Fishing
effort
Total
harves
(1000
mt)
Revenue
s (m.
US$)
Fixed
costs
Total
costs
(m.US$
)
Profits
(m.US$
) PV
2008 1,00 48.40
2009 170,04 193,88 0,00 0,00 0,00 24,20 24,2 -24,20 -23,49
2009 298,38 322,22 0,10 22,77 45,54 14,52 28,1 17,39 16,39
2010 373,40 397,86 0,20 53,83 107,67 12,10 39,4 68,31 62,51
2010 409,58 438,68 0,30 85,31 170,63 13,31 54,2 116,43 103,45
2011 414,51 445,16 0,33 94,04 188,07 14,64 59,6 128,45 110,80
2011 413,19 444,42 0,33 93,88 187,76 15,31 60,3 127,47 106,76
2012 414,05 445,35 0,33 94,08 188,15 15,64 60,6 127,53 103,70
2012 414,20 445,48 0,33 94,10 188,21 15,80 60,8 127,42 100,59
2013 415,21 446,50 0,33 94,32 188,64 15,89 60,9 127,77 97,92
2013 416,02 447,32 0,33 94,49 188,98 15,93 60,9 128,07 95,30
2014 416,38 447,69 0,33 94,57 189,14 15,95 60,9 128,21 92,62
2014 416,58 447,91 0,33 94,62 189,23 15,96 60,9 128,29 89,98
2015 416,71 448,04 0,33 94,64 189,29 15,97 60,9 128,34 87,39
2015 416,80 448,13 0,33 94,66 189,32 15,97 60,9 128,37 84,87
2016 416,86 448,19 0,33 94,68 189,35 15,97 61,0 128,40 82,42
2016 416,90 448,23 0,33 94,68 189,37 15,97 61,0 128,42 80,03
2017 416,92 448,26 0,33 94,69 189,38 15,97 61,0 128,43 77,70
2017 416,94 448,28 0,33 94,69 189,39 15,97 61,0 128,44 75,44
2018 416,95 448,29 0,33 94,70 189,39 15,97 61,0 128,44 73,25
2018 416,96 448,29 0,33 94,70 189,40 15,97 61,0 128,44 71,12
2019 416,96 448,30 0,33 94,70 189,40 15,97 61,0 128,44 69,05
2019 416,96 448,30 0,33 94,70 189,40 15,97 61,0 128,45 67,04
2020 416,97 448,30 0,33 94,70 189,40 15,97 61,0 128,45 65,08
2020 416,97 448,31 0,33 94,70 189,40 15,97 61,0 128,45 63,19
2021 416,97 448,31 0,33 94,70 189,40 15,97 61,0 128,45 61,35
2021 416,97 448,31 0,33 94,70 189,40 15,97 61,0 128,45 59,56
2022 416,97 448,31 0,33 94,70 189,40 15,97 61,0 128,45 57,83
2022 416,97 448,31 0,33 94,70 189,40 15,97 61,0 128,45 56,14
3255,9
9 3959,34
Page 56
Mome
UNU – Fisheries Training Programme 51
Appendix 5: Output of the model run for calculates the moderate path of adjustment
for hilsa fishery.
Years Spawning
stock
Total hilsa
Stock
(>6months)
Fishing
effort
Total
(1000
mt)
Revenues
(m. US$)
Fixed
costs
Total
costs
(m.US$)
Profits
(m.US$)
PV
2008 1.00 48.40
2009 170,04 193,88 0,90 89,02 178,03 45,98 168,65 9,38 9,11
2009 177,90 201,74 0,80 85,52 171,04 42,35 151,39 19,65 18,52
2010 191,88 216,34 0,70 83,42 166,85 38,11 133,53 33,32 30,49
2010 209,67 234,54 0,60 80,64 161,29 33,57 115,36 45,93 40,81
2011 232,08 257,62 0,50 76,86 153,71 28,89 97,04 56,67 48,88
2011 260,30 286,60 0,40 71,27 142,54 24,12 78,65 63,89 53,51
2012 295,72 322,87 0,33 68,20 136,41 20,05 65,03 71,38 58,04
2012 333,69 361,75 0,33 76,42 152,83 18,01 62,99 89,84 70,92
2013 359,40 388,43 0,33 82,05 164,11 16,99 61,97 102,13 78,28
2013 377,78 407,67 0,33 86,12 172,23 16,48 61,46 110,77 82,42
2014 390,74 421,14 0,33 88,96 177,92 16,23 61,21 116,72 84,32
2014 399,55 430,27 0,33 90,89 181,78 16,10 61,08 120,70 84,66
2015 405,45 436,38 0,33 92,18 184,36 16,03 61,02 123,35 83,99
2015 409,38 440,46 0,33 93,04 186,08 16,00 60,98 125,10 82,71
2016 412,01 443,18 0,33 93,62 187,23 15,99 60,97 126,27 81,05
2016 413,74 444,97 0,33 93,99 187,99 15,98 60,96 127,03 79,16
2017 414,86 446,13 0,33 94,24 188,48 15,97 60,96 127,52 77,15
2017 415,60 446,89 0,33 94,40 188,80 15,97 60,95 127,85 75,10
2018 416,08 447,38 0,33 94,50 189,01 15,97 60,95 128,06 73,03
2018 416,39 447,70 0,33 94,57 189,15 15,97 60,95 128,19 70,98
2019 416,59 447,91 0,33 94,62 189,23 15,97 60,95 128,28 68,96
2019 416,72 448,05 0,33 94,65 189,29 15,97 60,95 128,34 66,98
2020 416,81 448,14 0,33 94,67 189,33 15,97 60,95 128,38 65,05
2020 416,87 448,20 0,33 94,68 189,36 15,97 60,95 128,40 63,17
2021 416,90 448,24 0,33 94,69 189,37 15,97 60,95 128,42 61,33
2021 416,93 448,26 0,33 94,69 189,38 15,97 60,95 128,43 59,55
2022 416,94 448,28 0,33 94,69 189,39 15,97 60,95 128,44 57,82
2022 416,95 448,29 0,33 94,70 189,39 15,97 60,95 128,44 56,14
2.880,88 3.653,39
Page 57
Mome
UNU – Fisheries Training Programme 52
Appendix 6: National Legislation for Marine Zones and Fishing
(1) Territorial Waters and Maritime Zones Act 1974 (Act no XXVI of 1974).
This Act provides for declaration of various maritime zones:
i. Territorial waters: Territorial waters extend to 12 nautical miles beyond the coast of
Bangladesh, and also include all internal waters.
ii. Contiguous zone: The zone of the high seas contiguous to the territorial waters and
extending seawards to a line of 6 nautical miles measured from the outer limits of the
territorial waters was declared to be the contiguous zone of Bangladesh.
iii. Economic zone: The zone of the high seas extending to 200 nautical miles
measured from the baseline is the Exclusive Economic Zone of Bangladesh.
iv. Conservation zone: Through official notification, the Government may establish
conservation zones in areas adjacent to the territorial waters.
v. Continental Shelf: The continental shelf of Bangladesh is comprised of (a) the
seabed and subsoil of the sub-marine areas adjacent to the coast of Bangladesh, and
(b) the seabed and subsoil of the analogous submarine areas adjacent to the coast of
any island, rock or any composite group constituting part of the territory of
Bangladesh.
(2) The Marine Fisheries Ordinance, 1983 (Ordinance No. XXXV of 1983)
(i) The Marine Fisheries Ordinance, 1983 (Ordinance No. XXXV of 1983, July 19,
1983).
(ii) The Marine Fisheries Rules, 1983 (No. S.R.O. 349 - L/83, September 8, 1983 of
Ministry of Agriculture, Fisheries and Livestock Division).
(iii) The Marine Fisheries Rules (Amendment), 1992 (No. S.R.O. 275 - Rule/92,
December 1992 of the Ministry of Fisheries and Livestock).
This Marine Fisheries Ordinance, 1983 made provisions for the management,
conservation and development of marine fisheries for water bodies with a depth in
excess of 50 metres. Any body of water under 50 metres depth is reserved for small-
scale fisheries. All trawlers are required to obtain a fishing license for a year, which
then allows them to fish within the 200 nautical mile maritime boundary of
Bangladesh. Each trawler must be granted sailing permission from the Directorate of
Fisheries for every voyage. Mechanized boats have been
brought under a licensing system in accordance with Amendment 92 of the Marine
Fisheries Ordinance, 1983. Since January 2001, all non-mechanized boats have also
been included under the licensing system. ( GOB, 1994).