“We are surrounded by increasingly sophisticated visual images.” (Howells, 2003) everywhere you look, information is being transmitted visually. Pick up a magazine, glance at a newspaper, look at a television news program or check out the news online. chances are that visual models—charts, graphs, diagrams, and other forms of illustration—are the primary source of the information that you will understand and retain.
And the more complex the information, the more important these visual interpretations become. Tufte points out that multiple forms of discourse—verbal, numeric, and visual—are required to communicate evidence about questions of any complexity. For example, he notes that a quarter of the information in modern scientific research comes in the form of charts, tables, diagrams, and images. (Tufte, 2006) complex and layered, visual information constitutes a language of its own. All around us, images, symbols, and icons provide and convey meaning, creating a visual world of information. (Howells, 2003)
Visual technology has become increasingly important in our daily lives. We gather information from websites, give PowerPoint presentations, and sketch on smartboards to get our ideas across. All of these resources highlight how important visual processing and visual reasoning has become. (Diezmann, 1995) This is particularly true for teenagers, who have come of age in a technological world where visual information is the norm. comfortable online, well-versed in video games, eager consumers of graphic novels, young adults have become naturally reliant on the language of visuals to transmit and convey information.
Visuals help to engage students, to grab their attention and demonstrate how math is relevant to their lives. And visual models are important tools in explaining how mathematical concepts work.
Visual Learning Defined
Visual learning is about acquiring and communicating information. We easily understand that information often comes to us through words and numbers. We readily acknowledge that students must be taught to read and understand and
How does visual learning help high school students
perform better in mathematics?
The Power of Visual Learning in secondary Mathematics education
2 Research Into Practice • Pearson
use these ways of conveying data. But we don’t often pay as much attention to the ways information can be conveyed visually: through illustrations, photos, diagrams, graphs, symbols, icons, and other visual representations.
Our world is full of information that comes to us visually. The color and shape of a red, octagonal sign says, “stop.” A pie chart tells us percentage at a glance. Graphs demonstrate the ups and downs of financial markets. A smiling face conveys joy; a frown tells us there’s trouble. This visual information is conveyed constantly and consistently; red usually indicates, “stop”; a smile rarely means “go away.” it forms a language that students must learn if they are to become able to navigate a visual society.
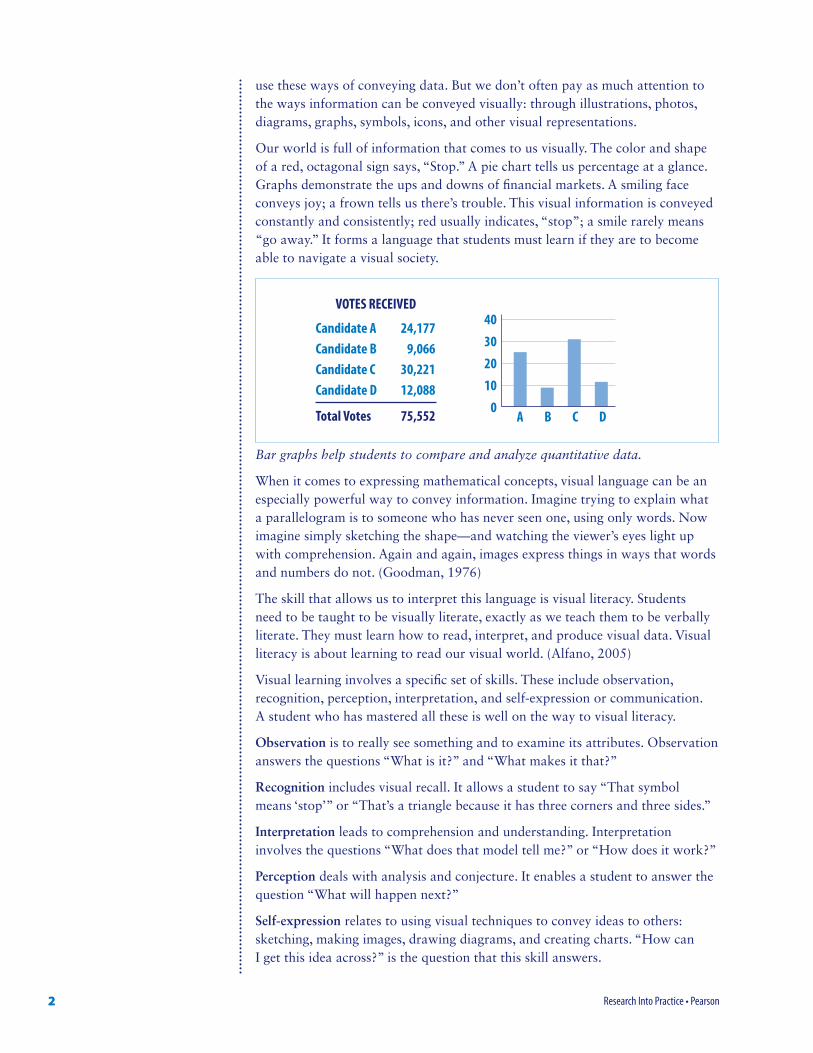
VOTES RECEIVED
Candidate A 24,177Candidate B 9,066Candidate C 30,221Candidate D 12,088
Total Votes 75,552
40
30
20
10
0 A B C D
Bar graphs help students to compare and analyze quantitative data.
When it comes to expressing mathematical concepts, visual language can be an especially powerful way to convey information. imagine trying to explain what a parallelogram is to someone who has never seen one, using only words. Now imagine simply sketching the shape—and watching the viewer’s eyes light up with comprehension. Again and again, images express things in ways that words and numbers do not. (Goodman, 1976)
The skill that allows us to interpret this language is visual literacy. students need to be taught to be visually literate, exactly as we teach them to be verbally literate. They must learn how to read, interpret, and produce visual data. Visual literacy is about learning to read our visual world. (Alfano, 2005)
Visual learning involves a specific set of skills. These include observation, recognition, perception, interpretation, and self-expression or communication. A student who has mastered all these is well on the way to visual literacy.
Observation is to really see something and to examine its attributes. Observation answers the questions “What is it?” and “What makes it that?”
Recognition includes visual recall. it allows a student to say “That symbol means ‘stop’” or “That’s a triangle because it has three corners and three sides.”
Interpretation leads to comprehension and understanding. interpretation involves the questions “What does that model tell me?” or “How does it work?”
Perception deals with analysis and conjecture. it enables a student to answer the question “What will happen next?”
Self-expression relates to using visual techniques to convey ideas to others: sketching, making images, drawing diagrams, and creating charts. “How can i get this idea across?” is the question that this skill answers.
3Research Into Practice • Pearson
in the teaching of mathematics, words and numbers alone are not sufficient. instead, words, numbers, and pictures should come together to clearly demonstrate what’s taking place. (Murphy, 2006) Presenting information verbally, numerically, and visually helps children to truly comprehend complex mathematical information. it is when ideas are expressed so that the words and the images and the numbers work together seamlessly that true communication results. (Laspina, 1998)
Problem 1
Got It?
Problem 2
Got It?
512 Chapter 8 Polynomials and Factoring
A = 4x2 20x 25One Pixel
Factoring a Perfect-Square Trinomial
What is the factored form of x2 2 12x 1 36?
x2 2 12x 1 36 5 x2 2 12x 1 62 Write the last term as a square.
5 x2 2 2(x)(6) 1 62 Does middle term equal 22ab? 212x 5 22(x)(6) ✔
5 (x 2 6)2 Write as the square of a binomial.
1. What is the factored form of each expression?
a. x2 1 6x 1 9 b. x2 2 14x 1 49
Factoring to Find a Length
Computers Digital images are composed of thousands of tiny pixels rendered as squares, as shown below. Suppose the area of a pixel is 4x2 1 20x 1 25. What is the length of one side of the pixel?
4x2 1 20x 1 25 5 (2x)2 1 20x 1 52 Write fi rst and last terms as squares.
5 (2x)2 1 2(2x)(5) 1 52 Does middle term equal 2ab? 20x 5 2(2x)(5)y
5 (2x 1 5)2 Write as the square of a binomial.
� e length of one side of the pixel is 2x 1 5.
2. You are building a square patio. � e area of the patio is 16m2 2 72m 1 81. What is the length of one side of the patio?
How can you fi nd the side length?Since the pixel’s area is its side length squared, factor the expression for area as the square of a binomial. The binomial is the side length.
Will the answer have the form (a 1 b)2 or (a 2 b)2?The middle term 212x has a negative coeffi cient, so the factored expression will have the form (a 2 b)2.
0511_hsm11a1se_0807.indd 512 1/13/09 5:14:38 PM
Visuals allow students to see and understand mathematical relationships.
Design plays a critical role in visual learning practice by providing structure for organizing information and making it accessible. it involves the careful construction and placement of text and images so that the result is clear and considerate of the user. everything from the choice of colors to the creation of illustrations, from the selection of typefaces to the relationship of elements, should work together to make the information inviting and easy to understand. (Rand, 1985)
The display of visual information is not about just putting pictures on a page to illustrate text. it isn’t the decoration of ideas that are presented verbally, nor is it the creation of overly busy and confusing displays. instead, it is the well thought-out and carefully developed visual/verbal/numerical co-expression of content. it’s about carefully crafting models so that students readily understand them and consistently using the same models to mean the same things, just as we use the same words to mean the same things. (charles, 2006) it’s a visual language.
Visual Learning and Mathematics
Research has shown that visual learning theory is especially appropriate to the attainment of mathematics skills. Understanding abstract math concepts is reliant on the ability to “see” how they work, and students naturally use visual models to solve mathematical problems. They are often able to visualize a problem as a set of images. For example, how do you solve a difficult word problem? You break it down and visualize the relevant parts, maybe even sketching how they relate to one another. How do you find the surface area of a pyramid? You envision a net of all its sides.
4 Research Into Practice • Pearson
The net shown can be folded into a regular pyramid with a square base. Nets are used for finding the surface areas of three-dimensional shapes.
in particular, the consideration of relationships and the assessment of size, quantity, distance, position, dimension, and scale all benefit from our ability to visually model these ideas. (Tufte, 1997) Graphs allow us to “grasp mathematics with our eyes and with our mind’s eye.” (Pinker) charts let us see relationships instantly. Understanding shapes and lines and angles are dependant on a student’s ability to see, recognize, interpret, and reproduce visual data. Mental images enable students to interact with mathematical concepts, process information, observe changes, reflect on their experiences, modify their thinking, and draw conclusions. (Rowan & Bourne, 1994)
in fact, it is in the process of creating mental images or models of a concept that students are able to make the all-important leap from the concrete to the abstract. The essential skill of estimation is a prime example of moving from the concrete (what can be seen, counted, or measured) to the abstract (what can be imagined, visualized, and understood). This skill is heavily dependant on mental visual images. Observations such as “There are about 750 people here.” or “The distance is approximately 500 feet.” depend on the viewer’s ability to create and compare mental images.
Problem 4
Got It?
Got It?
Lesson 4-7 Congruence in Overlapping Triangles 267
3. Given: PS RS, PSQ RSQ
Prove: QPT QRT
When several triangles overlap and you need to use one pair of congruent triangles to prove another pair congruent, you may � nd it helpful to draw a diagram of each pair of triangles.
Separating Overlapping Triangles
Given: CA CE , BA DE
Prove: BX DX
Statements Reasons
1) BA DE 1) Given
2) CA CE 2) Given
3) CAE CEA 3) Base of an isosceles are .
4) AE AE 4) Re� exive Property of
5) BAE DEA 5) SAS
6) ABE EDA 6) Corresp. parts of are .
7) BXA DXE 7) Vertical angles are .
8) BXA DXE 8) AAS
9) BX DX 9) Corresp. parts of are .
4. Given: CAD EAD, C E
Prove: BD FD
hsm11gmse_0407_t05056
P
Q
T
R
S
Proof
hsm11gmse_0407_t05057
C
B DX
A E
A
B DX
EE AA
B D
E
hsm11gmse_0407_t05058
A
CB
F
D
E
1)
2)
3)
Which triangles are useful here?If BXA DXE , then BX DX because they are corresponding parts. If BAE DEA,
you will have enough information to show BXA DXE .
Diagrams can clarify important geometric concepts.
Piaget studied students’ understandings of size and visual comparisons of near and far objects. He found that students made visual transfers as approximations regarding measurement. “i know how long this is. That looks like it’s ten times longer. “He noted that, in estimation, “visual transfer is the most striking and
5Research Into Practice • Pearson
theoretically most important” element for understanding and successfully completing the task.
Piaget realized that mathematical relationships often involve keen observation. in determining whether or not two triangles were similar, a student explained, “i looked at it carefully just as if it were near the other one.” (Piaget, 1960) in other words, the student created a mental image, visualizing the triangles next to each other. This exercise of visual literacy allowed the student to come to the conclusion that the triangles were similar.
Visual Learning as Part of Our Language
“One of the key things about language is that images come bubbling up inside of it.” (elkins, 2007) You can say the same thing about math. Visual images are inherent in mathematical concepts. Underneath a statement like, “That’s 50% of the space.” is a visual image of the entire space. Visual thinking involves imagery, metaphor, and imagination. (Worth, 1981)
Visual images underlie the language of math at every turn. “imagine.” “consider the relationships between.” “Which is further away?” “estimate how many.” All these verbal concepts come with mental images attached that explain, interpret, or clarify them. These images are not in conflict with the words or with the numbers—they are an inherent part of them, each a participant in the same system of communication. (elkins, 2007) And when students use all three parts of the system—words, numbers, and images—together, they achieve better comprehension.
VISUAL
VERBAL NUMERICAL
COMPREHENSION
sketching and modeling are an important and helpful part of the note-taking processes. sketching about math—modeling what a math problem looks like—helps students to figure out what it’s all about. studies have shown that students have the capacity to internalize and find relevancy in what they draw, and they easily make connections to other areas of learning through their image-making. (Davis, 2005)
Visual Learning and Equity
since our culture is becoming more and more visual, schools need to educate students in visual literacy to enable them to participate equitably in society.
6 Research Into Practice • Pearson
(Diezmann, 1995) A student who does not receive a good education in visual literacy is at a disadvantage, exactly as a student would be who had not learned to read or who had not mastered numbers.
While over time, many researchers have addressed the characteristics and benefits of visual learning, the publication of Howard Gardner’s seminal work, The Theory of Multiple Intelligences (1983), particularly helped to focus the attention of educators on the reality that children learn in different ways. This realization, and its popular acceptance within education communities, initiated the development of new approaches to classroom practice. With Gardner’s identification of spatial intelligence as one of the intelligences, visual learning techniques like visualization, color cues, picture metaphors, concept maps, sketches, diagrams, and graphic symbols came into greater use. (Armstrong, 1994) For those students who are visual learners, these created new opportunities for participating more fully in the learning process.
These new opportunities are welcome, but more remains to be done to ensure that all students become visually literate. A failure to access visual learning strategies can discriminate against and marginalize students in a variety of ways. (Diezmann, 1995) students who are visual learners may not have their abilities recognized in the classroom. Their approaches to problem-solving may not be acknowledged as valid, and their understanding of a problem may not be recognized if expressed in a sketch or a diagram rather than a sentence or an equation. For those students who are english Language Learners, and those who don’t have a vast vocabulary of mathematical terms, visual language is the same as it is for all students. They may not be able to understand what is happening in words, but they can readily see it through models.
Teaching visual literacy is not only about effective mathematics instruction. Providing students with the opportunity to develop visual literacy is a matter of social justice. (Diezmann). equal access to visual literacy means providing students with an equal chance of successfully navigating the visual world in which we live. students who do not achieve visual literacy in school will be at a disadvantage afterwards, limited in their access to information and in their ability to participate fully in a visual society.
Problem 1
Got It?
Lesson 1-9 Patterns, Equations, and Graphs 61
Patterns, Equations, and Graphs
1-9
Objective To use tables, equations, and graphs to describe relationships
In the Solve It, you may have described the pattern using words. You can also use an equation or a graph to describe a pattern.
Essential Understanding Sometimes the value of one quantity can be found if you know the value of another. You can represent the relationship between the quantities in di� erent ways, including tables, equations, and graphs.
You can use an equation with two variables to represent the relationship between two varying quantities. A solution of an equation with two variables x and y is any ordered pair (x, y) that makes the equation true.
The table below shows the relationship between the number of kites in an arrangement and the total number of ribbons on the kites’ tails. Describe the pattern in the table. How many kites could you make with 275 ribbons? Explain.
Identifying Solutions of a Two-Variable Equation
Is (3, 10) a solution of the equation y 5 4x?
y 5 4x
10 0 4 ? 3 Substitute 3 for x and 10 for y .
10 2 12 So, (3, 10) is not a solution of y 5 4x .
1. Is the ordered pair a solution of the equation y 5 4x? a. (5, 20) b. (25, 220) c. (220, 25) d. (1.5, 6)
How can you tell whether an ordered pair is a solution?Replace x with the fi rst value in the ordered pair and y with the second value in the ordered pair. Is the resulting equation true?
One Kite
5 Ribbons
Two Kites
10 Ribbons
Three Kites
15 Ribbons
Four Kites
20 Ribbons
Lesson Vocabulary
• solution of an equation
• inductive reasoning
V• s
V• s
You can use patterns to make predictions.
Sunshine State Standards MA.912.A.2.1 Create a graph to represent a real-world situation.MA.912.A.2.2 Interpret a graph representing a real-world situation.
0061_hsm11a1se_0109.indd 61 1/15/09 7:04:06 AM
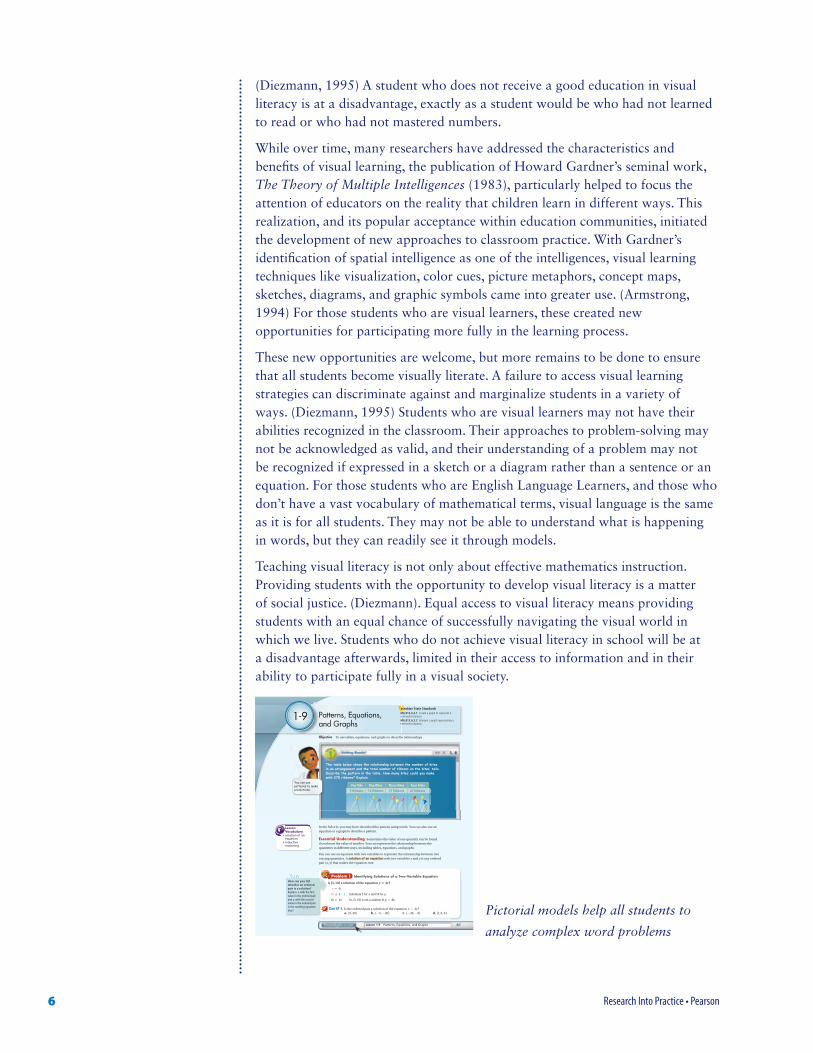
Pictorial models help all students to
analyze complex word problems
7Research Into Practice • Pearson
Visual Learning Strategies
classroom strategies that support visual learning practice in the teaching of mathematics can take many forms. The best strategies result from thinking about math visually and then putting those thoughts into practice. (Arnheim, 1969)
Teachers can display materials that help to convey ideas visually—charts, graphs, timelines, and diagrams. They can encourage students to draw images to explain or solve problems. They can ask students to work together to model new concepts. sketching should be part of a daily math note-taking process. Drawing out a concept and visualizing how it works leads to comprehension. (Armstrong, 1994) A good way to assess understanding is to ask a student to demonstrate a mathematical concept without using words––or numbers.
Visuals can be used to show the relationship between linear equations and their graphs, to indicate proportion and scale, and to clarify the area and volume of three-dimensional shapes. Models can be created to demonstrate processes, such as the representation and analysis of complex data and the determination of the relationships within triangles. students can discuss visual models, how they interpret them, and what they mean.
The creation of concept maps of mathematical ideas will help students to make critical connections. Timelines can build knowledge about elapsed time. And diagrams can model estimation and probability examples. The mastery of visual literacy by both students and teachers is dependent on the creation of diagrams becoming as natural as writing sentences and building equations.
Lesson Check
x
2x
Problem 4
Got It?
482 Chapter 8 Polynomials and Factoring
Do you know HOW? 1. What is a simpler form of 6x(2x3 1 7x)?
2. What is the GCF of the terms in 4a4 1 6a2?
Factor each polynomial.
3. 6m2 2 15m
4. 4x3 1 8x2 1 12x
Do you UNDERSTAND?Match each pair of monomials with its GCF.
5. 14n2, 35n4 A. 1
6. 21n3, 18n2 B. 7n2
7. 7n2, 9 C. 3n2
8. Reasoning Write a binomial with 9x2 as the GCF of its terms.
Factoring a Polynomial Model
Helipads A helicopter landing pad, or helipad, is sometimes marked with a circle inside a square so that it is visible from the air. What is the area of the shaded region of the helipad at the right? Write your answer in factored form.
Step 1 Find the area of the shaded region.
A1 5 s2 Area of a square 5 (2x)2 Substitute 2x for s. 5 4x2 Simplify.
A2 5 pr2 Area of a circle 5 px2 Substitute x for r.
� e area of the shaded region is A1 2 A2, or 4x2 2 px2.
Step 2 Factor the expression.
First � nd the GCF.
4x2 5 2 ? 2 ? x ? x
px2 5 p ? x ? x
� e GCF is x ? x, or x2.
Step 3 Factor out the GCF.
4x2 2 px2 5 x2(4) 1 x2(2p)
5 x2(4 2 p)
� e factored form of the area of the shaded region is x2(4 2 p).
4. In Problem 4, suppose the side length of the square is 6x and the radius of the circle is 3x. What is the factored form of the area of the shaded region?
How can you fi nd the shaded region’s area?The shaded region is the entire square except for the circular portion. So, subtract the area of the circle from the area of the square.
0480_hsm11a1se_0802.indd 482 1/13/09 4:16:50 PM
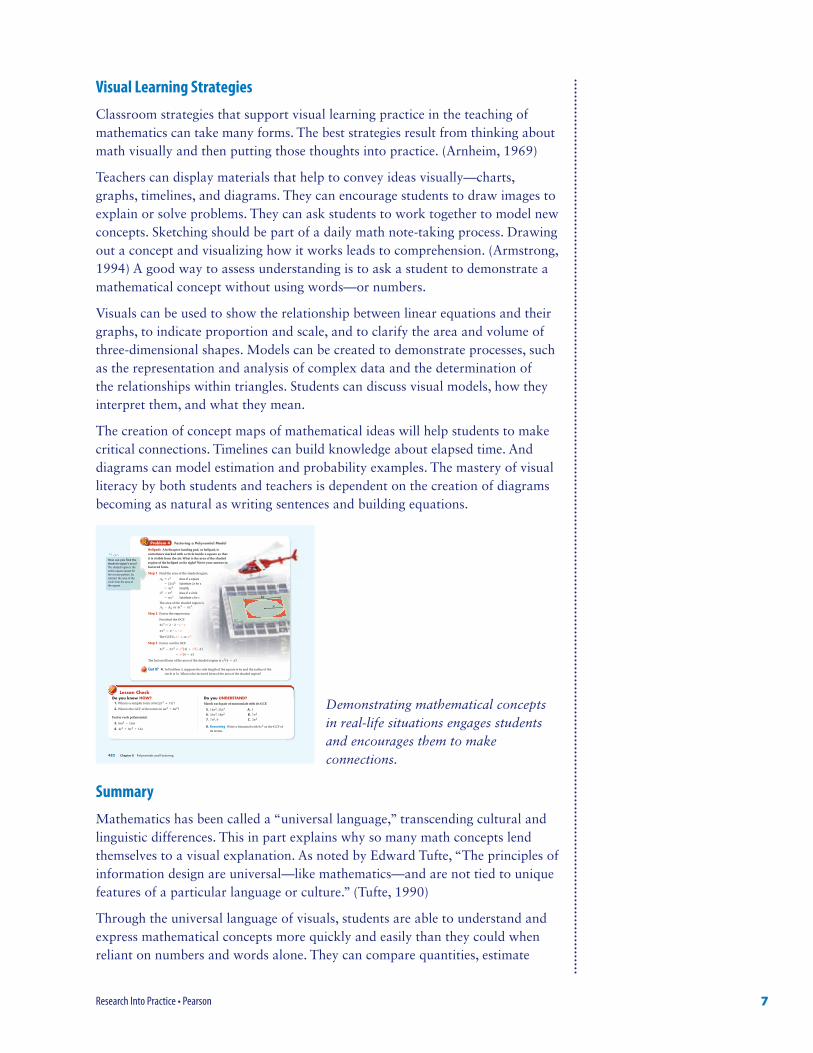
Demonstrating mathematical concepts in real-life situations engages students and encourages them to make connections.
Summary
Mathematics has been called a “universal language,” transcending cultural and linguistic differences. This in part explains why so many math concepts lend themselves to a visual explanation. As noted by edward Tufte, “The principles of information design are universal—like mathematics—and are not tied to unique features of a particular language or culture.” (Tufte, 1990)
Through the universal language of visuals, students are able to understand and express mathematical concepts more quickly and easily than they could when reliant on numbers and words alone. They can compare quantities, estimate
8 Research Into Practice • Pearson
distances, and figure out which items belong in a set and which don’t. They can learn about perimeter and area, dimension and scale, and symmetry. And they can develop strategies for everything from estimating to interpreting quantitative information. indeed, many important mathematical concepts—comparison, scale, dimension, measurement, direction, shape, and perspective—are best experienced visually.
Visual learning strategies can make a profound difference in a student’s depth of understanding about mathematics. it is a powerful teaching tool for those who are natural visual/spatial learners, for those who are english language learners, and for all students. in fact, by using visual learning strategies in the teaching of mathematics, we can—and we should—increase the learning potential of all students and develop their ability to communicate mathematical concepts in an increasingly visual world.
charles, Randy. Curriculum Focal Points, Big Ideas, and Essential Understandings – New Directions for Standards, Curriculum, Teaching and Assessment. NcTM Regional conference, 2006.
Davis, Jessica Hoffmann. Framing Education as Art: The Octopus Has a Good Day. Teachers college Press, 2005.
Diezmann, carmel. Visual Literacy: Equity and Social Justice in Mathematics Education. centre for Mathematics and science education, Queensland University of Technology, Australia Association for Research in education, 1995.
elkins, James. Visual Literacy. Routledge, 2007.
Gardner, Howard. Frames of Mind: The Theory of Multiple Intelligences. Basic Books, 1983.
Goodman, Nelson. Languages of Art: An Approach to a Theory of Symbols. Oxford University Press, 1976.
Hortin, John A. Theoretical Foundations of Visual Learning. David Moore and Francis Dwyer, eds. educational Technology Publications, 1994.
Howells, R. Visual Culture. Polity Press, 2003.
Laspina, James Andrew. The Visual Turn and the Transformation of the Textbook. Lawrence erlbaum Associates, 1998.
Murphy, stuart J. “Pictures + Words + Math = story.” Book Links. Volume 16, No. 2. (November, 2006). pp. 34–35.
Piaget, Jean, Barbel inhelder and Alina szeminska. The Child’s Conception of Geometry. Basic Books, 1960.
Pinker, steven. Visual Cognition. MiT Press, 1986.
Rand, Paul. A Designer’s Art. Yale University Press, 1985.
Rowan, Thomas and Barbara Bourne. Thinking Like Mathematicians. 1994 Heinemann.
Tufte, edward R. Envisioning Information. Graphics Press, 1990.
Tufte, edward R. Visual Explanations: Images and Quantities, Evidence and Narrative. Graphics Press, 1997.
Tufte, edward R. Beautiful Evidence. Graphics Press, 2006.
Worth, sol. Studing Visual Communication. University of Pennsylvania Press, 1981.