Australian Journal of Mental Health Nursing, 1(1) The Prediction of Depression in the Postpartum Period B. King, J.M. Najman and J. Morrison B. King is Senior Lecturer in Mental Health Nursing at Charles Sturt University - Riverina, J.M. Najman and J. Morrison are Senior Lecturers at the University of Queensland. ABSTR ACT Eight thousand five hundred and fifty-six women enrolled in the Mater-University of Queensland Study of Pregnancy were surveyed to investigate the relationship between potential risk factors for depression and mood states in the postpartum period. Participants were followed from their first antenatal interview until 6 months postpartum. Level of depression was measured at the first interview using the Delusions Signs and Symptoms Inventory (DSSI) and again at 6 months postpartum. A second measure of depression, which was prototypical in nature and related to the maternity blues, was administered retrospectively to cover the 6 month period following parturition. the assessment of independent variables during pregnancy and/or the postpartum period included demographic data and several measures of: neonatal risk, stress and social adjustment. Having excluded from analysis, participants who were depressed at the initial interview a point prevalence for depression of 2.6% (measured by the DSSI) and a prevalence for severe and prolonged postpartum stress of 12.8% (using the prototype measure) was recorded. Data was analysed using categorical modelling techniques and multiple regression analysis. Linear models were constructed to predict, both, DSSI and prototype measures of depression. Predictor variables accounted for 17% of the variance in DSSI scores and only 7% in the prototype measure. Whilst stress and social support formed the core of both models, irrespective of the analysis used, neonatal risk variables were more strongly predictive of ‘blues” related depression. Inconsistencies in results are discussed and the need to differentiate between postpartum depression and depression (unrelated to childbirth) occurring in the postpartum period is proposed. Implications for primary prevention are discussed. Recent evidence suggests that women face a greater risk of developing a psychiatric disorder during the postpartum period than has previously been thought. Further, the majority of these disorders have been categorised into three types of dysphoric mood state, namely, the maternity blues, postpartum depressive psychosis and postpartum (postnatal) depression (Hopkins, Marcus & Campbell, 1984.) The maternity blues have been described as a common transitory condition affecting between 50 and 80 percent of postpartum women (Pitt, 1973; Yalom, Lunde, Moos & Hamburg, 1968; Robin, 1962). In contrast, the rarer and more dramatic disorder of post part urn depressive psychosis occurs at the rate of 2-3 per 1,000 live births (Cox, 1986; Herzog & Detre, 1976). The more relevant and moderate disorder of
Transcript
Australian Journal of Mental Health Nursing, 1(1)
The Prediction of Depression in the Postpartum Period B. King, J.M. Najman and J. Morrison
B. King is Senior Lecturer in Mental Health Nursing at Charles Sturt University - Riverina, J.M. Najman and J. Morrison are Senior Lecturers at the University of Queensland.
ABSTR ACT Eight thousand five hundred and fifty-six women enrolled in the Mater-University of Queensland Study of Pregnancy were surveyed to investigate the relationship between potential risk factors for depression and mood states in the postpartum period. Participants were followed from their first antenatal interview until 6 months postpartum. Level of depression was measured at the first interview using the Delusions Signs and Symptoms Inventory (DSSI) and again at 6 months postpartum. A second measure of depression, which was prototypical in nature and related to the maternity blues, was administered retrospectively to cover the 6 month period following parturition. the assessment of independent variables during pregnancy and/or the postpartum period included demographic data and several measures of: neonatal risk, stress and social adjustment. Having excluded from analysis, participants who were depressed at the initial interview a point prevalence for depression of 2.6% (measured by the DSSI) and a prevalence for severe and prolonged postpartum stress of 12.8% (using the prototype measure) was recorded. Data was analysed using categorical modelling techniques and multiple regression analysis. Linear models were constructed to predict, both, DSSI and prototype measures of depression. Predictor variables accounted for 17% of the variance in DSSI scores and only 7% in the prototype measure. Whilst stress and social support formed the core of both models, irrespective of the analysis used, neonatal risk variables were more strongly predictive of ‘blues” related depression. Inconsistencies in results are discussed and the need to differentiate between postpartum depression and depression (unrelated to childbirth) occurring in the postpartum period is proposed. Implications for primary prevention are discussed.
Recent evidence suggests that women face a greater risk of developing a psychiatric disorder during the postpartum period than has previously been thought. Further, the majority of these disorders have been categorised into three types of dysphoric mood state, namely, the maternity blues, postpartum depressive psychosis and postpartum (postnatal) depression (Hopkins, Marcus & Campbell, 1984.) The maternity blues have been described as a common transitory condition affecting between 50 and 80 percent of postpartum women (Pitt, 1973; Yalom, Lunde, Moos & Hamburg, 1968; Robin, 1962). In contrast, the rarer and more dramatic disorder of post part urn depressive psychosis occurs at the rate of 2-3 per 1,000 live births (Cox, 1986; Herzog & Detre, 1976). The more relevant and moderate disorder of
Australian Journal of Mental Health Nursing, 1(1)
postpartum depression has been chosen as the topic for this paper. The term postpartum depression is reserved for women with a nonpsychotic depressive illness of moderate severity (Cox, 1986). The clinical picture is comparable to depression unrelated to childbirth with most common symptoms being dysphoria, insomnia, appetite change and fatigue (Garwy & Tollefson, 1984). However, some differences in symptomatology have been documented. Pitt, (1968) has described postpartum depression as atypical in that the diurnal variation in mood and pattern of insomn ia are opposite to that found in nonpostpartum depression. Further, it is thought to be marked by somatic symptoms and feelings of inadequacy regarding the maternal role (Cox, 1986). Research into postpartum depression can be loosely classified into studies which place the emphasis on biological, psychological and psychosocial factors. Biological approaches propose that hormonal, endocrinological or neural enzyme changes are responsible for depression occurring in the puerperium. Whilst evidence exists to provide support for this position, findings are inconsistent and fail to demonstrate a direct relationship between biochemical levels and depression (Nott, Franklin, Armitage & Gelder, 1976). Research which has found an association between biochemical levels (tryptophan) and postpartum dysphoric mood has been restricted to cases of maternity blues (Hopkins et al. 1984). Psychological theories focus on either psychodynamic models supported by anecdotal evidence or the study of a diverse range of personality and attitudinal variables di4urced from any coherent conceptual framework. Thus difficulties in the interpretation and generalization of findings are encountered (Hopkins et al, 1984). In view of the above it is fortunate that the third area of psychosocial factors, provides fertile soil for exploration and clearly interpretable findings (e.g. Playfair & Gowers, 11). These variables will be discussed in the section on aetiology. Prevalence and Incidence. Whilst a wealth of qualitative data is available in relation 10 postpartum depression very little quantitative, normative data exists on the topic. This problem is compounded by a lack of standardized assessment strategies for the diagnosis of this disorder. Since assessment methods include self rating/self report questionnaires, symptom counts and clinical interviews it is not surprising that there is little consensus in the literature regarding the prevalance and incidence of postnatal depression. Few studies report the prevalence of postpartum depression preferring to cite incidence rates. This appears surprising as, with a chronic illness such as depression, it would seem more appropriate to ascertain the number of sufferers at a given point in time. However, some guide to the prevalence can be taken from a study by Clarke and Williams (1979) in which a prevalence (measured by the Beck Depression Inventory) of 4% is reported. The incidence of postpartum depression varies in magnitude depending on the diagnostic criteria used. For example, when seeking treatment has been used as the sole indicator, the incidence is as low as 7% (Dalton, 1971). However, when unstandardized interviews have been the single method of assessment, rates of postpartum depression as high as 23% (Uddenberg & Nilsson, 1975) and 30%
Australian Journal of Mental Health Nursing, 1(1)
(Gordon, Kapostins, & Gordon, 1965) have been reported. The results of studies using a single standardized measure are described in Table 1 below. Table 1: The incidence of Postpartum Depression and Assessment Methods Used in Recent Studies. INDICATOR STUDY INCIDENCE SAMPLE SIZE Seeking Treatment Dalton (1971) 7% 189 Brown & Schereshefsky (1972) 10% 64 Symptom Checklist Blair, Gilmore, Playfair, Tisdall &
Atkinson & Rickel (1984) 26% 78 Epidemiology Agc.. Evidence does not support the existence of a high risk age bracket for the development of postpartum depression. However, most studies were conducted several years ago when childbirth was likely to occur in a more restricted age range than is presently the case (Hopkins et al, 1984). In the minority of studies which have demonstrated a relationship between age and postpartum depression, Gordon and Gordon (1959) reported that older postpartum females were more likely to be depressed. In contrast Paykel, Emms, Fletcher and Rassaby (1980) found that younger women were more likely to be depressed and this interpretation is supported by the significant negative correlation (r= (JU.22p) between age and postpartum depression is reported by Hayworth, Little, Carter, Raptopoulos, Priest and Sandler (1980). Marital Status. The majority of research in this area has excluded unmarried women. Most studies, that have included single women, fail to support the notion that a relationship exists between marital status and postpartum depression (e.g. Payken et al, 1980; Hayworth et al, 1980). However, the recent finding of a relationship between divorced states and postpartum depression (O’Hara, 1980) tends to complicate matters. Finally, Hopkins et al (1984) comment that the relationship between the variables may become clearer as the increased incidence of divorce and single women giving birth provide us with a larger pool of unmarried postpartum women to research. Previous Births. Investigators examining the relationship between parity and postpartum depression have reported inconsistent and contradictory results whilst several studies suggest that primiparae experience higher rates of postpartum
Australian Journal of Mental Health Nursing, 1(1)
depression than multiparous women (Pitt, 1968; Gordon et al, 1965; Gordon & Gordon, 1959) others have reported findings in the opposite direction (e.g. Kaij, Jacobsen & Nilsson, 1967). Further, several studies have demonstrated a curvilinear relationship (e.g. Pitt, 1968; Gordon and Gordon, 1959). However, most studies base failed to discover any relationship (Gennaro 1988; Hayworth et at, 1980; Handley, Dunn, Waldron & Baker, 1980; Nilsson & Almgren, 1970; Blair et al, 1970).
Social class. In the now famous treatise on clinical depression, Brown (1979) found that vulnerability to depression was intimately related to social class in nonpostpartum women. However, evidence in the area of postpartum depression is equivocal. Hayworth et al (1980) failed to support any relationship between class and postpartum depression. In contrast, a significant association has been reported by Playfair and Gowers (1981), postpartum women with husbands in a low prestige occupation were more likely to be depressed.
Previous Psychiatric History. Many studies have demonstrated a significant relationship between postpartum depression and previous non-puerperal psychiatric disturbance (Garwy & Tollefson, 1984). For example, Martin (1977) reported that 59% of subjects with postpartum depression had a past history of psychological difficulties. A minority of studies (e.g. Dalton, 1971) have not reported this association.
Other Variables. Investigation of a multiplicity of other variables, for example immigrant status (Kendell, Wainwright, Halley & Shannon, 1976), has failed to reveal any valid and significant relationships.
AETIOLOGICAL FACTORS
Stress
Stressful Life Events. Systematic studies since the late 1950’s (e.g Gordon & Gordon, 1959; Gordon et at, 1965) have shown a consistent relationship between excessive stress and the development of postpartum emotional problems. whilst these studies have been criticised on numerous methodological grounds (Hopkins et al 1984) their findings have been supported by recent, rigorously designed studies of stressful life events (e.g. Paykel et al, 1980; O’Hara, Rehm and Campbell, 1982). Subjective Stress. Since much research has focussed on the notion of stressful life events it therefore seems curious that few studies have examined the role played by the individuals subjective evaluation of daily life tensions. This criticism, however, cannot be leveled at Reeder, Schrama and Dirkens (1973) who tested the validity of the Subjective Stress Scale (SSS) in their international cooperative study of heart disease and found it to correlate highly with a measure of psychosomatic stress developed ion Holland. Further, support for this notion has been provided by the finding that the 555 measures a variable which corresponds to the scientific notion of stress (Schar, Reeder & Dirkens, 1973). One study has examined the notion of perceived stress in relation to the wives of patients suffering their first myocardial infarction (Croog & Fitzgerald, 1978). The findings support the notion that a relationship exists between subjective stress and
Australian Journal of Mental Health Nursing, 1(1)
depression. Unfortunately, to date, no studies of postnatal depression have employed the Subjective Stress Scale. Maternity Blues. The occurrence and severity of maternity blues is reported by some researchers as an indicator that postpartum depression may occur. Paykel et al (1980) found that the maternity blues was common in women that developed postpartum depression. This finding is supported by Playfair and Gowers (1981) who reported that a severe attack of “the blues” is the third most important predictor of postpartum depression. Further, the results of a more recent study (Hapgood, Elkind & Wright, 1988) tend to support the existence of this relationship. Unwanted Pregnancy. The available evidence suggests that women with unwanted pregnancies suffer higher rates of postpartum depression (Braverman & Roux, 1978; Kumar & Robson, 1978; Martin, 1977) and more emotional problems (Laukerman & Van Den Berg. 1960) than those with wanted pregnancies, however, the direction of effect remains unclear. Neonatal Risk A few studies (e.g. Blumberg, 1980) have shown that the stress of a premature, low birth weight or “at risk”, baby may contribute to the development of postpartum depression. However, other studies suggest thai emotional disturbances precipitated by these factors arc mild and transient (e.g. Gennaro, 1988).
Social Support
Dyadic Adjustment. Grossman, Eichler and Winickoff (1980) have shown that quality of relationship is one of the strongest predictors of postpartum adaptation and this is especially so for first time mothers. Marital difficulties have also attracted great interest in the research literature.
Tod (1964) reported that 55% of postpartum females with depression, in his sample complained of marital problems contrasted with only 7% of nondepressed subjects. Further, several studies support the existence of a relationship between marital discord and postpartum depression (e.g. O’Hara, Rehm & Campbell, 1983; Playfair & Gowers, 1981; Kumar & Robson, 1978; Paykel et al 1980).
Social Network. Several studies in nonpostpartum depressives suggest that social support may be construed as protection against depression, total network being particularly significant (Mueller, 1980). Unfortunately, this relationship was not replicated in the one study which specifically examined the association between network size and postpartum depression (O’Hara et al 1983).
Aims of the Present Study Using data from the Mater-University of Queensland Study of Pregnancy (MUSP) the present research aims to determine the prevalence of depression in the postpartum period. Further, the study aims to identify relevant psychosocial factors and examine their aetiological significance.
METHOD
Australian Journal of Mental Health Nursing, 1(1)
Sampling Commencing on 5th January, 1981 all public patients presenting for their first antenatal clinic visit at the Mater Misericordiae Mothers’ Hospital in Brisbane were invited to take part in the study and data was collected from 8,556 consecutive cases. However, since 1% of the original sample refused to participate and 10% did not deliver a baby, an effective sample size of 7,650 remained.
The Mater Hospital is one of two major obstetric units in Brisbane delivering about 4,800 public patients and 3200 private patients per year. The population underrepresents higher family income, upper class, more educated women but is reported to be unbiased in other important respects (Keeping, Najman, Morrison, Western, Williams & Andersen, 1989).
Study Details.
The study was conducted by questionnaire in four phases and a fifth phase comprised of medical record inspection (Keeping, et al, 1988):
Phase 1 Questionnaire number 1 contained 177 items and was provided by research staff at the first antenatal visit. Areas examined at this phase included social background variables (e.g. family income, marital status, age etc.) attitudes towards pregnancy, health habits, dyadic adjustment, quality of life, stress, anxiety and depression. Phase 2 The second questionnaire containing 103 items was provided between the 3rd and the 5th postpartum day. In addition to assessing changes which had taken place during pregnancy this questionnaire was designed to examine social supports, antenatal care and health during pregnancy, labour, attitudes to the baby and future family planning. Phase 3 A third questionnaire of 103 items was mailed to participants 6 months after delivery and this was supported by follow up phone calls and home visits in order to maximise the response rate. In addition to assessing changes taking place during the course of the study this questionnaire extended the research to areas of post natal health (including the severity and duration of postpartum blues) and baby related variables. Phase 4 Women presenting for unbooked or emergency admissions were provided with a modified 148 item questionnaire comprising of items from both phase 1 and phase 2. Phase 5 This entailed the collection of relevant obstetric data (e.g. parity, gravidity and neonatal risk variables) from Hospital records. Only subjects who completed all appropriate phases of the study and variables which are relevant to the prediction of postpartum depression are considered in the present analysis. FORMAT OF QUESTIONNAIRES
Australian Journal of Mental Health Nursing, 1(1)
Description of Variables
The Dependent Variables Postpartum depression was measured both (a) objectively and (b) subjectively. Depression was measured objectively through the use of the depression items contained in the Delusions-Symptom-States Inventory/Anxiety-Depression Scale [DSSI/AD], which has been validated on many occasions (e.g. Bedford, Foulds & Sheffield, 1976; Foulds & Bedford, 1976a; Foulds& Bedford, 1976b; Bedford & Foulds, 1977; Bedford & Foulds, 1978). This scale was administered at three phases of the study. The subjective measure comprised of questions, administered at phase 3, which related to the severity and duration of postpartum blues.
The Independent Variables Where possible use was made of existing or adapted versions of validated scales and indices e.g. the Social Readjustment Rating Scale (Holmes & Rahe, 1967), the Dyadic Adjustment Scale developed by Spanier (1976); the Subjective Stress Scale (See Croog & Fitzgerald, 1978; Reeder et al, 1973; Schar et al, 1973) and items from the Interview Schedule for Social Interaction [ISSI] (Henderson, Byrne and Duncan-Jones, 1981). Standard, shortened and new scales and questions were only used after extensive piloting to assess their reliability and validity.
Data Management Coded and cleaned data for MUSP was stored on the IBM mainframe computer at the Prentice Computer Centre, University of Queensland. Statistical Analysis System (SAS) version 5 (SAS User’s Guide: Basics, 1985, Carry, NC. 5th Edition) was used to analyse the data. Two main statistical techniques were used that is:
1. The maximum likelihood method of the Categorical Data Modelling (CATMOD) procedure was used 10 estimate Odds Ratios (OR) and confidence intervals (CI) through the method of logistic regression. This is a particularly suitable form of analysis when there is a dichotomous dependent variable and categorical independent variables.
The OR is a measure of association which quantifies (the risk of a specific outcome illness in this case) to an individual when exposed to a particular aetiological factor. In the more sophisticate form, employed here, a point estimate of the amount of risk can be calculated in relation to the degree of exposure, and also when the independent variable is controlled by other factors. The CI can be used in conjunction with the OR and provides us with a range of values within which the real value is likely (95% confidence) to fall given the variability of the data.
The above method is superior to the more usual method of significance testing since it not only points out the size of a meaningful parameter estimate but also suggests the precision of that estimate (Thompson, 1987). However, to address the concerns of proponents of significance testing (e.g. Fleiss, 1986) the Chi Square probability values have also been reported.
2. The Ordinary least squares (OLS) method of multiple regression was used to summarise the strength of relationship between the dependent variable (DV) and
Australian Journal of Mental Health Nursing, 1(1)
groups of predictor variables. Further, to identify the group of independent variables (IV) which are most useful for predicting the DV and to estimate values for the DV from values of IV’s.
In addition, the beta weights option of the regression procedure has been chosen as this presents parameter estimates of the strength and significance of the association between the DV and IV’s in a standardised form which allows for comparison.
It is pertinent to note that Ordinary least Squares regression is not technically correct for some types of data. However, in the present study the approximate interval version of variables has been used and independent variables have been entered in an appropriate temporal order. It is suggested that this method provides a meaningful estimate of effects and a test of (he adequacy of the model, despite, in some instances, the use of non-interval variables.
RESULTS
The present analysis is based on data from the Mater-University of Queensland Study of Pregnancy (MUSP). Response rates have been previously reported (Keeping et al, 1988) and are only briefly summarised below.
Of 8,556 women approached only 83 refused to participate or did not complete the phase 1 questionnaires. The response rates for phases 1, 2 and 3 were 99%, 87% and 81% respectively. The main reasons for the fall in returns between the first two phases were miscarriages and migration interstate. Participants were lost in phase 3 due to a change in residence and a lack of forwarding address. Those respondents lost 10 follow up were predominantly young and single.
In addition, records were omitted from analysis if the subject failed to answer more than 4 questions in the depression scale (DSSI) or 3 questions in the dyadic adjustment scale. Of primary importance is the decision that data from all women who were depressed (according to the (DSSI) at phase 1 had been excluded from analysis. Thus this study is concerned with identifying women who become depressed after they become pregnant rather than women whose depression may preexist their pregnancy.
Prevalence. The present study contained two measures of postpartum depression. Firstly, the DSSI was administered at six months postpartum and can therefore be regarded as a conservative measure of point prevalence. The second measure was prototypical in nature and comprised of items relating to the severity and duration of maternity blues.
Point Prevalence Moderate to severe feelings of depression were found to exist in 16% of the sample at the 6 months follow-up and this finding is congruent with similar previously published studies.
Australian Journal of Mental Health Nursing, 1(1)
Prototype Measure of Prevalence The prototypical indicator revealed that 12.8% of the sample reported moderate to severe feelings of depression lasting for several months following the birth of their child.
Comparison of Measures When results from the DSSI and prototype measures were cross tabulated it could be seen that 47 women who were in the depressed group (n = 158) according to the Delusions Signs and Symptoms Inventory were classified by the prototype measure as not depressed. This interesting finding is discussed later in this paper.
Risk of Depression - Categorical Data Modelling Tables 2-9 below report the rate of depression per 1,000 population, number of pregnancies, Odds Ratios (OR) and 95% Confidence Intervals (CI) together with Chi Square probability values, for all groups of independent variables. It should be noted that CI’s containing unity indicate that the depression rate for the contrast group involved may not differ significantly from the rate of depression experienced by the reference group. Note that the reference category is the model group in all instances.
Multiple Regression Analysis
Independent variables were entered into a multiple regression analysis, against uncategorised scores for both dependent variables, in two ways. Firstly, multiple regression coefficients were calculate@ [hr each group of independent variables. Secondly, all 16 independent variables were entered into the model in the hypothesised temporal order. That is:
1. Age 2. Marital status 3. Income 4. Previous pregnancies 5. Previous live births 6. Dyadic adjustment at phase I 7. Pregnancy attitude 8. Life events at phase 1 9. Subjective stress 10. Dyadic adjustment at phase 2 11. Social network size at phase 2 12. Perceived adequacy of social network 13. Life events at phase 2 14. Gestation at delivery 15. Birth weight 16. Days in ICN Results are presented in table 10 (for the Delusions Signs and Symptoms Inventory) and table 11 (for the prototype measure) below. In interpreting these results it is necessary to remember that low scores on the Delusions Signs and Symptoms Inventory equate with greater depression whilst the same is true for high scores on the prototype measure.
Australian Journal of Mental Health Nursing, 1(1)
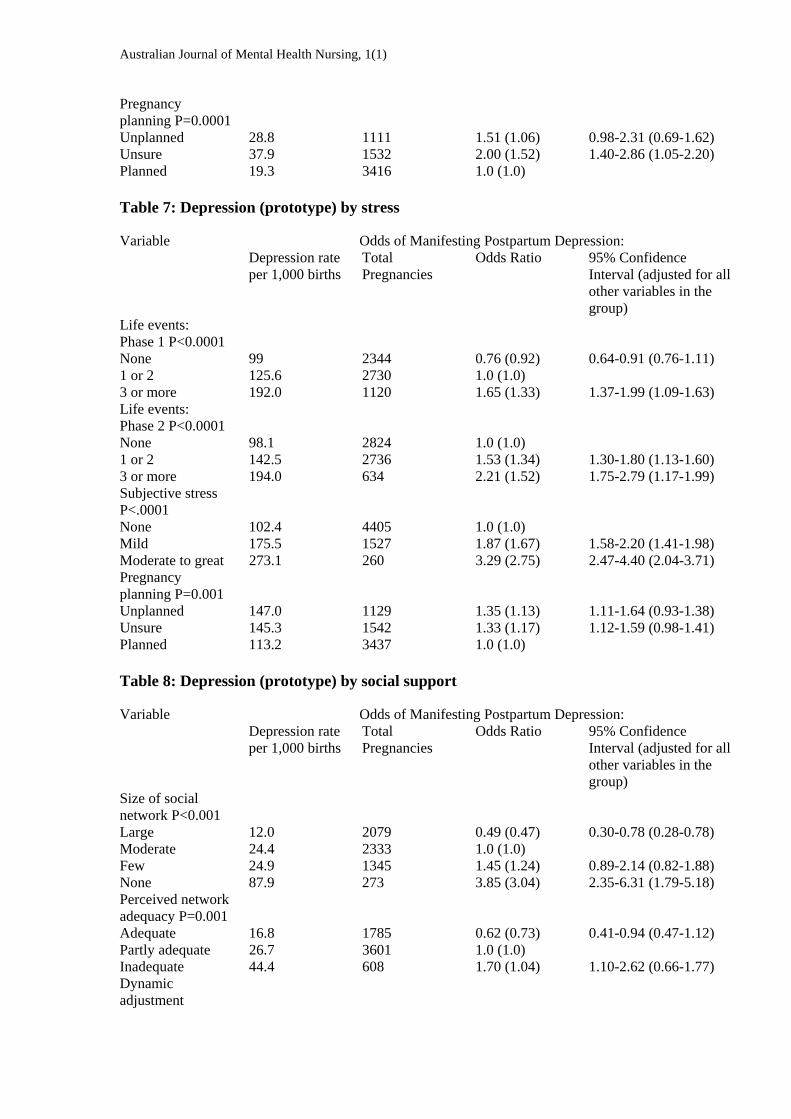
Depression (Signs and Symptoms Inventory) When all variables arc considered together 17% of the variance in depression scores can be explained. Independent variables worthy of note are age, subjective stress, network size and dyadic adjustment at phase 2. Further, life events at phase 2 should receive some consideration. When each group of variables is considered separately variance in the dependent variable is accounted for as follows; stress 12%, social support 10% and social background 2%. It should be noted that subjective stress, network size and dyadic adjustment at phase 2 remain independent and major contributors to postnatal depression (see table 10 for details). Depression (prototype) A relatively small 7% of variance in postpartum depression scores is explained by the total model. Variables of interest are parity, subjective stress, dyadic adjustment at phase 2, network size and life events at phase 2. When groups of variables are entered into the model individually variance accounted for is as follows: Stress 6% Social Support 3% Social Background 1% (see table 11 for details).
Table 2: Depression (DSSI) by Social Background Variables
Odds of Manifesting Postpartum Depression: Variable Depression rate per 1,000 births
Total Pregnancies
Odds Ratio 95% Confidence Interval (adjusted for all other variables in the group)
Age: P=0.043 Under 18 years 46.5 430 1.94 (1.86) 1.17-3.21 (1.03-3.33) 19-25 years 24.5 3101 1.0 (1.0) 26-34 years 25.3 2291 1.03 (0.88) 0.75-1.43 (0.60-1.29) 35 years & over 18.6 323 0.75 (0.45) 0.33-1.74 (0.18-1.12) Never Married 36.5 1207 1.65 (1.53) 1.15-2.35 (1.01-2.34) Now Married 22.5 4761 1.0 (1.0) Prev Married 46.2 130 2.10 (1.63) 0.91-4.89 (0.67-3.97) Income: P=0.067
Not Given 38.6 363 1.72 (1.33) 0.96-3.08 (0.69-2.57) Very Low 41.7 312 1.87 (1.43) 1.02-3.40 (0.74-2.77) Low 30.0 1501 1.33 (1.19) 0.91-1.93 (0.82-1.75) Medium 22.8 3295 1.0 (1.0) High 19.3 674 0.84 (0.94) 0.47-1.53 (0.51-1.73) Prev.Preg P=0.058
Nil 21.8 2061 0.82 (1.24) 0.58-1.18 (0.58-2.69) 1 to 3 26.4 3565 1.0 (1.0) 4 or more 40.5 519 1.56 (1.26) Prev.live Birth
Australian Journal of Mental Health Nursing, 1(1)
P=0.009 Nil 20.7 2558 0.73 (1.24) 0.52-1.02 (0.21-0.94) 1 to 3 28.3 3354 1.0 (1.0) 4 or more 51.5 233 1.86 (1.26) 1.01-3.45 (0.78-7.99)
Table 3: Depression (Prototype) by Social Background
Odds of Manifesting Postpartum Depression: Variable Depression rate per 1,000 births
Total Pregnancies
Odds Ratio 95% Confidence Interval (adjusted for all other variables in the group)
Age: P=0.969 Under 18 years 132.9 429 1.07 (0.88) 0.79-1.44 (0.63-1.22) 19-25 years 125.7 3142 1.0 (1.0) 26-34 years 129.1 2301 1.03 (1.11) 0.87-1.21 (0.93-1.32) 35 years & over 127.3 322 1.01 (1.15) 0.76-1.66 (0.79-1.66) Marital status: P=0.362
Never Married 139.6 1218 1.14 (1.14) 0.95-1.37 (0.92-1.41) Now Married 124.7 4795 1.0 (1.0) Prev Married 137.4 131 1.12 (1.13) 0.68-1.85 (0.67-1.90) Income: P=0.694
Not Given 117.8 365 0.91 (0.90) 0.65-1.28 (0.63-1.29) Very Low 141.1 326 1.12 (1.04) 0.81-1.56 (0.72-1.50) Low 132.8 1514 1.05 (1.04) 0.87-1.26 (0.86-1.24) Medium 127.5 3309 1.0 (1.0) High 114.7 680 0.89 (0.84) 0.69-1.15 (0.65-1.09) Prev.Preg P=0.0006
Nil 143.9 2078 1.28 (1.44) 1.09-1.50 (1.06-1.97) 1 to 3 115.9 3597 1.0 (1.0) 4 or more 142.6 517 1.27 (1.66) 0.97-1.66 (0.20-2.29) Prev.live Birth P=0.066
Nil 136.8 2581 1.13 (0.91) 0.97-1.31 (0.67-1.24) 1 to 3 123.0 3381 1.0 (1.0) 4 or more 90.5 232 0.71 (0.43) 0.45-1.12 (0.25-0.74)
Table 4
Odds of Manifesting Postpartum Depression: Variable Depression rate per 1,000 births
Total Pregnancies
Odds Ratio 95% Confidence Interval (adjusted for all other variables in the group)
Gestation at delivery P=0.106
25 to 28 weeks 0.0 6 0.0 (0.0) 0.0 (0.0) 29 to 32 weeks 75.0 40 3.02 (1.01) 0.92-9.93 (0.00-1.70) 33 to 36 weeks 4.9 203 0.18 (0.10) 0.03-1.33 (0.01-0.81) 37 to 40 weeks 26 4475 1.0 (1.0) 40 weeks and over 27.5 1420 1.05 (1.08) 0.72-1.53 (0.75-1.56)
Australian Journal of Mental Health Nursing, 1(1)
Birth weight P=0.115
1 to 2499 grams 41.0 268 1.64 (2.21) 0.88-3.07 (1.00-4.91) 2500 grams & over 25.4 5875 1.0 (1.0) Days in ICN P=0.261
15+ days 42.4 118 1.67 (0.64) 0.67-41.7 (0.16-2.60) 14 days or less 25.7 6022 1.0 (1.0)
Table 5: Depression (prototype) by neonatal risk variables
Odds of Manifesting Postpartum Depression: Variable Depression rate per 1,000 births
Total Pregnancies
Odds Ratio 95% Confidence Interval (adjusted for all other variables in the group)
Gestation at delivery P=0.000
25 to 28 weeks 667.0 6 13.65 (8.83) 2.49-74.69 (1.30-59.88) 29 to 32 weeks 75.0 39 1.76 (1.48) 0.81-3.85 (0.86-1.86) 33 to 36 weeks 156.1 205 1.26 (1.03) 0.86-1.86 (0.66-1.62) 37 to 40 weeks 127.8 4506 1.0 (1.0) 40 weeks and over 118.3 1437 0.92 (0.93) 0.76-1.10 (0.78-1.12) Birth weight P=0.000
1 to 2499 grams 208.2 268 1.86 (1.88) 1.37-2.52 (1.26-2.79) 2500 grams & over 123.8 5923 1.0 (1.0) Days in ICN P=0.153
15+ days 170.9 117 1.42 (1.59) 0.87-2.32 (0.80-3.16) 14 days or less 126.5 6071 1.0 (1.0)
Table 6: Depression (DSSI) by stress
Odds of Manifesting Postpartum Depression: Variable Depression rate per 1,000 births
Total Pregnancies
Odds Ratio 95% Confidence Interval (adjusted for all other variables in the group)
Life events: Phase 1 P<0.0001
None 10.7 2327 0.44 (0.54) 0.27-0.69 (0.34-0.88) 1 or 2 24.3 2715 1.0 (1.0) 3 or more 62.6 1103 2.68 (1.72) 1.90-3.78 (1.17-2.53) Life events: Phase 2 P<0.0001
None 16.3 2816 1.0 (1.0) 1 or 2 24.4 2705 1.51 (1.07) 1.03-2.20 (0.71-1.59) 3 or more 76.9 624 5.02 (2.38) 3.32-7.59 (1.47-3.86) Subjective stress P<.0001
The present study sought to establish the prevalence of depression in the postpartum period in a large cross section of women. Further, it has clarified the aetiological significance of specific social background, neonatal risk, stress, and social support variables in the development of postpartum depression.
Incidence
The methodology used in the present study did not allow for the quantification of an incidence rate. In lieu of this two measures of prevalence were used. Firstly, a point prevalence of 2.6%, at six months postpartum, was measured using the Delusions Signs and Symptoms Inventory (DSSI). Secondly, a prevalence rate of 12.8% was recorded for women who attributed the start of their depression the postpartum blues and had remained depressed for several months.
Prediction of Postpartum Depression
The findings can be considered by reviewing the two measures of postpartum depression used in this study. When depression scale and prototype scores were cross tabulated some inconsistency was revealed. Thai is approximately 30% of mothers who were classified as depressed according to the DSSI criterion were not regarded as depressed by the prototype measure. In other words, this sub group did not report that their dysphoric mood commenced with the postpartum blues. Thus it appears that a small proportion of women manifest symptoms of depression of a short time before their six month follow-up interview. A much larger proportion of women in the study (over 10% of the sample) report long periods of depression since the birth of their baby.
DSSI Measure of Postpartum Depression A linear model was constructed which predicted 17% of the variance in depression scores. The variables which most strongly predicted this effect were age, subjective
Australian Journal of Mental Health Nursing, 1(1)
stress, stressful life events for the 6 months preceding parturition, social network size and perceived adequacy, and dyadic adjustment after the birth of the child.
The logistic regression method was also used to analyse the data since this also reveals non linear relationships. In addition to variables mentioned above, a greater risk of depression was also found for the ; never married, those with four or more previous live births, women who were unsure about whether the baby was wanted; and those experiencing more stressful life events and poorer dyadic adjustment (measured at phase 1).
Prototype Measure of Postpartum Depression
A linear model utilising the “blues related prototype dependent variable could explain only 7% of the variance in depression scores. The major variables of interest are, number of live births, subjective stress, life events measured at phase 2, social network size and dyadic adjustment alter birth.
CATMOD analysis was also performed on the model and this revealed a greater risk of depression for women who gave birth to a premature or low birthweight baby, those who were unsure about whether or not the baby was wanted, the primigravid and those with four or more previous pregnancies. The implication of the contrast between the variance explained using the different depression indicators is that chronic depression following the birth of a baby may be more biologically determined (and therefore outside the variables used in this study) than is acute depression.
Comparison of Models
In comparing the two models it appears that stress and social support variables play a central explanatory role in both, though the effect of neonatal risk is more evident with the prototype dependent variable.
Some discrepancies between measures can be seen and a similar problem was encountered by earlier researchers (O’Hara, Neunaber & Zekoski, 1984) when diagnostic judge meats could riot he reconciled with scores on the Beck Depression inventory. Further, they could propose no satisfactory explanation for this phenomenon.
In relation to the present study, it is suggested that two groups of depressives have been identified. Firstly, a pure group is comprised of women whose depression commenced at about the time of the postpartum blues and continued for several months or was still evident at six months postpartum.
A second group was identified at the six month follow-up and may be called a mixed group. This contained all persons who were categorized as depressed, by the DSSI measure. However, the methodology employed in the present study did not allow for the time of onset to be isolated and the question of chronicity was neglected. It is suggested that this group comprised of three subcategories. Firstly, there may be a “pure” group whose depression extended to the sixth postpartum month. Secondly, a group of postpartum depressives with recent onset of symptoms unrelated to the ‘blues” . A third group may comprise depressed persons whose depression is recent and unrelated to the pregnancy or postpartum period.
Australian Journal of Mental Health Nursing, 1(1)
A Model of Postpartum Depression
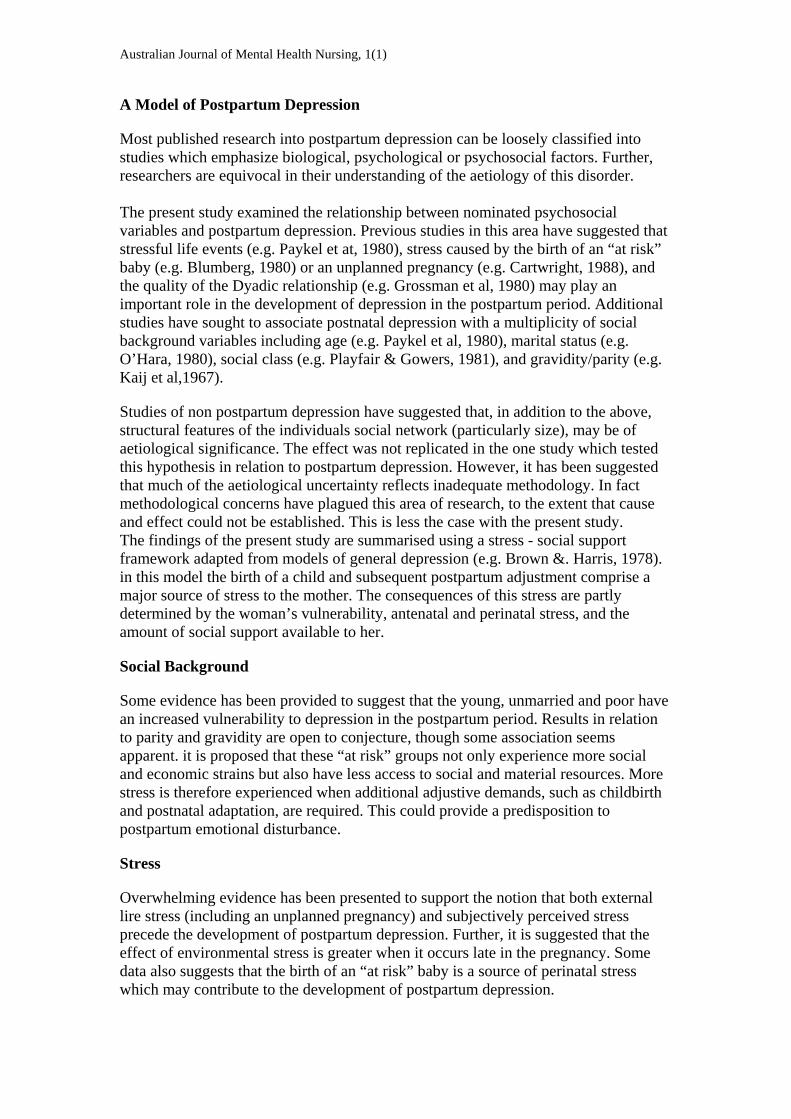
Most published research into postpartum depression can be loosely classified into studies which emphasize biological, psychological or psychosocial factors. Further, researchers are equivocal in their understanding of the aetiology of this disorder. The present study examined the relationship between nominated psychosocial variables and postpartum depression. Previous studies in this area have suggested that stressful life events (e.g. Paykel et at, 1980), stress caused by the birth of an “at risk” baby (e.g. Blumberg, 1980) or an unplanned pregnancy (e.g. Cartwright, 1988), and the quality of the Dyadic relationship (e.g. Grossman et al, 1980) may play an important role in the development of depression in the postpartum period. Additional studies have sought to associate postnatal depression with a multiplicity of social background variables including age (e.g. Paykel et al, 1980), marital status (e.g. O’Hara, 1980), social class (e.g. Playfair & Gowers, 1981), and gravidity/parity (e.g. Kaij et al,1967).
Studies of non postpartum depression have suggested that, in addition to the above, structural features of the individuals social network (particularly size), may be of aetiological significance. The effect was not replicated in the one study which tested this hypothesis in relation to postpartum depression. However, it has been suggested that much of the aetiological uncertainty reflects inadequate methodology. In fact methodological concerns have plagued this area of research, to the extent that cause and effect could not be established. This is less the case with the present study. The findings of the present study are summarised using a stress - social support framework adapted from models of general depression (e.g. Brown &. Harris, 1978). in this model the birth of a child and subsequent postpartum adjustment comprise a major source of stress to the mother. The consequences of this stress are partly determined by the woman’s vulnerability, antenatal and perinatal stress, and the amount of social support available to her.
Social Background
Some evidence has been provided to suggest that the young, unmarried and poor have an increased vulnerability to depression in the postpartum period. Results in relation to parity and gravidity are open to conjecture, though some association seems apparent. it is proposed that these “at risk” groups not only experience more social and economic strains but also have less access to social and material resources. More stress is therefore experienced when additional adjustive demands, such as childbirth and postnatal adaptation, are required. This could provide a predisposition to postpartum emotional disturbance.
Stress
Overwhelming evidence has been presented to support the notion that both external lire stress (including an unplanned pregnancy) and subjectively perceived stress precede the development of postpartum depression. Further, it is suggested that the effect of environmental stress is greater when it occurs late in the pregnancy. Some data also suggests that the birth of an “at risk” baby is a source of perinatal stress which may contribute to the development of postpartum depression.
Australian Journal of Mental Health Nursing, 1(1)
Social Support
Data presented in this study strongly suggests that the lack of social support, in the form of social network size and quality of dyadic relationship, is a causal factor in the development of postpartum depression. However, whilst the presence of a social network and a happy dyadic relationship reduce an individual’s odds of postpartum depression their mode of operation has not been established. The question remains whether this is by a direct or a buffering effect? The implication of the regression model is that these effects appear to be separate and additive.
In summary, the present research strongly suggests that pre and perinatal stress play a contributory role in the causation of depression in the postpartum period. Confirmation that the presence of a well adjusted dyadic relationship lowers the woman’s odds of postpartum depression has been achieved. Further, an association between the individual’s social network and postpartum depression has been established.
Implications for Preventive Programmes and Clinical Practice Depression affects a significant proportion of women in the postpartum period. Further, from a preventive point of view it is irrelevant whether or not the depression is directly associated with, or unrelated to, the birth of a child or postpartum adjustment. What is important is the early identification of “at risk” groups and the development of effective and efficient primary prevention programmes. Further, since primary prevention should be aimed at maximising the individual’s coping ability during periods of life stress. the present research has a number of practical implications at both macro and micro levels..
At the macro level a number of risk factors for postpartum depression have been isolated and this allows the identification of vulnerable groups, which is useful to health planners. Secondly, data suggests some areas are amenable to primary prevention, for example perceived stress, whilst others are not (e.g. social background variables). Lastly, areas where preventive programmes are likely to yield the greatest marginal utility have been identified.
At the clinical level, several benefits are also evident. A number of short easily administered instruments have been used in the present research and these have been reasonably successful in predicting the occurrence of depression. There is no reason why health workers could not include similar screening devices in routine antenatal interviews, since they would not only provide an estimate of risk but also indicate a strategy for prevention with individual clients. Of most interest is the ability of the Subjective Stress Scale to identify vulnerable women at the first antenatal interview. Possible preventive measures in this area could include education in stress management techniques and/or cognitively based therapies. Should the dyadic adjustment scale indicate vulnerability due to marital disharmony, counselling may be given in this regard. If an individual’s social network was found to be inadequate, strategies could be devised to strengthen it. Further, these measures could be tested empirically in the clinical situation.
Finally it is suggested that long periods of depression following childbirth are not uncommon and that upwards of one in ten women manifest such symptoms. The very
Australian Journal of Mental Health Nursing, 1(1)
common occurrence of these symptoms in a public patient sample raises the need for a more systematic approach to the identification and treatment of affected women.
REFERENCES
Atkinson, A.K. & Rickel, A.U. (1984). Postpartum depression in primiparous parents. Journal of Abnormal Psychology, 93, 115-119.
Beck, A.T., Ward, C.H., Mendelson, M., Mock, J., & Erbaugh, J. (1961). An inventory for measuring depression. Archives of General Psychiatry, 15, 387-394. Bedford, A., Foulds, G.A. & Sheffield, B.P. (1976). A new personal disturbance scale (DSSI/sAD). British Journal of Social and Clinical Psychology, 15, 381-394.
Bedford, A., Foulds, G.A. (1977). Validation of the delusions - symptoms - states inventory. British Journal of Medical Psychology. 50, 163-171.
Bedford, A., & Foulds, G.A. (1979). Manual of -the delusions — symptoms - states inventory (OSSI). Windsor: NFSR.
Blair, R.A., Gilmore, J.S., Playfair, H.R., Tisdall, M.W., & O’Shea, M.V. (1970): Puerperal depression: A study of predictive factors. Journal of the Royal College of General Practitioners, 19, 22-25.
Blumber, N.L. (1990). Effects of neonatal risk, maternal attitude and cognitive style on early postpartum adjustment. Journal of Abnormal Psychology, 89, 139-150.
Braverman, J., & Roux, J. (1978). Screening for the patient at risk for postpartum depression. Obstetrics and Gynecology, 52, 731-736.
Brown, G.W. A three factor causal model of depression. In J.E. Barrett (Ed.) (1979), stress and mental disorder. New York. Raven Press.
Brown, G.W., & Harris, T. (1978). Social origins of depression: a study of psychiatric disorder in women. New York: Free Press.
Brown, W.A., & Schereshefsky, P. (1972). Seven women: A prospective study of postpartum psychiatric disorders. Psychiatry, 35, 139-157.
Cartwright, A. (1988). Unintended pregnancies that lead to babies. Social Science and Medicine, 27, 249-254.
Cox, J.L., Connor, Y.M. & Kendell, R.E. (1982). Prospective study of the psychiatric disorders of childbirth. British Journal of Psychiatry, 140, 111-117.
Croog, S.H. & Fitzgerald, S.F. (1979). Subjective stress and serious illness of a spouse: wives of heart patients. Journal of Health and Social Behaviour, 19, 166-178.
Australian Journal of Mental Health Nursing, 1(1)
Cutrona, C.E. (1984). Social support and stress in the transition to parenthood. Journal of Abnormal Psychology. 93, 378-390.
Dalton, K. (1971). Prospective study into puerperal depression. British Journal of Psychiatry, 118, 689-692.
Fleiss, J.L. (1986). Significance tests have a role in epidemiologic research: reactions to A.M. Walker. American Journal of Public Health, 76, 559-560.
Foulds, G.A., & Bedford, A. (1976a). Classification of depressive illness: re-evaluation. Psychological Medicine, 6, 15-9.
Foulds, GA., & Bedford, A. (1976b). The relationship between anxiety - depression and the neuroses. British Journal of Psychiatry, 128, 166—8.
Garvey, N.J. & Tollefson, G.D. (1984). Postpartum depression. The Journal of Reproductive Medicine, 29, 113-116.
Gennaro, S. (1989). Postpartal anxiety and depression in mothers of term and preterm infants. Nursing Research, 37, 82-85.
Gordon, R.E., Kapostins, E.E., & Gordon, K.K. (1965). Factors in postpartum emotional adjustment. Obstetrics and Gynaecology, 15, 158-166.
Grossman, F.K., Eichler, E.E., L.S., & Winickoff, S.A. (1980). Pregnancy, Birth and Parenthood. San Francisco: Jossey-Bass Inc.
Handley, S., Dunn J.H. Waldron, G. & Blake, J.N. (1980). Tryptophan, cortisol and puerperal mood. British Journal of Psychiatry, 136, 498—508.
Hapgood, C.C., Elkind, G.S. & Wright, J.J. (1998). Maternity blues: phenomena and relationship to later postpartum depression. Australia and New Zealand Journal of Psychiatry, 22, 299-306.
Hayworth, J., Little, C., Carter, S.B., Raptopoulos, P., Priest, R.G. & Sandier, N. (1990). A predictive study of postpartum depression: Some predisposing characteristics. British Journal of Medical Psychology, 53, 161—167.
Henderson, S., Byrne, D.G. & Duncan-Jones, P. (1991). Neurosis and the Social Environment. Sydney: Academic Press.
Herzog, A. & Detre, T. (1976). Psychotic reactions associated with childbirth. Diseases of the Nervous System, 31, 229-235.
Holmes, T.H. & Rahe, R.H. (1767). The social readjustment rating scale. Journal of Psychosomatic Research, 11, 213-218.
Hopkins, J., Marcus, N. & Campbell, S. (1984). Postpartum depression: A critical review. Psychological Bulletin, 95, 498—515.
Australian Journal of Mental Health Nursing, 1(1)
Kaij, L., Jacobsen, L., & Nilsson, A. (1967). Postpartum mental disorders in an unselected sample. The influence of parity. Journal of Psychosomatic Research, 10, 317-325.
Keeping, J.D., Najman, J.M., Morrison, J.S., Western, J.S., Williams, G.M. & Andersen, N.J. (1998). A prospective longitudinal study of social, psychological and obstetrical factors in pregnancy, response rates and demographic characteristics of the 8,556 respondents. British Journal of obstetrics & Gynaecology. (In press.)
Kendell, R.E,, Wainwright, S., Hailey. A., & Shannon, b. (1976) The influence of childbirth on psychiatric morbidity. Psychological Medicine, 6, 297-302.
Kumar, R., & Robson, K. (1978). Previous induced abortion and antenatal depression in primiparae: preliminary report of a survey of mental health in pregnancy. Psychological Medicine, 8, 711—715.
Laukeran, V.H., & Van Der Berg, P.R. (1980). The relationship of maternal attitude to pregnancy outcomes and obstetric complications: a cohort study of unwanted pregnancy. American Journal of Obstetric and Gynecology, 136, 374-379.
Martin, M.E. (1977). A maternity hospital study of psychiatric illness associated with childbirth. Irish Journal of Medical Science, 46, 239-244.
Meares, R., Grimwade, J., & Wood, C. (1976). A possible relationship between anxiety in pregnancy and puerperal depression. Journal of Psychosomatic Research, 20, 605-610.
Mueller, D. (1980). Social networks: a promising direction for research in the relationship of social environment to psychiatric disorder. Social Science and Medicine, 14, 147-161.
Nilsson, A., & Almgren, PS. (1970). Para-natal emotional adjustment: a prospective investigation of 165 women, part II. Acta Psychiatrica Scandinavica, 47, 62—141.
Nott, P.M. Franklin, M. Armitage, C., & Gelder, M.G. (1976). Hormonal change and mood in the puerperium. British Journal of Psychiatry, 128, 279—283.
O’Hara, M.W., Neunaber, D.J. & Zekoski, E.M. (1984). Prospective study of postpartum depression; prevalence, course, and predictive factors. Journal of Abnormal Psychology, 91, 158—171.
Paykel, E.S., Emms, E.M., Fletcher, J. & Rassaby, E.S. (l980).Life events and social support in puerperal depression. British Journal of Psychiatry, 136, 339-346.
Pitt, B. (1968). A typical depression following childbirth. British Journal of Psychiatry, 114, 1325—1335,
Australian Journal of Mental Health Nursing, 1(1)
Pitt, B. (1973). Maternity blues. British Journal of Psychiatry, 122, 431-433.
Playfair, H.R., & Gowers, J.I. (1981). Depression following childbirth – a search for predictive signs. Journal of the Royal College of General Practitioners, 31, 201-208.
Reeder, L.G., Schrama, P.G.M., & Dirkens, J.M. (1973). Stress and cardiovascular health: an international co-operative study - 1. Social Science and Medicine, 7, 573-574.
Rees, W.V. & Lutkins, S.G.. (1971). Parental depression before and after childbirth, Journal of the Royal college of General Practitioners, 21, 20 - 31.
Robin, A.A. (1962). The psychology changes of normal parturition. Psychology quarterly, 36, 129-150.
SAS User’s Guide: Statistics (1985). SAS Institute, Cary NC.
Schar, M. Reeder, L.G. & Dirkens, J.M. (1973). Stress and cardiovascular health: an international co-operative study —2. The male population of a factory at Zurich. Social Science and Medicine, 7, 585-603.
Spanier, G.B.. (1976). Measuring dyadic satisfaction. Journal of Marriage and the family, 38, 15-35.
Thompson, W.D. (1987). Statistical criteria in the interpretation of epidemiologic data. American Journal of Public Health, 77, 191-194.
Tod, E.D.M. (1964). Puerperal depression: a prospective epidemiological study. The Lancet, 2, 1264-1266.
Uddenberg, N., & Nilsson, L. (1975). The longitudinal course of para-natal emotional disturbance. Acta Psychiatrica Scandinavica, 52, 160-169.
Yalom, I.D., Lunde, D,T., Moos, R.H. & Hamburg, V.A. (1968). Postpartum blues syndrome: a description and related variables. Archives of General Psychiatry. 18, 16-27.