The South African Institute of Mining and Metallurgy RISE OF THE MACHINES - THE 'STATE OF THE ART' IN MINING MECHANISATION, AUTOMATION, HYDRAULIC TRANSPORTATION AND COMMUNICATIONS G S Harper and MO 'Brien THE PREDICTION OF UNDERGROUND DRILLING NOISE G S Harper, M O'Brien CSIR Natural Resources and the Environment Abstract Noise in general and drilling noise in particular has received increasing attention within the South African Mining industry during the last 10-15 years. The Mine Health and Safety Committee l , during their 2003 annual summit, established two significant milestones to be met by December 2008 and December 2013. The 2008 milestone target is that of no more than ten per cent deterioration in hearing among occupationally exposed individuals, whereas the 2013 milestone target is that of less than 110 dB sound pressure levels at any place in the workp1ace. Whilst these targets relate to general noise within the mining industry it is widely believed that the most significant source of noise contributing to noise induced hearing loss (NIHL) amongst the underground workforce, is that of pneumatic rock drills. Data pertaining to the noise emission level of any machine is generally reported as either a sound pressure level or a sound power level of a single machine measured under free field conditions as defined in Appendix 3 of SABS-ISO 3744 2 . However, rock drills are seldom used in isolation and underground conditions cannot be considered as free field. A methodology for the selection of rockdriIls on the basis of total operating cost has been developed however this paper focuses on the noise elements of the generic methodology and provides a model for the prediction of .the composite sound pressure level and the equivalent noise exposure levels of groups of individuals from machines, used singly and in combination in an underground environment based on the sound pressure level determined according to SABS-ISO 3744 under free-field conditions. The methodology includes provision for the consideration of the effect of hearing protection devices and the use of multiple machines in combination and provides an indication of the potential costs of hearing compensation. 1. Introduction The current exposure limits of mine workers to physical pollutants, under the Mine Health and Safety Act 3 is 85 dB LAeq,8h, with a peak sound pressure level of 135 dB(A). However, the sound pressure level (SPL) of machines are generally determined according to the methods and procedures defined in SABS-ISO 3744 under free field conditions as defined in Appendix 3 of the same standard. While SPL and sound spectrum data obtained by this method are extremely useful for sound engineering purposes and direct comparison between different machines the results can only be considered as an indication of the SPL level that any machine may produce during operation in an underground environment. In particular the limitations of the free field method of SPL determination with regard to the prediction of an expected SPL in the underground environment are as follows: Page 1
Transcript
The South African Institute of Mining and Metallurgy RISE OF THE MACHINES - THE 'STATE OF THE ART' IN MINING MECHANISATION, AUTOMATION, HYDRAULIC TRANSPORTATION AND COMMUNICATIONS G S Harper and MO 'Brien
THE PREDICTION OF UNDERGROUND DRILLING NOISE
G S Harper, M O'Brien CSIR Natural Resources and the Environment
Abstract
Noise in general and drilling noise in particular has received increasing attention within the South African Mining industry during the last 10-15 years. The Mine Health and Safety Committee l
, during their 2003 annual summit, established two significant milestones to be met by December 2008 and December 2013. The 2008 milestone target is that of no more than ten per cent deterioration in hearing among occupationally exposed individuals, whereas the 2013 milestone target is that of less than 110 dB sound pressure levels at any place in the workp1ace. Whilst these targets relate to general noise within the mining industry it is widely believed that the most significant source of noise contributing to noise induced hearing loss (NIHL) amongst the underground workforce, is that of pneumatic rock drills. Data pertaining to the noise emission level of any machine is generally reported as either a sound pressure level or a sound power level of a single machine measured under free field conditions as defined in Appendix 3 of SABS-ISO 37442
. However, rock drills are seldom used in isolation and underground conditions cannot be considered as free field. A methodology for the selection of rockdriIls on the basis of total operating cost has been developed however this paper focuses on the noise elements of the generic methodology and provides a model for the prediction of .the composite sound pressure level and the equivalent noise exposure levels of groups of individuals from machines, used singly and in combination in an underground environment based on the sound pressure level determined according to SABS-ISO 3744 under free-field conditions. The methodology includes provision for the consideration of the effect of hearing protection devices and the use of multiple machines in combination and provides an indication of the potential costs of hearing compensation.
1. Introduction
The current exposure limits of mine workers to physical pollutants, under the Mine Health and Safety Act3 is 85 dB LAeq,8h, with a peak sound pressure level of 135 dB(A). However, the sound pressure level (SPL) of machines are generally determined according to the methods and procedures defined in SABS-ISO 3744 under free field conditions as defined in Appendix 3 of the same standard. While SPL and sound spectrum data obtained by this method are extremely useful for sound engineering purposes and direct comparison between different machines the results can only be considered as an indication of the SPL level that any machine may produce during operation in an underground environment. In particular the limitations of the free field method of SPL determination with regard to the prediction of an expected SPL in the underground environment are as follows:
Page 1
The South African Institute of Mining and Metallurgy RISE OF THE MACHINES - THE 'STATE OF THE ART' IN MINING MECHANISATION, AUTOMATION, HYDRAULIC TRANSPORTATION AND COMMUNICATIONS G S Harper and MO 'Brien
It SPLs are detennined under free field conditions to specifically remove any reverberation effects and sound reflection from nearby surfaces;
It the machines are evaluated in isolation; .. the machines are operated at the design operating pressure; .. the machine perfonnance parameters such as drilling rate are not recorded; and It the machines are operated under ideal conditions.
In order to predict the resultant SPL distribution resultant from the operation of multiple rock drills in a stoping environment the free field detennined sound level spectra must be modified to account for the effect of reverberation from the hanging and footwall and the attenuation of the sound with distance from the source. It is necessary to consider the SPL spectrum because both reverberation and distance attenuation will be frequency specific. A combination of the equivalent SPL and exposure time of an individual enables a qualitative prediction of the probability of that individual suffering NIHL to a level that would qualify for compensation.
2 Methodology
A simplified generic methodology for the selection of rock drills based on free field detennined SPLs is shown schematically in Figure 1. To predict the equivalent noise exposure of a particular group of individuals (classified according to j ob function within the stope) requires knowledge of the SPL distribution within the stope and the location and dwell time of the individual within that distribution. The probability of an individual dev~loping NIHL can then be detennined from the exposure level.
3 Theory
3.1 Determination of A-weighted sound pressure level
Continuous or total A-weighted SPL is calculated by logarithmically summing SPLs at individual frequencies, according to the following relationship:
LpA = 1 0 10g[~) OO,I(Lpj+AJ] (1)
where:
Lp j is the frequency band pressure level, in decibels, in band j, and
A j is the A-weighting value at the centre frequency of band j, as given in Table I.
Page 2
The South African Institute of Mining and Metallurgy RISE OF THE MA CHINES - THE 'STATE OF THE ART' IN MINING MECHANISATION, AUTOMATION, HYDRAULIC TRANSPORTATION AND COMMUNICATIONS G S Harper and MO 'Brien
Octave- One-third- . A-weighting band center octave band values frequencies center Aj
frequencies Hz Hz dB
50 -30,2 63 63 -26,2
80 -22,5 100 -19,1
125 125 -16,1 .160 -13,4 200 -10,9
250 250 -8,6 315 -6,6 400 -4,8
500 500 -3,2 630 -1,9 800 -0,8
1000 1000 0 1250 0,6 1600 1,0
2000 2000 1,2 2500 1,3 3150 1,2
4000 4000 1,0 5000 0,5 6300 -01
8000 8000 -1,1 10000 -2,5
Table I A-weighting attenuation values
3.2 Determination of sound pressure level From the total A-weighted SPL measured for a machine or the level at each frequency
of interest, the average SPLs, L ~ and L; , over the measurement surface are calculated - -
from the levels measured for drills and background noise (L~i and L;i , respectively)
using Equations 2 and 3:
L~ = 1 0 109[~ i 1 OO'lL~i] N i=l
(2)
L; = lOlOg[~ i100,lL;i] N i=l
(3)
where:
L~ is the sound pressure level averaged over the measurement surface, in decibels,
Page 3
The South African Institute of Mining and Metallurgy RISE OF THE MACHINES - THE 'STATE OF THE ART' IN MINING MECHANISATION, AUTOMATION, HYDRAULIC TRANSPORTATION AND COMMUNICATIONS G S Harper and MO 'Brien
with the source under test in operation,
L~ is the sound pressure level of the background nOIse averaged over the
measurement surface, in decibels, L~i is the sound pressure level measured at the ith microphone position, in decibels,
L~i is the sound pressure level of the background noise measured at the ith
microphone position, in decibels, and N is the number of microphone positions.
Decision on Drill type I PPD
combination
I I I I I I I
Relative Potential Cost of PPD &
Occupational Operational Hearing
Costs cost of Compensation Conservation
Health Drills Costs Programme
and Safety
Cost Determination 1 I
~J-L AIN"",ti," PPD Z by Selection
PPD
Equivalent t >85 dB
Noise Neq .' Exposure Required Y~s Attenuation
Reverberation Sound Exposure & Pressure
Attenuation Level Duration
i 1 SPL Location of -+-- Job Data Individual Function
l Underground Surface
Drill Drill Drill ~ Drill +- Type Pe rformance
Measurements Measurements
Figure 1 Methodology
3.3 Correction for background noise
The background noise correction factor K (for total A-weighted SPL or for individual frequency bands) is calculated according to the following equation:
Page 4
The South African Institute of Mining and Metallurgy RISE OF THE MACHINES - THE 'STATE OF THE ART' IN MINING MECHANISATION, AUTOMATION, HYDRAULIC TRANSPORTATION AND COMMUNICATIONS G S Harper and MO 'Brien
Kl =-lOlog(l-lO-O,lAL) (4) where:
M=L~-L; (5)
If IJ.L >15 dB, no correction is required.
3.4 Environmental correction
The environmental correction factor K2 (for continuous/total A-weighted SPL or for SPLs at individual frequencies) is given by:
* K2=Lw-L~ ~ where:
L~ is the environmentally uncorrected sound power level of the reference sound
source, determined using the value 0 for K 2' and
LWr is the calibrated sound power level of the reference sound source (1 pWor 10 -12
W), in decibels.
Page 5
The South African Institute of Mining and Metallurgy RISE OF THE MA CHINES - THE 'STATE OF THE ART' IN MINING MECHANISATION, AUTOMATION, HYDRAULIC TRANSPORTATION AND COMMUNICATIONS
Figure 3 Typical stope drilling conditions
Environmental noise correction factors for surface measurements under free field conditions are generally determined to be zero but must be <2 dB for compliance with SABS-ISO 3744.
It is evident from Figures 2 and 3 that there is a marked difference between the free field conditions of Figure 2 and typical stope drilling conditions as shown in Figure 3.
3.5 Equivalent exposure
The equivalent exposure of an individual can be determined from the following relation:
L = 1 0 10g[~ Tf1 OO,lLp(t) dt] peq,T T (7)
° where:
Lpeq,T is the equivalent sound pressure level of a continuous steady sound that,
within a measurement time interval T, has the same mean-square sound pressure as a sound under consideration which varies with time,
L p{t) is the sound pressure at time t, and
T is the sampling period.
3.6 Underground attenuation of noise with distance
In free field conditions the attenuation of SPL with distance from the source is inversely proportional to the distance from the; source. However, in an underground environment this attenuation may be expected to be significantly different as shown in Figure 4. Furthermore, the attenuation of SPLs with distance may also be a function of frequency with lower frequencies being less attenuated resulting in the spectral distribution of the
Page 6
The South African Institute of Mining and Metallurgy RISE OF THE MACHINES - THE 'STATE OF THE ART' IN MINING MECHANISATION, AUTOMATION, HYDRAULIC TRANSPORTATION AND COMMUNICATIONS G S Harper and MO 'Brien SPL at a distance being different from that at the source and having a different propensity to NIHL.
Mean SPLs at various distances from a typical muffled rockdrill operating with a 600 kPa compressed air supply in an underground stope are given in Table IV and illustrated in Figure 6, as determined by Franz et a14
.
Linear regression of the data presented in Figure 6 yields a relationship of the form:
SPLx = SPLof(x,j) (8) where: SPLo is the sound pressure level (dB or dBA) at the sound source,
SPLx is the sound pressure level (dB or dBA) at distance x metres from the source, and
I(x,}) is an attenuation function of X ,the distance from the source, in metres andj, the frequency band.
Free Field
Semi-Reverberant
Reverberant
Figure 4 Effect of environment on SPLs and attenuation with distance
Page 7
The South African Institute of Mining and Metallurgy RISE OF THE MA CHINES - THE 'STATE OF THE ART' IN MINING MECHANISATION, AUTOMATION, HYDRAULIC TRANSPORTATION AND COMMUNICATIONS G S Harper and MO 'Brien
Freq. Mean SPL for a typical muffled rockdrill operating at 600 kPa in a stope Distance from drill (m)
Figure 5 SPL spectra of a standard pneumatic rockdrill under free field (surface) and underground stoping conditions at air supply pressures of 350, 450 and 550 kPa
3.7 Sound pressure level distribution
The linear or A-weighted SPL at any given distance from a noise source operating in a stope can be obtained from the following relation:
(9)
where:
Lpx is the sound pressure level (dB or dBA) at distance x from the source, and
Page 8
The South African Institute of Mining and Metallurgy RISE OF THE MACHINES - THE 'STATE OF THE ART' IN MINING MECHANISATION, AUTOMATION, HYDRAULIC TRANSPORTATION AND COMMUNICATIONS G S Harper and MO 'Brien
Lpo is the sound pressure level (dB or dBA) of the source.
For multiple sources SPL is given by Equation 10:
N Lp = lOlogLIOO,lLpoJ(xi,j)
(10) i=l
where:
Lp is the sound pressure level (dB or dBA) at position p ,
L pOi is the sound pressure level (dB or dBA) of the ith source, and
Xi is the distance in metres from the position p to the ith source.
Equation 10 permits calculation of SPL for one or more sources, at any location in a stope.
3.8 Individual Noise Exposure Level
By using Equation 7, L eq can be determined for an individual stope team member
from the sum of his/her time-weighted exposure to various SPLs divided by the sampling interval, as given in Equation 11:
where:
Leq is the equivalent continuous sound pressure level,
T is the total exposure time,
N is the number of samples,
Lpi is the sound pressure level of the ith sample, and
t i is the duration of the ith sample.
(11)
Equivalent exposure level for a stope team member is determined by the SPL at locations in the stope where the individual works or travels, and the time spent at each of these locations. Equation 11 is used to calculate SPL at all relevant locations, for a single source or multiple noise sources whereas the time spent by an individual at various locations may be determined by random sampling work-study methods or via a distribution model. Since the distribution of individuals within a stope is strongly site specific and dependent on both the mining sequence and the composition of the stope crew a calculated distribution has been used. The distribution probability of individuals has been calculated on the basis of the individual's job function and the application of the following assumptions and conditions:
Page 9
The South African Institute of Mining and Metallurgy RISE OF THE MA CHINES - THE 'STATE OF THE ART' IN MINING MECHANISATION, AUTOMATION, HYDRAULIC TRANSPORTATION AND COMMUNICATIONS G S Harper and MO 'Brien
• Rockdrill operators (RDOs) will always be within one metre of a rockdrill; III Non-rockdrill operators (NRDOs) will never be within one metre of a rockdrill;
and III NRDOs will prefer to be at locations away from a rockdrill.
Conditional statements can represent the first two assumptions, whereas the third can be represented by an inverse relationship. Applying these representations yields the results illustrated in Figures 8 and 9
3.9 Total exposure time
The exposure of an individual as calculated from Equation 11 is determined by total exposure time, which is the time taken to drill the required number of face holes in the panel. Therefore, drilling time is a function of the number of holes required for blasting and the drilling rate of the rock drills. The time taken to drill a 1,1 m hole comprises the following elements:
ID Collaring time;
11 Drilling time;
III Re-stinging time; and
III Moving time (for over travel and re-positioning).
Total exposure time for members of the stope team is determined by the following relationship:
T - Nholes
Total - (N D ) Drills' r
(12)
where:
TTotal is the total exposure time in hours,
Nholes is the total number of holes to be drilled,
N is the total number of rockdrills used simultaneously, and Drills
Dr is the drilling rate of the rockdrills used in holes per hour.
3.10 Determining exposure level of individuals
Defining a location Si,} in a stoping panel where i and j are the lateral and horizontal
coordinates, respectively, it follows that:
t i ,} = p;,} .TTolal (13)
where: t i ,} is the duration of the exposure at location (i, j) ,
p;,} is the probability that an individual is located at (i, j) , and
Page 10
The South African Institute of Mining and Metallurgy RISE OF THE MACHINES - THE 'STATE OF THE ART' IN MINING MECHANISATION, AUTOMATION, HYDRAULIC TRANSPORTATION AND COMMUNICATIONS G S Harper and M O'Brien
TTotal is the total exposure time in hours from Equation 12.
From Equation 10, used to determine SPL for a number of sources, the SPL at locations (i and j) can be calculated as follows:
NDrills ~ L .. = 101 "" 1 OO,ILpso(I-0,178-yxs+Ys)
PI,} og ~ (14) s=1
where: L pi,} is the sound pressure level (dB or dBA) at location (i, j) ,
Lpso is the sound pressure level of the sth source,
Xs is the lateral displacement from the sth source,
Ys is the horizontal displacement from the sth source, and
N is the total number of sources. Drills
By substituting LPi for Lpi,} and ti for ti,} in Equation 11 the equivalent noise exposure
level of an individual can be determined.
3.11 Exposure risk
Using the calculated equivalent noise exposure level of an individual the probability of that individual becoming hearing impaired can de ascertained from table II extracted from ISO 1999-1975(E)4. Combining the exposure risk from table II with current compensation values enables a prediction of the potential cost of exposing individuals to the calculated equivalent exposure level.
Equivalent Risk, %, or Percentages continuous Total % with
sound impaired hearing Years of exposure level
0 5 10 15 20 25 30 35 40 45 db (A)
a) !Risk, % 0 0 0 0 0 0 0 0 0 0 < 80
!rotal% with b) 1 2 3 5 7 10 14 21 33 50 impaired hearin1!
a) Risk, % 0 1 3 5 6 7 8 9 10 7 85
!rota I % with b) 1 3 6 10 13 17 22 30 43 57 impaired hearinO"
a.) Risk, % 0 4 10 14 11: ~v 16 18 20 21 15
90 !r otal % with
~) 1 6 13 19 23 26 32 41 54 65 impaired hearing
a) jRisk, % 0 7 17 24 28 29 31 32 29 23 95
!rotal % with Ib) 1 9 20 29 35 39 45 53 62 73
impaired hearing
a) jRisk, % 0 12 29 37 42 43 44 44 41 33 100
!rotal % with b) 1 14 32 42 49 53 58 65 74 83 impaired hearing
Page 11
The South African Institute of Mining and Metallurgy RISE OF THE MACHINES - THE 'STATE OF THE ART' IN MINING MECHANISATION, AUTOMATION, HYDRAULIC TRANSPORTATION AND COMMUNICATIONS G S Harper and MO 'Brien
a) Risk, % 0 18 42 53 58 60 62 61 54 105
Total % with Ib) imoaired hearing
1 20 45 58 65 70 76 82 87
a) Risk, % 0 26 55 71 78 78 77 72 62 110
Total % with ~) impaired hearing
1 28 58 76 85 88 91 93 95
a) Risk, % 0 36 71 83 87 84 81 75 64 115
Total % with ~) impaired hearing
1 38 74 88 94 94 95 96 97
Table II ISO 1999-1975 (E) Table for the estimation ofNIHL risk
4 Results
4.1 Underground environment effects
41
91
45
95
47
97
The SPL spectra of several rock drills were determined under free field conditions and in an underground stoping environment at a range of compressed air supply pressures. The results for a common non-muffled pneumatic rockdrill are shown in Figure 5 and demonstrate both the increase in overall SPLs resulting from the environmental effects and the fact that there is little change in the shape of the SPL spectrum. A summary of the increase in overall SPL level resulting from underground environmental effects is shown in table III from which it can be noted that an underground stoping environment produces an increase in overall SPL of 5-12 dBA depending on the drill type and the air supply pressure.
Rockdrill Type Air Supply Free field Underground Change Pressure SPL SPL (kPa) (dBA) (dB A) (dBA)
Standard 350 104 112 8
pneumatic 450 107 116 9 550 109 119 10
Muffled 350 96 108 12
pneumatic (a) 450 100 108 8 550 101 110 9
Muffled 350 97 102 5
pneumatic (b) 480 101 106 5 550 102 108 6 ..
Table III SPL results of several rockdnlls determmed under free field condItIOns and a stoping environment at different air supply pressures.
4.2 Underground attenuation
Franz et al5 measured the underground attenuation of SPL of a pneumatic rockdrill as a function of frequency and distance form source and produced the results shown in Figure 6. The data presented in Figure 6, combined with data obtained by Harper6 was subjected to a multi dimensional regression analysis to determine the relationship f(x, j) required for the solution of equation 10.
Page 12
The South African Institute of Mining and Metallurgy RISE OF THE MACHINES - THE 'STATE OF THE ART' IN MINING MECHANISATION, AUTOMATION, HYDRAULIC TRANSPORTATION AND COMMUNICATIONS G S Harper and MO 'Brien
4.3 Drilling rate
To detennine the total exposure time of any individual member of the stope crew from equation 12 data is required on the drilling rates of the rock drills under consideration. The drilling rates of various rockdrills in a stope using a range of compressed air supply pressures was detennined by Harper6 as shown in Figure 7.
110
105
100
~ ~ ~ ::::::--
---1 ~ 1il 95
:=!. ..J Q. V) 90
'- ~ '----'~
~ ~
85
80 -------~ -75
o 2
-0-63 Hz -0-125 Hz -cr-250 Hz
~ -<>-500 Hz
~ ~ -+-1000 Hz --2000 Hz
:----..... -.1.-4000 Hz
~ :--.. __ 8000Hz
r----, .. ........ ~ ~
-'""----....; '-
r----'--
4 5
DIstance (m)
6
.:----.... -"
------ ............
7 8
~ ........ ~
9 10
Figure 6 spL attenuation in a stope based on data from Franz et al
Figure 7 Drilling rate for various rock drills at a range of air supply pressures
Page 13
The South African Institute of Mining and Metallurgy RISE OF THE MACHINES - THE 'STATE OF THE ART' IN MINING MECHANISATION, AUTOMATION, HYDRAULIC TRANSPORTATION AND COMMUNICATIONS G S Harper and MO 'Brien
4.4 Individual Exposure
The individual equivalent exposure level for a stope team member is determined by the SPL at locations in the stope where the individual works or travels, and the time spent at each of those locations. Equation 11 is used to calculate SPL at all relevant locations, for a single or multiple noise sources, whereas the time spent at these locations are determined from the calculated probability distributions shown in figures 8 and 9.
0.005
0.0045
0.004
0.0035
~ 0.003 :c III .c
0.0025 e a.
0.002
0.0015
0.001
0.0005
0 15 10 5 0 5
Distance from source (m) 10 Distance from
face (m)
Figure 8 Probability oflocation ofNRDOs within a stope relative to a noise source.
~ 0.15
:c III .c e a.
15 10 5 o 5
Distance from source (m) 10
Distance from fac9 (m)
Figure 9 Probability oflocation ofRDOs within a stope relative to a noise source.
Page 14
The South African Institute of Mining and Metallurgy RISE OF THE MA CHINES - THE 'STATE OF THE ART' IN MINING MECHANISATION, AUTOMATION, HYDRAULIC TRANSPORTATION AND COMMUNICATIONS G S Harper and MO 'Brien
4.5 Model Development
Using the outline methodology of Figure 1 and equations 1 to 14 a spreadsheet based computer model that analyses the noise generated by multiple sources in a confined environment and computes a spatial sound pressure distribution around the sources. Input data includes the sound pressure spectral distribution, the number of drills running and their location along the face, the location of the operators and assistants relative to the drill and face, the attenuation characteristics of any HPDs that may be worn, as well as the drilling time anticipated as a result of the drill's penetration rate. The output from the program includes a graphic representation of the sound pressure levels within the area, the exposure of the drill operator( s) and assistants and the anticipated compensation payable should the HPDs be inadequate or not worn.
Face Holes Shift Duration hrs Drill Prod Rate holeslhr Max shift duration
Frequenc s~~~ce y (HZ) (dB)
63Hz
125Hz
250 Hz
500 Hz 1000 Hz
2000 Hz
4000 Hz
8000 Hz
Total SPL
180 9.0
20
UG
No Position on face m sources Source 0 Working Dlst from Face m) 0 Exposure
(y) 25
Figure 10 Example input screen
10 o o
Equivalent Exposure LUll
Operator '" '.;11;>;~
Other F; /': .'101:2
15 20 o o
25
o
Stoping Crew Composition
<\t375 IAvg. Coml R 14,6211 2004r-=-_---,,_....,.,
Compensation cost c:;ompensatlon
costs/100 employees over 25 years
Operator tR;:h2t>4i7ZQ Other ::U'l.fi65;Z60
per 100 stoping employes over 25
years
30 o o
.. 8
An example input screen to this model is shown in Figure lOin which the user input areas are coloured green. The SPL distribution generated from this sample input data is shown in Figure 11 whereas Figure 12 shows the SPL distribution when three machines are used at a spacing of 10 metres.
Page 15
The South African Institute of Mining and Metallurgy RISE OF THE MACHINES - THE 'STATE OF THE ART' IN MINING MECHANISATION, AUTOMATION, HYDRAULIC TRANSPORTATION AND COMMUNICATIONS G S Harper and MO 'Brien
;;t m :E. ..J Q. Ul
115.0
o 5 10
SPL Distribution
15 Distance (m)
20 25
Figure 11 SPL distribution for the input data from Figure 10
~ ~ ..J Q. Ul
o 5 10
SPL Distribution
15 Distance (m)
20 25
Distance from face (m)
Distance from face (m)
Figure 12 SPL distribution for the input data from Figure 10 but with three identical machines in operation at a spacing of 10 metres
5. Discussion
The exposure level predicted by the model for a RDO operating a standard pneumatic rockdrill without HPDs in a stope environment with two further identical machines operating either side at a distance of 5 metres is 116.4 dBA which is in reasonable agreement with the 117.5 dBA measured under actual conditions. However a more
Page 16
The South African Institute of Mining and Metallurgy RISE OF THE MACHINES - THE 'STATE OF THE ART' IN MINING MECHANISATION, AUTOMATION, HYDRAULIC TRANSPORTATION AND COMMUNICATIONS G S Harper and MO 'Brien appropriate validation of the model would be a comparison of the model output with the results from personal samplers worn by both RDOs and NRDOs
Face Holes 180 No Position on face m 5 10 15 20 25 30 F.:S;:;hift~Du::::ra:;;ti""on""h""rs",")+--i3F:i.0i-i sources fus;:;ou;;;;rc::'::e::":::':':':::::~!f-ii-I'--"*0-t--T1 -+-~Ii-+...!i---;f-*"-+--:::;:...-J Drill Prod Rate 20 Working 25 fD;:;:iSc:..;t f.:.::ro""m:.:.F::,::ac::;,.e ""m"-'-.:.--L........::_.L--.:. _ _'_.....::..____�_..::.--'---'~_'_.....::..____I
F.;h;::;,ole::.;:S:;,:Ih",r .",,-,=:-f_.,.......-iExposure F Max shift dUration (y) 25 Y
Frequenc y(HZ)
63 Hz
125 Hz
250 Hz
500 Hz 1000 Hz
2000 Hz
4000 Hz
8000 Hz
Total SPL
Surface UG UG St~:~rd HPD User Source SPL Environ. SPL Values SPL (dB) effect dBA Zero I 'V dBA dBA
107.2 20.0 116.3 9.0 9.0 116.3
Equivalent Exposure L .. '1
Operator I· ... • ·:·'°112:7 Other F-' ., ·104:0
IAvg. coml R 14,6211
compensation costs/100 employees
over 25 years Operator R:·I~2.§4,Z25
Other t'ltS13;1:l19
Stoplng Crew Composition
Operiltor Other ITotal '.' 31 si · .. ·..8
2004r=====':'1 Compensation cost
per 100 stoping employes over 25
years
";:RM45,409: ....
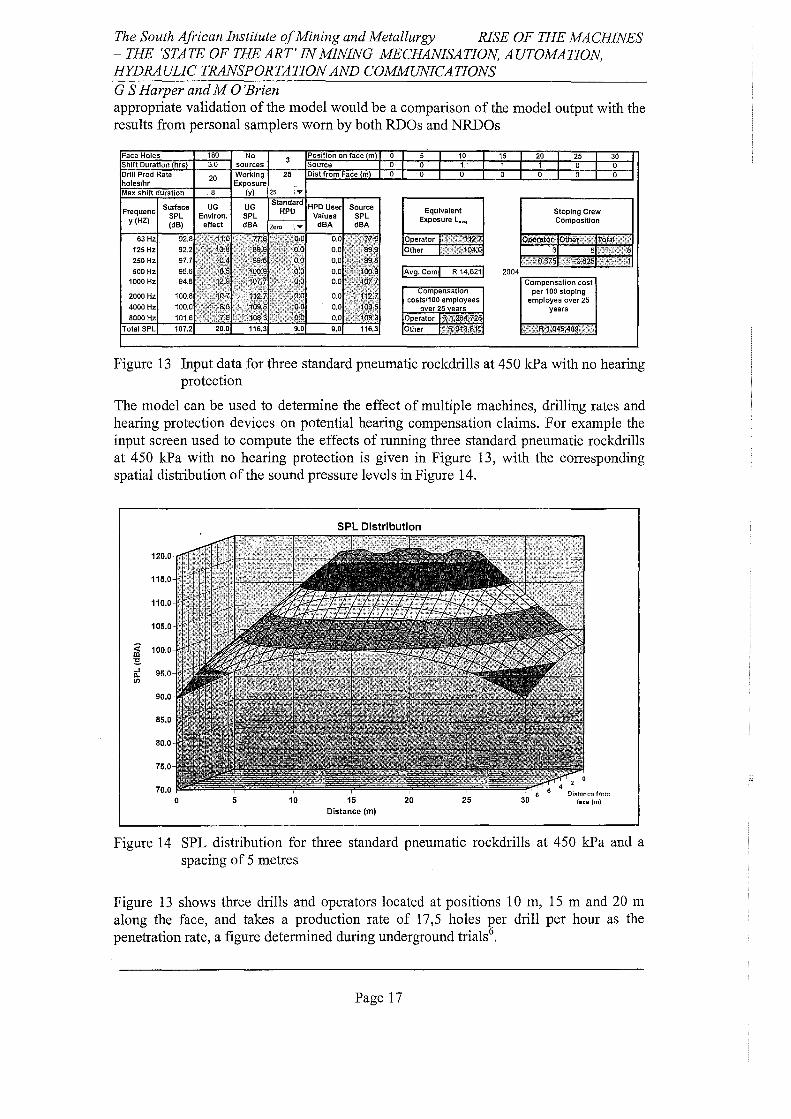
Figure 13 Input data for three standard pneumatic rockdrills at 450 kPa with no hearing protection
The model can be used to determine the effect of multiple machines, drilling rates and hearing protection devices on potential hearing compensation claims. For example the input screen used to compute the effects of running three standard pneumatic rockdrills at 450 kPa with no hearing protection is given in Figure 13, with the corresponding spatial distribution of the sound pressure levels in Figure 14.
120.0
115.0
110.0
105.0
~ 100.0 m :;:. ...I 95.0 a. IJl
90.0
85.0
80.0
75.0
70.0 0
Figure 14
5 10
SPL Distribution
15 Distance (m)
20 25 face (m)
SPL distribution for three standard pneumatic rockdrills at 450 kPa and a spacing of 5 metres
Figure 13 shows three drills and operators located at positions 10 m, 15 m and 20 m along the face, and takes a production rate of 17,5 holes per drill per hour as the penetration rate, a figure determined during underground trials6
.
Page 17
The South African Institute of Mining and Metallurgy RISE OF THE MACHINES - THE 'STATE OF THE ART' IN MINING MECHANISATION, AUTOMATION, HYDRAULIC TRANSPORTATION AND COMMUNICATIONS G S Harper and MO 'Brien
An equivalent operator exposure of 113,6 dB is predicted by the model (no HPDs being worn), leading to a predicted compensation cost tq the mine of some R 1 045 400 per 100 exposed individuals per 25-year period.
Face Holes 180 No Posilion on face m 5 10 15 20 25 30 Shift Duralion (hrs) 3.0 sources (.;,.s::::ou:::':rc;'e :":::':':'=..I!!:.Lh;'-+-;0<-+--':;:-~"':'1;:-~":;--+--;O;;:-+--;:'0 -l Drill Prod Rate 20 Working 25 FD:.::;ist:..:.:fr..:::;om.:.:.F:..::a;:::ce'-"m""-.r......::.....J...---:O:...--'--~_.L-....;O:...--'--....;O:...--'--.....;O::..-...L-.....::...O --I holeslhr Exposure~
Max shift duration (y) 25 I"
Total SPL 107.2
Equivalent Exposure Luq
Operalor I; . ;". :.,65:7
Olher; )78;9
IAvg. coml R 14,6211
l..ompensa Ion costs/100 employees
over 25 years Operator ;:R.109,~
Other V" ";RQ
Sloping Crew Composition
(jpel"atorJOther ITotal 3 SI 8
"0.3751 . 0.6251. . 1
2004'-==="""'-=:-1 Compensation cost
per 100 stoping employes over 25
years
Figure 15 Input data for three standard pneumatic rockdrills at 450 kPa with standard muff type hearing protection
Given the same air pressures, drill penetration rates and noise measurements, but using the attenuation properties of simple muff hearing protectors allows the computation shown in Figure 15, Immediately apparent from Figure 15 is the fact that the equivalent exposure of the operator has dropped to 87 dBA and the corresponding compensation cost has reduc~d to R 41 000 per 100 exposed individuals over 25 years.
Recalculation of the above scenario for the other drills tested indicates that the use of simple muffs is sufficient to avoid the risk of NIHL , with the proviso that these are worn correctly. While data for the standard non-muffled pneumatic rockdrill indicates that there may be some risk of NIHL and compensation with muffs, the relatively high penetration rate of these drills allows the development of Figure 16, displaying the influence of penetration rate (expressed as total holes per hour of drilling) on the weighted equivalent noise exposure of the operator.
The solid line of Figure 16 at 85 dB(A) indicates the accepted noise level for an eight hour exposure. The upper curve represents the weighted exposure average experienced by the operators with three standard non-muffled pneumatic rockdrills running simultaneously.
Page 18
The South African Institute of Mining and Metallurgy RISE OF THE MACHINES - THE 'STATE OF THE ART' IN MINING MECHANISATION, AUTOMATION, HYDRAULIC TRANSPORTATION AND COMMUNICATIONS G S Harper and MO 'Brien
90.0
~ ~--
~ 89.0
~ ~-
"~ ~ ~
~ ~
'-..
~ ~
88.0
~ ~ 87.0 ~
J
86.0
.......... I------
85.0
84.0 8 10 12 14 16 18 20 22 24 26 28 30 32
Holes per hour
Figure 16 Influence of penetration rate (expressed as total holes per hour of drilling) on the weighted equivalent noise exposure of the operator
6. Conclusions
A simple spreadsheet based model has been developed to provide an indication of the anticipated SPL distribution in an underground environment from data obtained under free field conditions. This distribution is used to predict the probability and cost of NIHL compensation. Applying the model to various types of rock drills shows that at high drilling rates the effective use of simple muff type hearing protection devices is sufficient to eliminate NIHL compensations, provided that is that such devices are used correctly at all times. The current model is specific to stoping operations and would require further calibration for application to other underground environments such as development ends and shaft sinking. While the model has been developed specifically for rock drills it can be used to evaluate the SPL of other stoping equipment such as pneumatic chain saws.
6. Acknowledgements
The invaluable assistance and contribution of Anglo Platinum and Impala Platinum personnel to the completion of this work and the extensive assistance provided by the personnel at Twickenham platinum mine is gratefully acknowledged. The open and frank contributions and assistance provided by the representatives of Boart Longyear, Sulzer and Hilti is also gratefully acknowledged.
Page 19
The South African Institute of Mining and Metallurgy RISE OF THE MACHINES - THE 'STATE OF THE ART' IN MINING MECHANISATION, AUTOMATION, HYDRAULIC TRANSPORTATION AND COMMUNICATIONS G S Harper and MO 'Brien
References
1. Safety in Mines Research Advisory Council, 2005. Invitation to submit project proposals (or the Gazette Package for 2005).
2. SABS-ISO 3744:1994, Acoustics- Determination of sound power levels of noise sources using sound pressure: Engineering method in an essentially freefield, over a reflecting plane. Pretoria: South African Bureau of Standards.
3. Republic of South Africa, Department of Minerals and Energy, 2002. Regulation gazette number 7400, Vol. 445, 02 July 2002, Pretoria: Government Printer.
4. ISO, 1975. ISO 1999: 1975 (E), Acoustics- Determination of occupational noise exposure and estimation of noise-induced hearing impairment. Geneva: International Organization for Standardization.
5. Franz RM, van Rensburg AJ, Marx HE, Murray-Smith AI and Hodgson TE, 1996. Develop means to enhance the effectiveness of existing hearing conservation programmes. SIMRAC Final Report GEN 011 Pretoria: Department of Minerals and Energy.
6. Harper GS. 2005, Rockdrill Selection Criteria. CSIR Natural Resources and the Environment Report No 2005-0822