THE PREHYDRATION OF CEMENT AND ITS MITIGATION 1 2 Julyan Stoian 3 Research Assistant, Laboratory for the Chemistry of Construction Materials (LC2), Department 4 of Civil and Environmental Engineering, University of California, Los Angeles, CA, USA, 5 Email: [email protected]6 Tandre Oey 7 Research Assistant, Laboratory for the Chemistry of Construction Materials(LC2), Department 8 of Civil and Environmental Engineering, University of California, Los Angeles, CA, USA, 9 Email: [email protected]10 Jeffrey W. Bullard 11 Materials Research Engineer, Engineering Laboratory, Materials and Structural Systems 12 Division, National Institute of Standards and Technology, Gaithersburg, Maryland, Email: 13 [email protected]14 Jian Huang 15 Research Scientist, Laboratory for the Chemistry of Construction Materials(LC2), Department of 16 Civil and Environmental Engineering, University of California, Los Angeles, CA, USA, Email: 17 [email protected]18 Aditya Kumar 19 Research Scientist, Laboratory for the Chemistry of Construction Materials(LC2), Department of 20 Civil and Environmental Engineering, University of California, Los Angeles, CA, USA, Email: 21 [email protected]22 Magdalena Balonis 23 Research Scientist, Department of Materials Science and Engineering, University of California, 24 Los Angeles, CA, USA, Email: [email protected]25 Technology Analyst, Institute for Technology Advancement, University of California, Los 26 Angeles, CA, USA 27 Narayanan Neithalath 28 Associate Professor, School of Sustainable Engineering and the Built Environment, Arizona 29 State University, Tempe, AZ, USA, Email: [email protected]30 Gaurav N. Sant 31 Assistant Professor and Rice Endowed Chair in Materials Science (Corresponding Author), 32 Laboratory for the Chemistry of Construction Materials(LC2), Department of Civil and 33 Environmental Engineering, University of California, Los Angeles, CA, USA, Email: 34 [email protected]35 Faculty Member, California Nanosystems Institute (CNSI), University of California, Los 36 Angeles, CA, USA 37 38 39 ABSTRACT 40 41 Ordinary portland cement (OPC) prehydrates during storage or handling in moist environments, 42 forming hydration products on or near its particles’ surfaces. Prehydration is known to reduce 43 OPC reactivity, but the extent of prehydration has not yet been quantitatively linked to reaction 44 rate and mechanical property changes. A series of experiments are performed to develop a better 45 understanding of prehydration by intentionally exposing an OPC powder to either water vapor or 46
Transcript
THE PREHYDRATION OF CEMENT AND ITS MITIGATION 1 2
Julyan Stoian 3 Research Assistant, Laboratory for the Chemistry of Construction Materials (LC2), Department 4
of Civil and Environmental Engineering, University of California, Los Angeles, CA, USA, 5 Email: [email protected] 6
Tandre Oey 7 Research Assistant, Laboratory for the Chemistry of Construction Materials(LC2), Department 8
of Civil and Environmental Engineering, University of California, Los Angeles, CA, USA, 9 Email: [email protected] 10
Jeffrey W. Bullard 11 Materials Research Engineer, Engineering Laboratory, Materials and Structural Systems 12
Division, National Institute of Standards and Technology, Gaithersburg, Maryland, Email: 13 [email protected] 14
Jian Huang 15 Research Scientist, Laboratory for the Chemistry of Construction Materials(LC2), Department of 16 Civil and Environmental Engineering, University of California, Los Angeles, CA, USA, Email: 17
Research Scientist, Laboratory for the Chemistry of Construction Materials(LC2), Department of 20 Civil and Environmental Engineering, University of California, Los Angeles, CA, USA, Email: 21
Research Scientist, Department of Materials Science and Engineering, University of California, 24 Los Angeles, CA, USA, Email: [email protected] 25
Technology Analyst, Institute for Technology Advancement, University of California, Los 26 Angeles, CA, USA 27
Narayanan Neithalath 28 Associate Professor, School of Sustainable Engineering and the Built Environment, Arizona 29
State University, Tempe, AZ, USA, Email: [email protected] 30 Gaurav N. Sant 31
Assistant Professor and Rice Endowed Chair in Materials Science (Corresponding Author), 32 Laboratory for the Chemistry of Construction Materials(LC2), Department of Civil and 33 Environmental Engineering, University of California, Los Angeles, CA, USA, Email: 34
[email protected] 35 Faculty Member, California Nanosystems Institute (CNSI), University of California, Los 36
Angeles, CA, USA 37 38 39 ABSTRACT 40 41 Ordinary portland cement (OPC) prehydrates during storage or handling in moist environments, 42 forming hydration products on or near its particles’ surfaces. Prehydration is known to reduce 43 OPC reactivity, but the extent of prehydration has not yet been quantitatively linked to reaction 44 rate and mechanical property changes. A series of experiments are performed to develop a better 45 understanding of prehydration by intentionally exposing an OPC powder to either water vapor or 46
liquid water. The experiments aim to investigate the extent to which premature contact of OPC 47 with water and other potential reactants in the liquid and/or vapor state(s) can induce differing 48 surface modifications on the OPC grains. Original results obtained using isothermal calorimetry, 49 thermogravimetric analysis and strength measurements are correlated to a prehydration index, 50 which is defined for the first time. Experimental results are used to evaluate hypotheses of 51 mechanisms which control the process. The addition of fine limestone particles to a mixture 52 formed using prehydrated cement is shown to mitigate the detrimental effects of cement 53 prehydration. 54 55 Keywords: physisorption, prehydration, nucleation, limestone 56
57 58 INTRODUCTION AND BACKGROUND 59 60 Ordinary portland cement (OPC) reacts on contact with water in the liquid or the vapor states. 61 Therefore, unintentional exposure to moisture or to other known reactants such as CO2 during 62 the storage and handling of the OPC powder can result in premature hydrationi or aging of its 63 constituent phases. Any such unintentional reaction of the cement reduces the thermodynamic 64 driving force for its subsequent reactions with water, and the resultant loss of reactivity is 65 typically manifested as undesirable reductions in the rate of hardening and strength gain of 66 concrete [1,2]. In this paper, we will use the term “prehydration” generically to refer to all the 67 processes that cause unintentional loss of reactivity prior to the usual mixing of cement with 68 water. To be specific, this includes physical adsorption of water on the cement particle surfaces, 69 as well as the chemical reactions between water and the anhydrous OPC minerals to form solid 70 hydration products such as calcium silicate hydrate (C-S-Hii), Ca(OH)2, gypsum, and ettringite. 71 In addition, CO2 in air or dissolved in water can react with several cement components, forming 72 magnesite (MgCO3) from periclase (MgO), and forming CaCO3 from free lime (CaO) or 73 Ca(OH)2, the latter being present primarily because of prior reaction with water [3,4,5,6]. All of 74 these changes initiate at the exposed surfaces of OPC grains but penetrate deeper into the grains 75 with prolonged exposure. 76 77 To better understand these aspects, Dubina and coworkers studied the effects of prehydration on 78 the constituent phases present in OPC and in commercial OPC formulations [7,8,9,10]. They 79 quantified the prehydration sensitivity of the different phases in OPC, especially due to water 80 vapor exposure by (1) identifying the RH at which a given OPC phase may become susceptible 81 to water adsorption or phase transformations, and (2) characterizing the influence of both RH 82 and exposure time on reactions and property development. These studies showed that the 83 calcium silicates, calcium aluminates, and calcium sulfates in OPC all undergo interactions with 84 water vapor that influence the physicochemical response of the OPC to water during normal 85 hydration. In particular, prehydration was observed to upset the balance between the soluble 86 aluminate and sulfate minerals that is intentionally built into OPC materials to regulate the 87 otherwise rapid reaction of tricalcium aluminate with water [7,8,9]. 88 89
i The term “hydration” is used in cement chemistry to generically indicate any and all net reactions of cementitious mineral phases with water, and we will use the
term in this broad sense here despite the fact that the same term may have a more restricted meaning in other fields of chemistry. ii C-‐S-‐H (ACaO•SiO2•BH2O): is a poorly crystalline calcium silicate hydrate, of variable composition. In the case of cement hydrated in sufficient liquid water, A and B
take values of 1.7 and 4.0 respectively, such that the Ca/Si molar ratio = 1.7 [16].
This work expands on previous studies by quantitatively correlating the changes in reactivity and 90 strength evolution in OPC pastes to the duration (and magnitude) of exposure to either liquid 91 water or water vapor. The addition of fine limestone powder to prehydrated cement is observed 92 to partially restore some reactivity. Likely mechanisms by which fine limestone can offset the 93 detrimental effects of prehydration are briefly discussed. 94 95 96 MATERIALS AND EXPERIMENTAL METHODS 97 98 An ASTM C150 compliant Type I/II ordinary portland cement (OPC) was used herein. X-ray 99 fluorescence (XRF) was used to estimate the major oxide composition of the OPC on a mass 100 basis: 20.57 % SiO2, 5.19 % Al2O3, 3.44 % Fe2O3, 65.99 % CaO, 1.37 % MgO, 2.63 % SO3, 0.17 101 % Na2O, 0.31 % K2O, 0.26 % TiO2 and 0.08 % P2O5. Quantitative X-ray diffraction (QXRD), 102 using Rietveld refinement, was used to estimate the mineralogical composition of the OPC, on a 103 mass basis [11]: 57.46 % MIII-Ca3SiO5, 23.81 % β-Ca2SiO4, 2.24 % Ca3Al2O6 (i.e., a mixture of 104 cubic and orthorhombic forms [16]), 9.75 % Ca4Al2Fe2O10, 1.72 % CaSO4·2H2O, 2.09 % 105 CaSO4·0.5H2O and 2.91 % CaCO3. To examine the efficacy of fine limestone powder additions 106 to prehydrated OPC on restoring reactivity, a commercially available, nominally pure limestone 107 powder (> 98 % CaCO3) was used.iii,iv The particle size distributions (PSDs) of the OPC and the 108 limestone were measured by static light scattering (SLS) using isopropanol and ultrasonication 109 for dispersing the powders to primary particles, and are shown in Fig. 1. The largest variation in 110 the light scattering measurements is about 6 % based on measurements performed on six 111 replicates and assuming the density of the OPC and limestone to be 3150 kg/m3 and 2700 kg/m3, 112 respectively. Assuming that the particles are spherical, the measured PSDs of OPC and limestone 113 correspond to specific surface areas (SSAs) of 520 m2/kg and 1353 m2/kg. Accounting for the 114 irregular shape of OPC particles often results in SSA estimates that are higher by a factor of 1.6-115 to-1.8 [12]. 116 117
Figure 1 – Particle size distributions for the OPC (as-received) and the limestone evaluated in 118 this study. The largest variation in the light scattering measurements is around ±6 %. 119 120 Prehydration of the as-received OPC was simulated by exposing it to either liquid water or 121 humid air. For water vapor exposure, the OPC powder was placed for either one month or three 122
iii OMYA A.G., Cincinnati, OH. iv Certain commercial materials and equipment are identified to adequately specify experimental procedures. In no case does such identification imply
recommendation or endorsement by the University of California, Los Angeles, the National Institute of Standards and Technology, or Arizona State University, nor does it imply that the items identified are necessarily the best available for the purpose.
0
20
40
60
80
100
Cum
mul
ativ
e Pa
ssin
g (%
)
0.01 0.1 1 10 100 1000Particle size (µm)
CementLimestone
months in a room maintained at 55 % ± 10 % RH and 25 °C ± 3 °C, during which time the 123 powders were mixed on a weekly basis to encourage uniform exposure to water vapor. For 124 exposure to liquid water (deionized), several hundred grams of the OPC powder were spread in a 125 thin layer and then misted in two equal cycles, separated by 30 minutes, with a uniform mass of 126 water corresponding to a moisture dosage of 2.5 % (Sprayed-1) or 5.0 % (Sprayed-2) by mass of 127 powder. The OPC powder was homogenized in a planetary mixer after each cycle. After the 128 second mixing, the powders were sealed in airtight containers to limit drying and maintained in 129 an environmental chamber at 25 °C. After one week, the OPC powders were homogenized once 130 again and placed in airtight containers for another week to ensure consistent prehydration. 131 132 Paste mixtures of either the as-received or prehydrated OPC powder were prepared with a 133 (deionized) water-to-solids mass ratio of w/s = 0.45 as described in ASTM C 305 [13]. To 134 explore the influences of limestone on the reaction response of systems prehydrated with water 135 vapor, small amounts of the as-received limestone powder were introduced either by adding to 136 the cement powder (increasing the total solid mass) or by partially replacing the cement powder 137 at constant total solid mass. By either means, the limestone dosages were 2.5 %, 5 % or 10 % by 138 mass of OPC. When the limestone was dosed by addition, the amount of water in the mixture 139 was 0.45 g H2O per gram of OPC. In contrast, when limestone was dosed by partial replacement 140 of OPC, the mixture had a constant water content of 0.45 g H2O per gram of total solids. 141 142 143 Characterizing the Extent of Cement Prehydration 144 145 As already described, the term “prehydration” is used to capture a range of premature reaction 146 phenomena that result from exposure not only to water (liquid or vapor) but also to other 147 reactants that OPC is likely to encounter during storage. The primary substance, besides water, 148 that can react with cementitious minerals is CO2, which is present in air and in liquid water at 149 typical concentrations of about 390 ppm and 50 ppm, respectively. Therefore, our attempt to 150 quantify prehydration, as defined here, must be careful to account for the effects both of water 151 and of CO2, especially because no special efforts were made to exclude CO2 either from the air 152 or from the liquid water used in the prehydration step. Most OPCs contain some CaCO3 which is 153 added intentionally (to reduce the cement clinker content), but which is difficult to distinguish 154 from CaCO3 that forms by the direct carbonation of the free lime (CaO) present in the OPC, or 155 by the carbonation of Ca(OH)2 formed by the hydration of CaO, or from reactions of the silicate 156 phases with liquid water during storage and/or handling. Separating these different potential 157 sources of CaCO3 is especially difficult because OPC often begins prehydrating (or carbonating) 158 immediately after it is manufactured, long before it is acquired for analysis or use. Therefore, it 159 is reasonable to only characterize prehydration of a cement powder relative to its as-received 160 state, that is, as the incremental prehydration that is induced by the liquid or vapor treatments 161 described in the previous section. 162 163 With these considerations in mind, the most direct way to characterize prehydration is to record 164 the quantities of physisorbed water by desorption experiments and to measure the changes in the 165 amounts of solid hydrates and carbonates before and after a given prehydration step using 166 quantitative X-ray diffraction [7,8,9]. However, the total volume of each of the solid hydrates 167 and carbonates formed by prehydration is small, typically below the detection limit, ≈1 % by 168
mass, of lab-scale X-ray diffraction (XRD) analyses. Further, numerous OPC hydrates are poorly 169 ordered and thus difficult to quantify accurately by XRD. Because of these difficulties, we 170 choose to apply thermogravimetry to characterize prehydration by measuring the mass loss upon 171 heating to 975 °C, a temperature above which no additional mass loss is observed even by fully 172 hydrated OPC. The mass lost by an anhydrous OPC when heated from room temperature to 975 173 °C in N2 comes from several sources. Between room temperature and ≈110 °C, liquid water 174 condensed in the porosity evaporates, and the calcium alumino/sulfate hydrate phases begin to 175 dehydrate. The continued dehydration of the calcium alumino/sulfate phases, together with 176 volatilization of the grinding aids added during manufacture and decomposition of minor 177 hydrated phases such as syngenite, continues between 110 °C and 400 °C. The decomposition of 178 the calcium hydroxide, magnesium carbonate, and calcium alumino/sulfate-hydrates occurs 179 between about 425 °C and 550 °C. Above 550 °C, the main contributions to the mass loss are 180 decomposition of calcium carbonate and the final dehydration of the calcium silicate hydrate (C-181 S-H) phases. 182 183 The mass loss of the as-received OPC powder from 35 °C to 975 °C provides a baseline, from 184 which the incremental prehydration of that powder can be defined as the additional mass loss in 185 the same temperature range of that powder at a later time. Therefore, if we normalize the powder 186 masses by the mass of the ignited OPC powder, we can define the dimensionless incremental 187 prehydration index (PI, %) as: 188 189
𝑃𝐼 =∆𝑚𝑚!
−∆𝑚𝑚! !
× 100 (1)
190 where ∆𝑚 is the mass loss between 35 °C and 975 °C, 𝑚! is the ignited mass—taken here to be 191 the mass after heating to 975 °C—and the subscript “0” refers to the baseline measurement made 192 on the as-received powder. As defined, this prehydration index accounts for all additional aging 193 of the as-received powder, whether due to (pre)hydration or carbonation. 194 195 The prehydration index could have been defined in alternative ways that attempt to neglect the 196 contribution of carbonation by omitting the portion of the mass loss that is associated with the 197 decomposition of CaCO3. However, we choose to include all mass loss in our definition because 198 carbonation can be both a direct effect of aging and a secondary effect of reaction with water. 199 A simultaneous thermal analyzerv was used to measure the thermogravimetric (TG) and the 200 differential thermogravimetric (DTG) signals of the cementitious samples, as raw powders, and 201 after 1 d, 3 d, 7 d, and 28 d of hydration in liquid water. The temperature and mass sensitivity of 202 the analyzer were 0.25 °C and 0.1 µg, respectively. Hydration was arrested at each desired time 203 by crushing the paste mass to granules (< 5 mm diameter) and then submerging them in 204 isopropanol (IPA) for 6 d, with IPA being replaced every 2 d [14]. Following solvent exchange, 205 the samples were placed under vacuum in a desiccator for 3 d and then crushed to a very fine 206 powder. The powders were heated under a (99.999 % purity) N2 purge at a flow rate of 20 207 mL/min and a heating rate of 10 °C/min in pure aluminum oxide crucibles from 35 °C to 975 °C. 208 209
v STA 6000, Perkin Elmer, Waltham, MA.
The TG data were used to calculate the prehydration index (PI), and to approximate both the 210 evaporable and non-evaporable water contents, the amount of Ca(OH)2 and CaCO3 present in the 211 system—inferred from the mass loss between 425 °C and 550 °C and between about 550 °C and 212 800 °C, respectively. The degree of OPC reaction, α, for normal hydration in sufficient liquid 213 water can then be estimated by assuming that the mass of non-evaporable water, 𝑚! 𝑡 varies 214 linearly from zero to a terminal value of 𝑚!,! at complete reaction, 215 216
𝛼 =𝑚!(𝑡)𝑚!,!
(2)
217 While the non-evaporable water mass can be estimated from TG data, volatilization of CO2 also 218 contributes to the mass loss and therefore can make the non-evaporable water mass difficult to 219 isolate. However, errors made in incorrectly assigning different portions of the TG data to non-220 evaporable water will largely cancel in Eq. (2) if the same procedure is used to calculate both 221 𝑚! 𝑡 and 𝑚!,!. Therefore, we arbitrarily choose a formulation that also has been applied in 222 some previous studies [15,16]: 223 224
𝑚! 𝑡 = 𝑚 𝑡, 145 −𝑚 𝑡, 975 − [𝑚 𝑡,≈ 550 −𝑚 𝑡, 800 ] (3) 225 where 𝑚(𝑡, 145), for example, is the mass of a specimen after t days of reaction when heated to 226 145 °C, and is the mass after loss of evaporable water [15,16]. The term in square brackets in Eq. 227 (3) is intended to account for the mass loss due to CaCO3 decomposition, the onset of which 228 usually begins at about 550 °C, although for this study we use the DTG signal to determine the 229 onset temperature more accurately for each paste specimen. The terminal value of the non-230 evaporable water mass at complete reaction could be determined experimentally by a long-term 231 bottle hydration experiment to ensure complete reaction. However, we estimate for this OPC 232 powder, based on its mineral composition and using a procedure described previously [16], that 233 𝑚!,! ≈ 0.23 g per gram of ignited, as-received OPC. 234 235 236 Characterizing Mixture Reactivity and its Impacts on Mechanical Properties 237 238 An isothermal calorimetervi was used to measure the heat evolved during normal hydration of as-239 received and prehydrated OPC pastes at constant temperature (25 °C ± 0.1 °C). The thermal 240 power and the energy measured were used to assess the influence of prehydration and of 241 limestone dosage on reaction kinetics and total heat release of the cementitious samples. The 242 progress of reactions, and their impacts on mixture properties were characterized by measuring 243 the compressive strength of OPC paste specimens (50 mm cubes) cured at 25 °C ± 1 °C for 1 d, 244 3d, 7 d, and 28 d, as described in ASTM C109 [13]. Each compressive strength measurement 245 was repeated on three replicates to obtain an average value at each time (age), with a highest 246 variation of 7 % being noted for samples formed from the same mixing batch. 247 248 249 250
vi TamAir, TA Instruments, Newcastle, DE.
EXPERIMENTAL RESULTS AND THEIR DISCUSSION 251 252 253 Plain OPC Pastes 254 255 The loss on ignition (LoI) upon heating the as-received OPC powder to 975 °C was 2.99 %, 256 using the unignited powder as the reference. Based on the DTG data shown in Fig. 2(a), if we 257 assume that all the mass loss in the range 600 °C-to-800 °C is CO2 gas released by CaCO3 258 decomposition, then the LoI can be partitioned with 2.04 % due to CO2 from CaCO3 and 0.95 % 259 due to other sources. This indicates an intrinsic CaCO3 content of ≈ 4.45 % (by mass) in the as-260 received OPC. 261 262
(a) (b) (c)
Figure 2 – (a) Traces obtained by differential thermogravimetric (DTG) analysis for cement 263 prehydrated to different levels. Here, E-H2O, Ca(OH)2, and CaCO3 denote evaporable water, 264 portlandite and calcite respectively. (b) The prehydration index quantified for the different 265 prehydration treatments applied in this study and (c) the change in the CaCO3 content over the 266 course of the prehydration treatment, over and above the CaCO3 content intrinsic to the OPC. It 267 should be noted, that “AR” denotes the OPC in its as-received form. The largest variation in 268 quantifications of the prehydration index and the CaCO3 content is on the order of ± 7 % and ± 269 2 %, respectively, as quantified from determinations from three replicates. 270 271 Fig. 2(a) shows DTG measurements for the as-received cement and for the cement prehydrated 272 due to water vapor or liquid water exposure. Even the as-received OPC has some evaporable 273 water and Ca(OH)2. Therefore, this cement experienced some prehydration prior to being used in 274 this study. Increasing water dosages (i.e., 55 % RH or by spraying) increase the prehydration 275 index, as shown in Fig. 2(b). A similar effect is noted with increasing times of exposure, from 276 one month to three months, at 55 % RH. Unsurprisingly, the extent of CaCO3 detected increases 277 with the exposure time. The increases in the CaCO3 content are caused by the carbonation of 278 CaO or Ca(OH)2 present in the OPC, or formed over the course of the prehydration treatment [8]. 279 The DTG data in Fig. 2(a) indicate that incremental carbonation leads to ≤ 0.25 % increase in the 280 CaCO3 content of the OPC for all prehydration treatments except for the 3-month exposure to 281 water vapor. The 3-month exposure, however, caused an increase in the CaCO3 content of ≈ 2.65 282 % by initial mass of OPC powder. These increases in the CaCO3 content correspond to 283 contributions to the PI of ≈1.2 % for the 3-month exposure but only around ≈0.1 % for all other 284 prehydration treatments. Carbonation of Ca(OH)2 is known to occur more slowly in water, with 285
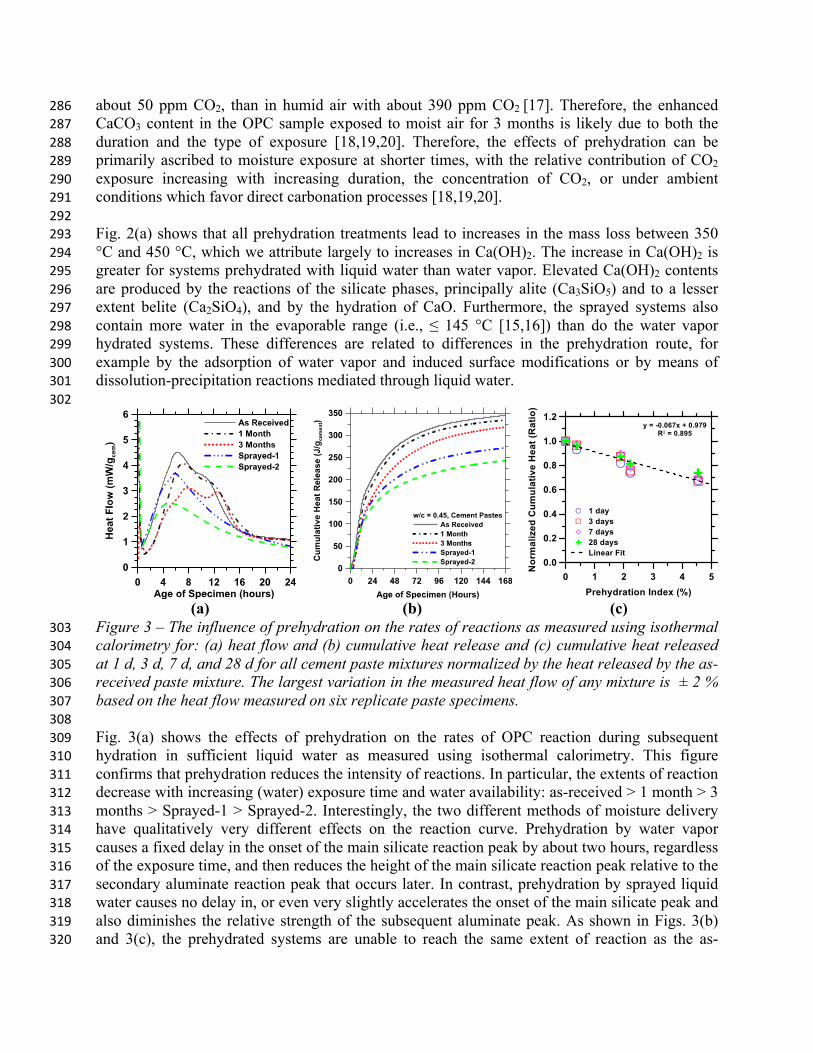
about 50 ppm CO2, than in humid air with about 390 ppm CO2 [17]. Therefore, the enhanced 286 CaCO3 content in the OPC sample exposed to moist air for 3 months is likely due to both the 287 duration and the type of exposure [18,19,20]. Therefore, the effects of prehydration can be 288 primarily ascribed to moisture exposure at shorter times, with the relative contribution of CO2 289 exposure increasing with increasing duration, the concentration of CO2, or under ambient 290 conditions which favor direct carbonation processes [18,19,20]. 291 292 Fig. 2(a) shows that all prehydration treatments lead to increases in the mass loss between 350 293 °C and 450 °C, which we attribute largely to increases in Ca(OH)2. The increase in Ca(OH)2 is 294 greater for systems prehydrated with liquid water than water vapor. Elevated Ca(OH)2 contents 295 are produced by the reactions of the silicate phases, principally alite (Ca3SiO5) and to a lesser 296 extent belite (Ca2SiO4), and by the hydration of CaO. Furthermore, the sprayed systems also 297 contain more water in the evaporable range (i.e., ≤ 145 °C [15,16]) than do the water vapor 298 hydrated systems. These differences are related to differences in the prehydration route, for 299 example by the adsorption of water vapor and induced surface modifications or by means of 300 dissolution-precipitation reactions mediated through liquid water. 301 302
(a) (b) (c)
Figure 3 – The influence of prehydration on the rates of reactions as measured using isothermal 303 calorimetry for: (a) heat flow and (b) cumulative heat release and (c) cumulative heat released 304 at 1 d, 3 d, 7 d, and 28 d for all cement paste mixtures normalized by the heat released by the as-305 received paste mixture. The largest variation in the measured heat flow of any mixture is ± 2 % 306 based on the heat flow measured on six replicate paste specimens. 307 308 Fig. 3(a) shows the effects of prehydration on the rates of OPC reaction during subsequent 309 hydration in sufficient liquid water as measured using isothermal calorimetry. This figure 310 confirms that prehydration reduces the intensity of reactions. In particular, the extents of reaction 311 decrease with increasing (water) exposure time and water availability: as-received > 1 month > 3 312 months > Sprayed-1 > Sprayed-2. Interestingly, the two different methods of moisture delivery 313 have qualitatively very different effects on the reaction curve. Prehydration by water vapor 314 causes a fixed delay in the onset of the main silicate reaction peak by about two hours, regardless 315 of the exposure time, and then reduces the height of the main silicate reaction peak relative to the 316 secondary aluminate reaction peak that occurs later. In contrast, prehydration by sprayed liquid 317 water causes no delay in, or even very slightly accelerates the onset of the main silicate peak and 318 also diminishes the relative strength of the subsequent aluminate peak. As shown in Figs. 3(b) 319 and 3(c), the prehydrated systems are unable to reach the same extent of reaction as the as-320
received system. Furthermore, Fig. 3(c) indicates that the severity of the depression in the total 321 amount of OPC reactions, as measured by cumulative heat released, is a linear function of the 322 incremental PI, independent of prehydration exposure type or duration (see also Figure 6a). 323 324 One might suppose that this decrease in heat evolution is similar to the heat released over the 325 course of prehydration. However, in the absence of direct heat evolution measurements during 326 the prehydration exposure, the validity of that supposition cannot be evaluated without making 327 an assumption about how heat release is related to degree of reaction, α, during prehydration. 328 For normal hydration in liquid water, the non-evaporable water at complete reaction, 𝑚!,!, is 329 known to be about 0.23 g per gram of OPC reacted [15,16]. Therefore, 𝑚!,! is a linear function 330
of α with a slope of 0.23 (Eq. 2). However, the reaction products formed during prehydration 331 may have different non-evaporable water contents because the water activity is far different than 332 during normal hydration. Therefore, a linear relationship between 𝑚!,! and α may still prevail 333 during prehydration, but our uncertainty about its slope make it difficult to infer the degree of 334 reaction during prehydration from TG data. Even if it is to be assumed, 𝑚!,! = 0.23 g/gOPC for 335 reaction products formed during prehydration, the calculated heat release, Q, during prehydration 336 would be α·ΔH, where ΔH is the enthalpy of complete OPC hydration and ΔH ≈ 458 J/g for this 337 OPC. Equating all the heat reduction observed at 168 h of hydration in Fig. 3(b) to the heat 338 released during prehydration would therefore require a high degree of reaction, about 0.21, for 339 the Sprayed-2 case; which is unlikely over the course of prehydration. 340 341
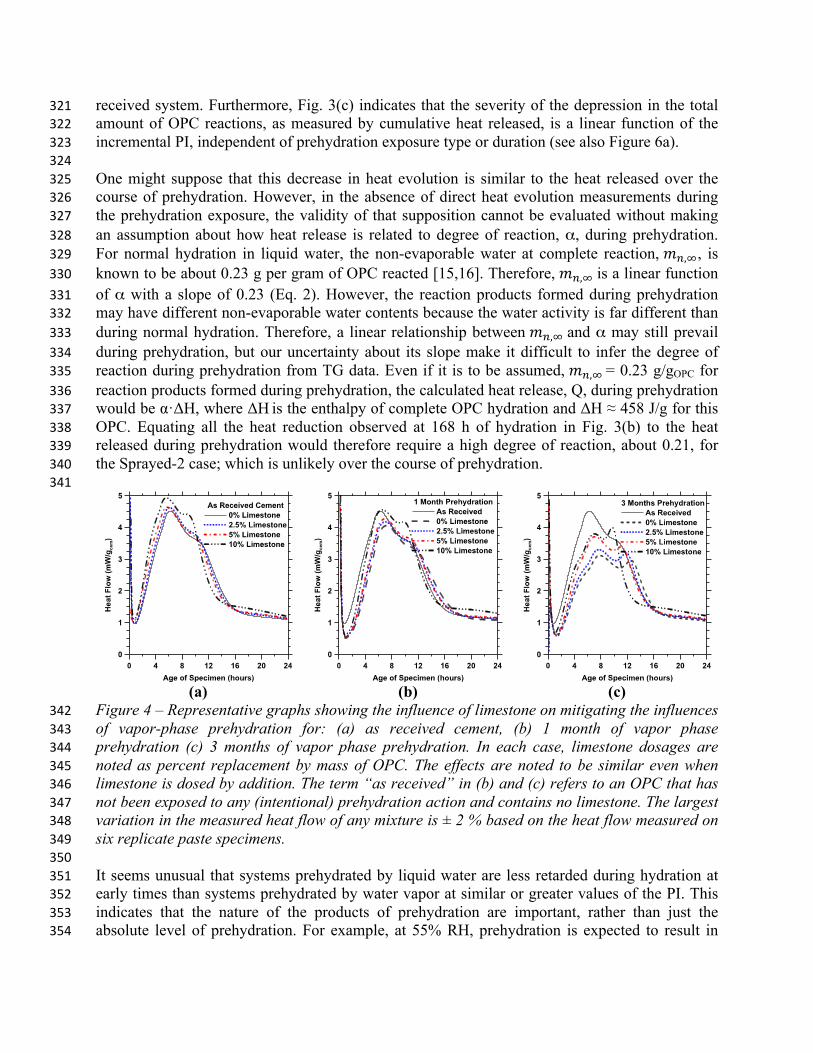
(a) (b) (c)
Figure 4 – Representative graphs showing the influence of limestone on mitigating the influences 342 of vapor-phase prehydration for: (a) as received cement, (b) 1 month of vapor phase 343 prehydration (c) 3 months of vapor phase prehydration. In each case, limestone dosages are 344 noted as percent replacement by mass of OPC. The effects are noted to be similar even when 345 limestone is dosed by addition. The term “as received” in (b) and (c) refers to an OPC that has 346 not been exposed to any (intentional) prehydration action and contains no limestone. The largest 347 variation in the measured heat flow of any mixture is ± 2 % based on the heat flow measured on 348 six replicate paste specimens. 349 350 It seems unusual that systems prehydrated by liquid water are less retarded during hydration at 351 early times than systems prehydrated by water vapor at similar or greater values of the PI. This 352 indicates that the nature of the products of prehydration are important, rather than just the 353 absolute level of prehydration. For example, at 55% RH, prehydration is expected to result in 354
some reaction of Ca3Al2O6 to form a calcium aluminohydrate [16], some reaction of CaO to form 355 Ca(OH)2, and the partial hydration of CaSO4 to form bassanite and/or gypsum. Under the same 356 conditions, the silicate reactions are likely limited to a hydroxylation or similar change in a thin 357 surface layer [22]. Such formations of surface layers on the silicate phases, however, have been 358 previously hypothesized to reduce dissolution rates of these minerals [21], and may even be 359 capable of altering their apparent solubility [22]. On the other hand, prehydration in liquid water 360 likely results in the formation of C-S-H nuclei on silicate surfaces [22], in addition to the 361 aluminate and sulfate reactions. Therefore, the differences observed between prehydration in 362 liquid water and water vapor are likely related to the degree and type of reactions at silicate 363 surfaces. C-S-H exhibits enhanced growth rates in the presence of silicate hydrate seeds that 364 offer preferred nucleation sites and thus accelerate reactions in Ca3SiO5 systems [23,24,25,26]. A 365 similar mechanism likely operates in the liquid-phase prehydrated systems, wherein silicate 366 surface reactions result in the formation of a type of C-S-H that provides sites for preferential 367 nucleation of typical C-S-H during normal hydration. This would also explain why liquid-phase 368 prehydrated systems reach their maximum hydration rate at times that are similar to those of the 369 as-received OPC, despite having a higher prehydration index than systems exposed to water 370 vapor. However, the degree of reaction at later times is lowest in systems prehydrated with liquid 371 water, which is contrary to a seeding effect. The lower extent of reaction at later times may be 372 related to enhanced initial surface coverage of the OPC grains by C-S-H, which can have the 373 following effects: (1) reduce the exposed surface area of the anhydrous phases available for 374 dissolution and (2) then cause an earlier transition to a diffusion-controlled mechanism when a 375 continuous C-S-H layer on the OPC grains has grown thick enough to limit transport of 376 dissolved ions to/from the bulk solution. In contrast, silicate phase surface modifications caused 377 by prehydration in water vapor are gradually etched away upon normal hydration in liquid water, 378 because their hydration approaches that of as-received systems after about 12 h (see Fig. 3a). 379 380 381 Influence of Fine Limestone 382
383 Recently, additions of fine limestone have been demonstrated as a novel means of enhancing 384 and/or controlling OPC reaction rates [27,28,32]. In light of these observations, several mixtures 385 were prepared with different dosages of limestone, as described in Section 2, to determine if it 386 can mitigate the effects of prehydrationvii. Fig. 4 shows that fine limestone can indeed partially or 387 fully offset prehydration effects, and that its efficacy increases with the limestone dosage. 388 Therefore, while complete restoration of normal hydration is easily achieved at low levels of 389 prehydration (e.g., at one month), only partial mitigation is possible when prehydration is more 390 severe (e.g., after three months). For the dosages considered, both limestone replacement and 391 addition are similarly effective. Limestone’s ability to restore the hydraulic reactivity of OPC is 392 linked to at least three effects. First, the surface area provided by fine limestone catalyzes the 393 silicate hydration reactions by providing increased surface area and a low(er) energy barrier for 394 heterogeneous nucleation of hydration products. Second, the dissolution of CaCO3 in water 395 provides carbonate anions to the solution, some of which could be incorporated within the C-S-H 396 through an ion-exchange reaction that releases OH- ions from the C-S-H to preserve charge 397 neutrality. We have no direct experimental confirmation to support this assumption about 398
vii External dosage of fine limestone should be distinguished from limestone formation (carbonation) during prehydration. The “external” limestone provides additional surface area for reactions and hastens them [21,32]. On the other hand, carbonation during prehydration results in the formation of a mass transport
barrier which would impede the dissolution of the cement grains.
carbonate uptake by C-S-H, but an analogous ion exchange reaction for sulfate uptake by C-S-H 399 does explain the observed increase of pH in Ca3SiO5 systems when soluble calcium sulfate is 400 available during hydration [29,30]. When limited CO3
2- incorporation is allowed by this kind of 401 reaction, the accelerating effect of the limestone is virtually unchanged at the beginning because 402 it still offers the same preferential nucleation sites. However, progressively more ion exchange 403 can occur as more C-S-H is formed by ongoing hydration. This is significant because OH- 404 released by ion exchange increases the driving force for C-S-H growth [31,32] relative to the 405 driving force without CO3
2- sorption. The result is a higher degree of reaction at later times [32]. 406 Finally, the availability of CO3
2- ions stabilizes a carboaluminate product at the expense of the 407 sulfoaluminate hydrate that would form otherwise [33,34]. Of course, the CaCO3 formed during 408 prehydration could trigger either of the last two effects, but that source is quite small for all 409 prehydration treatments other than the 3-month duration. 410 411
(a) (b) (c)
Figure 5 – Calorimetric parameters and best fits (dotted lines) as a function of the prehydration 412 index for: (a) slope during the acceleration period, (b) heat flow value at the main heat peak and 413 (c) inverse time required to achieve the main heat peak. The lower and upper dashed lines show 414 linear fits to the data points associated with the plain OPC pastes prehydrated with water vapor 415 or liquid, respectively. 416 417 The trends in the reaction rates are more clearly revealed in Fig. 5 by plotting parameters 418 extracted from the calorimetric measurements as a function of the prehydration index, such as 419 the slope during the acceleration period (Fig. 5a), the heat flow value at main heat peak (Fig. 5b), 420 and the inverse of the time of the main heat peak (Fig. 5c). These calorimetric parameters all 421 decrease with increasing prehydration, but the rate of decrease in the OPC’s reactivity with 422 prehydration is less severe for liquid exposure (PI ≥ 2 %) than water vapor exposure (PI ≤ 2%). 423 Further, quantifying calorimetric parameters in this manner also highlights the ability of external 424 limestone to offset prehydration effects, with ever increasing success at lower PI. 425 426 427 Effects on Compressive Strength 428
429 Fig. 6(b) shows the evolution of compressive strength in cement pastes made from as-received 430 and prehydrated cement. The compressive strength decreases linearly with prehydration index, as 431 shown in Fig. 6(c). The strength is also linearly correlated with the degree of reaction of the OPC 432 and with the cumulative heat release normalized by the quantity of water in the system, as 433
indicated by the strength-heat master curves (SHMC) shown in Figs. 7(a) and 7(b) for both as-434 received and prehydrated materials [27,28,35]. For the latter, the normalization is based on the 435 water mass in the mixture because this indicates the space that can be filled by the hydration 436 product to achieve higher strengths [36]. These results are significant because they indicate that 437 predicting the decrease in strength due to prehydration is reasonably straightforward if the 438 prehydration index, degree of hydration or the heat release behavior of an OPC is known. This 439 ability to forecast strength is especially important for binders containing substantial levels of 440 OPC replacement by other materials because these binders often have both reduced ultimate 441 strengths and slower rates of strength gain at early times [27,28]. 442 443
(a) (b) (c)
Figure 6 – (a) The degree of reaction of the OPC pastes quantified by thermogravimetric (TGA) 444 analysis as a function of the prehydration index, (b) Compressive strength development of plain 445 OPC pastes as a function of specimen age and (c) The normalized compressive strength of plain 446 OPC pastes as a function of the prehydration index. The compressive strength is normalized by 447 the strength of the as received OPC paste at a given age, expressed as a percentage. The largest 448 variation in the degree of OPC reaction and strength is ± 2 % and ± 7 %, respectively. 449 450
(a) (b) (c)
Figure 7 – (a) Compressive strength as a function of the degree of hydration for the plain cement 451 pastes; (b) strength-heat master curve (SHMC) for the as received and prehydrated systems after 452 1 d, 3 d, 7 d, and 28 d of hydration, where the dashed lines denote a ±15% bound; (c) 453 compressive strength development at 1 d of hydration for varying levels of prehydration and 454 various replacement levels of OPC by fine limestone. R denotes OPC replacement and A denotes 455 external limestone additions to OPC. The dashed line represents the 1 d strength of as received 456
OPC. The largest variation in the strength, degree of hydration and cumulative heat is ± 7 %, ± 457 2 %, and ± 2 %, respectively. 458 459 Compressive strengths of the prehydrated systems remain inferior to those of pastes made from 460 the as-received powder even at 28 d, as shown in Fig. 6(b). This suggests that the effects of 461 prehydration are evident not only at early times, but also longer times where they continue to 462 prevent an equivalence in properties. It is not yet clear if these depressive effects are only a 463 function of reaction progress or if aspects of the microstructure of prehydrated systems (e.g., 464 changes in pore size distributions, or phase compositions as caused by elevated temperature 465 curing [37]) may be different. However, it is clear that externally provisioned limestone offsets 466 the detrimental effects of prehydration on strength evolution especially at early times (see Fig. 467 7c) in spite of the fact that limestone replacement for OPC increases the ratio of the water filled 468 pore volume to cementing material (since limestone contributes very slightly to binding product 469 formation); this is a dilution effect which normally would decrease strength. 470 471 472 SUMMARY AND CONCLUSIONS 473 474 Experiments have been described that fully investigate the nature of cement prehydration. 475 Exposure to either water vapor or liquid water causes a loss in the subsequent hydraulic 476 reactivity. The extent of prehydration relative to an as-received OPC powder can be quantified, 477 using thermogravimetric measurements, by a prehydration index (PI) that is defined here for the 478 first time. Carbonation during prehydration is minimal in all cases except extended exposure to 479 water vapor for three months. Therefore, we attribute the loss of reactivity after prehydration to 480 the formation of a layer of hydrated (i.e., water inclusive) solids on the cement particles. The 481 hypothesized prehydration layer acts as a mass transport barrier that impedes the progress of 482 chemical reactions when the cement is subsequently introduced into the mixing water. The 483 severity of suppression of the OPC reaction scales with the duration of exposure to either water 484 vapor or liquid water. In both cases, the activity of water is sufficient to cause surface reactions 485 with the aluminate components in the OPC to form alumino-sulfate hydrates. The reduced 486 availability and chemical activity of water during vapor phase OPC prehydration probably 487 inhibits the formation of the typical C-S-H phase formed during normal hydration, although a 488 precursor silicate hydrate likely forms on the surfaces of the anhydrous silicate phases. In 489 contrast, liquid water prehydration likely enables formation of a product that is somewhat similar 490 to typical C-S-H formed during normal OPC hydration, and that is certainly less effective at 491 inhibiting the dissolution of the cement grains. Consequently the hydration progress of liquid 492 prehydrated powders is similar to an as-received OPC. These broad inferences are supported by 493 the experiments, which were designed to test the influences of the two types of barrier layers 494 thought to be formed during prehydration by water vapor or liquid water. Detailed information 495 regarding the composition, location, and properties of the prehydration products is needed to 496 confirm these conclusions. The results of this work, nevertheless, shed light on the nature and 497 mechanisms of prehydration as well as its influences on the hydration kinetics of OPC, and other 498 materials that are sensitive to moisture exposure. 499 500 The effects of prehydration are evident not only in early stages of normal hydration, but also 501 propagate to much later times by reducing the overall amount of reaction and the compressive 502
strength relative to materials made from the as-received powders. The magnitude of these effects 503 is highly correlated with the prehydration index. Dosages of fine limestone powder are able to 504 mitigate the effects of OPC prehydration. Such mitigation actions are probably both catalytic and 505 chemical in nature: availability of preferable surface for nucleation catalyzes the precipitation of 506 C-S-H, and increases in pH resulting from sorption of dissolved carbonate ions by the C-S-H 507 enhance the driving force for C-S-H growth. When the extent of prehydration is modest, fine 508 limestone can restore reaction rates and properties in prehydrated OPCs to nearly the same levels 509 as for the as-received OPC powder(s). This has important implications on the addition of fine 510 limestone to OPC, not only to reduce cement contents, but also to build in a safety-valve which 511 can help overcome the detrimental effects of OPC prehydration, which are often experienced in 512 field applications. 513 514 515 REFERENCES 516 517 (1) Theisen K.; Johansen V., Prehydration and strength development of portland cement, Am. Ceram. Soc. Bull. 1975, 54,787-‐791. (2) Starinieri, V.; Hughes, D.; Gosselin, C.; Wilk, D.; Bayer, K., Pre-‐hydration as a technique for the retardation of Roman cement mortars. Cem. Concr. Res. 2013, 46, 1-‐13. (3) Flatt, R. J.; Scherer, G. W.; Bullard, J. W., Why alite stops hydrating below 80% relative humidity. Cem. Concr. Res. 2011, 41 (9), 987-‐992. (4) Jensen, O. M.; Hansen, P. F.; Lachowski, E. E.; Glasser, F. P., Clinker mineral hydration at reduced relative humidities. Cem. Concr. Res. 1999, 29 (9), 1505-‐1512. ( 5 ) Ruiz-‐Agudo, E.; Kudłacz, K.; Putnis, C. V.; Putnis, A.; Rodriguez-‐Navarro, C., Dissolution and Carbonation of Portlandite [Ca(OH)2] Single Crystals. Env. Sci. Technol. 2013, 47 (19), 11342-‐11349. (6) MacIntire, W. H., The carbonation of burnt lime in soils. Soil Science 1919, 7 (5), 325-‐453. (7) Dubina, E.; Black, L.; Sieber, R.; Plank, J., Interaction of water vapour with anhydrous cement minerals. Adv. App. Ceram. 2010, 109 (5), 260-‐268. (8) Dubina, E.; Wadsö, L.; Plank, J., A sorption balance study of water vapour sorption on anhydrous cement minerals and cement constituents. Cem. Concr. Res. 2011, 41 (11), 1196-‐1204. (9) Whittaker, M.; Dubina, E.; Al-‐Mutawa, F.; Arkless, L.; Plank, J.; Black, L., The effect of prehydration on the engineering properties of CEM I Portland cement. Adv. Cem. Res. 2013, 25 (1), 12-‐20. (10) Dubina, E.; Plank, J., Influence of moisture-‐and CO2-‐induced ageing in cement on the performance of admixtures used in construction chemisti. ZKG international 2012, (10), 60-‐68. (11) Le Saoût, G.; Kocaba, V.; Scrivener, K., Application of the Rietveld method to the analysis of anhydrous cement. Cem. Concr. Res. 2011, 41 (2), 133-‐148. (12) Garboczi, E.; Bullard, J., Shape analysis of a reference cement. Cem. Concr. Res. 2004, 34 (10), 1933-‐1937. (13) ASTM International: Annual Book of Standards. www.astm.org. 2012. (14) Zhang, J.; Scherer, G. W., Comparison of methods for arresting hydration of cement. Cem. Concr. Res. 2011, 41 (10), 1024-‐1036. (15) Mounanga, P.; Khelidj, A.; Loukili, A.; Baroghel-‐Bouny, V., Predicting Ca (OH) 2 content and chemical shrinkage of hydrating cement pastes using analytical approach. Cem. Concr. Res. 2004, 34 (2), 255-‐265. (16) Taylor, H. F. W. Cement Chemistry, 2 ed.; Thomas Telford Publishing: London, 1997. (17) Beruto, D. T.; Barberis, F.; Botter, R., Calcium carbonate binding mechanisms in the setting of calcium and calcium–magnesium putty-‐limes. J. cultural heritage 2005, 6 (3), 253-‐260.
(18) Lee, D. K., An apparent kinetic model for the carbonation of calcium oxide by carbon dioxide. Chem. Eng. J. 2004, 100 (1), 71-‐77. (19) Mess, D.; Sarofim, A. F.; Longwell, J. P., Product layer diffusion during the reaction of calcium oxide with carbon dioxide. Energy & Fuels 1999, 13 (5), 999-‐1005. (20) Dubina, E.; Korat, L.; Black, L.; Strupi-‐Šuput, J.; Plank, J., Influence of water vapour and carbon dioxide on free lime during storage at 80° C, studied by Raman spectroscopy. Spectrochimica Acta Part A: Molecular and Biomolecular Spectroscopy 2013, 111, 299-‐303. (21) Barret, P.; Ménétrier, D., Filter dissolution of C3S as a function of the lime concentration in a limited amount of lime water. Cem. Concr. Res. 1980, 10 (4), 521-‐534. (22) Jennings, H. M., Aqueous solubility relationships for two types of calcium silicate hydrate. J. Am. Ceram. Soc. 1986, 69 (8), 614-‐618. (23) Thomas, J. J.; Jennings, H. M.; Chen, J. J., Influence of nucleation seeding on the hydration mechanisms of tricalcium silicate and cement. J. Phys. Chem. C 2009, 113 (11), 4327-‐4334. (24) Nicoleau, L.; Nonat, A.; Perrey, D., The di-‐and tricalcium silicate dissolutions. Cem. Concr. Res. 2013, 47, 14-‐30. (25) Alizadeh, R.; Raki, L.; Makar, J. M.; Beaudoin, J. J.; Moudrakovski, I., Hydration of tricalcium silicate in the presence of synthetic calcium–silicate–hydrate. J. Mater. Chem. 2009, 19 (42), 7937-‐7946. (26) Scheetz, B.; Tikalsky, P.; Badger, S. In Control of the microstructure of concrete: a case for nanometer-‐sized seeding, Proceedings of the 11th International Congress on the Chemsitry of Cement, ed. G. Grieveand G. Owens, Durban, South Africa, 2003; pp 1692-‐1699. (27) Bentz, D. P.; Barrett, T.; De la Varga, I.; Weiss, W. J., Relating compressive strength to heat release in mortars. Adv. Civ. Eng. Mater. 2012, 1 (1), 14. (28) Kumar, A.; Oey, T.; Kim, S.; Thomas, D.; Badran, S.; Li, J.; Fernandes, F.; Neithalath, N.; Sant, G., Simple methods to estimate the influence of limestone fillers on reaction and property evolution in cementitious materials. Cem. Concr. Comp. 2013, 42, 20-‐29. (29) Skapa, R., Optimum sulfate content of portland cement. PhD Dissertation, University of Aberdeen, Scotland, 2009. ( 30 ) Kumar, A. Modelling Hydration Kinetics of Cementitious Systems. PhD Dissertation, École Polytechnique Fédérale de Lausanne, Switzerland, 2012. (31) Sato, T.; Diallo, F., Seeding effect of nano-‐CaCO3 on the hydration of tricalcium silicate. Trans. Res. Rec. 2010, 2141 (1), 61-‐67. (32) Oey, T.; Kumar, A.; Bullard, J. W.; Neithalath, N.; Sant, G., The filler effect: the influence of filler content and surface area on cementitious reaction rates. J. Am. Ceram. Soc. 2013, 96 (6), 1978-‐1990. (33) Matschei, T.; Lothenbach, B.; Glasser, F., The AFm phase in Portland cement. Cem. Concr. Res. 2007, 37 (2), 118-‐130. (34) Lothenbach, B.; Le Saout, G.; Gallucci, E.; Scrivener, K., Influence of limestone on the hydration of Portland cements. Cem. Concr. Res. 2008, 38 (6), 848-‐860. (35) Kumar, A.; Oey, T.; Falla, G. P.; Henkensiefken, R.; Neithalath, N.; Sant, G., A comparison of intergrinding and blending limestone on reaction and strength evolution in cementitious materials. Const. Build. Mate. 2013, 43, 428-‐435. (36) Lyse, I., Tests on consistency and strength of concrete having constant water content. Proceedings of the American Society for Testing and Materials, 32 (Paper: 60), 1932, 629-‐636. (37) Gallucci, E.; Zhang, X.; Scrivener, K., Effect of temperature on the microstructure of calcium silicate hydrate (CSH). Cem. Concr. Res. 2013, 53, 185-‐195.