THE PREPARATORY STUDY FOR PASIG-MARIKINA RIVER CHANNEL IMPROVEMENT PROJECT (PHASE III) IN THE REPUBLIC OF THE PHILIPPINES FINAL REPORT Volume 2 Main Report October 2011 CTI ENGINEERING INTERNATIONAL CO., LTD JAPAN INTERNATIONAL COOPERATION AGENCY DEPARTMENT OF PUBLIC WORKS AND HIGHWAYS THE REPUBLIC OF THE PHILIPPINES GED CR (3) 11-136
Transcript
THE PREPARATORY STUDY
FOR
PASIG-MARIKINA RIVER CHANNEL
IMPROVEMENT PROJECT (PHASE III)
IN
THE REPUBLIC OF THE
PHILIPPINES
FINAL REPORT
Volume 2 Main Report
October 2011
CTI ENGINEERING INTERNATIONAL CO., LTD
JAPAN INTERNATIONAL
COOPERATION AGENCY DEPARTMENT OF PUBLIC
WORKS AND HIGHWAYS
THE REPUBLIC OF THE
PHILIPPINES
GED
CR (3)
11-136
THE PREPARATORY STUDY
FOR
PASIG-MARIKINA RIVER CHANNEL
IMPROVEMENT PROJECT (PHASE III)
IN THE
REPUBLIC OF THE PHILIPPINES
FINAL REPORT
VOLUME II: MAIN REPORT
OCTOBER 2011
CTI ENGINEERING INTERNATIONAL CO., LTD.
DEPARTMENT OF PUBLIC WORKS AND HIGHWAYS REPUBLIC OF THE PHILIPPINES
JAPAN INTERNATIONAL COOPERATION AGENCY
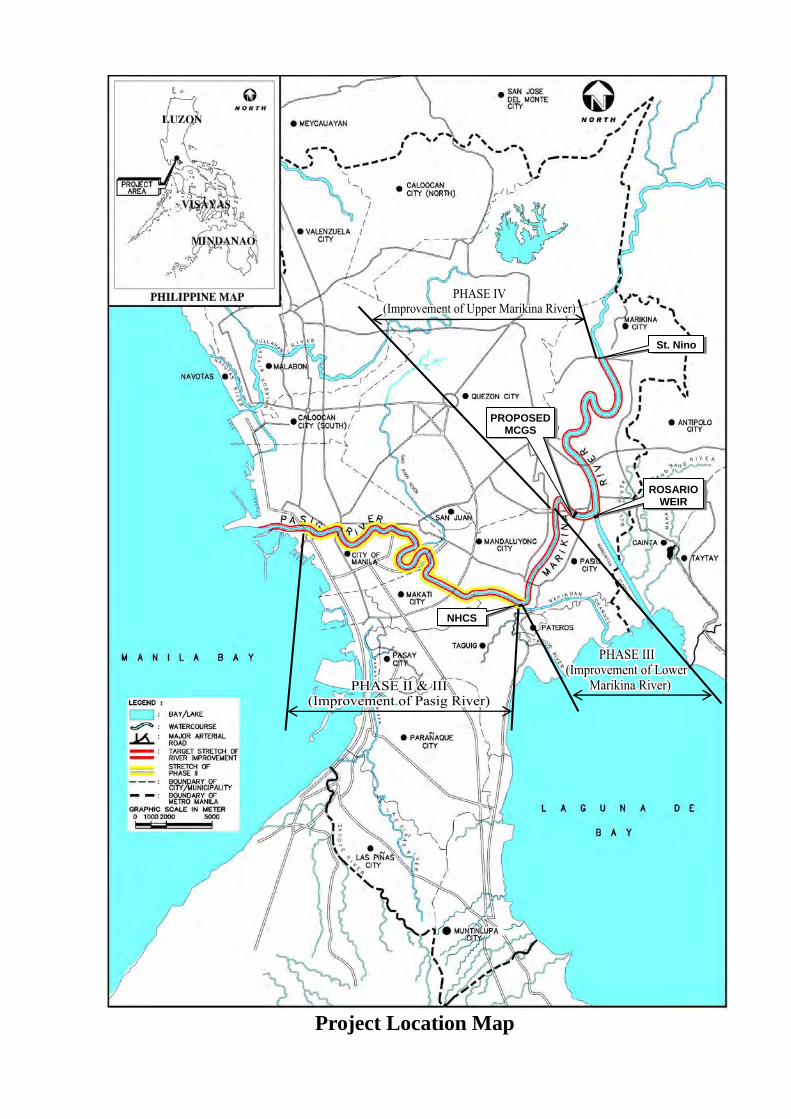
Project Location Map
St. Nino
ROSARIOWEIR
PROPOSEDMCGS
NHCS
PHOTOGRAPHS
Phase III of Pasig-Marikina River Channel Improvement Project (Photo taken in 2009)
Phase III and IV Project Sections (2009)
Pasig-Marikina River and Mangahan Floodway (1/3)
Napindan River
Marikina River
Section for Phase IV
Mangahan Floodway
Section for Phase III
Marikina River
Mangahan Floodway
Section for Phase III
Mangahan Floodway and Congested Residential Area (2009)
2009 1988
Status of Land Use around Inlet of Mangahan Floodway: 1988 vs. 2009
Flood Inundation by Typhoon Ondoy around Mangahan Floodway (2009)
Pasig-Marikina River and Mangahan Floodway (2/3)
Mangahan Floodway
Marikina River
Mangahan Floodway Mangahan Floodway
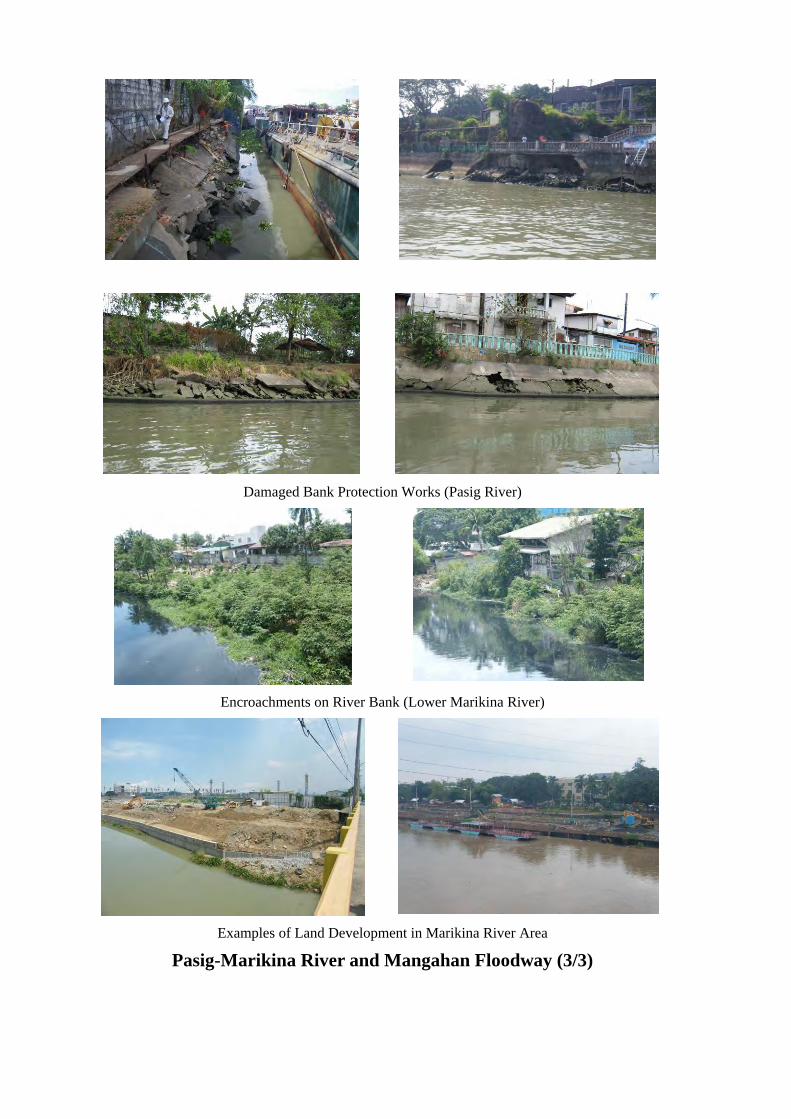
Damaged Bank Protection Works (Pasig River)
Encroachments on River Bank (Lower Marikina River)
Examples of Land Development in Marikina River Area
Pasig-Marikina River and Mangahan Floodway (3/3)
Preparatory Study for Pasig-Marikina River Channel Improvement Project (Phase III)
Final Report - Main ReportTable of Contents
i
TABLE OF CONTENTS
PROJECT LOCATION MAP PHOTOGRAPHS
CHAPTER 1 OUTLINE OF the STUDY ........................................................................ 1-1
1.1 Background of the Study ............................................................................................. 1-1 1.2 Objectives of the Study................................................................................................ 1-3 1.3 Study Area ................................................................................................................... 1-3 1.4 Study Schedule ............................................................................................................ 1-3 1.5 Basic Study Flow......................................................................................................... 1-3 1.6 Related Projects/Studies by DPWH, JICA and Other Donors..................................... 1-4 1.7 Significance of Flood Control Projects........................................................................ 1-5
1.7.1 Necessity of Flood Control Projects Compared with Other Infra-Projects .......... 1-5 1.7.2 Necessity of Flood Control Project in the Pasig-Marikina River Basin ............... 1-6 1.7.3 Effect by Enhancement of Safety Level against Flood Damage .......................... 1-6
1.8 Linkage of Flood Control Project with Water Resources Development...................... 1-8 1.8.1 Role of Pasig-Marikina River Basin in Water Resources Development............... 1-8 1.8.2 Conceivable Facilities for a Flood Control Project with Linkage to Water
Resources Development ....................................................................................... 1-8
CHAPTER 2 PRESENT CONDITION OF THE STUDY AREA................................. 2-1
2.1 Natural Condition ........................................................................................................ 2-1 2.1.1 Climate.................................................................................................................. 2-1 2.1.2 River ..................................................................................................................... 2-1 2.1.3 Drainage System................................................................................................... 2-2 2.1.4 Major Floods and Flood Damage ......................................................................... 2-3
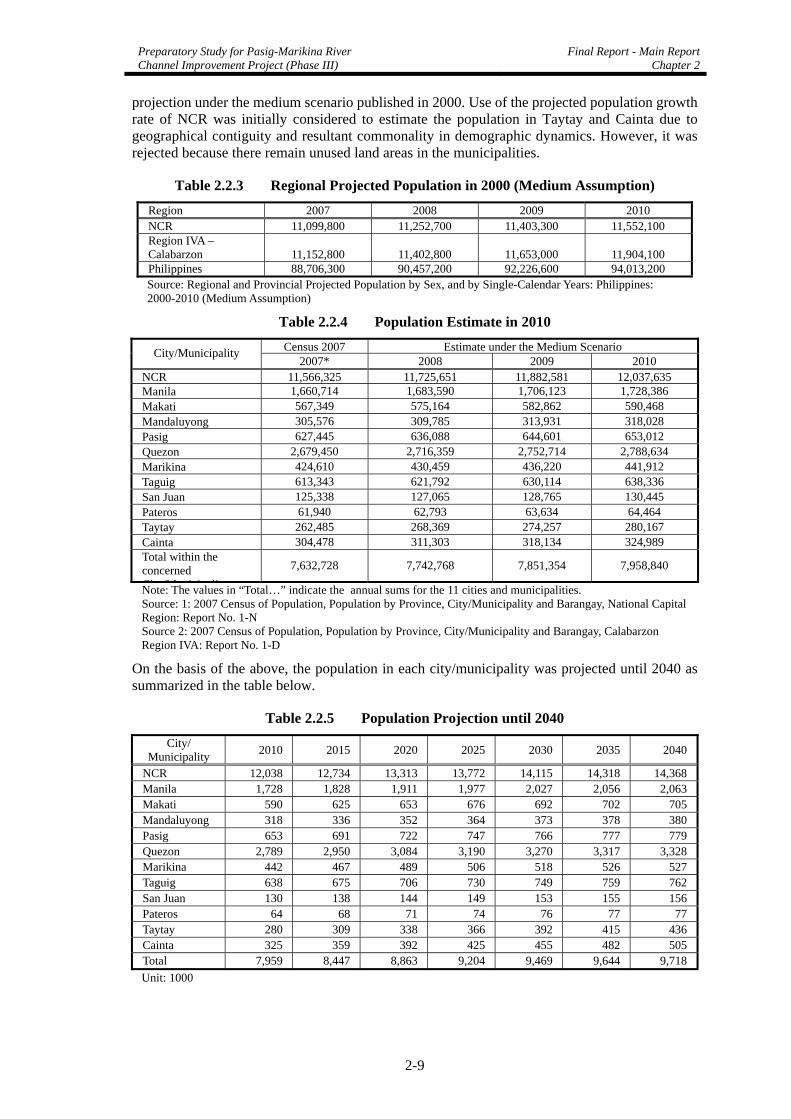
2.2 Socio-Economic Condition.......................................................................................... 2-7 2.2.1 Geographical Jurisdiction of Concerned City/Municipality ................................. 2-7 2.2.2 Demography and Population ................................................................................ 2-8 2.2.3 Economy and Related Development Plans ......................................................... 2-10
2.3 Environmental Condition........................................................................................... 2-13 2.3.1 Water Quality...................................................................................................... 2-13 2.3.2 Flora and Fauna .................................................................................................. 2-14 2.3.3 Environmental Impact Assessment..................................................................... 2-16
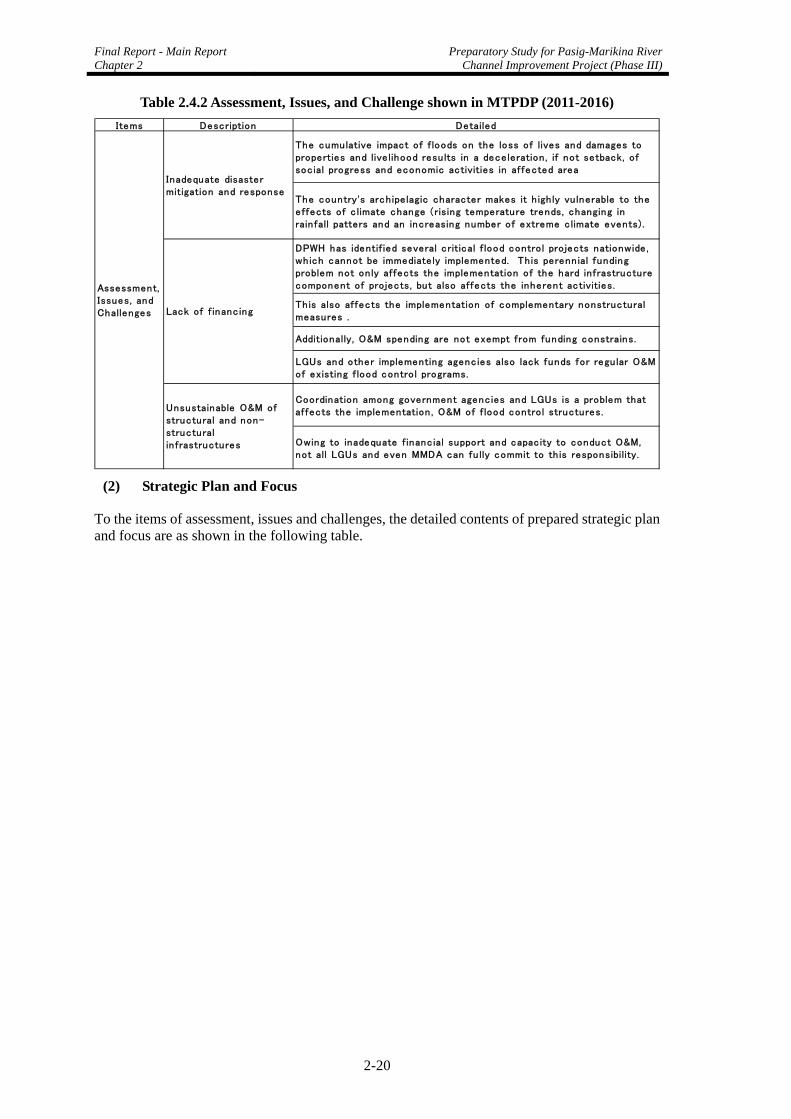
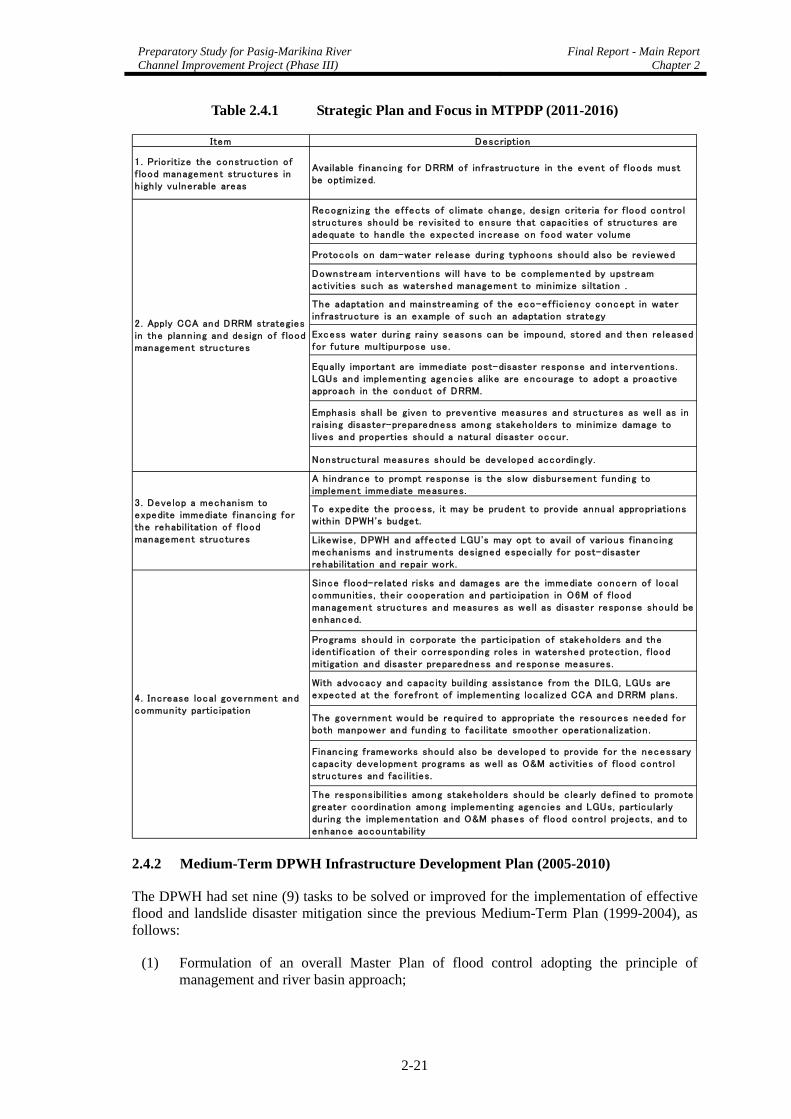
2.4 National Policy and Direction for Flood Control ...................................................... 2-18 2.4.1 Medium-Term Philippine Development Plan (2011-2016) ................................ 2-19 2.4.2 Medium-Term DPWH Infrastructure Development Plan (2005-2010) .............. 2-21
2.5 Related Ongoing Projects .......................................................................................... 2-22 2.5.1 Phase II Project ................................................................................................... 2-22 2.5.2 Project undertaken by Pasig River Rehabilitation Commission (PRRC) ........... 2-25
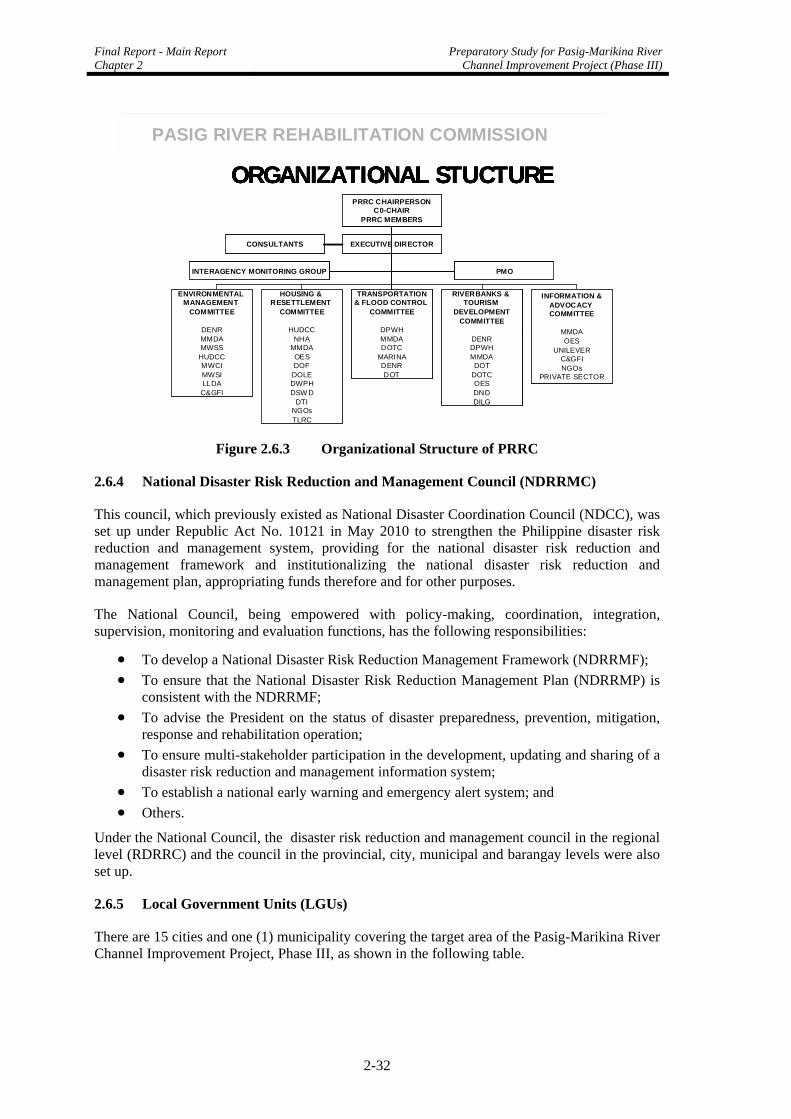
2.6 Related Organizations................................................................................................ 2-28 2.6.1 Department of Public Works and Highways (DPWH) ....................................... 2-28 2.6.2 Metropolitan Manila Development Authority (MMDA).................................... 2-30 2.6.3 Pasig River Rehabilitation Commission (PRRC) ............................................... 2-31 2.6.4 National Disaster Risk Reduction and Management Council (NDRRMC)........ 2-32 2.6.5 Local Government Units (LGUs) ....................................................................... 2-32
CHAPTER 3 STUDies AND INVESTIGATIONs........................................................... 3-1
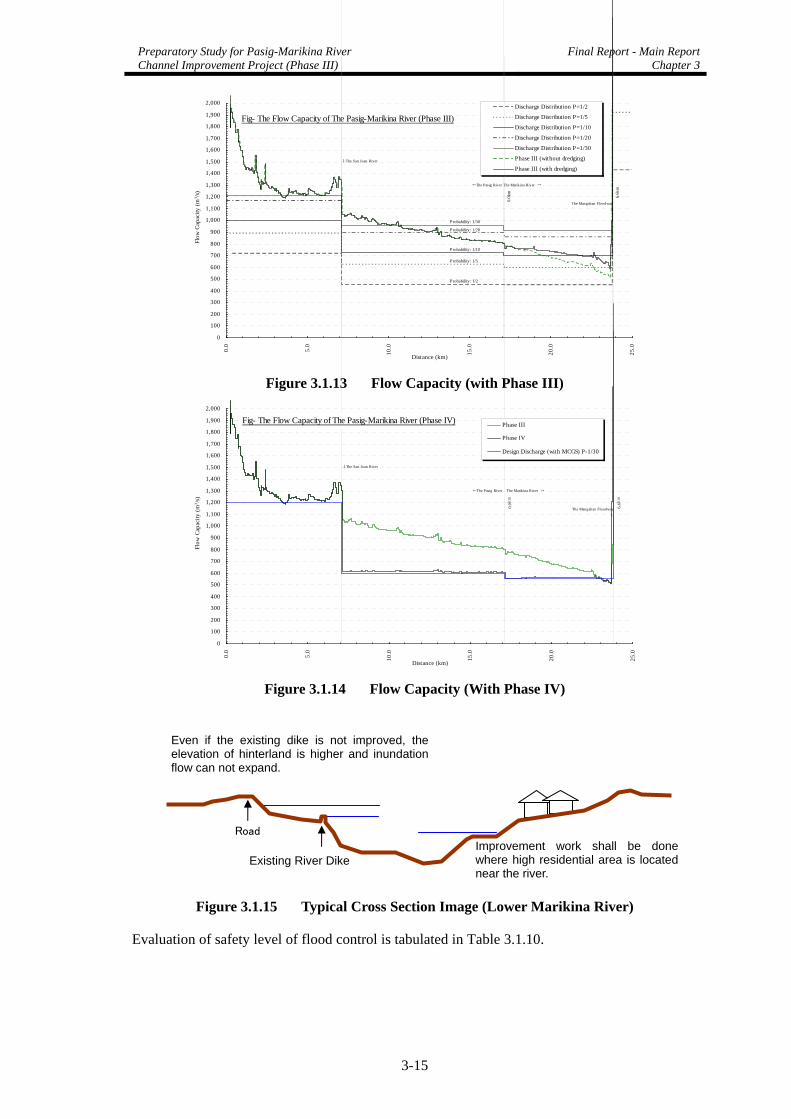
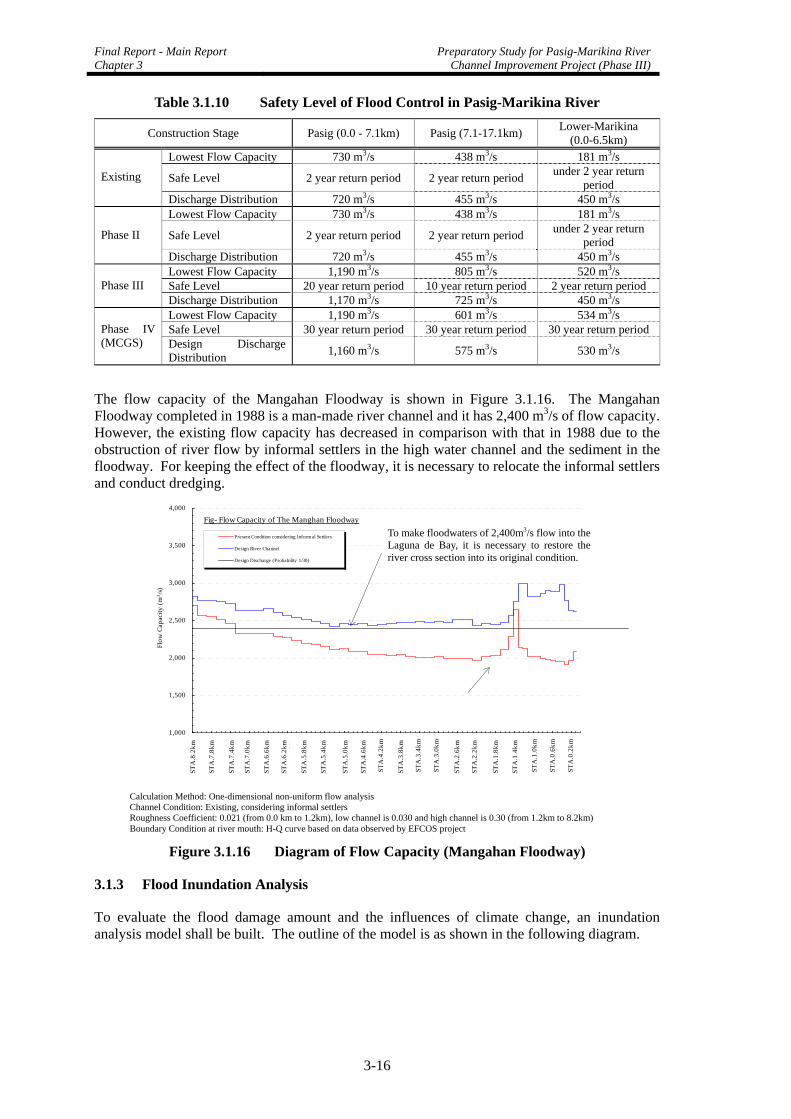
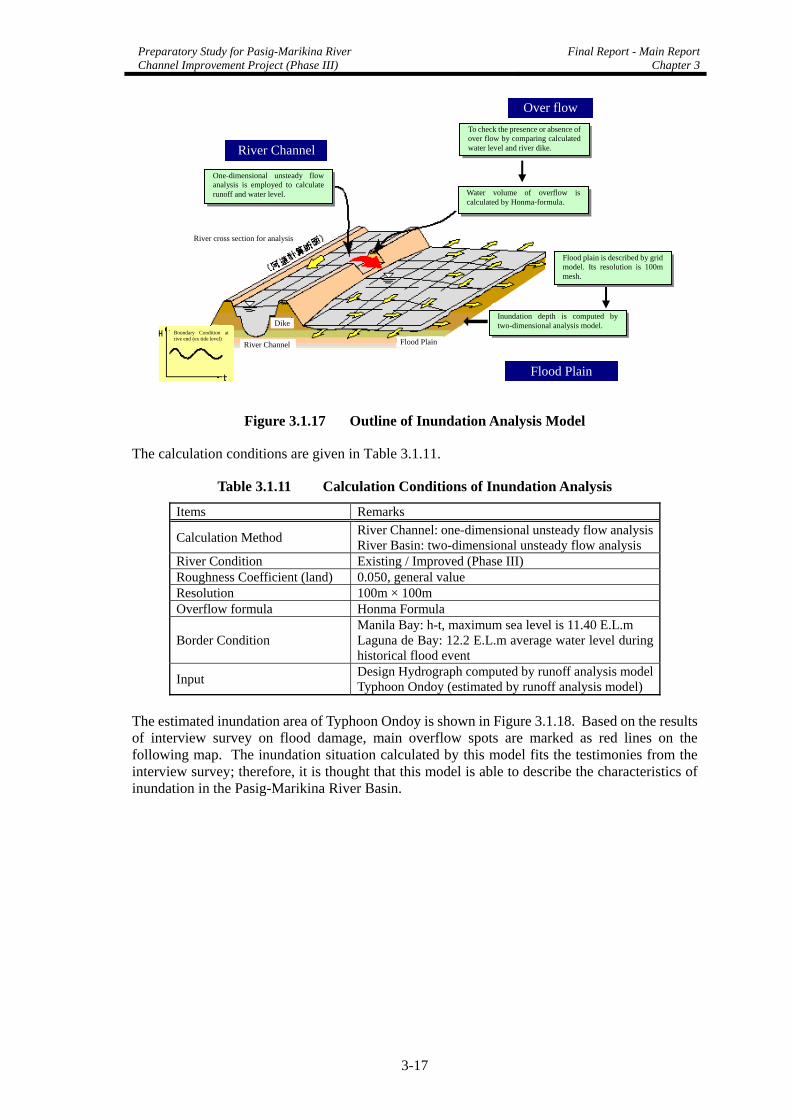
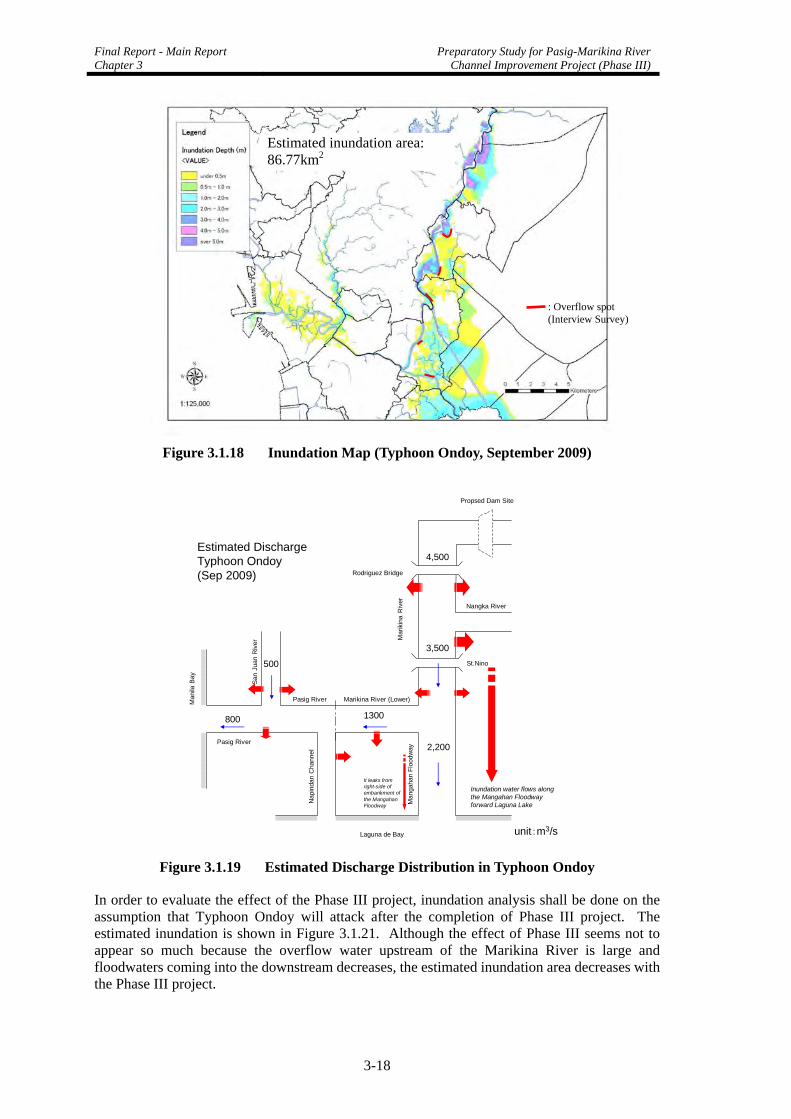
3.1 Hydrology and Hydraulics Study ................................................................................ 3-1 3.1.1 Flood Runoff Analysis .......................................................................................... 3-1 3.1.2 Flow Capacity of River Channel ........................................................................ 3-13 3.1.3 Flood Inundation Analysis .................................................................................. 3-16 3.1.4 Effectiveness of Rosario Weir............................................................................. 3-19
Final Report - Main Report Table of Contents
Preparatory Study for Pasig-Marikina River Channel Improvement Project (Phase III)
ii
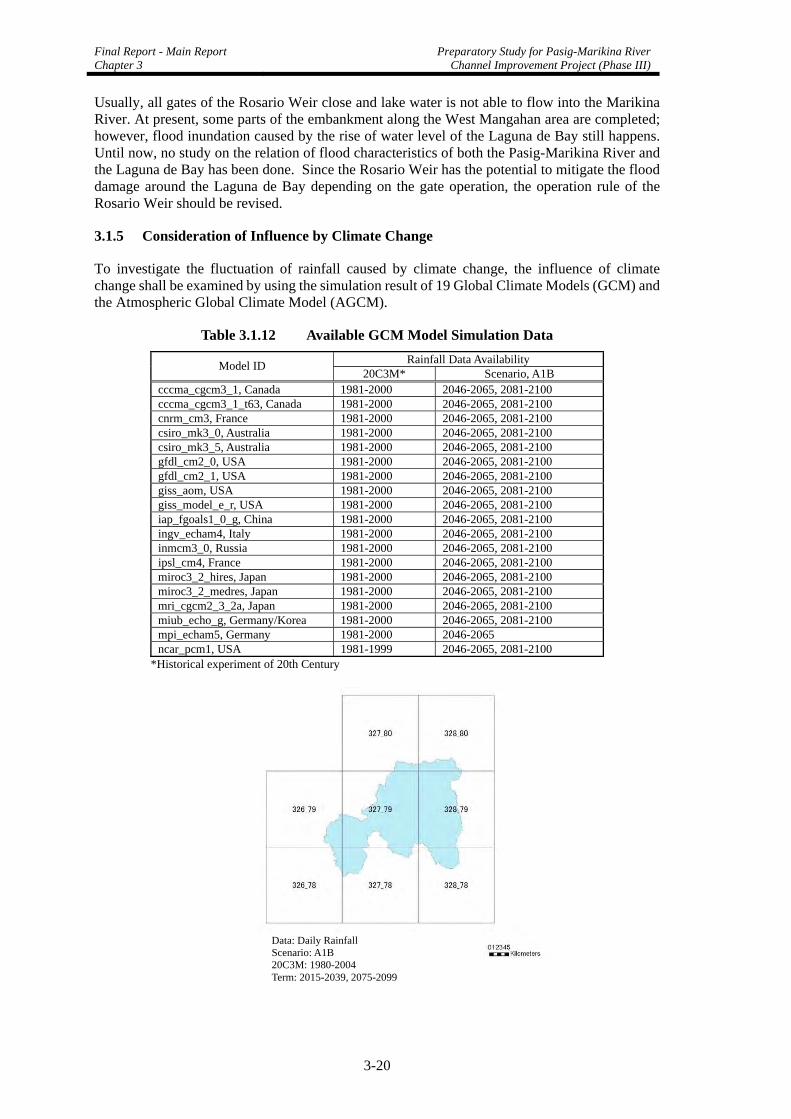
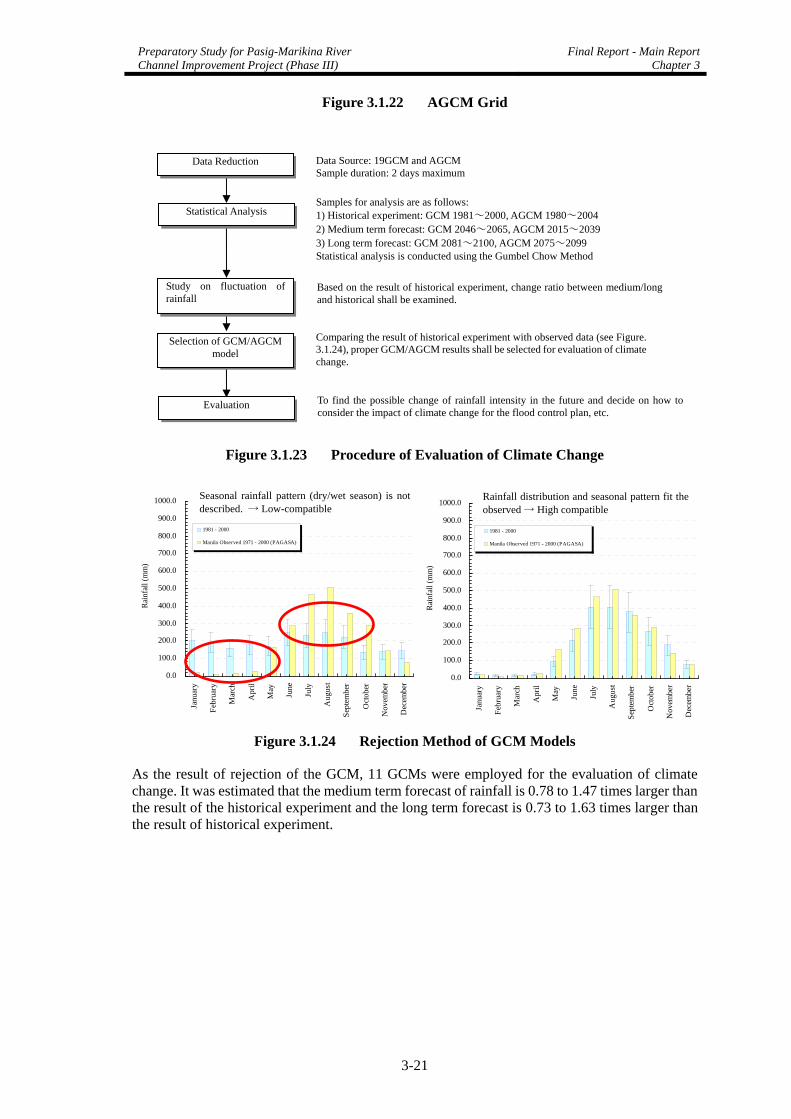
3.1.5 Consideration of Influence by Climate Change .................................................. 3-20 3.1.6 Necessity of the MCGS....................................................................................... 3-25 3.1.7 Influence caused by Land Development ............................................................. 3-26
3.2 Target Stretch for River Channel Improvement ......................................................... 3-27 3.2.1 Stretch for Phase II.............................................................................................. 3-27 3.2.2 Stretch for Phase III ............................................................................................ 3-31 3.2.3 Construction of MCGS ....................................................................................... 3-31 3.2.4 Protection Scale of Improved Pasig and Lower Marikina Rivers without MCGS
3-36 3.3 Consideration of Flood Control Measures ................................................................. 3-36
3.3.1 Structural Measures............................................................................................. 3-36 3.3.2 Nonstructural Measures ...................................................................................... 3-37 3.3.3 Applicable Combination of Structural and Nonstructural Measures .................. 3-59
3.4 Review of Existing EIA (EIS) Report........................................................................ 3-59 3.4.1 Environmental Compliance Certificate (ECC) issued for the Project................. 3-59 3.4.2 Comparison of the EIS and the JICA Guidelines for Environmental and Social
3.5.1 Project Description.............................................................................................. 3-61 3.5.2 Potential Impacts................................................................................................. 3-66 3.5.3 Objectives of the Resettlement Action Plan........................................................ 3-68 3.5.4 Scope of Resettlement Impact............................................................................. 3-68 3.5.5 Legal Framework ................................................................................................ 3-70 3.5.6 Policy on Eligibility, Compensation and Other Entitlements ............................. 3-77 3.5.7 Measures of Compensation and Assistance ........................................................ 3-81
3.6 Mechanism of Land Development............................................................................. 3-85 3.6.1 Typical Examples of Unfavorable Land Development ....................................... 3-85 3.6.2 Outline of Current Land Development Mechanism............................................ 3-93 3.6.3 Issues on Current Mechanism............................................................................. 3-94 3.6.4 Consideration of Improvement of Current Mechanism ...................................... 3-98
3.7 Arrangement of Flood Mitigation Committee ......................................................... 3-100 3.7.1 Necessity of Flood Mitigation Committee........................................................ 3-100 3.7.2 Current Arrangement of Coordination Organization for Disaster Mitigation...3-101 3.7.3 Consideration of Setup of Flood Mitigation Committee or Strengthening of
Existing Organization ....................................................................................... 3-104 3.7.4 Setup of Flood Mitigation Committee (FMC) .................................................. 3-105 3.7.5 Timing for the Setup of FMC............................................................................ 3-109 3.7.6 Other Information related to FMC .................................................................... 3-109
3.8 Arrangement of Memorandum of Agreement (MOA)............................................. 3-110 3.8.1 General Background of Necessity of MOA...................................................... 3-110 3.8.2 MOA arranged for the Phase II Project............................................................. 3-110 3.8.3 Items included in the MOA for Phase III Project.............................................. 3-111 3.8.4 Timing of Execution of MOA........................................................................... 3-114
4.1 Objectives of the Project .............................................................................................. 4-1 4.1.1 Objectives of the Overall PMRCIP Project........................................................... 4-1 4.1.2 Objective of the Phase III Project ......................................................................... 4-1
4.2 Planning Conditions..................................................................................................... 4-1 4.3 River Improvement Plan of Pasig River and Lower Marikina River........................... 4-2 4.4 Review of River Structures in the Detailed Design ..................................................... 4-6 4.5 Strategy of Project Implementation and Operation/Maintenance .............................. 4-11
CHAPTER 5 CONSTRUCTION PLAN AND COST ESTIMATE............................... 5-1
Preparatory Study for Pasig-Marikina River Channel Improvement Project (Phase III)
Final Report - Main ReportTable of Contents
iii
5.1.1 Contract Packages of Phase III ............................................................................. 5-1 5.1.2 Scope of Work ...................................................................................................... 5-1
5.2 Construction Planning Method .................................................................................... 5-2 5.2.1 Construction Conditions ....................................................................................... 5-2 5.2.2 Available Working Time ....................................................................................... 5-2 5.2.3 Site Condition ....................................................................................................... 5-4
CHAPTER 6 PROJECT EVALUATION AND IMPLEMENTATION ........................ 6-1
6.1 Environmental Evaluation of the Project..................................................................... 6-1 6.1.1 Assessment of Project Impacts ............................................................................. 6-1 6.1.2 Mitigation Measures and Monitoring Points in Phase III Construction Stage...... 6-3
6.2 Economic Evaluation................................................................................................... 6-5 6.2.1 Economic Cost of the Project ............................................................................... 6-5 6.2.2 Benefit of the Project ............................................................................................ 6-8 6.2.3 Economic Analysis ............................................................................................. 6-12 6.2.4 Sensitivity Analysis ............................................................................................ 6-13 6.2.5 Effects of the Project and Performance Indicators.............................................. 6-16
6.3 Implementation of the Project ................................................................................... 6-19 6.3.1 Project Implementation Agency.......................................................................... 6-19 6.3.2 Implementation Schedule ................................................................................... 6-20
Preparatory Study for Pasig-Marikina River Channel Improvement Project (Phase III)
iv
LIST OF TABLES
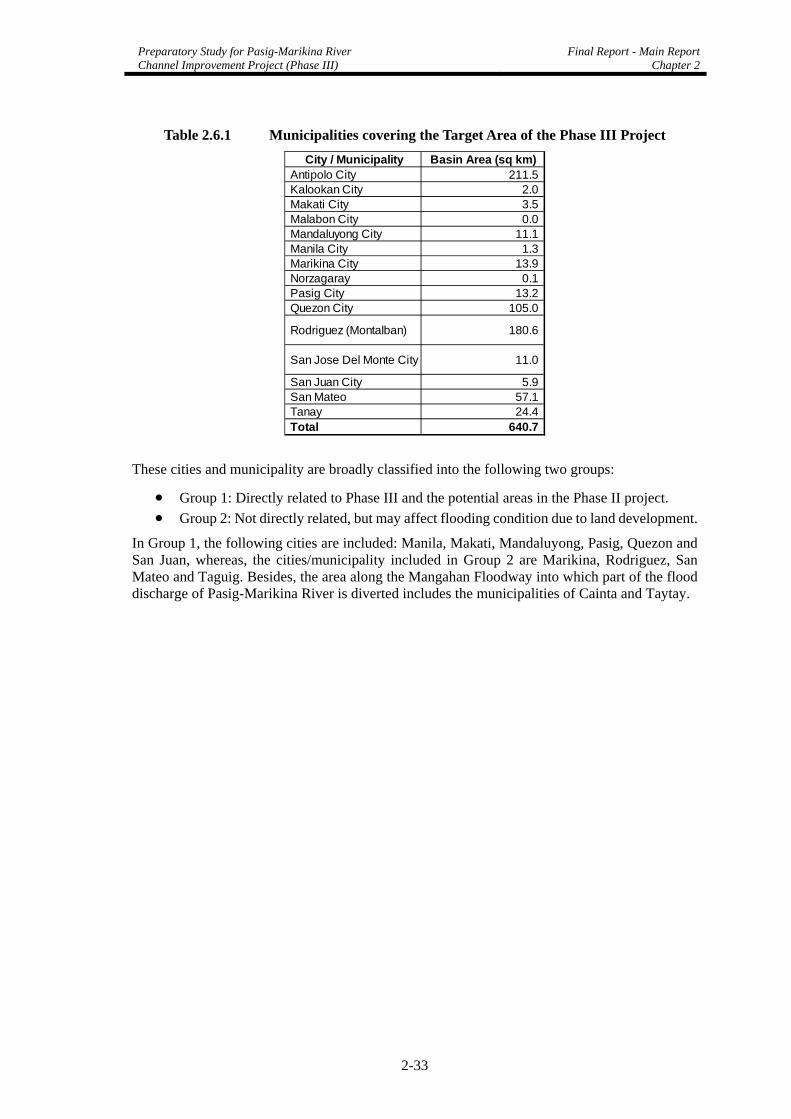
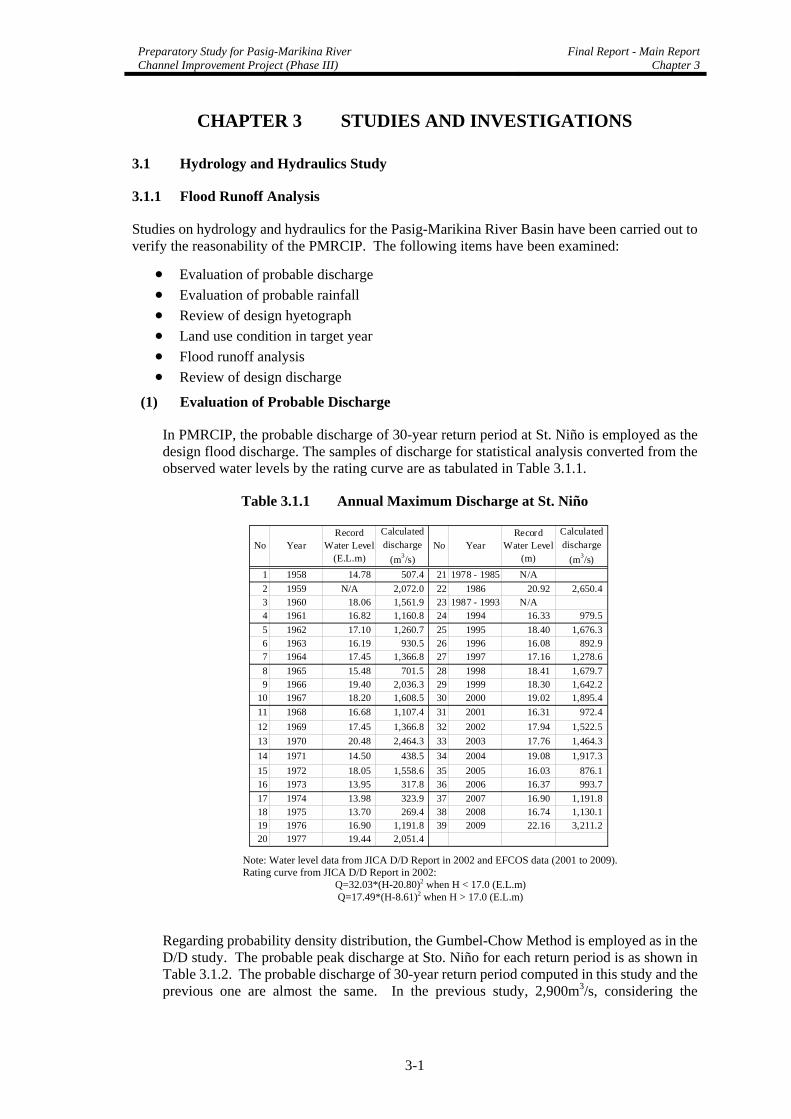
Table 1.6.1 Projects/Studies Related to Phase III ................................................................. 1-5 Table 2.1.1 Flow Capacity of Pasig-Marikina River Channels............................................. 2-2 Table 2.1.2 Casualties by Typhoon Seniang (2000).............................................................. 2-3 Table 2.1.3 Flood Damage in Metro Manila by Typhoons ................................................... 2-3 Table 2.1.4 Casualties by Typhoon Ondoy in 2009 .............................................................. 2-4 Table 2.1.5 Interview Survey Results ................................................................................... 2-6 Table 2.2.1 Geographic Jurisdiction of Concerned Cities/Municipalities ............................ 2-7 Table 2.2.2 Computed Average Annual Population Growth................................................. 2-8 Table 2.2.3 Regional Projected Population in 2000 (Medium Assumption) ........................ 2-9 Table 2.2.4 Population Estimate in 2010 .............................................................................. 2-9 Table 2.2.5 Population Projection until 2040 ....................................................................... 2-9 Table 2.2.6 GDP Growth Rates at Constant (1985) Prices ................................................. 2-10 Table 2.2.7 Percentage Share of Regional GDP to National GDP...................................... 2-10 Table 2.2.8 Per Capita Gross Regional Domestic Product at Current Prices...................... 2-10 Table 2.2.9 Poverty Indicators of Concerned Cities/Municipalities ................................... 2-11 Table 2.2.10 Existing and Future Land Use.......................................................................... 2-13 Table 2.3.1 Aquatic Macrophytes found in the Pasig River ............................................... 2-14 Table 2.3.2 Summary of Environmentally Critical Projects (ECPs)................................... 2-18 Table 2.3.3 Summary of Environmentally Critical Areas (ECAs)...................................... 2-18 Table 2.4.1 Strategic Plan and Focus in MTPDP (2011-2016) ........................................... 2-21 Table 2.5.1 Completed Other Projects for Channel Improvement of the Pasig River ........ 2-23 Table 2.5.2 Summary of Loan Agreement No. PH-P239 for Phase II Project.................... 2-24 Table 2.5.3 Number of Informal Settlers along Pasig River............................................... 2-26 Table 2.6.1 Municipalities covering the Target Area of the Phase III Project .................... 2-33 Table 3.1.1 Annual Maximum Discharge at St. Niño........................................................... 3-1 Table 3.1.2 Probable Discharge at St. Niño .......................................................................... 3-2 Table 3.1.3 Probable Rainfall (Port Area Station) ................................................................ 3-2 Table 3.1.4 Probable Rainfall (Science Garden Station) ...................................................... 3-3 Table 3.1.5 Probable Rainfall at Port Area Station ............................................................... 3-3 Table 3.1.6 Adjustment Factor (D/D Study, 2002) ............................................................... 3-3 Table 3.1.7 Parameters of Rainfall Intensity Formula (Port Area Station) ........................... 3-5 Table 3.1.8 Estimation of Urbanization ................................................................................ 3-6 Table 3.1.9 Calculated Discharge Distribution ................................................................... 3-12 Table 3.1.10 Safety Level of Flood Control in Pasig-Marikina River.................................. 3-16 Table 3.1.11 Calculation Conditions of Inundation Analysis ............................................... 3-17 Table 3.1.12 Available GCM Model Simulation Data.......................................................... 3-20 Table 3.1.13 Hydrological Influence of the Development Projects...................................... 3-26 Table 3.2.1 Potential Areas in Phase II Project Stretch (Pasig River)................................. 3-28 Table 3.2.2 Volumes and Costs of Priority Groups for Phase III........................................ 3-31 Table 3.2.3 Improvements Length in both Banks ............................................................... 3-31 Table 3.2.4 Diversion Conditions Without MCGS and With Rosario Weir Open (1983
Model Test) ...................................................................................................... 3-34 Table 3.2.5 Dimensions and Features of Redesigned MCGS............................................. 3-34 Table 3.3.1 Flood Evacuation Condition during Typhoon Ondoy ...................................... 3-39 Table 3.3.2 Problems and Issues regarding Flood Evaluation System during Typhoon
Ondoy............................................................................................................... 3-39 Table 3.3.3 Present Condition and Issues on Nonstructural Measures in the Study Area ..3-40 Table 3.3.4 Nonstructural Measures by Donors and Related Agencies .............................. 3-42 Table 3.3.5 Outcome of the Ready Project for GMMA...................................................... 3-43 Table 3.3.6 Outcomes and Activities of the Resilience Project .......................................... 3-43 Table 3.3.7 Outcomes and Activities of the Risk Analysis Project..................................... 3-44 Table 3.3.8 Needs for Nonstructural Measures in Study Area............................................ 3-46 Table 3.3.9 Technical Assistance for Nonstructural Measures (Draft) ............................... 3-48
Preparatory Study for Pasig-Marikina River Channel Improvement Project (Phase III)
Final Report - Main ReportTable of Contents
v
Table 3.3.10 Climate Change Impact on Flood Condition ................................................... 3-50 Table 3.3.11 Climate Change Impact on Flood Condition ................................................... 3-51 Table 3.3.12 Nonstructural Measures Corresponding to Flood Characteristics ................... 3-52 Table 3.3.13 Component of Adaptation Measures................................................................ 3-53 Table 3.3.14 Selection of Nonstructural Measures............................................................... 3-53 Table 3.3.15 Activities of Information Campaign and Publicity.......................................... 3-55 Table 3.3.16 Contents of Establishment of Website ............................................................. 3-56 Table 3.3.17 Activities for Elaboration of Flood Hazard Map and Guideline...................... 3-58 Table 3.5.1 Identification of the Alternatives Considered to Avoid or Minimize
Resettlement .................................................................................................... 3-67 Table 3.5.2 Schematic Images of the Alternatives Considered to Avoid or Minimize
Resettlement .................................................................................................... 3-67 Table 3.5.3 Number of PAFs / PAPs................................................................................... 3-68 Table 3.5.4 Dates of Census Commencement (Cut-Off Date) ........................................... 3-69 Table 3.5.5 Number of Structures to be Affected 100 %.................................................... 3-69 Table 3.5.6 Number of Improvements to be Affected 100 %............................................. 3-69 Table 3.5.7 Number of Gardens and Trees to be Affected.................................................. 3-70 Table 3.5.8 Legal Base for Eviction and Demolition Related to Government
Infrastructure Projects...................................................................................... 3-71 Table 3.5.9 Dates of Census Commencement (Cut-Off Date) ........................................... 3-80 Table 3.5.10 Entitlement Matrix........................................................................................... 3-84 Table 3.6.1 Issuance Dates of ECC and Building Permit ................................................... 3-87 Table 3.6.2 Basic Idea to deal with the Development Issues.............................................. 3-91 Table 3.7.1 Members of FMC .......................................................................................... 3-106 Table 3.8.1 Items to be included in the MOA .................................................................. 3-112 Table 3.8.2 Items to be included in Individual Certifications........................................... 3-114 Table 4.3.1 Design Discharge and Freeboard of Flood Control Structures .......................... 4-5 Table 4.4.1 Preliminary Design for Revetment at Potential Areas along the Pasig River.... 4-7 Table 5.1.1 Phase III Construction Area............................................................................... 5-1 Table 5.1.2 Main Civil Works of Phase III Project............................................................... 5-1 Table 5.1.3 Volume of Main Construction Works for Phase III (excluding Steel Sheet Pile
Works)................................................................................................................ 5-2 Table 5.2.1 Average Number of Rainy Days at the Project Site........................................... 5-3 Table 5.2.2 Workable Days................................................................................................... 5-3 Table 5.2.3 Tidal Levels of Manila Bay ............................................................................... 5-4 Table 5.3.1 List of Materials to be Imported for Phase III ................................................... 5-6 Table 5.4.1 Types of Repair of Damaged Wet Stone Masonry and Revetment.................... 5-8 Table 5.4.2 Dewatering Activity for Construction of Drainage Outlet if Necessary.......... 5-10 Table 5.5.1 Unit Construction Schedules ........................................................................... 5-12 Table 5.5.2 Summary of Construction Schedule ................................................................ 5-13 Table 5.6.1 Foreign and Local Currency Portions of Cost ................................................. 5-14 Table 6.1.1 Assessment of Negative Impacts ...................................................................... 6-1 Table 6.1.2 Mitigation Measures for Negative Impacts ....................................................... 6-3 Table 6.2.1 DPWH Budget for Phase II Project ................................................................... 6-6 Table 6.2.2 Financial Cost of Phase III Project .................................................................... 6-6 Table 6.2.3 Financial Cost of Phase IV Project .................................................................... 6-6 Table 6.2.4 Arithmetic Means of Price Indexes ................................................................... 6-7 Table 6.2.5 Budget for Pasig-Marikina River Improvement Project in 2010 Price Level
(Phase II)............................................................................................................ 6-7 Table 6.2.6 Conversion Factors used in the Analysis of Financial Cost............................... 6-7 Table 6.2.7 Economic Cost of the Budget for Pasig-Marikina River Improvement Project
(Phase II)............................................................................................................ 6-7 Table 6.2.8 Growth Rate of Housing Value.......................................................................... 6-8 Table 6.2.9 Estimated Flood Area ........................................................................................ 6-9 Table 6.2.10 Flood Damage Without Project: Entire Project Area, 2001............................. 6-10
Final Report - Main Report Table of Contents
Preparatory Study for Pasig-Marikina River Channel Improvement Project (Phase III)
vi
Table 6.2.11 Flood Damages Without Project: Entire Project Area, 2010............................ 6-10 Table 6.2.12 Flood Damage: Lower Pasig River Without Phase III..................................... 6-11 Table 6.2.13 Flood Damage: Lower Pasig River With Phase III .......................................... 6-11 Table 6.2.14 Benefit Estimation of Pasig River Phase III .................................................... 6-12 Table 6.2.15 Benefit Estimation for each of the Project Components in 2010.................... 6-12 Table 6.2.16 Economic Analysis for each of the Project Components ................................. 6-13 Table 6.2.17 Sensitivity Analysis: 20% Cost Overrun.......................................................... 6-13 Table 6.2.18 Sensitivity Analysis: 20% Reduction in Benefit .............................................. 6-13 Table 6.2.19 Sensitivity Analysis: 35% Cost Overrun.......................................................... 6-13 Table 6.2.20 Flow Capacity of Pasig-Marikina River .......................................................... 6-16 Table 6.2.21 Effect Indicators 1 (Flood Area, Population and Assets) ................................ 6-17 Table 6.2.22 Effect Indicators 2 (Flood Area, Population and Assets) ................................ 6-17 Table 6.2.23 Estimation of Benefit(Benefit and Impact of Phase II).................................... 6-18 Table 6.2.24 Estimation of Benefit (Benefit and Impact of Phase III) ................................. 6-18 Table 6.2.25 Estimation of Benefit (Benefit and Impact of Phase IV) ................................. 6-18 Table 6.2.26 Estimation of Benefit (Benefit and Impact of Entire Project).......................... 6-18 Table 6.3.1 Project Implementation Agency....................................................................... 6-19 Table 6.4.1 Phasing in the Detailed Design Stage .............................................................. 6-22 Table 6.4.2 Modified Phasing of the Project....................................................................... 6-23
Preparatory Study for Pasig-Marikina River Channel Improvement Project (Phase III)
Final Report - Main ReportTable of Contents
vii
LIST OF FIGURES
Figure 1.1.1 Location Plan of the Pasig-Marikina River Channel Improvement Project ...... 1-2 Figure 1.4.1 Study Schedule of Phase III, Pasig-Marikina River Channel Improvement
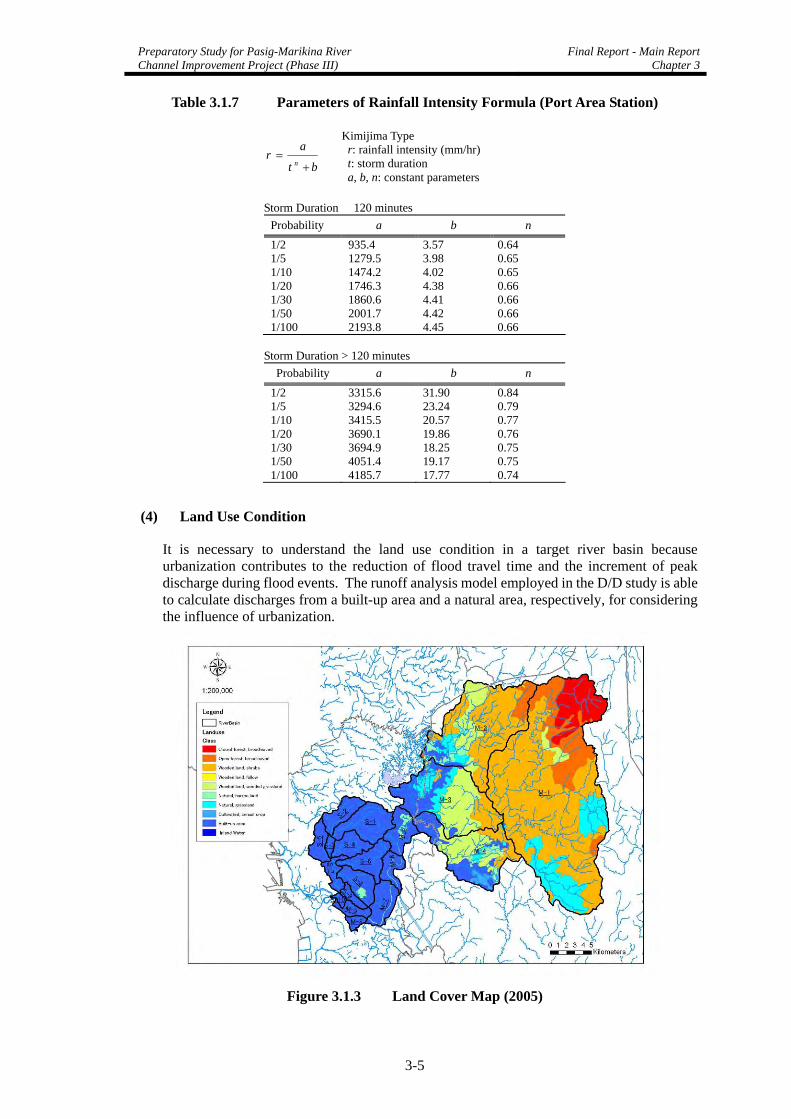
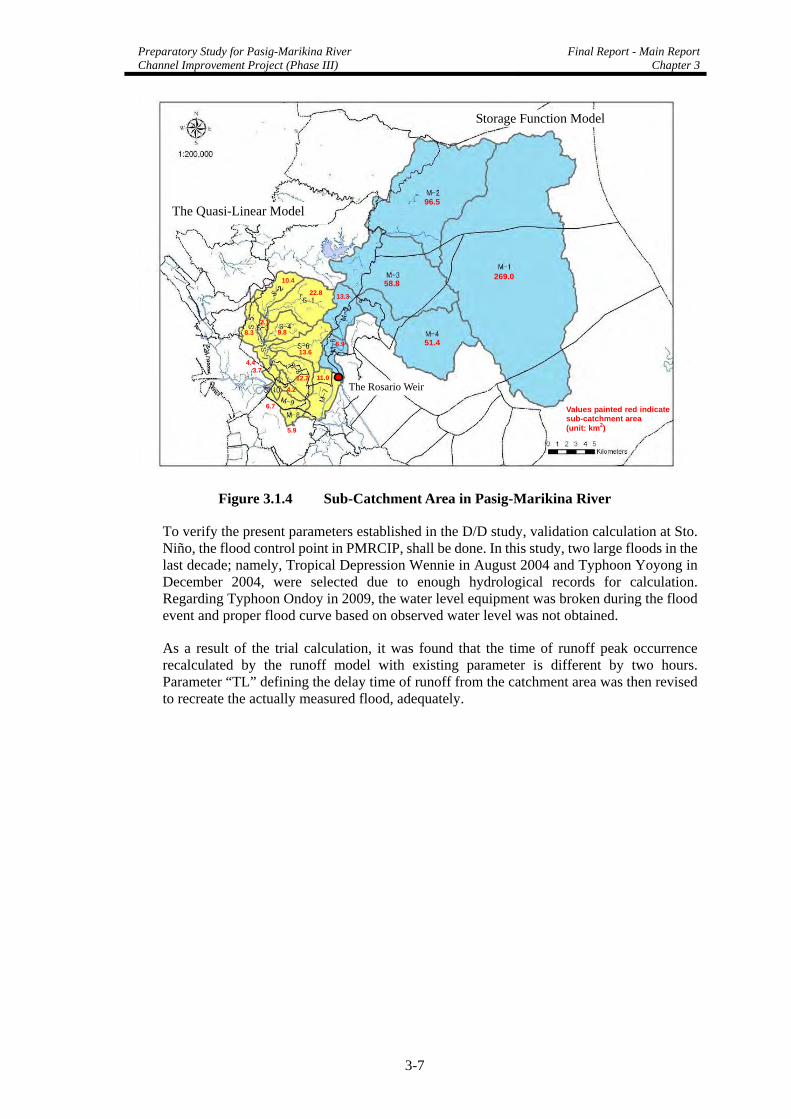
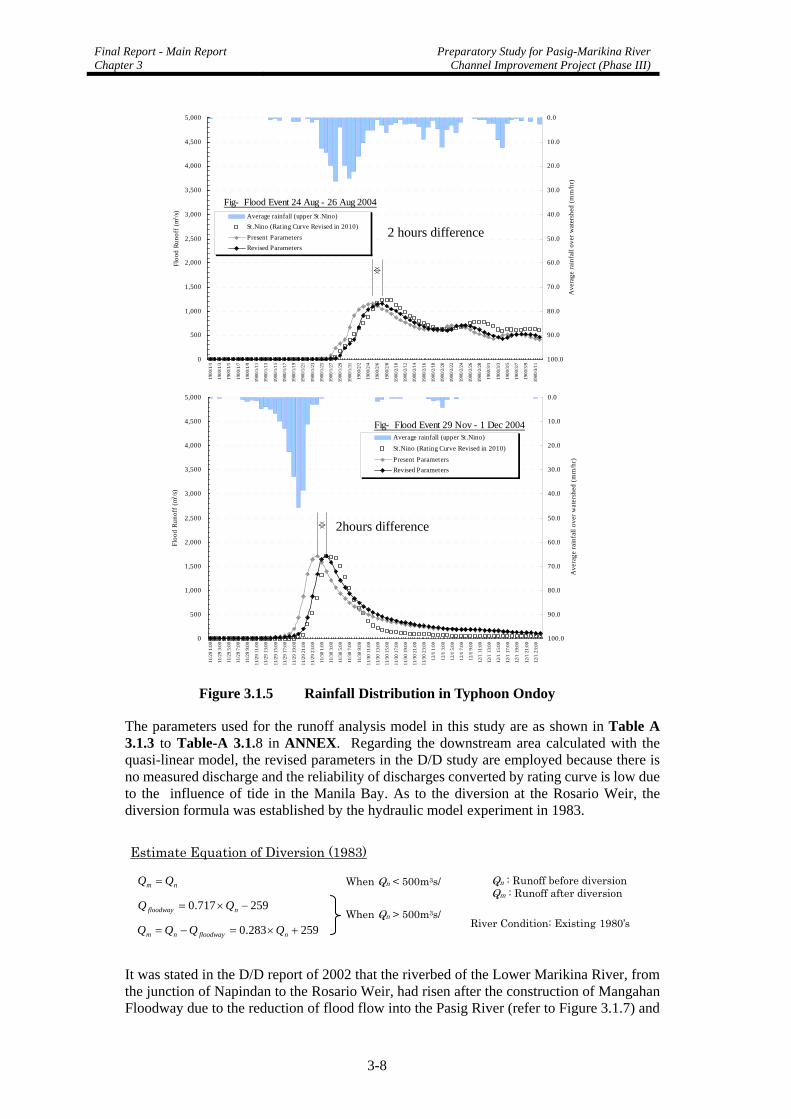
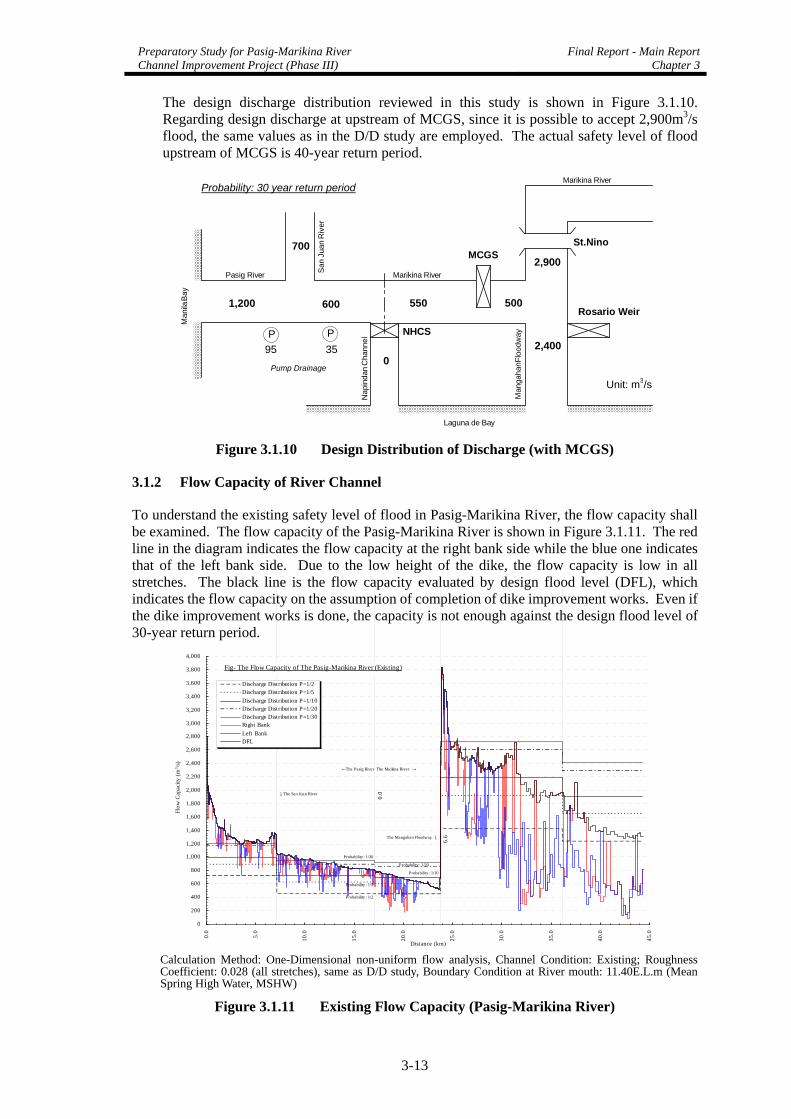
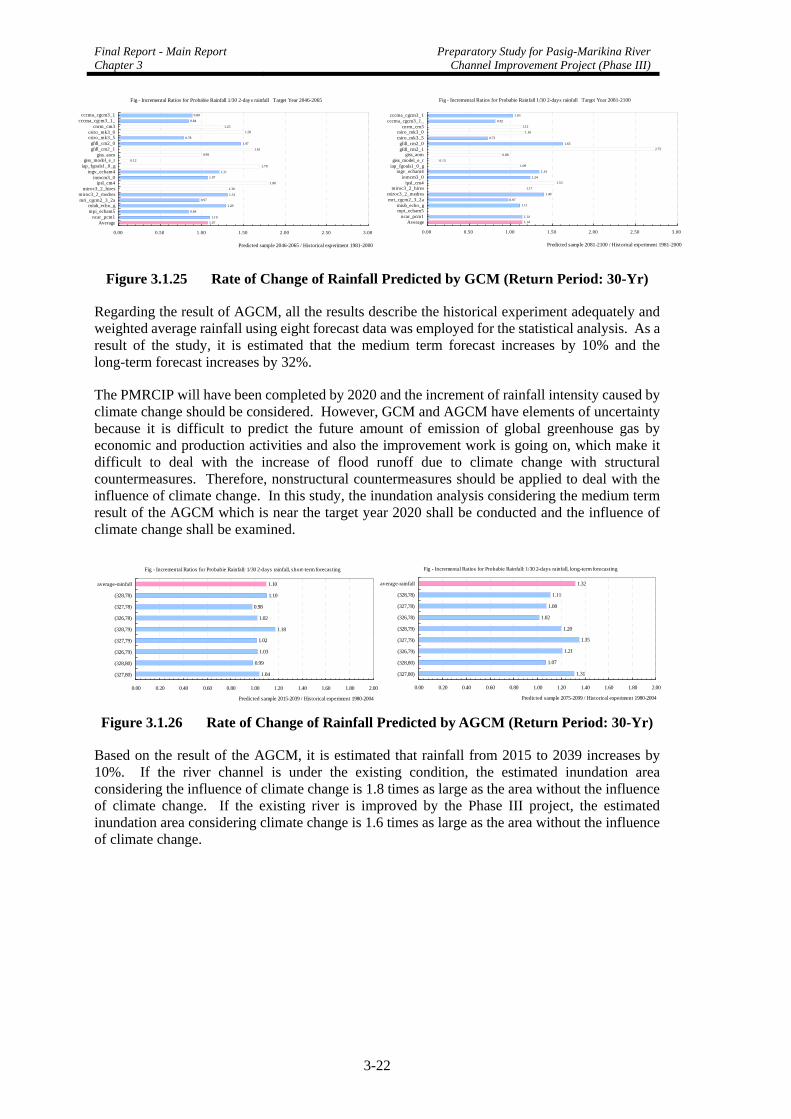
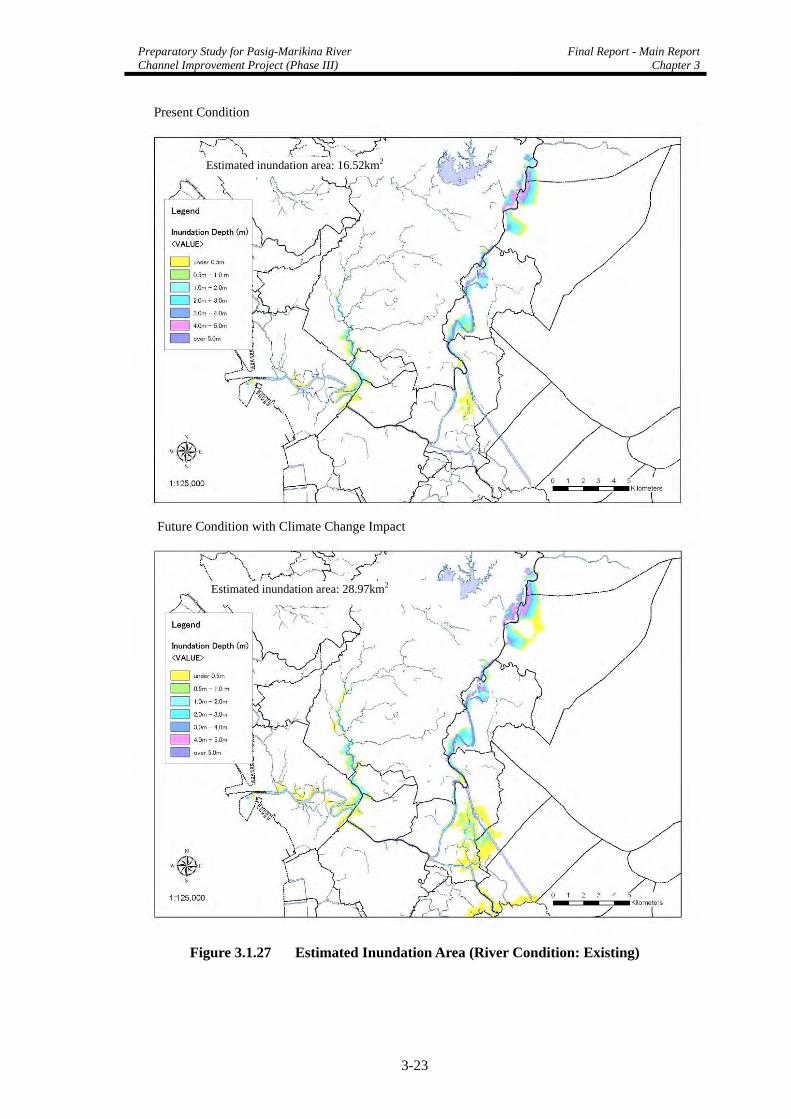
Project ................................................................................................................ 1-3 Figure 1.5.1 Basic Flow of the PMRCIP Study ..................................................................... 1-4 Figure 1.7.1 Accumulation of Investment With/Without Flood Control Project ................... 1-6 Figure 1.7.2 Significance of Flood Control Project ............................................................... 1-6 Figure 2.1.1 Chart of Causes of Unprecedented Flood Damage............................................ 2-4 Figure 2.2.1 Projected Population Growth in Four Decades from 2000................................ 2-8 Figure 2.2.2 Comprehensive Land Use Planning Process Flow Chart ................................ 2-12 Figure 2.3.1 Summary Flowchart of EIA Process................................................................ 2-17 Figure 2.6.1 Organizational Chart of DPWH....................................................................... 2-30 Figure 2.6.2 Organizational Chart of MMDA...................................................................... 2-31 Figure 2.6.3 Organizational Structure of PRRC................................................................... 2-32 Figure 3.1.1 Location of PAGASA Rainfall Stations............................................................. 3-4 Figure 3.1.2 Model Hyetograph (Center Concentrated Type, Probability 1/30).................... 3-4 Figure 3.1.3 Land Cover Map (2005) .................................................................................... 3-5 Figure 3.1.4 Sub-Catchment Area in Pasig-Marikina River .................................................. 3-7 Figure 3.1.5 Rainfall Distribution in Typhoon Ondoy ........................................................... 3-8 Figure 3.1.6 Diversion Ratio at the Rosario Weir (Existing) ................................................. 3-9 Figure 3.1.7 Pasig-Marikina River Longitudinal Profile ..................................................... 3-10 Figure 3.1.8 Estimated Discharge Distribution (Existing) ................................................... 3-11 Figure 3.1.9 Estimated Discharge Distribution (with MCGS)............................................. 3-11 Figure 3.1.10 Design Distribution of Discharge (with MCGS) ............................................. 3-13 Figure 3.1.11 Existing Flow Capacity (Pasig-Marikina River) ............................................. 3-13 Figure 3.1.12 Flow Capacity (without PMRCIP) .................................................................. 3-14 Figure 3.1.13 Flow Capacity (with Phase III)........................................................................ 3-15 Figure 3.1.14 Flow Capacity (With Phase IV)....................................................................... 3-15 Figure 3.1.15 Typical Cross Section Image (Lower Marikina River).................................... 3-15 Figure 3.1.16 Diagram of Flow Capacity (Mangahan Floodway) ......................................... 3-16 Figure 3.1.17 Outline of Inundation Analysis Model ............................................................ 3-17 Figure 3.1.18 Inundation Map (Typhoon Ondoy, September 2009) ...................................... 3-18 Figure 3.1.19 Estimated Discharge Distribution in Typhoon Ondoy..................................... 3-18 Figure 3.1.20 Estimated Inundation Map (Typhoon Ondoy, With PMRCIP Phase III) ......... 3-19 Figure 3.1.21 Inundation Map (TyphoonOndoy, Without Mangahan Floodway).................. 3-19 Figure 3.1.22 AGCM Grid ..................................................................................................... 3-21 Figure 3.1.23 Procedure of Evaluation of Climate Change ................................................... 3-21 Figure 3.1.24 Rejection Method of GCM Models ................................................................ 3-21 Figure 3.1.25 Rate of Change of Rainfall Predicted by GCM (Return Period: 30-Yr).......... 3-22 Figure 3.1.26 Rate of Change of Rainfall Predicted by AGCM (Return Period: 30-Yr) ....... 3-22 Figure 3.1.27 Estimated Inundation Area (River Condition: Existing).................................. 3-23 Figure 3.1.28 Estimated Inundation Area (River Condition: Improved by Phase III) ........... 3-24 Figure 3.1.29 Changes of Diversion triggered by River Shape ............................................. 3-25 Figure 3.1.30 Location of Main Encroachment in the Marikina River.................................. 3-26 Figure 3.2.1 Potential Areas in Phase II Project Stretch (Pasig River.................................. 3-28 Figure 3.2.2 Possible Flood Inundation Area along Pasig-Marikina River (D/D: Before
the Project)....................................................................................................... 3-30 Figure 3.3.1 Inundation Areas along Pasig-Marikina River (Left: 30-Year Flood, Right:
100-Year Flood)............................................................................................... 3-38 Figure 3.3.2 Inundation Map (Left: With Climate Change, Right: Without Climate
Change)............................................................................................................ 3-50 Figure 3.3.3 Flood Characteristics due to Climate Change.................................................. 3-51 Figure 3.3.4 Selection of Nonstructural Measures............................................................... 3-54 Figure 3.5.1 Typical Image of River Works on Pasig River ................................................ 3-61
Final Report - Main Report Table of Contents
Preparatory Study for Pasig-Marikina River Channel Improvement Project (Phase III)
viii
Figure 3.5.2 Existing Condition on Pasig River................................................................... 3-62 Figure 3.5.3 Images of Similar Construction Work on Pasig River ..................................... 3-62 Figure 3.5.4 Schematic Image of River Works on Lower Marikina River........................... 3-63 Figure 3.5.5 Existing Condition on Lower Marikina River ................................................. 3-63 Figure 3.5.6 Proposed River Works on Pasig River (Draft, as of Feb. 18, 2011)................. 3-64 Figure 3.5.7 Proposed River Works on Lower Marikina River (Draft, as of Feb. 18, 2011)3-65 Figure 3.5.8 River Easement for Non-flood Control Area ................................................... 3-71 Figure 3.5.9 Examples of Livelihood Trainings................................................................... 3-83 Figure 3.6.1 Location of Land Development Projects in Riverine Area .............................. 3-85 Figure 3.6.2 Circulo Verde Land Development Plan............................................................ 3-86 Figure 3.6.3 Land Development at Eastwood ...................................................................... 3-88 Figure 3.6.4 Land Development for SM Mall...................................................................... 3-89 Figure 3.6.5 Construction of STP in the Riverine Area........................................................ 3-90 Figure 3.6.6 Images of Land Development in Flood Prone Area......................................... 3-92 Figure 3.6.7 Deforestation in the Upper Pasig-Marikina River Basin ................................. 3-93 Figure 3.6.8 Procedure for Formulation of Land Development Plan................................... 3-93 Figure 3.6.9 Process for Application and Approval of Land Use Plan................................. 3-94 Figure 3.6.10 Basic Scenario for the Improvement of Current Mechanism........................... 3-99 Figure 3.7.1 Core Issues and Causes regarding Disaster Risk Management ..................... 3-100 Figure 3.7.2 Implementation Schedule of Phase II and Phase III ...................................... 3-108 Figure 3.7.3 Diagram of Alternative Set-ups of FMC........................................................ 3-108 Figure 4.2.1 Design Discharge Distribution (30-Year Return Period) ................................... 4-2 Figure 4.3.1 Revised Design Discharge ................................................................................. 4-5 Figure 4.3.2 Flow Capacity .................................................................................................... 4-6 Figure 4.4.1 Typical Section of Proposed Revetment ............................................................ 4-7 Figure 4.4.2 Cross-section of Steel Sheet Pile Foundation .................................................... 4-7 Figure 4.4.3 Location of Prioritized Potential Areas for Implementation in Phase III
Project ................................................................................................................ 4-9 Figure 4.4.4 Layout Plan of Lower Marikina River Channel Improvement .......................... 4-9 Figure 4.4.5 Typical Section of Proposed Structures ........................................................... 4-11 Figure 5.4.1 Construction Procedure of SSP+IW+IP Type Revetment.................................. 5-8 Figure 5.5.1 Construction Schedule for Pasig River ............................................................ 5-12 Figure 5.5.2 Construction Schedule for Lower Marikina River........................................... 5-13 Figure 6.2.1 Inundation Area: Without the Project............................................................... 6-14 Figure 6.2.2 Inundation Area: With Project Phase II............................................................ 6-15 Figure 6.2.3 Inundation Area: With Project Phases II and III .............................................. 6-15 Figure 6.2.4 Inundation Area: With the Entire Project ......................................................... 6-15 Figure 6.3.1 Implementation Schedule of the Phase III Project in Pasig-Marikina River ... 6-21
Preparatory Study for Pasig-Marikina River Channel Improvement Project (Phase III)
Final Report - Main ReportTable of Contents
ix
ABBREVIATIONS AND ACRONYMS
Government Institutions and Other Organizations ADB : Asian Development Bank AusAID : Australian Agency for International Development BDC : Barangay Development Council BDRRMC : Barangay Disaster Risk Reduction and Management Council CDCC : City Disaster Coordinating Council CDRRMC : City Disaster Risk Reduction and Management Council DENR : Department of Environment and Natural Resources DND : Department of National Defense DOF : Department of Finance DOST : Department of Science and Technology DPWH : Department of Public Works and Highways DSWD : Department of Social Welfare and Development FCSEC : Flood Control and Sabo Engineering Center, DPWH HLURB : Housing and Land Use Regulation Board IPCC : Intergovernmental Panel on Climate Change JBIC : Japan Bank for International Cooperation JICA : Japan International Cooperation Agency LDRRMC : Local Disaster Risk Reduction and Management Council MDCC : Municipal Disaster Coordinating Council MDRRMC : Municipality Disaster Risk Reduction and Management Council MWSS : Metropolitan Manila Waterworks and Sewerage System MMDA : Metro Manila Development Authority NDRRMC : National Disaster Risk Reduction and Management Council NEDA : National Economic and Development Authority PAGASA : Philippine Atmospheric, Geophysical and Astronomical Services
Administration PDRRMC : Provincial Disaster Risk Reduction and Management Council PMO-MFCP : Project Management Office for Major Flood Control Projects, DPWH PRRC : Pasig River Rehabilitation Commission OCD : Office of Civil Defense Others AO : Administrative Order B/C : Benefit/Cost Ratio CR : Cross Section CSCAND : Collective Strengthening of Community Awareness for Natural Disasters DO : Department Order D/D : Detailed Design DF/R : Draft Final Report DRRM : Disaster Risk Reduction Management DRM : Disaster Risk Management EFCOS : Effective Flood Forecasting and Warning System including Telemetering
and Flood Warning System in the Pasig-Marikina-Laguna Lake Complex ECC : Environmental Compliance Certificate EIA : Environmental Impact Assessment EIRR : Economic Internal Rate of Return EIS : Environmental Impact Statement EMP : Environmental Monitoring Plan FMC : Flood Mitigation Committee F/S : Feasibility Study
Final Report - Main Report Table of Contents
Preparatory Study for Pasig-Marikina River Channel Improvement Project (Phase III)
x
GMMA : Greater Metro Manila Area GCM : Global Circulation Model GDP : Gross Domestic Product GIS : Geographic Information Systems GNP : Gross National Product IC/R : Inception Report IEE : Initial Environmental Examination IEC : Information Education Campaign ICP : Information Campaign and Publicity I/P : Implementing Program IT/R : Interim Report L/A : Loan Agreement LIAC : Local Inter-Agency Committee LGU : Local Government Unit MCGS : Marikina Control Gate Structure MMHW : Mean Monthly Highest Water Level MM : Man-Month MOA : Memorandum of Agreement MP : Master Plan MTPDP : Medium Term Philippine Development Plan MTPIP : Medium Term Public Investment Program (DPWH) NCR : National Capital Region NFMFP : National Flood Mitigation Framework Plan NGO : Non-Governmental Organization NPV : Net Present Value O&M : Operation and Maintenance ODA : Official Development Assistance PAF : Project Affected Family PAP : Project Affected People PEISS : Philippine Environment Impact Statement System PD : Presidential Decree PMRCIP : Pasig-Marikina River Channel Improvement Project PRS : Philippine Reference System PTM : Philippine Transverse Mercator PO : People’s Organization RA : Republic Act RAP : Resettlement Action Plan ROW : Right-of-Way SAPROF : Special Assistance for Project Formation (JBIC/JICA) SC : Steering Committee STEP : Special Terms for Economic Partnership (JICA) STM : Stakeholder’s Meeting STW : Stakeholder’s Workshop TOR : Terms of Reference TWG : Technical Working Group UDHA : Urban Development and Housing Act
Preparatory Study for Pasig-Marikina River Channel Improvement Project (Phase III)
Final Report - Main ReportTable of Contents
xi
MEASUREMENT UNITS
(Length) (Time) mm : millimeter(s) s, sec : second(s) cm : centimeter(s) min : minute(s) m : meter(s) h, hr : hour(s) km : kilometer(s) d, dy : day(s) y, yr : year(s) (Area) mm2 : square millimeter(s) (Volume) cm2 : square centimeter(s) cm3 : cubic centimeter(s) m2 : square meter(s) m3 : cubic meter(s) km2 : square kilometer(s) l, ltr : liter(s) ha : hectare(s) mcm : million cubic meter(s) (Weight) (Speed/Velocity) g, gr, gm : gram(s) cm/s : centimeter per second kg : kilogram(s) m/s : meter per second ton : ton(s) km/h : kilometer per hour
Preparatory Study for Pasig-Marikina River Channel Improvement Project (Phase III)
Final Report - Main ReportChapter 1
1-1
CHAPTER 1 OUTLINE OF THE STUDY
1.1 Background of the Study
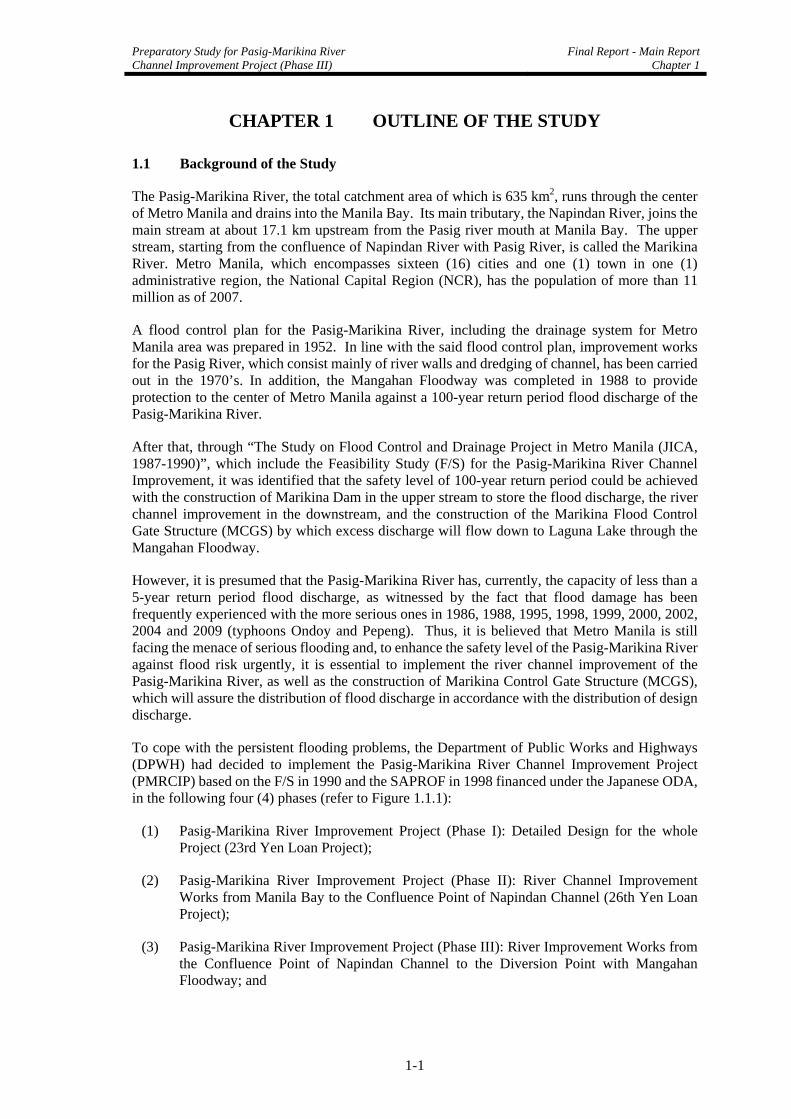
The Pasig-Marikina River, the total catchment area of which is 635 km2, runs through the center of Metro Manila and drains into the Manila Bay. Its main tributary, the Napindan River, joins the main stream at about 17.1 km upstream from the Pasig river mouth at Manila Bay. The upper stream, starting from the confluence of Napindan River with Pasig River, is called the Marikina River. Metro Manila, which encompasses sixteen (16) cities and one (1) town in one (1) administrative region, the National Capital Region (NCR), has the population of more than 11 million as of 2007.
A flood control plan for the Pasig-Marikina River, including the drainage system for Metro Manila area was prepared in 1952. In line with the said flood control plan, improvement works for the Pasig River, which consist mainly of river walls and dredging of channel, has been carried out in the 1970’s. In addition, the Mangahan Floodway was completed in 1988 to provide protection to the center of Metro Manila against a 100-year return period flood discharge of the Pasig-Marikina River.
After that, through “The Study on Flood Control and Drainage Project in Metro Manila (JICA, 1987-1990)”, which include the Feasibility Study (F/S) for the Pasig-Marikina River Channel Improvement, it was identified that the safety level of 100-year return period could be achieved with the construction of Marikina Dam in the upper stream to store the flood discharge, the river channel improvement in the downstream, and the construction of the Marikina Flood Control Gate Structure (MCGS) by which excess discharge will flow down to Laguna Lake through the Mangahan Floodway.
However, it is presumed that the Pasig-Marikina River has, currently, the capacity of less than a 5-year return period flood discharge, as witnessed by the fact that flood damage has been frequently experienced with the more serious ones in 1986, 1988, 1995, 1998, 1999, 2000, 2002, 2004 and 2009 (typhoons Ondoy and Pepeng). Thus, it is believed that Metro Manila is still facing the menace of serious flooding and, to enhance the safety level of the Pasig-Marikina River against flood risk urgently, it is essential to implement the river channel improvement of the Pasig-Marikina River, as well as the construction of Marikina Control Gate Structure (MCGS), which will assure the distribution of flood discharge in accordance with the distribution of design discharge.
To cope with the persistent flooding problems, the Department of Public Works and Highways (DPWH) had decided to implement the Pasig-Marikina River Channel Improvement Project (PMRCIP) based on the F/S in 1990 and the SAPROF in 1998 financed under the Japanese ODA, in the following four (4) phases (refer to Figure 1.1.1):
(1) Pasig-Marikina River Improvement Project (Phase I): Detailed Design for the whole Project (23rd Yen Loan Project);
(2) Pasig-Marikina River Improvement Project (Phase II): River Channel Improvement Works from Manila Bay to the Confluence Point of Napindan Channel (26th Yen Loan Project);
(3) Pasig-Marikina River Improvement Project (Phase III): River Improvement Works from the Confluence Point of Napindan Channel to the Diversion Point with Mangahan Floodway; and
Final Report - Main Report Chapter 1
Preparatory Study for Pasig-Marikina River Channel Improvement Project (Phase III)
1-2
(4) Pasig-Marikina River Improvement Project (Phase IV): River Improvement Works from the Diversion Point with Mangahan Floodway to Marikina Bridge.
Figure 1.1.1 Location Plan of the Pasig-Marikina River Channel Improvement Project
St.Nino
Preparatory Study for Pasig-Marikina River Channel Improvement Project (Phase III)
Final Report - Main ReportChapter 1
1-3
In the Phase III Project, the Philippine Government is keen to include the flood damage sections of the Phase II stretch, caused by Typhoon Ondoy in 2009, as potential areas.
1.2 Objectives of the Study
The Study has the following objectives:
(1) To review the existing plan of Pasig-Marikina River Channel Improvement Project (PMRCIP), focusing on the river improvement stretch covered by Phase III in the course of the study for the whole river improvement stretch (from river mouth to Marikina Bridge) in Pasig-Marikina River Basin, including the present river conditions reflecting recent river basin development, recent flood damage conditions, and impacts to flood damage by future climate change; and
(2) To provide supporting documents for the formulation of a Yen-Loan Project as “Phase III”, consisting of river channel improvement works, including monitoring, educational campaign and publicity for the local inhabitants and so on.
1.3 Study Area
The Study Area covers the Pasig-Marikina river basin, focusing on the river channel improvement stretch for “Phase III.”
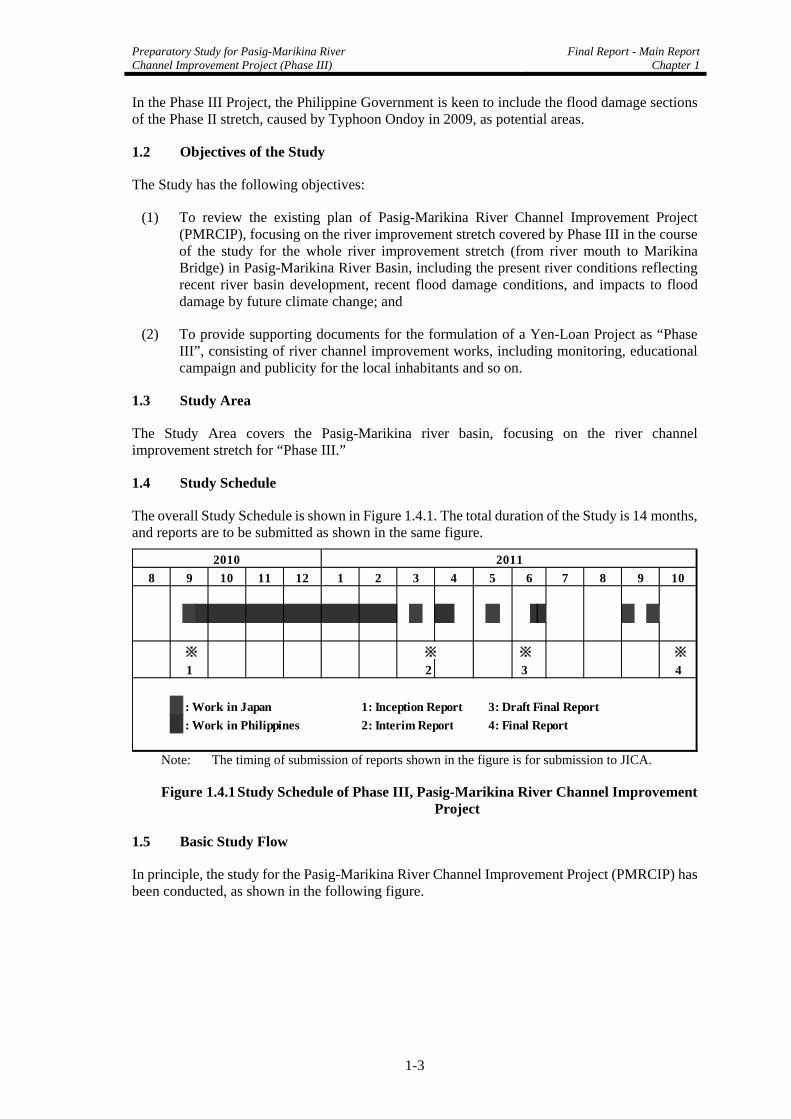
1.4 Study Schedule
The overall Study Schedule is shown in Figure 1.4.1. The total duration of the Study is 14 months, and reports are to be submitted as shown in the same figure.
※ ※ ※ ※
1 2 3 4
: Work in Japan 1: Inception Report 3: Draft Final Report
: Work in Philippines 2: Interim Report 4: Final Report
2011
9 10
2010
54 6 7 812 1 2 38 9 10 11
Note: The timing of submission of reports shown in the figure is for submission to JICA.
Figure 1.4.1 Study Schedule of Phase III, Pasig-Marikina River Channel Improvement Project
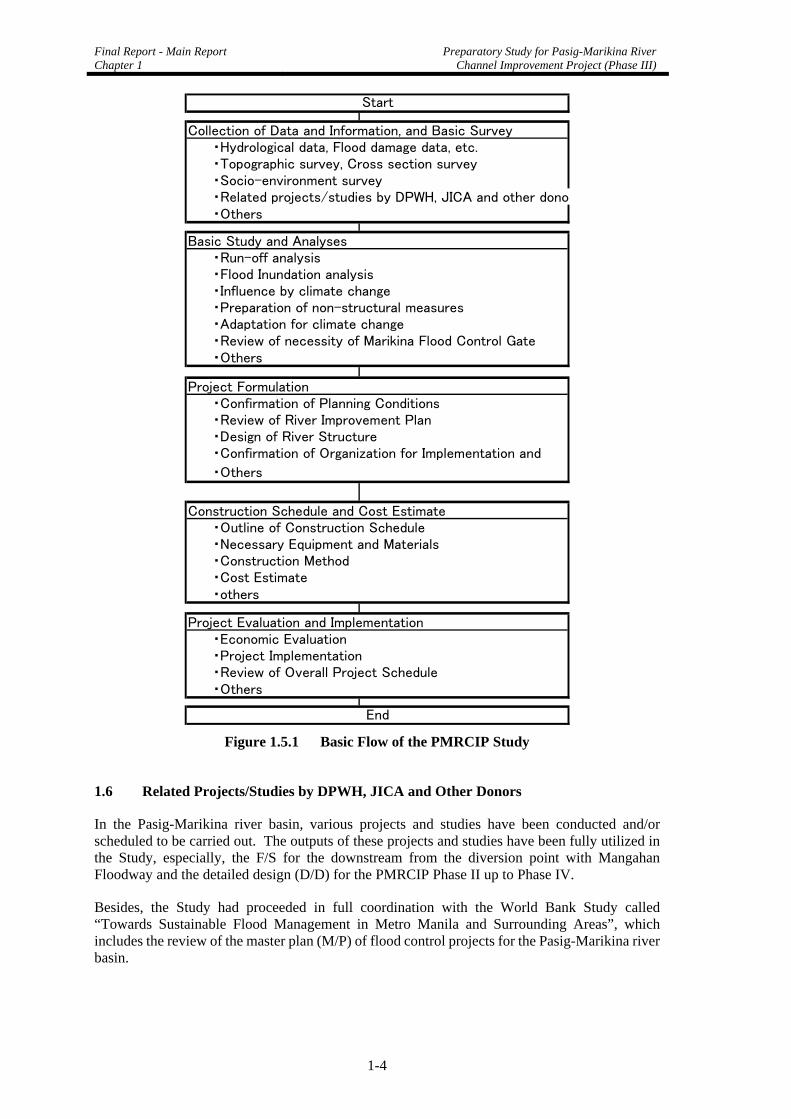
1.5 Basic Study Flow
In principle, the study for the Pasig-Marikina River Channel Improvement Project (PMRCIP) has been conducted, as shown in the following figure.
Final Report - Main Report Chapter 1
Preparatory Study for Pasig-Marikina River Channel Improvement Project (Phase III)
1-4
Collection of Data and Information, and Basic Survey・Hydrological data, Flood damage data, etc.・Topographic survey, Cross section survey・Socio-environment survey・Related projects/studies by DPWH, JICA and other dono・Others
Basic Study and Analyses・Run-off analysis・Flood Inundation analysis・Influence by climate change・Preparation of non-structural measures・Adaptation for climate change
・Others
Project Formulation・Confirmation of Planning Conditions・Review of River Improvement Plan・Design of River Structure
・Others
Construction Schedule and Cost Estimate・Outline of Construction Schedule・Necessary Equipment and Materials・Construction Method・Cost Estimate・others
Project Evaluation and Implementation・Economic Evaluation・Project Implementation・Review of Overall Project Schedule・Others
Start
End
・Confirmation of Organization for Implementation and
・Review of necessity of Marikina Flood Control Gate
Figure 1.5.1 Basic Flow of the PMRCIP Study
1.6 Related Projects/Studies by DPWH, JICA and Other Donors
In the Pasig-Marikina river basin, various projects and studies have been conducted and/or scheduled to be carried out. The outputs of these projects and studies have been fully utilized in the Study, especially, the F/S for the downstream from the diversion point with Mangahan Floodway and the detailed design (D/D) for the PMRCIP Phase II up to Phase IV.
Besides, the Study had proceeded in full coordination with the World Bank Study called “Towards Sustainable Flood Management in Metro Manila and Surrounding Areas”, which includes the review of the master plan (M/P) of flood control projects for the Pasig-Marikina river basin.
Preparatory Study for Pasig-Marikina River Channel Improvement Project (Phase III)
Final Report - Main ReportChapter 1
1-5
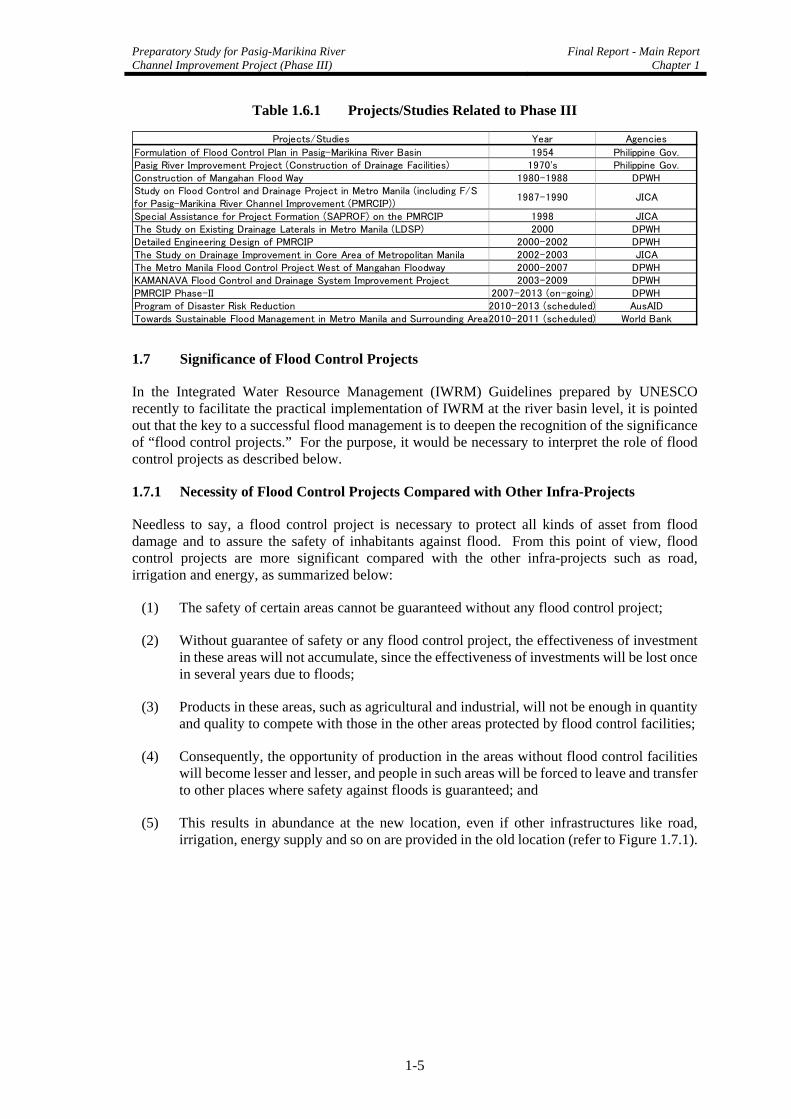
Table 1.6.1 Projects/Studies Related to Phase III
Projects/Studies Year Agencies
Formulation of Flood Control Plan in Pasig-Marikina River Basin 1954 Philippine Gov.Pasig River Improvement Project (Construction of Drainage Facilities) 1970's Philippine Gov.Construction of Mangahan Flood Way 1980-1988 DPWHStudy on Flood Control and Drainage Project in Metro Manila (including F/Sfor Pasig-Marikina River Channel Improvement (PMRCIP))
1987-1990 JICA
Special Assistance for Project Formation (SAPROF) on the PMRCIP 1998 JICAThe Study on Existing Drainage Laterals in Metro Manila (LDSP) 2000 DPWHDetailed Engineering Design of PMRCIP 2000-2002 DPWHThe Study on Drainage Improvement in Core Area of Metropolitan Manila 2002-2003 JICAThe Metro Manila Flood Control Project West of Mangahan Floodway 2000-2007 DPWHKAMANAVA Flood Control and Drainage System Improvement Project 2003-2009 DPWHPMRCIP Phase-II 2007-2013 (on-going) DPWHProgram of Disaster Risk Reduction 2010-2013 (scheduled) AusAIDTowards Sustainable Flood Management in Metro Manila and Surrounding Areas2010-2011 (scheduled) World Bank
1.7 Significance of Flood Control Projects
In the Integrated Water Resource Management (IWRM) Guidelines prepared by UNESCO recently to facilitate the practical implementation of IWRM at the river basin level, it is pointed out that the key to a successful flood management is to deepen the recognition of the significance of “flood control projects.” For the purpose, it would be necessary to interpret the role of flood control projects as described below.
1.7.1 Necessity of Flood Control Projects Compared with Other Infra-Projects
Needless to say, a flood control project is necessary to protect all kinds of asset from flood damage and to assure the safety of inhabitants against flood. From this point of view, flood control projects are more significant compared with the other infra-projects such as road, irrigation and energy, as summarized below:
(1) The safety of certain areas cannot be guaranteed without any flood control project;
(2) Without guarantee of safety or any flood control project, the effectiveness of investment in these areas will not accumulate, since the effectiveness of investments will be lost once in several years due to floods;
(3) Products in these areas, such as agricultural and industrial, will not be enough in quantity and quality to compete with those in the other areas protected by flood control facilities;
(4) Consequently, the opportunity of production in the areas without flood control facilities will become lesser and lesser, and people in such areas will be forced to leave and transfer to other places where safety against floods is guaranteed; and
(5) This results in abundance at the new location, even if other infrastructures like road, irrigation, energy supply and so on are provided in the old location (refer to Figure 1.7.1).
Final Report - Main Report Chapter 1
Preparatory Study for Pasig-Marikina River Channel Improvement Project (Phase III)
1-6
Figure 1.7.1 Accumulation of Investment With/Without Flood Control Project
In this context, a flood control project is one of the most significant and fundamental projects compared with the other infra-projects (refer to Figure 1.7.2). This situation seems to be the same as “the national defense policy against an enemy is prior to every other issue.”
Flood ControlProject
Road Project
Urban DevelopmentProject
Energy DevelopmentProject
IrrigationProject
Water ResourcesDevelopment
Higher Proirity shouldbe given to assure thesafety of the area
Other Project
Other Infra-Project
Figure 1.7.2 Significance of Flood Control Project
1.7.2 Necessity of Flood Control Project in the Pasig-Marikina River Basin
In the Pasig-Marikina river basin, floods have caused severe damage almost once in every few years due to typhoons habitually attacking Metro Manila. In Metro Manila where the population of more than 11 million live, huge amounts of investment have been earmarked for infrastructure as well as industrial development, such as roads, electricity supply, water supply, urban development and so on, in order to hold the function of metropolitan center of the Philippines. To sustain the accumulation of investment, it is essential to assure the safety against flood, and the flood control project in the Pasig-Marikina river basin has been promoted under the recognition of necessity of flood control projects.
1.7.3 Effect by Enhancement of Safety Level against Flood Damage
As discussed in Subsection 1.7.1, effects by the enhancement of safety level against flood damage are emphasized with the accumulation of investment, which leads to vitalization of commercial and industrial activities. This situation further leads to increase of population as well as increase of income and increase of income from taxes in both local and central governments, and everyone would enjoy the benefits provided to the area protected by a flood control project. Under this favorable cycle, investments for a flood control project can be recovered in a manner of increase of income tax collection.
Flood Flood
Safe Area Against Floods Flood Risk Area
・Accumulation of investment ・No accumulation of Invesment
・Products are competitive ・Products are not competitive
・Prosperity of the area ・Abandoment of the area
Preparatory Study for Pasig-Marikina River Channel Improvement Project (Phase III)
Final Report - Main ReportChapter 1
1-7
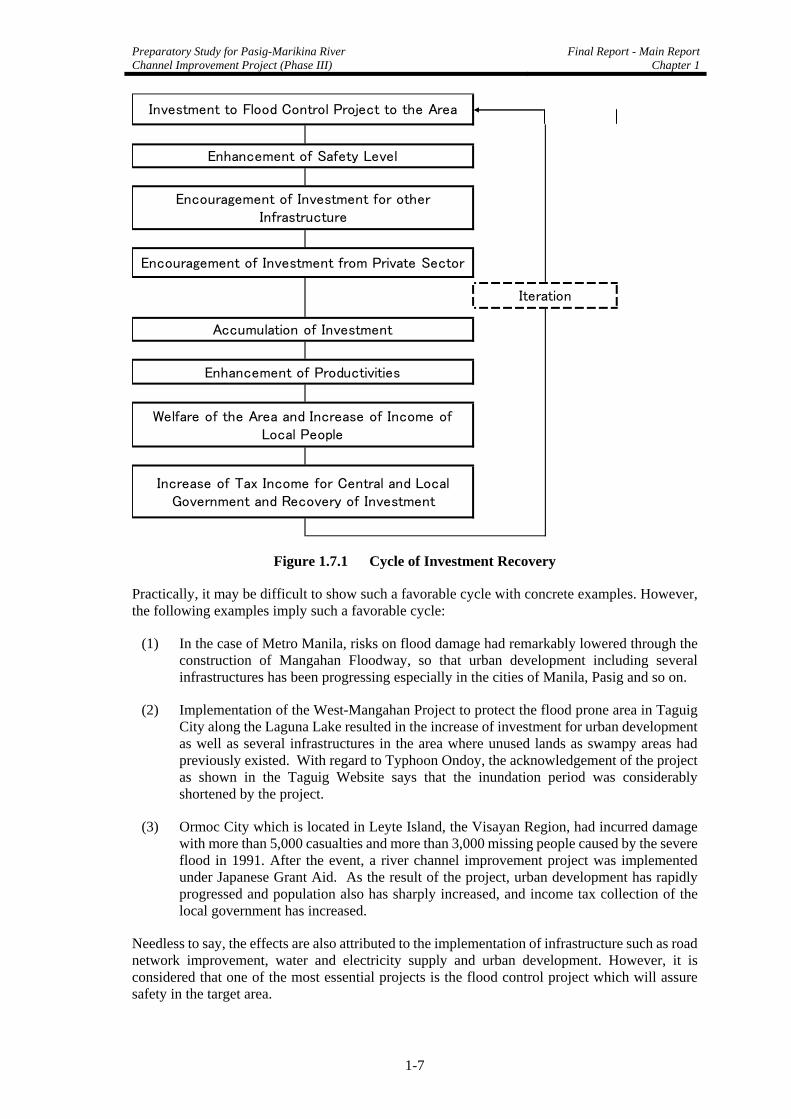
Investment to Flood Control Project to the Area
Enhancement of Safety Level
Encouragement of Investment for otherInfrastructure
Increase of Tax Income for Central and LocalGovernment and Recovery of Investment
Iteration
Encouragement of Investment from Private Sector
Accumulation of Investment
Enhancement of Productivities
Welfare of the Area and Increase of Income ofLocal People
Figure 1.7.1 Cycle of Investment Recovery
Practically, it may be difficult to show such a favorable cycle with concrete examples. However, the following examples imply such a favorable cycle:
(1) In the case of Metro Manila, risks on flood damage had remarkably lowered through the construction of Mangahan Floodway, so that urban development including several infrastructures has been progressing especially in the cities of Manila, Pasig and so on.
(2) Implementation of the West-Mangahan Project to protect the flood prone area in Taguig City along the Laguna Lake resulted in the increase of investment for urban development as well as several infrastructures in the area where unused lands as swampy areas had previously existed. With regard to Typhoon Ondoy, the acknowledgement of the project as shown in the Taguig Website says that the inundation period was considerably shortened by the project.
(3) Ormoc City which is located in Leyte Island, the Visayan Region, had incurred damage with more than 5,000 casualties and more than 3,000 missing people caused by the severe flood in 1991. After the event, a river channel improvement project was implemented under Japanese Grant Aid. As the result of the project, urban development has rapidly progressed and population also has sharply increased, and income tax collection of the local government has increased.
Needless to say, the effects are also attributed to the implementation of infrastructure such as road network improvement, water and electricity supply and urban development. However, it is considered that one of the most essential projects is the flood control project which will assure safety in the target area.
Final Report - Main Report Chapter 1
Preparatory Study for Pasig-Marikina River Channel Improvement Project (Phase III)
1-8
1.8 Linkage of Flood Control Project with Water Resources Development
1.8.1 Role of Pasig-Marikina River Basin in Water Resources Development
The Pasig-Marikina River, which passes through Metro Manila, has, in principle, a significant role in water resources development. At present, however, only the Wawa Dam, which exists in the upstream of Pasig-Marikina River, had once played the role of source of domestic water supply and also, has been playing as source of groundwater in the downstream.
In this connection, the water resource of Pasig-Marikina River is not well-developed and fully utilized compared with its potential. There is an urgent need for the water resources of Pasig-Marikina River to be developed and utilized by linkage to flood control projects and/or facilities.
1.8.2 Conceivable Facilities for a Flood Control Project with Linkage to Water Resources Development
(1) General
In general, one of the major facilities for flood control is river channel improvement considering economic efficiency and the project cost itself, since it can deal with the huge volume of flood discharge at less expense. However, the major purpose of the river channel improvement is to let the flood discharge flow down to the river mouth immediately; therefore, precious water resources can hardly be utilized for other purposes.
Among the flood control structural measures, the multipurpose ones are the dam and reservoir and the retarding basin, while watershed management is conceived as the non-structural measure.
In the case of Pasig-Marikina river basin, the facilities or measures discussed below are conceived.
(2) Construction of Marikina Dam
At present, the Marikina Dam is conceived as a multipurpose-use facility that could also function for the development of the tourism industry. Its construction had once been proposed in the 1950’s with multipurpose use including hydropower generation; however, it was canceled for fear of collapse of the huge dam in the upstream of the metropolitan area considering the geology of the dam site which is composed mainly of limestone.
Since then, the Marikina Dam was proposed with only the flood control purpose in the “Study on Flood Control and Drainage Project in Metro Manila (JICA, 1990)”. A review of the previous study results is being conducted under the ongoing World Bank Study.
(3) Utilization of Laguna Lake in Combination with Mangahan Floodway
The Mangahan Floodway was completed in 1988, aiming to alleviate damage from floods of the Pasig and Lower Marikina rivers. Floods flowing from the Upper Marikina River Basin are first stored in the Laguna Lake via the floodway. At present, the principal rule of utilization of the Mangahan Floodway is to divert the flood from the Upper Marikina River to Laguna Lake during floods in the Pasig-Marikina River and to receive the reverse flow immediately from Laguna Lake to the Pasig-Marikina River after the flood is reduced to lower the water level of the Lake.
In this connection, increasing the storage capacity of the Lake to receive floodwaters from the Pasig-Marikina River is being considered for the multipurpose use of water through the
Preparatory Study for Pasig-Marikina River Channel Improvement Project (Phase III)
Final Report - Main ReportChapter 1
1-9
construction of a lake dike. The possibility will be examined also in the currently ongoing World Bank Study.
(4) Linkage with Nonstructural Measures
Several nonstructural measures have been examined in this study in the context of flood control of the Pasig-Marikina river basin as discussed in Chapter 3. Among them, watershed management would be helpful to moderate the flow regime to preserve the natural river basin condition through control of disorderly land development, which leads to the increase of flood discharge but decrease of low water discharge of the Pasig-Marikina River. As a result, the potential for water resources development could be enhanced.
(5) Others
As the other possibility, it is considered to utilize the flood prone areas widely spreading in Marikina City, San Mateo Municipality and Rodriguez Municipality along the Upper Marikina River which currently functions as natural retarding basin during floods.
If a flood prone area is developed into an urban area in the future, the natural retarding function would be lost resulting in the increase of flood discharge to the downstream. On the other hand, if the flood prone area is developed into a natural retarding basin through the provision of dike to enhance the retarding capacity, it also can be used as a water resources development facility.
Preparatory Study for Pasig-Marikina River Channel Improvement Project (Phase III)
Final Report - Main ReportChapter 2
2-1
CHAPTER 2 PRESENT CONDITION OF THE STUDY AREA
2.1 Natural Condition
2.1.1 Climate
The project area, except the eastern area of the Laguna Lake, belongs to Type I of the four (4) Philippine climatologic regions. The Type I climatologic region is characterized by a dominant rainy season from May to October and a dominant dry season for the rest of the months (refer to Fig. A 2.1.1 in ANNEX). The annual rainfall distribution presented in Fig. A 2.1.2 shows the annual rainfall of 3,000 mm, more or less, over the Marikina River’s mountainous basin head area where the high Sierra Madre Mountain range is located. On the other hand, the annual rainfall of approximately 2,000 mm spreads over the rainfall zone of the Manila Bay area to the Laguna Lake Basin.
The total rainfall from May to October accounts for about 80% of the annual rainfall, which is brought mainly by the wet southwestern monsoon, plus the occasional typhoons. The monthly rainfall distribution over the eastern area of the Laguna Lake has a longer rainy season up to December. This is because of the influence of the northeast monsoon affecting the area due to the low terrain of the Sierra Madre ranges bordering the first and the second climatologic zones.
2.1.2 River
The Pasig-Marikina River flows through the Metro Manila to the Manila Bay. Its total catchment area is estimated at around 635 km2, about 20% of which is situated in Metro Manila.
(1) Pasig River
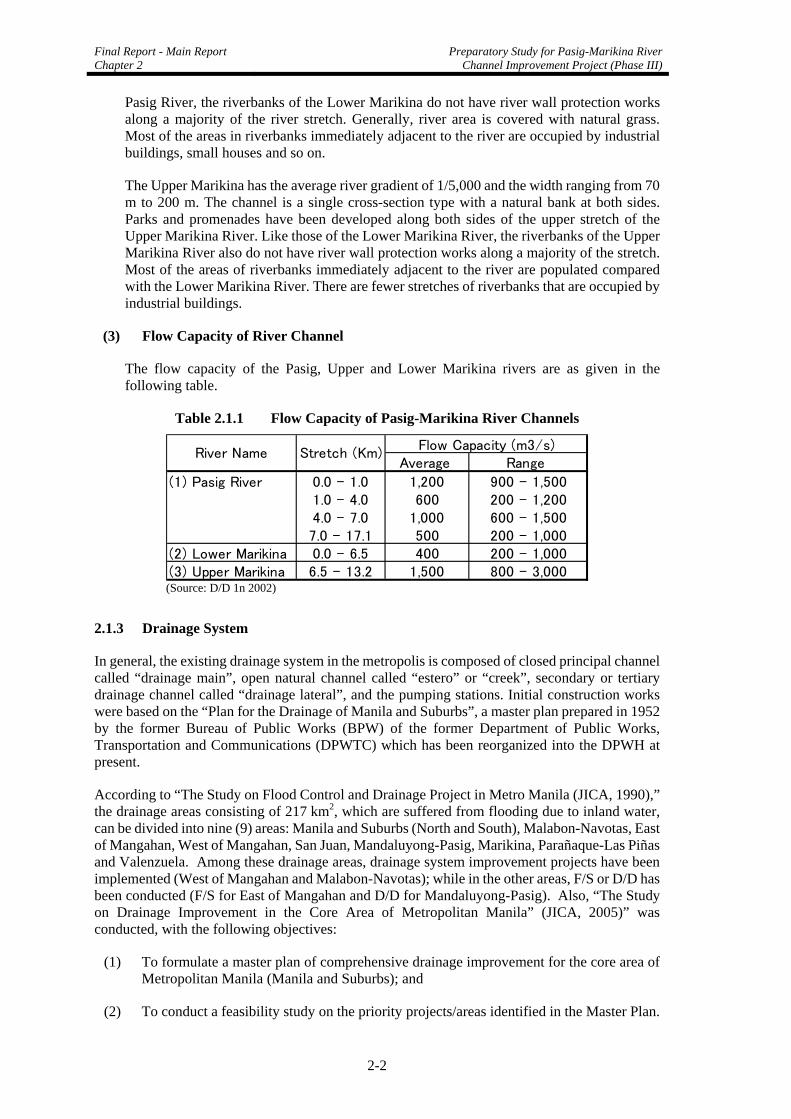
The Pasig River of 17.1 km from the river mouth to the junction of Napindan Hydraulic Control Structure (NHCS) has the average riverbed gradient of 1/10,000, the width ranging from 60 m to 250 m and depth from 6 m to 12 m with the main tributary of San Juan River at the confluence point of 7.1 km from the river mouth. The channel is a single cross section type and most sections have revetment and concrete wall structures with sheet piles on both sides. Along the river stretch of 700 m from the river mouth to the Del Pan Bridge, both banks are utilized as wharves for the Port of Manila under the control of the Philippine Ports Authority (PPA).
The Pasig River plays the important role as water transportation route from the river mouth where mooring facilities are installed along riversides especially from the Del Pan Bridge to Jones Bridge and where densely built-up factories along the river toward the Napindan Hydraulic Control Structure (NHCS) exist. Dredging works have been carried out by DPWH from the river mouth to Jones Bridge for securing the inland navigation.
(2) Marikina River
The Marikina River consists of two (2) stretches; namely, Lower Marikina from the Napindan Hydraulic Control Structure (NHCS) to Mangahan Floodway (7.2 km); and Upper Marikina from Mangahan Floodway to Sto. Niño (6.1 km) as targeted in the Phase III Project.
The Lower Marikina has the average riverbed gradient of less than 1/5,000, the width ranging from 90 m to 100 m and the depth of from 4.2 m to 9.5 m. The channel is a single cross section type with a natural bank at both sides. There are existing promenades along the channel in the middle stretch of the Lower Marikina River. Unlike the riverbanks of the
Final Report - Main Report Chapter 2
Preparatory Study for Pasig-Marikina RiverChannel Improvement Project (Phase III)
2-2
Pasig River, the riverbanks of the Lower Marikina do not have river wall protection works along a majority of the river stretch. Generally, river area is covered with natural grass. Most of the areas in riverbanks immediately adjacent to the river are occupied by industrial buildings, small houses and so on.
The Upper Marikina has the average river gradient of 1/5,000 and the width ranging from 70 m to 200 m. The channel is a single cross-section type with a natural bank at both sides. Parks and promenades have been developed along both sides of the upper stretch of the Upper Marikina River. Like those of the Lower Marikina River, the riverbanks of the Upper Marikina River also do not have river wall protection works along a majority of the stretch. Most of the areas of riverbanks immediately adjacent to the river are populated compared with the Lower Marikina River. There are fewer stretches of riverbanks that are occupied by industrial buildings.
(3) Flow Capacity of River Channel
The flow capacity of the Pasig, Upper and Lower Marikina rivers are as given in the following table.
Table 2.1.1 Flow Capacity of Pasig-Marikina River Channels
In general, the existing drainage system in the metropolis is composed of closed principal channel called “drainage main”, open natural channel called “estero” or “creek”, secondary or tertiary drainage channel called “drainage lateral”, and the pumping stations. Initial construction works were based on the “Plan for the Drainage of Manila and Suburbs”, a master plan prepared in 1952 by the former Bureau of Public Works (BPW) of the former Department of Public Works, Transportation and Communications (DPWTC) which has been reorganized into the DPWH at present.
According to “The Study on Flood Control and Drainage Project in Metro Manila (JICA, 1990),” the drainage areas consisting of 217 km2, which are suffered from flooding due to inland water, can be divided into nine (9) areas: Manila and Suburbs (North and South), Malabon-Navotas, East of Mangahan, West of Mangahan, San Juan, Mandaluyong-Pasig, Marikina, Parañaque-Las Piñas and Valenzuela. Among these drainage areas, drainage system improvement projects have been implemented (West of Mangahan and Malabon-Navotas); while in the other areas, F/S or D/D has been conducted (F/S for East of Mangahan and D/D for Mandaluyong-Pasig). Also, “The Study on Drainage Improvement in the Core Area of Metropolitan Manila” (JICA, 2005)” was conducted, with the following objectives:
(1) To formulate a master plan of comprehensive drainage improvement for the core area of Metropolitan Manila (Manila and Suburbs); and
(2) To conduct a feasibility study on the priority projects/areas identified in the Master Plan.
Preparatory Study for Pasig-Marikina River Channel Improvement Project (Phase III)
Final Report - Main ReportChapter 2
2-3
According to the D/D of PMRCIP in 2002, fifteen (15) large pumping stations serve the Metro Manila area. The storm water collected at these pumping stations is either discharged into the Pasig River or directly into the Manila Bay. All the stations were designed for a 10-year return period flood. Out of the 15 stations, 11 stations discharge directly into the Pasig River. Aside from these 11 stations, there are 6 smaller pumping stations that also directly discharge into the Pasig River. (Refer to Fig. A 2.1.3 and Table A 4.3.5 in ANNEX).
2.1.4 Major Floods and Flood Damage
(1) Major Floods (1993-2008) and Flood Damage
Metro-Manila suffers from flood damage in almost every year due in part to the insufficient flow capacity of the Pasig, Lower and Upper Marikina rivers and the poor drainage systems in Metro Manila.
The flood damage records from 1993 to 2000 are as shown in Table A 2.1.1 in ANNEX. The most extensive flood during those years was brought about by Typhoon Seniang in early November 2000. The depth of inundation ranged from 0.2 m to 6.0 m. The municipalities/cities with the highest flood level were (a) Marikina City where floodwaters ranged from 1.0 to 5.5 m; (b) Quezon City where 16 of the 17 surveyed barangays suffered from floods of more than 1.0 m with the highest at 6.0 m; (c) San Juan City where the floodwaters ranged from 1.0 m to 3.0 m; and (d) Rodriguez where 5 of the 8 barangays were under 1.5 m deep of water with the deepest at 6.0 m. This flood caused casualties and damages in the Pasig-Marikina and San Juan river basins as indicated below.
Table 2.1.2 Casualties by Typhoon Seniang (2000)
Family Person Dead Injured Missing Family Person
22,174 93,961 10 10 - 10,055 53,310 129
No. of Affected Casualties No. of Evacuation Total Damage(Mil. Peso)
Based on the information from the Office of Civil Defense (OCD), flood damages in Metro Manila (National Capital Region) after Typhoon Seniang are as indicate in Table 2.1.3.
Table 2.1.3 Flood Damage in Metro Manila by Typhoons
No. Affected Casualties No. Evacuated Year Typhoon
Family Persons Dead Injured Missing Family Persons
Preparatory Study for Pasig-Marikina RiverChannel Improvement Project (Phase III)
2-4
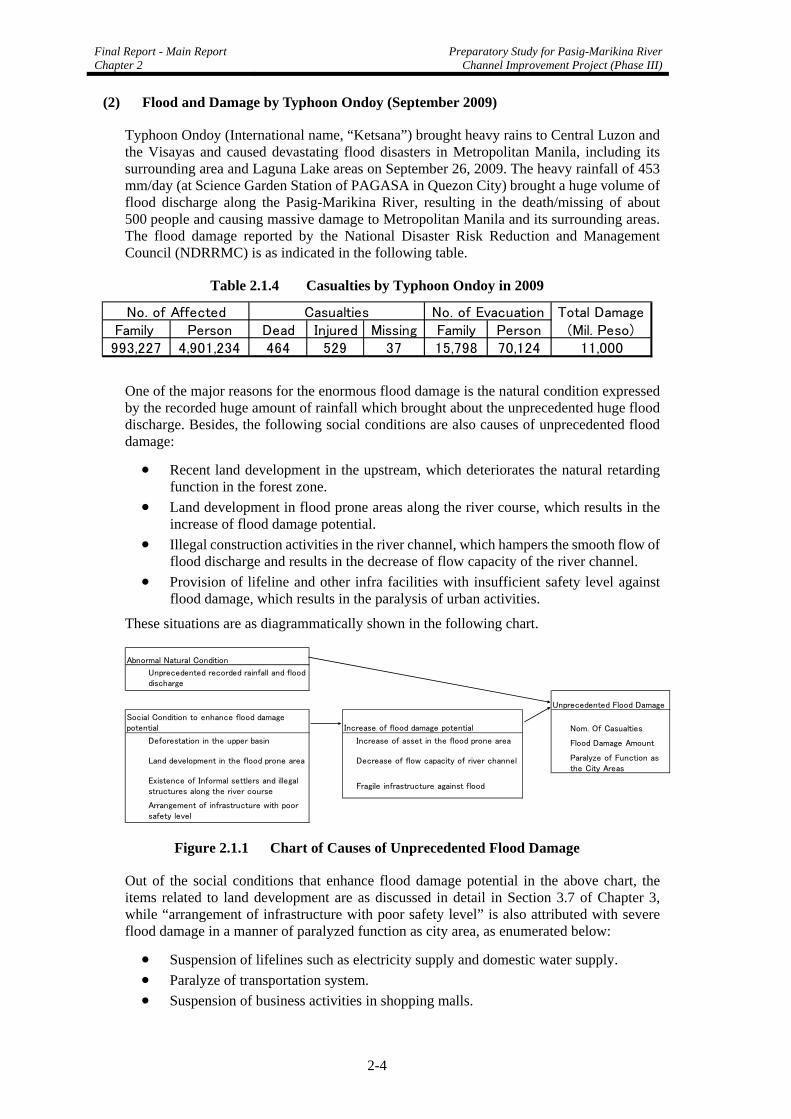
(2) Flood and Damage by Typhoon Ondoy (September 2009)
Typhoon Ondoy (International name, “Ketsana”) brought heavy rains to Central Luzon and the Visayas and caused devastating flood disasters in Metropolitan Manila, including its surrounding area and Laguna Lake areas on September 26, 2009. The heavy rainfall of 453 mm/day (at Science Garden Station of PAGASA in Quezon City) brought a huge volume of flood discharge along the Pasig-Marikina River, resulting in the death/missing of about 500 people and causing massive damage to Metropolitan Manila and its surrounding areas. The flood damage reported by the National Disaster Risk Reduction and Management Council (NDRRMC) is as indicated in the following table.
Table 2.1.4 Casualties by Typhoon Ondoy in 2009
Family Person Dead Injured Missing Family Person993,227 4,901,234 464 529 37 15,798 70,124 11,000
No. of Affected Casualties No. of Evacuation Total Damage(Mil. Peso)
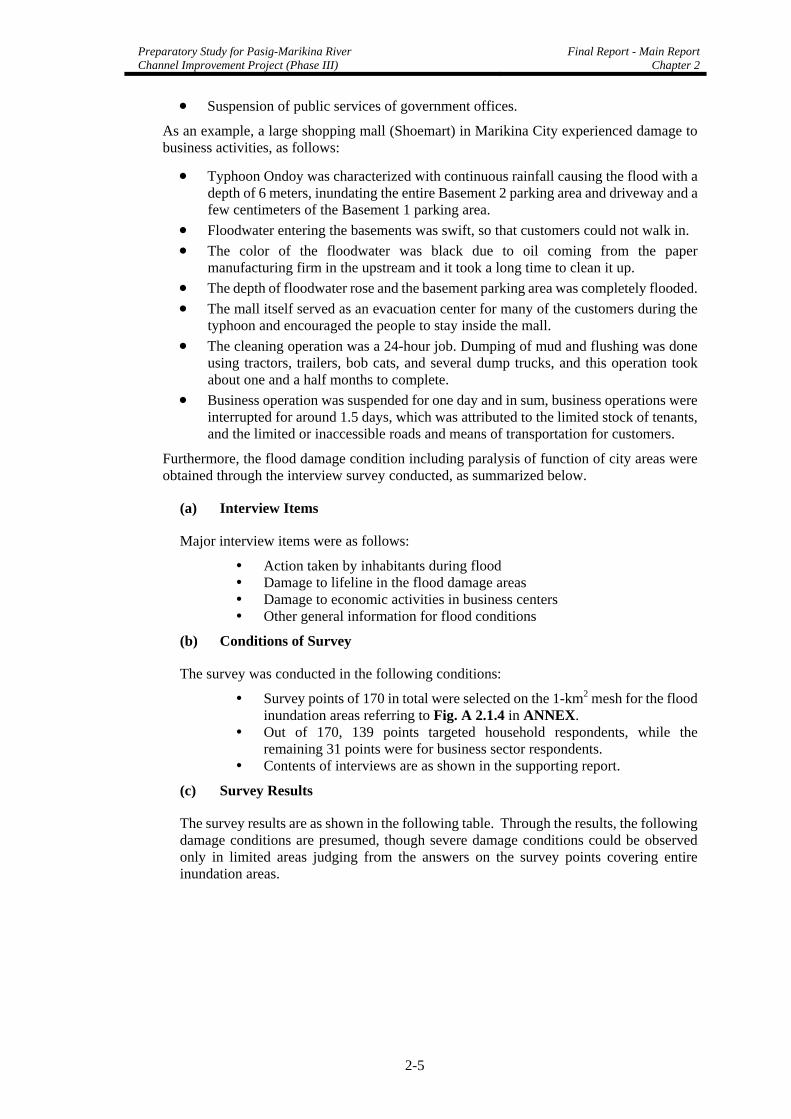
One of the major reasons for the enormous flood damage is the natural condition expressed by the recorded huge amount of rainfall which brought about the unprecedented huge flood discharge. Besides, the following social conditions are also causes of unprecedented flood damage:
Recent land development in the upstream, which deteriorates the natural retarding function in the forest zone.
Land development in flood prone areas along the river course, which results in the increase of flood damage potential.
Illegal construction activities in the river channel, which hampers the smooth flow of flood discharge and results in the decrease of flow capacity of the river channel.
Provision of lifeline and other infra facilities with insufficient safety level against flood damage, which results in the paralysis of urban activities.
These situations are as diagrammatically shown in the following chart.
Nom. Of Casualties
Deforestation in the upper basin Flood Damage Amount
Land development in the flood prone area Paralyze of Function asthe City Areas
Arrangement of infrastructure with poorsafety level
Abnormal Natural Condition
Decrease of flow capacity of river channel
Increase of asset in the flood prone area
Existence of Informal settlers and illegalstructures along the river course
Unprecedented recorded rainfall and flooddischarge
Unprecedented Flood Damage
Fragile infrastructure against flood
Increase of flood damage potentialSocial Condition to enhance flood damagepotential
Figure 2.1.1 Chart of Causes of Unprecedented Flood Damage
Out of the social conditions that enhance flood damage potential in the above chart, the items related to land development are as discussed in detail in Section 3.7 of Chapter 3, while “arrangement of infrastructure with poor safety level” is also attributed with severe flood damage in a manner of paralyzed function as city area, as enumerated below:
Suspension of lifelines such as electricity supply and domestic water supply.
Paralyze of transportation system.
Suspension of business activities in shopping malls.
Preparatory Study for Pasig-Marikina River Channel Improvement Project (Phase III)
Final Report - Main ReportChapter 2
2-5
Suspension of public services of government offices.
As an example, a large shopping mall (Shoemart) in Marikina City experienced damage to business activities, as follows:
Typhoon Ondoy was characterized with continuous rainfall causing the flood with a depth of 6 meters, inundating the entire Basement 2 parking area and driveway and a few centimeters of the Basement 1 parking area.
Floodwater entering the basements was swift, so that customers could not walk in.
The color of the floodwater was black due to oil coming from the paper manufacturing firm in the upstream and it took a long time to clean it up.
The depth of floodwater rose and the basement parking area was completely flooded.
The mall itself served as an evacuation center for many of the customers during the typhoon and encouraged the people to stay inside the mall.
The cleaning operation was a 24-hour job. Dumping of mud and flushing was done using tractors, trailers, bob cats, and several dump trucks, and this operation took about one and a half months to complete.
Business operation was suspended for one day and in sum, business operations were interrupted for around 1.5 days, which was attributed to the limited stock of tenants, and the limited or inaccessible roads and means of transportation for customers.
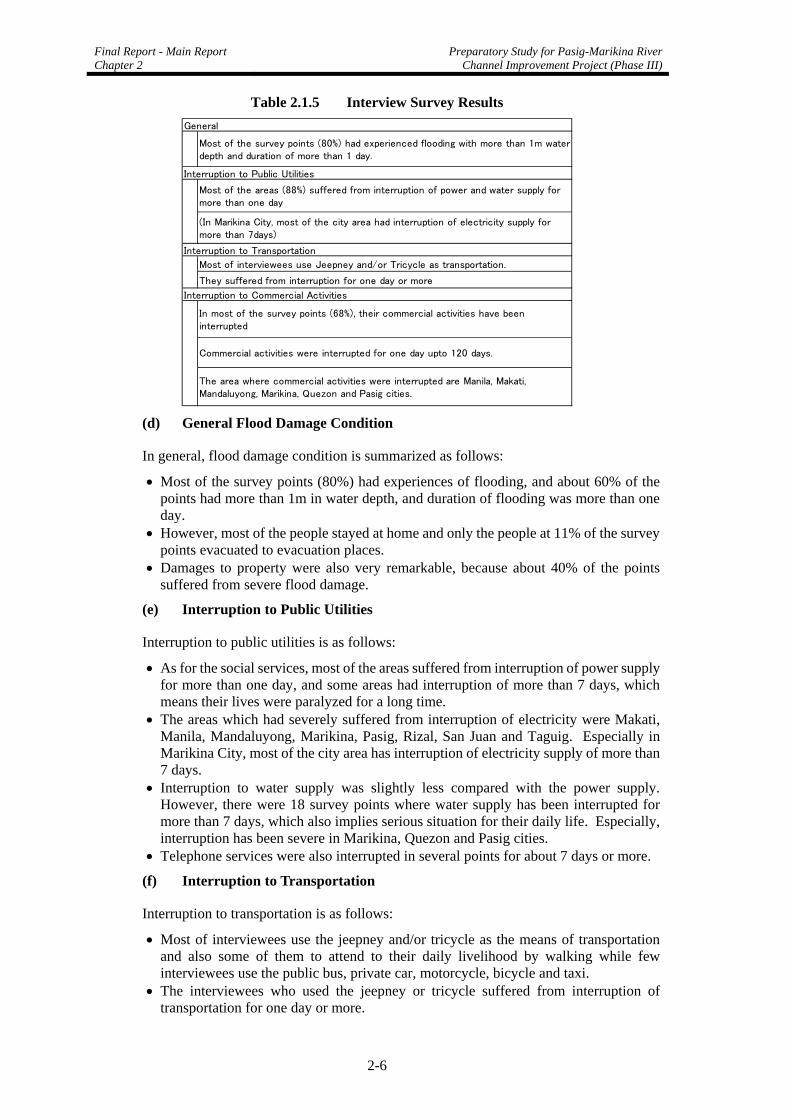
Furthermore, the flood damage condition including paralysis of function of city areas were obtained through the interview survey conducted, as summarized below.
(a) Interview Items
Major interview items were as follows:
Action taken by inhabitants during flood Damage to lifeline in the flood damage areas Damage to economic activities in business centers Other general information for flood conditions
(b) Conditions of Survey
The survey was conducted in the following conditions:
Survey points of 170 in total were selected on the 1-km2 mesh for the flood inundation areas referring to Fig. A 2.1.4 in ANNEX.
Out of 170, 139 points targeted household respondents, while the remaining 31 points were for business sector respondents.
Contents of interviews are as shown in the supporting report.
(c) Survey Results
The survey results are as shown in the following table. Through the results, the following damage conditions are presumed, though severe damage conditions could be observed only in limited areas judging from the answers on the survey points covering entire inundation areas.
Final Report - Main Report Chapter 2
Preparatory Study for Pasig-Marikina RiverChannel Improvement Project (Phase III)
2-6
Table 2.1.5 Interview Survey Results
Most of the survey points (80%) had experienced flooding with more than 1m waterdepth and duration of more than 1 day.
Most of the areas (88%) suffered from interruption of power and water supply formore than one day
(In Marikina City, most of the city area had interruption of electricity supply formore than 7days)
Most of interviewees use Jeepney and/or Tricycle as transportation.
They suffered from interruption for one day or more
In most of the survey points (68%), their commercial activities have beeninterrupted
Commercial activities were interrupted for one day upto 120 days.
The area where commercial activities were interrupted are Manila, Makati,Mandaluyong, Marikina, Quezon and Pasig cities.
General
Interruption to Public Utilities
Interruption to Transportation
Interruption to Commercial Activities
(d) General Flood Damage Condition
In general, flood damage condition is summarized as follows:
Most of the survey points (80%) had experiences of flooding, and about 60% of the points had more than 1m in water depth, and duration of flooding was more than one day.
However, most of the people stayed at home and only the people at 11% of the survey points evacuated to evacuation places.
Damages to property were also very remarkable, because about 40% of the points suffered from severe flood damage.
(e) Interruption to Public Utilities
Interruption to public utilities is as follows:
As for the social services, most of the areas suffered from interruption of power supply for more than one day, and some areas had interruption of more than 7 days, which means their lives were paralyzed for a long time.
The areas which had severely suffered from interruption of electricity were Makati, Manila, Mandaluyong, Marikina, Pasig, Rizal, San Juan and Taguig. Especially in Marikina City, most of the city area has interruption of electricity supply of more than 7 days.
Interruption to water supply was slightly less compared with the power supply. However, there were 18 survey points where water supply has been interrupted for more than 7 days, which also implies serious situation for their daily life. Especially, interruption has been severe in Marikina, Quezon and Pasig cities.
Telephone services were also interrupted in several points for about 7 days or more.
(f) Interruption to Transportation
Interruption to transportation is as follows:
Most of interviewees use the jeepney and/or tricycle as the means of transportation and also some of them to attend to their daily livelihood by walking while few interviewees use the public bus, private car, motorcycle, bicycle and taxi.
The interviewees who used the jeepney or tricycle suffered from interruption of transportation for one day or more.
Preparatory Study for Pasig-Marikina River Channel Improvement Project (Phase III)
Final Report - Main ReportChapter 2
2-7
(g) Interruption to School, Hospital and Other Public Offices
Interruption to school, hospital and other public offices is as follows:
Most schools had closed from 1 day to 60 days at maximum. Many schools had closed for around 30 days, and in the case of Makati, Pasig and
Quezon cities, such situations are remarkable. In the case of hospitals, most of them had kept their services. As for other government offices, several Barangay Halls and one municipal hall had
stopped their services for several days.
(h) Commercial Activities
Influences caused by Typhoon Ondoy to commercial activities are as follows:
Out of 31 interview points regarding commercial activities, activities at 21 points (68%) have been interrupted.
The days of interrupted commercial activities are between one day and 120 days at maximum.
Most of them (38%) had resumed commercial activities within one or two days, while the other 30% points took 3 days or more to resume.
The major reasons of interruption of business activities are: working place was under water, materials could not be used, utilities could not be used and so on.
Areas where commercial activities had been interrupted could be widely observed in inundation places, i.e., Manila, Makati, Mandaluyong, Marikina, Quezon and Pasig cities.
Most of them did not receive insurance to recover the cost of flood damage.
2.2 Socio-Economic Condition
2.2.1 Geographical Jurisdiction of Concerned City/Municipality
The Pasig-Marikina River traverses Metropolitan Manila and has the total catchment area of 635 km2 stretching from Rodriguez in Rizal Province and eventually draining into the Manila Bay. The river connects with Laguna de Bay (Laguna Lake) via the Napindan Channel and the Mangahan Floodway. The portion of the water-body covered by this Study lie over seven (7) cities in the National Capital Region (NCR); namely, 1) Makati, 2) Mandaluyong, 3) Manila, 4) Marikina, 5) Pasig, 6) Quezon and 7) San Juan. Other municipalities studied include Pateros and Taguig in NCR and Cainta and Taytay in Rizal, considering their geographical proximity to the cities and potential flood impacts that may take place along the Mangahan Floodway. They are the contiguous urban areas undergoing rapid economic and population growth.
Table 2.2.1 Geographic Jurisdiction of Concerned Cities/Municipalities
Land Area under the jurisdiction Region/ Province
City/Municipality (km2)
1 Makati City 27.36 2 Mandaluyong City 11.26 3 Manila City 40.46 4 Marikina City 21.50 5 Pasig City 31.00 6 Pateros City 1.85 7 Quezon City 161.13 8 San Juan City 5.94
NCR
9 Taguig City 45.38 10 Cainta Municipality 42.99
Region IV
Rizal Province 11 Taytay Municipality 41.40 Total Land Area 430.27
Final Report - Main Report Chapter 2
Preparatory Study for Pasig-Marikina RiverChannel Improvement Project (Phase III)
2-8
Source: The area of total land is compiled on the basis of the Comprehensive Land Use Plan of each city/ municipality except for Cainta and Taytay, which were derived from the Rizal Provincial Physical Framework Plan.
2.2.2 Demography and Population
The rapid population growth of the area is expected to continue in the coming decades, however, with slower and varying paces. The figure below presents population growth on a log scale for the Philippines and the regions in Mega Manila over the five decades since 2000 based on the medium assumption in 2000. The table summarizes the computed average annual growth rate in the same period.
The population in NCR was expected to grow approximately at 1.5% per annum until 2010 as against the national rate of 2.0%. In the same period, those in the vicinity were expected to grow at higher but varying rates ranging from 2.0% for Batangas and Pampanga to 3.3% for Cavite. Rizal Province is also projected to grow at 2.5% until 2010. The total number of population of NCR remains the largest among the regions and most likely continues to grow at a slower pace in the coming decades until 2040 with an annual growth rate at 0.9% until 2025 and 0.3% until 2040. The provinces in the vicinity will likely grow more rapidly but with declining growth rates over the decades. Overall, the population growth is slowing down in NCR but continues to grow very fast in the immediate periphery.
Figure 2.2.1 Projected Population Growth in Four Decades from 2000
Table 2.2.2 Computed Average Annual Population Growth
Country / Region 2001-2010 2010-2025 2026-2040 PHILIPPINES 2.0% 1.6% 1.1% NATIONAL CAPITAL REGION 1.5% 0.9% 0.3% BULACAN 2.8% 2.2% 1.5% CAVITE 3.3% 2.4% 1.7% RIZAL 2.5% 1.7% 1.0% LAGUNA 2.0% 1.5% 0.8% BATANGAS 2.0% 1.7% 1.1% PAMPANGA 1.9% 1.4% 0.8% Source: Regional and Provincial Projected Population by Sex, and by Single-Calendar Years: Philippines: 2000-2010 (Medium Assumption)
The population within the concerned cities/municipalities in 2010 was estimated at 7,958 thousand in total. It was computed by extrapolating the 2007 census data and the population
Preparatory Study for Pasig-Marikina River Channel Improvement Project (Phase III)
Final Report - Main ReportChapter 2
2-9
projection under the medium scenario published in 2000. Use of the projected population growth rate of NCR was initially considered to estimate the population in Taytay and Cainta due to geographical contiguity and resultant commonality in demographic dynamics. However, it was rejected because there remain unused land areas in the municipalities.
Table 2.2.3 Regional Projected Population in 2000 (Medium Assumption)
Region 2007 2008 2009 2010 NCR 11,099,800 11,252,700 11,403,300 11,552,100 Region IVA – Calabarzon 11,152,800 11,402,800 11,653,000 11,904,100 Philippines 88,706,300 90,457,200 92,226,600 94,013,200 Source: Regional and Provincial Projected Population by Sex, and by Single-Calendar Years: Philippines: 2000-2010 (Medium Assumption)
Table 2.2.4 Population Estimate in 2010
Census 2007 Estimate under the Medium Scenario City/Municipality 2007* 2008 2009 2010
NCR 11,566,325 11,725,651 11,882,581 12,037,635Manila 1,660,714 1,683,590 1,706,123 1,728,386 Makati 567,349 575,164 582,862 590,468 Mandaluyong 305,576 309,785 313,931 318,028 Pasig 627,445 636,088 644,601 653,012 Quezon 2,679,450 2,716,359 2,752,714 2,788,634 Marikina 424,610 430,459 436,220 441,912 Taguig 613,343 621,792 630,114 638,336 San Juan 125,338 127,065 128,765 130,445 Pateros 61,940 62,793 63,634 64,464 Taytay 262,485 268,369 274,257 280,167 Cainta 304,478 311,303 318,134 324,989 Total within the concerned Ci /M i i li
7,632,728 7,742,768 7,851,354 7,958,840
Note: The values in “Total…” indicate the annual sums for the 11 cities and municipalities. Source: 1: 2007 Census of Population, Population by Province, City/Municipality and Barangay, National Capital Region: Report No. 1-N Source 2: 2007 Census of Population, Population by Province, City/Municipality and Barangay, Calabarzon Region IVA: Report No. 1-D
On the basis of the above, the population in each city/municipality was projected until 2040 as summarized in the table below.
Preparatory Study for Pasig-Marikina RiverChannel Improvement Project (Phase III)
2-10
2.2.3 Economy and Related Development Plans
(1) Overview of the Regional Economy1
In 2009, the Philippine economy remained resilient as it managed to grow by 1.1 percent, despite the adverse impact of the global economic crisis and the onslaught of super typhoons Ondoy and Pepeng, which constituted 2.7 percent of the national GDP2. These disasters have had a substantial impact on the economies of the affected regions. For example, the regional damages and losses accounted for as much as 10 percent of Region I’s GDP, 9 percent of Region II and IV-A’s GDP, and 7 percent of Region III’s GDP.
NCR on the economic growth rate suffered a reversal from positive 4.7 percent in 2008 to negative 0.4 percent in 2009 brought about by the slump in the industry sector and deceleration of the service sector. The economy of CALABARZON suffered a reversal of 1.6 percent in 2009 from a 1.9 percent growth in 2008 as the Industry and Agriculture, Fishery, and Forestry posted negative growth rates while services decelerated.
Table 2.2.6 GDP Growth Rates at Constant (1985) Prices
2000 2001 2002 2003 2004 2005 2006 2007 2008 2009Philippines 4.4 3.0 4.3 4.6 6.2 4.9 5.4 7.1 3.7 1.1NCR 5.8 3.1 3.1 5.2 8.4 7.4 6.7 7.8 4.7 -0.4IVA – CALABARZON (3.5)* (2.8)* N.A* 2.8 4.0 2.6 4.6 5.3 1.9 -1.6* The data for Region IVA, Calabarzon, from 2000 to 2003 adopted those for Southern Tagalog. Source: National Statistical Coordination Board
The percentage share of NCR’s GDP continued to account for the largest share with 32.5 % in 2009 with an approximate increase by 2% from 2000. Urban regions account for increasing amount of economic activities and values; these regions are clearly establishing themselves as drivers of economic growth.
Table 2.2.7 Percentage Share of Regional GDP to National GDP
The Per Capita Gross Regional Domestic Product of NCR stands at 2.96 times higher than the national average. The value in Calabarzon on average stands at 69 thousand pesos which is equivalent to 83% of the national average and 28% of NCR.
Table 2.2.8 Per Capita Gross Regional Domestic Product at Current Prices
According to a study in 2005, more than 10% of the population lives below the poverty line in six (6) districts in Manila and one (1) in Rizal Province; namely, Quiapo, San Miguel, Tondo, San Nicolas, Intramuros, Port Area and Taytay. The study adopted the international
1 The section of the report referred to the website of National Statistical Coordination Board. Refer to the following site for more detail: HIGHLIGHTS of 2009 Gross Regional Domestic Product (GRDP) retrieved as of February 7 2011 at http://www.nscb.gov.ph/grdp/2009/default.asp. 2 Typhoons Ondoy and Pepeng: Post-Disaster Needs Assessment, Main Report
Preparatory Study for Pasig-Marikina River Channel Improvement Project (Phase III)
Final Report - Main ReportChapter 2
2-11
poverty line which is USD1.08 in 1993 value, converted to local currency using the current Purchasing Power Parity rate.
Table 2.2.9 Poverty Indicators of Concerned Cities/Municipalities
City/Municipality District Poverty Incidence Poverty Gap Poverty Severity
Binondo 0.0274 0.0051 0.0015
Ermita 0.0587 0.0117 0.0036
Intramuros 0.2588 0.0629 0.0222
Malate 0.0856 0.0176 0.0056
Paco 0.0729 0.0146 0.0045
Pandacan 0.0801 0.0158 0.0049
Port Area 0.5011 0.1621 0.0701
Quiapo 0.1009 0.0212 0.0068
Samplaloc 0.0425 0.0079 0.0023
San Andres Bukid N.A. N.A. N.A.
San Miguel 0.1091 0.0235 0.0077
San Nicolas 0.2278 0.0576 0.0210
Santa Anna 0.0774 0.0155 0.0048
Santa Cruz 0.0756 0.0153 0.0048
Santa Mesa N.A. N.A. N.A.
Manila
Tondo 0.1601 0.0362 0.0122
Makati 0.0374 0.0069 0.0022
Mandaluyong 0.0725 0.0143 0.0044
Pasig 0.0533 0.0098 0.0028
Quezon 0.0714 0.0140 0.0042
Marikina 0.0552 0.0102 0.0030
Taguig 0.0893 0.0179 0.0056
San Juan 0.0292 0.0052 0.0015
Pateros 0.0823 0.0167 0.0053
Taytay 0.1221 0.0255 0.0081
Cainta 0.0772 0.0151 0.0046
N.A.: Not Available Note: Poverty incidence for a given area is defined as the proportion of individuals living in that area who are in
households with an average per capita expenditure below the poverty line. Poverty gap is the average distancebelow the poverty line, being zero for those individuals above the line. It thus represents the resources neededto bring all poor individuals up to a basic level. Poverty severity measures the average squared distance belowthe line, thereby giving more weight to the very poor.
Source: Estimate of Local Poverty in the Philippines, November 2005, National Statistical Coordination Board. Retrieved as of February 7, 2011, at: http://www.nscb.gov.ph/poverty/sae/NSCB_LocalPovertyPhilippines.pdf.
(2) Relevant Development Plans
The draft Medium Term Philippine Development Plan (MTPDP) 2011-2016 is unavailable because it is currently under the final stage of preparation. It was crafted in November and December 2010 and currently undergoing a regional consultation process to inform the consultation participants, generate comments and validate the draft MTPDP. The comments and feedback on the draft MTPDP was supposed to be consolidated and presented at the national level in February 2011. The budget for 2012 would be most likely in consonance with the submitted MTPDP. The draft MTPDP consists of macroeconomic policy, competitive industry and services sectors, competitive and sustainable agriculture and fisheries, accelerating infrastructure development, financial sector, good governance and
Final Report - Main Report Chapter 2
Preparatory Study for Pasig-Marikina RiverChannel Improvement Project (Phase III)
2-12
rule of law, social development, peace and security and conservation, protection and rehabilitation of environment and natural resources towards sustainable development.
The Comprehensive Land Use Plan (CLUP) serves as the primary and dominant bases for the future use of land resources though there is no specific designation of river area. The preparation of CLUP is a mandate of LGU as set forth in the Local Government Code of 19913, which was enacted through zoning ordinances. The CLUP’s planning, approval and implementation process is as presented in the figure below.
Figure 2.2.2 Comprehensive Land Use Planning Process Flow Chart
The table below presents a numerical summary of existing and future land use of the concerned cities and municipalities based mainly on each of the latest CLUP. The Rizal Provincial Physical Framework Plan was also referred in the preparation of the table. Due to inaccessibility to or unavailability of the report, numerical data of land use in Taguig and those in Rizal are missing in the table. Readers of the report are also reminded that base years of the CLUP differ among the cities and municipalities. The different categories of the land use were integrated into a common format of presentation to enable comparison among the cities and municipalities.
Notable features of the land use changes between existing and proposed are: 1) minimal change in residential area except Manila City that has adopted a policy to encourage a clustered development style for multi-family and commercial development; 2) Accelerated relocation of industries except Marikina City that has a Heavy Industrial Zone in the northeastern side of the city and undergone relocation of several manufacturing firms within
3 Other legal bases of the LGUs in the formulation or revision of the comprehensive land use plans include 1) RA 6657, otherwise known as the Comprehensive Agrarian Reform Law of 1988 and 2) RA 7279, otherwise known as the Urban Development and Housing Act of 1992.
Preparatory Study for Pasig-Marikina River Channel Improvement Project (Phase III)
Final Report - Main ReportChapter 2
2-13
the city including a shoe accessories factory; 3) Varying degree but consistent rise among the cities and municipalities in the land area earmarked for commercial and business activities; and 4) Diminished open and unused land area, included in other land, that may have impact on infiltration capacity.
Table 2.2.10 Existing and Future Land Use
City/Municipality Manila* Makati Mandaluyong Pasig Quezon Marikina Taguig San Juan Pateros Taytay Cainta
* The total land area of Manila differs between the existing and the proposed land use due to potential land reclamation that may take place before 2020.
2.3 Environmental Condition
The Pasig-Marikina River stretches over a densely populated urban part of the country. The quality of environment in general, more specifically water quality, flora and fauna, had deteriorated significantly in the past decades due to rapid population growth and resultant increased pollution load compounded by limited investment for environmental management.
2.3.1 Water Quality
The water quality of surface water is measured against Department of Environment and Natural Resources Administrative Order (DAO) 1990-34. The designated water use of the Pasig-Marikina River is Class C, which is for 1) Fishery water for the propagation and growth of fish and other aquatic resources; 2) Recreational Water Class II (boating, etc); and 3) Industrial Water Supply Class I (for manufacturing process after treatment).
Overall trend of water quality of the Pasig-Marikina River is constant deterioration: Historically, according to the PRRC, the Pasig-Marikina River had already been unqualified as Class C water quality in the 1970’s, all fishing activities stopped in the 1980’s, and in the 1990’s the river was
Final Report - Main Report Chapter 2
Preparatory Study for Pasig-Marikina RiverChannel Improvement Project (Phase III)
2-14
declared as “biologically dead.” The major sources of water pollution are suspected to be the light to heavy industries located along the Pasig and Marikina rivers and regular households. Industries and businesses in Pasig City have been developed with limited enforcement of land use plan and regulation. This practice allowed the industries and businesses to discharge raw or little-treated liquid wastes to the Pasig and Marikina rivers. Barges that are permanently parked along the river likely cause environmental and navigation problems. Solid and liquid wastes from residential and commercial activities are also discharged into the rivers via the drainage system (Pasig City CULP 2001-2010).
The general trend of water quality is better at the Marikina Bridge sampling station in the upper stream. BOD, COD, TSS, Nitrates, Phosphates, Total Coliform, and Cadmium show similar trends: Start with lower level at Marikina Bridge, then increase toward Vargas, after merging with highly concentrated water from Buayang Bao, more or less the trend evens out from Guadalupe Ferry Station to Havana Bridge, then after joining the San Juan River it decreases toward Manila Bay. Almost all parameters for all sampling locations do not satisfy the Class C water quality level. Refer to ANNEX: Water Quality Survey.
2.3.2 Flora and Fauna
(1) Flora
(a) Terrestrial Flora
The riverbanks serve as habitat for a few thriving natural plants, majority of which are the Ficus species. Agricultural fruit trees and ornamental plants were also observed on the banks of the Pasig River. The terrestrial plants along the embankment of the river stretch were recorded. Among the commonly encountered plants in the riverbanks, either planted for bank enhancement and shade or occurred naturally through seed dispersal agents as wind, insects and birds, are Ficus religiosa, Leucaena leucocephala, Terminalia catappa, Sandoricum koetjape, Swietenia macrophylla, Cocos nucifera, Ficus septica, Trema orientalis, Ficus balete and Gmelina arborea.
(b) Mangrove
It was reported that mangrove areas have declined significantly in the Manila Bay area due to the conversion of land use. For instance, in 1994, it was estimated that there were 1,276 ha of mangrove forests in the bay. In 2005 the Environmental Resource Validation by Manila Bay Environmental Atlas identified 414.15 ha of mangrove forests in the bay.
(c) Aquatic Flora (Macrophytes)
The aquatic biota is low in diversity of macrophytes in the Pasig River, which can be attributed to river pollution and concentration of population on the nearby areas. The same or similar habitat and biological characteristic can be expected in the Marikina River and its surrounding areas.
Table 2.3.1 Aquatic Macrophytes found in the Pasig River
Species Common Name Family Remarks Eichornia crassipes Water hyacinth Pontederiaceae Exotic Ceratophyllum demersum Hornwort Ceratophyllaceae Indigenous Ipomoea aquatica kangkong Convolvulaceae Indigenous Pistia stratoites Quiapo Araceae Indigenous
Preparatory Study for Pasig-Marikina River Channel Improvement Project (Phase III)
Final Report - Main ReportChapter 2
2-15
(d) Phytoplankton
The phytoplankton species that were collected on 20 September 2008 during the Pasig II environment monitoring session are of three (3) different classes: Cyanophyceae, Chlorophyceae and Bacillariophyceae.
(2) Fauna
(a) Wildlife
Pursuant to DAO No. 2004-15, the National List of Threatened Fauna was prepared with the aim to determine species of wild birds, mammals, and reptiles which shall be declared as priority concern for protection and conservation. It shall be prohibited to collect and/or trade any of the species in the list unless in possession of a permit granted by the DENR. The list includes 146 species composed of 33 species of mammals, 80 species of birds, 18 species of reptiles and 15 species of amphibians.
According to the National List of Threatened Fauna, six (6) species of mammals, four (4) species of birds, and five (5) species of reptiles are listed in and around the project sites. According to the Manila Bay Area Environmental Atlas (PAWB-DENR, 2007) there is no distribution of coral reef in the coastal zone of the Study Area.
No protected habitat of endangered species designated by the country’s laws or international treaties and conventions has been reported throughout Phase II environmental monitoring and on DENR’s report, and the same is expected to be the case for Phase III. Moreover, since construction and dredging activities are held within the already highly-developed Metro Manila area, exclusively in and along the already highly-polluted and disturbed Pasig-Marikina River.
(b) Nektons (fish)
Ancistrus temminckii, commonly known as “janitor fish” was the only fish species caught during the aquatic biota sampling. The Janitor Fish is an invasive species, which was brought for a research purpose from out of the country, and not a native of the Pasig-Marikina River. The most number of janitor fish caught and observed was in Guadalupe Bridge. None was caught at Lambingan Bridge.
(c) Zooplankton
Three (3) groups of zooplankton were found in four sampling stations in the Pasig River. As in most tropical freshwaters, results show that zooplankton population is dominated by Cladocerans, with 46% of the total population count of zooplankton in all of the sampling stations. Diaphanosoma excisum is the species notably recorded as the most abundant among the other Cladoceran species.
(d) Macrobenthos
Oligochaetes and dextral pond snails dominate the macrobenthic population occupying 48% of the total collection in all sampling stations. Oligochaetes belong to Phylum Annelida, which are known as well-segmented worms.
The river snail, which belongs to family Pleuroceridae, holds 19% of the total number of collected macrobenthic organisms.
Shrimps are the least number in the macrobenthic community with 5% dominancy. They are under the Subphylum Crustacea that requires well-oxygenated water. This explains its low dominancy among the macro invertebrate species in four stations.
Final Report - Main Report Chapter 2
Preparatory Study for Pasig-Marikina RiverChannel Improvement Project (Phase III)
2-16
Corbicula manilensis, commonly known as “tulya” was observed in Guadalupe station since the station is near Laguna de Bay. Few individuals of Pomacea canaliculata or “golden kuhol” were also obtained from all the four stations.
2.3.3 Environmental Impact Assessment
This section of the report presents and discusses the procedure of environmental impact assessment of projects on the basis of the effective laws and regulations of the country. A comparative analysis with JICA’s guidelines will be presented in Chapter 3 as part of the Review of Environmental Impact Assessments.
(1) Overview of the Legal Framework
In the Philippines, all private or public projects or activities that may have a negative impact on the environment are subject to Environmental Impact Assessment (EIA) by the Philippine Environmental Impact Statement System (PEISS). EIA is the preliminary analysis of the potential impacts of the project on the environment. Aware of the possible negative effects of the implementation of industrial and other activities, governments had instituted measures to encourage the use of EIA as a planning and decision making tool.
PEISS is a set of laws, regulations, administrative orders and guidelines concerned in EIA. Among them, some of the most important laws and guidelines are as listed below:
Environmental Impact Statement System, Presidential Decree No. 1586 (1978): An act establishing and centralizing the Environmental Impact Statement (EIS) System under the National Environmental Protection Council (NEPC), which merged with the National Pollution Control Commission (NPCC) in June 1987 to become the Environmental Management Bureau(EMB).
Presidential Proclamation No. 2146 (1981) and No. 803 (1996): It proclaims Environmentally Critical Projects (ECPs) to have significant impacts on the quality of the environment and Environmentally Critical Areas (ECAs) as environmentally fragile areas within the scope of the EIS System.
DAO 96-37, Revised DAO 92-21 (Devolution of the EIS to the EMB-Regional Office) and further strengthened the PEISS: This also emphasized enhancing maximum public participation in the EIA process to validate the social acceptability of the project.
DENR Administrative Order No. 30 Series of 2003 (DAO 03-30), Revised Procedural Manual (2007): It provides implementing rules and regulations of Presidential Decree No. 1586, establishing the Philippine Environmental Impact Statement System (PEISS). Also, detailed information in definitions of technical terms, procedures, related laws and regulations are described.
(2) EIA Procedures
The procedures of EIA can be grouped into the Pre-Study Stage (screening and scoping), the EIA Study Stage and the Post-Study Stage (review, decision-making and monitoring), as summarized in the following flowchart.
Preparatory Study for Pasig-Marikina River Channel Improvement Project (Phase III)
Final Report - Main ReportChapter 2
2-17
Pre-Study Stage
EIA Study Stage
Post-Study Stage
Project
EIA Study Scoping
EIA Study/ Report Preparationby the Project Proponent as
a requirement for ECC application
Expansion/Project modifications Implementation
Environmental Impact Monitoring and Evaluation/Audit
Change of Project
plan/Relocation
Public Invo
lvem
ent
No EIAEIA Required
Review and Evaluation of EIAfacilitated by DENR-EMB
Denial of ECCIssuance of ECC w/ recommendations to other entitles w/ mandate on the project
Secure necessary permits / clearances from other EMBDivisions, DENR Bureaus, other GAs and LGUs
Source: Revised Procedural Manual for DENR Administrative Order No. 30 Series of 2003 (DAO 03-30)(2007)
Figure 2.3.1 Summary Flowchart of EIA Process
(3) Projects covered by PEISS
The Projects that have been originally declared as Environmentally Critical Projects (ECPs) or projects in Environmentally Critical Areas (ECAs) are assumed to have significant impacts on the quality of the environment, and to be subjects of PEISS. The four (4) ECP project types and twelve (12) ECA categories have been declared through Proclamation No. 2146 (1981) and Proclamation No. 803 (1996).
Projects located within flood-prone areas shall be subject to PEISS because such project sites fall in the category of “areas frequently visited and or hard-hit by natural calamities such as geologic hazards, floods, typhoons, volcanic activity, etc.” in the Environmentally Critical Areas.
The Project is considered to be not ECP but Category F of ECA.
Legend:
Proponent driven
DENR-EMB driven
Proponent driven but the EIA process as requirements are under the mandate of other entities
Final Report - Main Report Chapter 2
Preparatory Study for Pasig-Marikina RiverChannel Improvement Project (Phase III)
2-18
Table 2.3.2 Summary of Environmentally Critical Projects (ECPs)
Main Categories Sub-Category A. Golf Course Project Golf course projects/complex B. Heavy Industries Iron and Steel Metals
Non-ferrous Metal Industries Petroleum and Petrochemical Industries Smelting Plants
C. Resource Extractive Industries
Fishery Projects-dikes for/and fishpond development projects Forestry Projects Major mining and quarrying projects
D. Infrastructure Projects Major Dams Major Reclamation Projects Major Power Plants (Proc No. 2146 declared types: fossil-fueled, nuclear fueled, hydroelectric or geothermal)
Source: Revised Procedural Manual for DENR Administrative Order No. 30 Series of 2003 (DAO 03-30)(2007)
Table 2.3.3 Summary of Environmentally Critical Areas (ECAs)
ECA Categories Examples A. Areas declared by law as national
parks, watershed reserves, wildlife preserves, and sanctuaries
- Areas of the National Integrated Protected Areas System (NIPAS)
B. Areas set aside as aesthetic, potential tourist spots
- Areas declared and reserved by the Department of Tourism or other authorities for tourism development
C. Areas which constitute the habitat for any endangered or threatened species of indigenous Philippine wildlife (flora and fauna)
- Areas inhabited by indeterminate species, threatened species, rare species, endangered species, such species categorized as Appendix I or II of CITES as well as listed in the National List of Threatened Fauna
D. Areas of unique historic, archeological, geological, or scientific interests
- National historical landmarks, geological monuments, paleontological and anthropological reservations as designated or determined by the National Historical Institute, National Museum, National Commission for Culture and the Arts, National Commission on Geological Sciences, and other authorities
E. Areas which are traditionally occupied by cultural communities or tribes
- Areas that are occupied or claimed as Certificated Ancestral Domains/Lands by indigenous communities
F. Areas frequently visited and or hard-hit by natural calamities (geologic hazards, floods, typhoons, volcanic activity, etc.
- Areas frequently visited or hard-hit by typhoons - Areas frequently visited or hard-hit by tsunamis - Areas frequently visited or hard hit by earthquakes - Storm surge-prone areas - Flood-prone areas - Areas prone to volcanic activities - Areas located along fault lines or within fault zones - Drought-prone areas
G. Areas with critical slope - Lands with slope of 50% or more - Alienable and disposable forest lands and unclassified forests
H. Areas classified as prime agricultural lands
- Irrigated and irrigable areas and other areas mapped under the Network of Protected Areas for Agriculture (NPAA) of the Bureau of Soils and Water Management (BSWM)
I. Recharged areas of aquifers - Areas of sources of water replenishment
J. Water bodies - Areas that are tapped for domestic purposes - Areas which support wildlife and fishery activities
K. Mangrove Areas - Tidal areas covered by salt-tolerant, intertidal tree species - Areas declared as mangrove swamp forest reserves
L. Coral Reefs
- Areas characterized by the assemblage of different types of marine plants and organisms
- Areas identified by local sources such as PAWB-DENR to be rich in corals.
Source: Revised Procedural Manual for DENR Administrative Order No. 30 Series of 2003 (DAO 03-30)(2007)
2.4 National Policy and Direction for Flood Control
The Plan for 2011-2016 to orient the national policy and direction for economic and infrastructure development is as discussed below, while the DPWH flood control policy (2011-2016) is under
Preparatory Study for Pasig-Marikina River Channel Improvement Project (Phase III)
Final Report - Main ReportChapter 2
2-19
preparation. As for the flood control policy and direction, refer to the Medium-Term DPWH Infrastructure Development Plan (2004-2010).
2.4.1 Medium-Term Philippine Development Plan (2011-2016)
The Philippine Development Plan of 2011-2016 was formulated in accordance with the constitutional provision of Section 9, Article VII, directing the Government’s economic and planning agency to “implement continuing integrated and coordinated programs and policies for national development.”
The Plan centers on five (5) key strategies. First is to boost competitiveness in the productive sectors to generate massive employment, second is to improve access to financing to address the evolving needs of a diverse public, third is to invest massively in infrastructure, fourth is to promote transparent and responsive governance, and fifth is to develop human resources through improved social services and protection. These strategies will be supported by complementary action programs that focus on achieving a stable macroeconomic environment, ensuring ecological integrity, and advancing the peace process and guaranteeing national security.
As for the policy to cope with flood issue, it is discussed as Flood and Drainage Management in the part of Accelerating Infrastructure Development in Chapter 5. First, assessment, issues and challenge on the issue are first described, and then, Strategic Plan and Focus are introduced in the MTPDP (2011-2016) as shown in the following table.
Table 2.4.1 Items shown in MTPDP (2011-2016)
I tems Major Contents
1 . Prioritize the construction of f lood management structures inh igh ly vulnerable areas
2 . Apply CCA and DRRM strategies in the plann ing and design off lood management structures
3 . Develop a mechanism to expedite immediate f inanc ing for therehabilitation of f lood management structures
4 . Increase local government and community partic ipation
Strategic Planand Focus
Inadequate disaster mitigation and response
Lack of f inancing
Unsustainable O&M of structural and non-structuralin frastructures
Assessment,Issues, andChallenges
(1) Assessment, Issues and Challenges
As for the assessment, issues and challenges out of these major items in the above table, the detailed contents are as shown in the following table.
Final Report - Main Report Chapter 2
Preparatory Study for Pasig-Marikina RiverChannel Improvement Project (Phase III)
2-20
Table 2.4.2 Assessment, Issues, and Challenge shown in MTPDP (2011-2016)
Items Description Detailed
The cumulative impact of f loods on the loss of lives and damages toproperties and live lihood resu lts in a deceleration, if not setback, ofsocial progress and economic activities in affected area
The country's archipelagic character makes it h igh ly vulnerable to theeffects of c limate change (rising temperature trends, changing inrainfall patters and an increasing number of extreme c limate events) .
DPWH has identif ied several critical f lood control projects nationwide ,wh ich cannot be immediately implemented. This perenn ial fundingproblem not on ly affects the implementation of the hard infrastructurecomponent of projects, but also affects the inherent activities.
Th is also affects the implementation of complementary nonstructuralmeasures .
Additionally, O&M spending are not exempt from funding constrains.
LGUs and other implementing agenc ies also lack funds for regu lar O&Mof existing f lood control programs.
Coordination among government agencies and LGUs is a problem thataffects the implementation , O&M of f lood control structures.
Owing to inadequate f inanc ial support and capacity to conduct O&M,not all LGUs and even MMDA can fu lly commit to th is responsibility.
Inadequate disastermitigation and response
Lack of f inanc ing
Unsustainable O&M ofstructural and non-structuralin frastructures
Assessment,Issues, andChallenges
(2) Strategic Plan and Focus
To the items of assessment, issues and challenges, the detailed contents of prepared strategic plan and focus are as shown in the following table.
Preparatory Study for Pasig-Marikina River Channel Improvement Project (Phase III)
Final Report - Main ReportChapter 2
2-21
Table 2.4.1 Strategic Plan and Focus in MTPDP (2011-2016)
Item Description
1 . Prioritize the construction off lood management structures inh igh ly vu lnerable areas
Available f inancing for DRRM of infrastructure in the event of f loods mustbe optimized.
Recognizing the ef fects of c limate change, design criteria for f lood controlstructures should be revisited to ensure that capacities of structures areadequate to handle the expected increase on food water volume
Protocols on dam-water re lease during typhoons should also be reviewed
Downstream interventions will have to be complemented by upstreamactivities such as watershed management to min imize siltation .
The adaptation and mainstreaming of the eco-eff ic iency concept in waterinfrastructure is an example of such an adaptation strategy
Excess water during rainy seasons can be impound, stored and then re leasedfor future multipurpose use.
Equally important are immediate post-disaster response and interventions.LGUs and implementing agencies alike are encourage to adopt a proactiveapproach in the conduct of DRRM.
Emphasis shall be given to preventive measures and structures as well as inraising disaster-preparedness among stakeholders to min imize damage tolives and properties should a natural disaster occur.
Nonstructural measures should be developed accordingly.
A h indrance to prompt response is the slow disbursement funding toimplement immediate measures.
To expedite the process, it may be prudent to provide annual appropriationswith in DPWH's budget.
Likewise , DPWH and affected LGU's may opt to avail of various f inancingmechanisms and instruments designed especially for post-disasterrehabilitation and repair work.
Since f lood-re lated risks and damages are the immediate concern of localcommunities, the ir cooperation and partic ipation in O6M of f loodmanagement structures and measures as well as disaster response should beenhanced.
Programs should in corporate the partic ipation of stakeholders and theidentif ication of the ir corresponding roles in watershed protection , f loodmitigation and disaster preparedness and response measures.
With advocacy and capacity bu ilding assistance from the DILG, LGUs areexpected at the forefront of implementing localized CCA and DRRM plans.
The government would be required to appropriate the resources needed forboth manpower and funding to fac ilitate smoother operationalization .
Financing frameworks should also be developed to provide for the necessarycapacity development programs as well as O&M activities of f lood controlstructures and fac ilities.
The responsibilities among stakeholders should be c learly def ined to promotegreater coordination among implementing agencies and LGUs, particu larlyduring the implementation and O&M phases of f lood control projects, and toenhance accountability
2 . Apply CCA and DRRM strategiesin the planning and design of f loodmanagement structures
3. Develop a mechanism toexpedite immediate f inancing forthe rehabilitation of f loodmanagement structures
4 . Increase local government andcommunity partic ipation
2.4.2 Medium-Term DPWH Infrastructure Development Plan (2005-2010)
The DPWH had set nine (9) tasks to be solved or improved for the implementation of effective flood and landslide disaster mitigation since the previous Medium-Term Plan (1999-2004), as follows:
(1) Formulation of an overall Master Plan of flood control adopting the principle of management and river basin approach;
Final Report - Main Report Chapter 2
Preparatory Study for Pasig-Marikina RiverChannel Improvement Project (Phase III)
2-22
(2) Pursuance of comprehensive planning of prioritized major and principal river basins, giving priority to maintenance rather than new construction;
(3) Provision of adequate flood control and drainage facilities in all flood/sediment disaster prone areas to mitigate flooding within tolerable levels;
(4) Pursuance of nonstructural measures to mitigate floods, such as flood forecasting and warning and monitoring system, evacuation plan, hazard mapping and reforestation;
(5) Keeping of optimum conveyance capacities of river channel floodways, drainage canals, esteros, etc., through riverbank protection, dredging/de-silting, observance of river easement, and efficient management in coordination with LGUs;
(6) Establishment of database of river information, including existing flood control drainage, and Sabo structures;
(7) Strengthening and maximizing the capacity of the Flood Control and Sabo Engineering Center (FCSEC) to conduct basic and applied researches and development, engineering programs and human resources development;
(8) Strengthening of the flood management capabilities of DPWH, LGUs and other concerned agencies; and
(9) Establishment of the National Flood Mitigation Management Committee (NFMC) as the inter-agency organization and policy governing body to integrate and lead all efforts on disaster mitigation and flood management, and formulate guidelines.
2.5 Related Ongoing Projects
2.5.1 Phase II Project
At present, out of the overall Pasig-Marikina River Channel Improvement Project, the construction of channel improvement works of the Pasig River is being implemented by the DPWH. This is called the Phase II Project which receives assistance from the Japanese ODA. Its target completion of civil works is in June 2012.
The Detailed Design for the entire project was conducted from October 2000 to March 2002. Until the start of Phase II Project in December 2007 after the completion of Detailed Design, channel improvement works such as construction of revetments, river walls, and river linear parks at some channel sections have been implemented under the projects of PRRC, DPWH and participating LGUs.
On the other hand, it took a long time to obtain the understanding among the government agencies on the DPWH’s plan/design for an overall flood control project, to carry out a Value Engineering Study (VES), and to prepare the project fund (Loan).
(1) Completed Channel Improvement Projects of the Pasig River
As shown in the table below, prior to the execution of the Phase II Project, construction/rehabilitation works of revetments along selected segments of the Pasig River have been substantially completed under the Pasig River Rehabilitation Project (PRRP) of DPWH between 2000 and 2004 and the LGUs’ projects which utilized local funds, as well as the PRRC Linear Park Project in 2001 to 2008.
Preparatory Study for Pasig-Marikina River Channel Improvement Project (Phase III)
Final Report - Main ReportChapter 2
2-23
Table 2.5.1 Completed Other Projects for Channel Improvement of the Pasig River
Scheme Remarks (1) PRRC Linear Park Project along Pasig Marikina River Banks 12.3 km long; ADB Loan(2) PRRC Revetment Rehabilitation Project a) PRRC Revetment Works b) DPWH Revetment Works c) LGU's Revetment Works
5.8 km long in total 1.3 km long 3.4 km long 1.1 km long
(2) Scope of Work of Ongoing Phase II Project
The Phase II Project targets the 16.4 km channel stretch from Del Pan Bridge near Manila Bay to the junction with Lower Marikina River/Napindan River near C5 Bridge and composes of the following works:
Construction of Revetment, together with River Walls
6.8 km
Construction of River Walls Only 6.3 km
Out of 32.8 km on both banks, a total of 13.1 km will be developed in Phase II Project.
(3) Preparation for Approval of Phase II Project Implementation
Implementation of the Phase II Project was approved by the ICC-Technical Board (TB) on July 26, 2002 and by the ICC-Cabinet Committee (CC) on August 1, 2002. Subsequent approval of the same by the NEDA Board was done on September 3, 2002.
Due to the revision of total project cost, re-evaluation of the Phase II Project was made by the ICC. Approvals of the Project by the ICC-TB and ICC-CC were obtained on March 6, 2003 and March 13, 2003, respectively. The NEDA Board’s confirmation was given on May 6, 2003.
On the other hand, a meeting among DPWH, MMDA and NEDA was held on July 22, 2004 at the office of MMDA. Since the Chairman of MMDA still had a lot of queries that had to be addressed, the Value Engineering Study (VES) by the University of the Philippines - National Hydraulic Research Center (UP-NHRC) was conducted from June to September 2005, with funds from the DPWH local budget. Results of the VES were presented in the meeting of the NEDA Board’s Committee on Infrastructure (INFRACOM) held on March 10, 2006 wherein project approval was made. Moreover, the ICC Approved Project Cost in 2006 was PHP4,608 million.
(4) Financial Arrangement for Phase II Project Implementation
Necessary funds for the implementation of Phase II Project with the approved project cost of Php4,608 million is financed from Japan’s ODA Loan (Special Term Economic Partnership, STEP, under the 26th JICA Yen Loan Package) and the GOP counterpart fund. Costs for civil works and consulting services out of the project cost are covered by the STEP Loan. Costs for construction management and taxes are prepared from the GOP counterpart fund.
The STEP Loan is expected to raise the visibility of Japan’s ODA to citizens in recipient countries and Japan, through utilizing and transferring excellent technologies and know-how of Japanese firms, and it applies loan conditions with less interest and longer period compared with the conventional yen loan. The Japanese “Water-jet Technology” is utilized as excellent construction method for pile driving into the hard strata along the Pasig River Channel rather than the standard method (vibrating hammer driving method), to facilitate construction activities and to minimize vibration/noise of construction activities and, actually, these have been achieved in the Phase II construction activities. Total cost of goods procured from Japan shall be not less than 30% of the total amount of contract(s). The
Final Report - Main Report Chapter 2
Preparatory Study for Pasig-Marikina RiverChannel Improvement Project (Phase III)
2-24
total loan amount of 8,529 million Japanese Yen is less than the 85% (currently 100%) of the total project cost (9,909 million Japanese Yen or 4,608 million Philippine Peso), in accordance with the STEP Loan’s condition.
The following table gives a summary of Loan Agreement No. PH-P239 dated February 27, 2007 for the Phase II Project.
Table 2.5.2 Summary of Loan Agreement No. PH-P239 for Phase II Project
Category Amount of Loan Allocated (in million Japanese Yen)
(A) Civil Works 7,196 (B) Consulting Services 973 (C) Contingencies 360 Total 8,529
Note: (1) Items not eligible for financing area as shown below:
a) General administration expenses b) Taxes and duties c) Purchase of land and other real property d) Compensation e) Other indirect items
(2) Exchange Rate: PHP1.0 = JPY2.15 (3) 0.75% interest rate per annum, 40 years repayment period and 12 years grace period (then). (4) Final disbursement not later than 8 years after the effective date of Loan Agreement (February 27, 2015).
(5) Present Status of Ongoing Construction of Phase II Project
The executing agency is the DPWH Project Management Office – Major Flood Control and Drainage Project, Cluster I (DPWH-PMO-MFCP-I). After the selection of the Project Consultant, the consulting services commenced on December 19, 2007 to conduct the pre-construction stage consisting of design review, pre-qualification of contractors and tendering, and construction supervision stage, including environmental monitoring and information campaign and publicity for the Project.
The construction works of Phase II Project are divided into two contract packages: Contract Package No.1-A (Lower Pasig River: 9.2 km from Del Pan Bridge to Lambingan Bridge; Toyo Construction Co., Ltd.; Original Contract Price: PHP2,366,201,513.93); and Contract Package No. 1-B. (Upper Pasig River 7.2 km from Lambingan Bridge to immediate vicinity of NHCS (C5 Bridge); Toyo Construction Co., Ltd.; Original Contract Price: PHP4151,693,143,411.84). The contractor for both packages, Toyo Construction Co., Ltd., mobilized on July 1, 2009 with the target completion date of the contract works set on June 29, 2012. As of the end of March 2011, both contract packages have made a great progress at 89.78% (target 64.16%) for Contract Package No.1-A and 82.29% (target 59.19%) for Contract Package No.1-B. The notable achievement could be the results of the following:
Cooperation of residents and factories/offices along the project area through effective and efficient information campaign and publicity;
Advantage of good weather in 2010 for construction activities;
Effectiveness and efficiency of adopted Water-jet Technology for driving steel piles into hard strata;
Less acquisition of required right-of-way and relocation of structures affected by the project; and
Well-coordination with PRRC, MMDA, LGUs, and other government agencies.
Preparatory Study for Pasig-Marikina River Channel Improvement Project (Phase III)
Final Report - Main ReportChapter 2
2-25
2.5.2 Project undertaken by Pasig River Rehabilitation Commission (PRRC)
(1) General
The Pasig River Rehabilitation Commission (PRRC) was established under Executive Order 54 and 65 in 1999 in order to rehabilitate the Pasig River environmental conditions in the following vision, mission and goals:
Vision: A new Pasig River (clean and alive) reflecting the country’s noble history and progress;
Mission: To restore the Pasig River to its historically pristine condition by applying bio-eco engineering and attain a sustainable socio-economic development; and
Goal: Restore river water quality to Class C.
The PRRC membership is as shown in Table A 2.5.1 in ANNEX.
For the purpose, PRRC in principle has the following functions, duties and responsibilities:
Shall be responsible for the relocation, housing and resettlement of qualified informal settlers and other unauthorized and or unlawful occupants along the banks of the Pasig River;
Shall be responsible for ensuring that the easements provided under RA No. 386 or the Civil Code of the Philippines, P.D. No. 1067 or the Water Code of the Philippines, and other related laws/statutes. Rules, regulations and ordinances for that matter including MMC Ordinance No. 81-01 or the Metro Manila Comprehensive Zoning Ordinance and MMDA Resolution No. 3, Series of 1996, “Adopting a Uniform Easement Provision along the Pasig River System including its Tributaries, maintaining a Linear Park at the Minimum Setback of Ten (10) meters from existing shoreline, Banks or Streams and three (3) meters from existing esteros and canals as provided for in MMC Zoning Ordinance No. 81-01 and Section 51 of the Philippine Water Code, respectively” are observed within the Pasig River and its tributaries and other waterways that drain into it including the esteros;
To attain a Class C water quality, it shall stop/abate the dumping of solid waste and untreated liquid wastewater and septage into the river from all sources including industrial, commercial and domestic. In this regard, it shall enforce and/or penalize all acts and omissions;
Shall undertake civil works necessary for the rehabilitation of the Pasig River System; and
Shall promote the effort of the government, specifically the Office of the President, the Commission and its member implementing agencies, to rehabilitate the Pasig River and its environs in order to create a high level of public awareness on said effort and gain the needed public support for the success of the rehabilitation program.
(2) Resettlement of Informal Settlers along the River Course
To improve the environment along the river course, one of the significant issues is to cope with the informal settlers affecting the scenery of riparian areas and deteriorating the environmental conditions through their life activities. Such informal settlers in the study area and along the Mangahan Floodway are estimated to be 30,395 households, according to the SAPROF study in 1998. The 12,800 households occupying the banks of the Pasig River and its tributaries were identified by LGUs and submitted to NHA in 1994 during the inception of the PRRP Squatter Relocation and Resettlement Plan. The table below shows the magnitude and distribution of households along the Pasig River.
Final Report - Main Report Chapter 2
Preparatory Study for Pasig-Marikina RiverChannel Improvement Project (Phase III)
2-26
Table 2.5.3 Number of Informal Settlers along Pasig River
To improve the situation, PRRC has been promoting resettlement projects for these informal settlers. As the target for the Phase II Project, PRRC established the 10m-wide Environmental Preservation Areas (EPAs) along the river banks, requiring the relocation of about 10,000 informal settlers. At present, a total of 6,115 families have been relocated to five (5) resettlement sites located in Rodriguez, Rizal Province, and in Makati City and Cavite City.
The principal relocation site is the Kasiglahan Village I (KV-I) in Barangay San Jose, Rodriguez, Rizal, which is about 45 minutes away from SM North, Quezon City, by public transportation. Each house and lot package has an average lot size of 32 m2, with an average floor area of 20 m2.
Development features in the resettlement site include concrete roads/curbs and gutters, an underground drainage system, centralized water system and power supply by Meralco. Aside from these, there is now an existing multi-hall in KV-I that the people can use for various activities and family affairs. A wet market was also constructed in KV-I with 123 stalls available for occupancy.
Livelihood assistance packages were also designed to assist the families to maintain, restore or enhance their income, which may have been disrupted by relocation. On top of these is the creation of multi-purpose cooperatives for social credit funding.
Aside from these, a total of 1,728 families were relocated to two (2) relocation sites: Cardinal Sin Village, Punta, Sta. Ana in Manila and Villa San Isidro Village (Kasiglahan Village), Rodriguez, Rizal, with the completion of 728 units of medium-rise buildings in Manila and 1,000 housing units in Rizal. Beneficiaries of these projects are the families from Punta, Sta. Ana, Manila.
(3) Riverbank Development
In the context of rehabilitation of environment along the Pasig river course, PRRC has been conducting riverbank development. For the purpose, environmental preservation areas (EPAs) with 10m easement along the whole stretch of Pasig River from Manila Bay to Laguna Lake have been developed into continuous linear parks, river-walks and promenades that are accessible to the public. Adequate facilities were installed in these linear parks that provide improved access to the bridge. To date, a total of 22 parks or 23km have been completed in Manila, Makati, Mandaluyong, Pasig, Marikina and Taguig. Thirty (30) other parks are in various stages of completion.
Preparatory Study for Pasig-Marikina River Channel Improvement Project (Phase III)
Final Report - Main ReportChapter 2
2-27
The purpose of establishment of EPAs is not only for parks and promenades. More importantly, the EPAs will serve as buffer zones for public safety and river protection, help reduce waste discharge into the river, provide access/transportation, recreation and tourism, and introduce additional functions/utilities for the river banks.
Aside from the 10m EPA, a 500m urban renewal area (URA) will also be established from the banks of the Pasig River. The URA aims to help upgrade infrastructure in blighted communities, provide security of tenure to the residents, and improve living conditions and quality of urban life. Four (4) out of the 23 proposed URA sites are currently under construction; namely, Baseco in Tondo and Punta in Sta. Ana, both in Manila, Joriz-San Miguel-Abella in Mandaluyong City, and Pineda in Pasig City.
(4) Pasig River Ferry Service (PRFS)
One of the major projects undertaken by the PRRC is to revive the Pasig River Ferry Service. Since February 2007, a total of six (6) 150-seating capacity fiberglass-hulled catamaran boats have been navigating along the river.
A total of ten (10) ferry stations are now operational; namely, Plaza Mexico, Escolta, Lawton, PUP, Sta. Ana and Lambingan, all in Manila, Hulo in Mandaluyong, Valenzuela and Guadalupe in Makati, and San Joaquin in Pasig. It is expected that the additional two (2) ferry stations located at Pinagbuhatan in Pasig and Cardinal Sin Village in Manila will be operational this year 2011. These stations are equipped with intelligent ticketing access systems, metal detectors, CCTV cameras, lifts for the handicapped and clean rest rooms.
The revival of the Pasig Ferry System is a priority project of President Gloria Macapagal-Arroyo of the previous administration to tap the potential of the Pasig River as an alternative transport corridor to decongest road traffic in Metro Manila. The ferry service is planned to eventually expand to cover the Laguna de Bay and Manila Bay areas. Reintroduction of the service will bring back the historic role of the Pasig River as a major means of transportation. It is said that, with the wealth of heritage structures found along and near its riverbanks, the rehabilitation of the Pasig River will also yield tourism opportunities that will serve as catalysts for urban renewal.
(5) Flood Control
PRRC handled the following dredging project for flood control.
In October of 2010, Pasig River Dredging Project (PRDP) was completed. The Project was implemented through a loan from Belgian Super Subsidy Facility (BSSF). It was carried out through coordination and multi-stakeholder participation and later formed the Multi-Partite Monitoring Team (MMT).
The PRDP involved the removal and containment of 2.83 million cubic meters of debris/sediment in the Pasig River, 3 kilometers from Del Pan Bridge toward Manila Bay and the 17 kilometers stretch of the Pasig River up to the Napindan Hydraulic Control Flood Gate. The dredging of the river had increased the river depth and carrying capacity from an average of 4.0 m to 6.0 m and 40-60m bottom width.
The Project was also aimed to contribute to the improvement of water quality of the Pasig River to (a) removal of contaminated sediments, (b) improvement of navigability, and (c) reduce health risks.
(6) Improvement of the Water Quality of the Pasig River
The main goal of the environmental management program for the Pasig River is to restore the river’s water quality to Class C. Its focus is the reduction of the amount of pollutants
Final Report - Main Report Chapter 2
Preparatory Study for Pasig-Marikina RiverChannel Improvement Project (Phase III)
2-28
discharged into the Pasig River. Wastewater discharged by residential, industrial and commercial establishments were identified as the primary source of pollution in the Pasig River. Garbage dumped into the river also contributed to such polluted condition.
Among the strategies adopted to address these problems have been the implementation of a revised system of penalties and incentives for compliance with DENR regulations or the New Environmental User’s Fee (NEUF), the upgrading of capabilities of the Laguna Lake Development Authority (LLDA) and other agencies tasked to issue wastewater discharge permits and to monitor effluents of industrial and commercial establishments, the construction of Sewage Treatment Plant (STP) and procurement of vacuum trucks, the implementation of the water quality monitoring action plan, and the enforcement of regulations and programs on water quality improvement of the Pasig River.
2.6 Related Organizations
In general, the following organizations are related to the implementation as well as operation and maintenance (O&M) of the project:
Department of Public Works and Highways (DPWH)
Metropolitan Manila Development Authority (MMDA)
Pasig River Rehabilitation Commission (PRRC)
Local Government Units (LGUs)
2.6.1 Department of Public Works and Highways (DPWH)
The Department of Public Works and Highways (DPWH) is one of the three departments under the executive branch of the Philippine Government undertaking major infrastructure projects. The DPWH is mandated to undertake 1) planning of infrastructures such as roads and bridges, flood control works, water resources projects and other public works; and 2) design, construction, and maintenance of national roads and bridges, and major flood control systems. These activities are undertaken in support of the national objectives of 1) alleviating rural poverty and attaining food security; and 2) expanding industries for greater productivity and global competitiveness as envisioned in the MTPDP 2004-2010.
The DPWH functions as the engineering and construction arm of Government tasked to continuously develop its technology for the purpose of ensuring the safety of all infrastructure facilities and securing for all public works and highways the highest efficiency and quality in construction.
(1) Functions
The functions for the development of infrastructure projects (e.g., roads, bridges, flood control facilities and water supply) consisting of four phases (Project Identification, Preparation, Implementation, and Operation and Evaluation) are as follows:
(a) Project Identification
It is the process of collecting data and information on potential projects with expected return of investments.
(b) Project Preparation
In the project preparation phase, the following works are undertaken:
Project Feasibility Study; Inclusion in the Medium-Term Development Plan;
Preparatory Study for Pasig-Marikina River Channel Improvement Project (Phase III)
Final Report - Main ReportChapter 2
2-29
Fund Appropriation; Detailed Engineering; and Inclusion of Project Annual Program.
(c) Project Implementation
In this phase, the following works are undertaken:
Fund Release; Right-of-Way Acquisition; Bidding and Contracting; Construction; Completion and Acceptance; and Payment.
(d) Project Operation and Evaluation
National roads and bridges, major flood control structures, and related facilities of national importance remain under the responsibility of the DPWH during the operational phase. The regional and district engineering offices of DPWH undertake the maintenance of facilities, generally by administration.
Impact evaluation or post-project appraisal is an attempt to assess the results of a project and, as a function of the results, of the means employed to achieve them.
(e) Role for Disaster Risk Management
The DPWH is one of main members of the National Disaster Coordinating Council (NDCC, present) which was reorganized in 2010 to form the National Disaster Risk Reduction Management Committee (NDRRMC). Therefore, flood control project implementation is its main responsibility regarding disaster risk management. Besides, the DPWH has been mandated the disaster risk management tasks listed below:
Organize reaction teams within the department offices and bureaus; Provide warning to the public on impending water rise within its control; Prepare and identify buildings, facilities, and infrastructures for use as evacuation
shelter during emergencies; Provide heavy and light equipment for rescue and recovery operations; Restore destroyed public works, offices, and other buildings; Assist in providing transportation facilities for relief supplies, personnel, and disaster
victims; and Make available communication facilities for disaster operations.
In this connection, DPWH prepared the Manual of Operations for Disaster Risk Management which was issued in January 2009.
(2) Organization
The organizational structure of the Department of Public Works and Highways is pursuant to Executive Order No. 124 dated 30 January 1987. The authorities and areas of responsibility are based on Department Order No. 114, 127 and 149 Series of 2003. The organization is divided into that of the central office and the regional offices. The organizational chart is shown in Figure 2.6.1.
Final Report - Main Report Chapter 2
Preparatory Study for Pasig-Marikina RiverChannel Improvement Project (Phase III)
2-30
Figure 2.6.1 Organizational Chart of DPWH
2.6.2 Metropolitan Manila Development Authority (MMDA)
(1) Historical Background
Metropolitan Manila Development Authority embracing 16 cities and one municipality was created in May 1995 under Republic Act No. 7924, through the process of Metro Manila Authority (MMA) in January 1990 by Executive Order No. 392 and Metro Manila Commission in February 1975 by Presidential Decree No. 824.
(2) Scope of Services
The MMDA is responsible for services that have metro-wide impact and transcend local political boundaries, or entail huge expenditures beyond the capability of the individual local government units (LGUs) of Metropolitan Manila. These services include:
Development planning
Transport and traffic management
Solid waste disposal and management
Flood control and sewerage management (which include the formulation and implementation of policies, standards, programs and projects for an integrated flood control, drainage and sewerage system)
Urban renewal, zoning and land use planning, and shelter services
Health and sanitation, urban protection and pollution control
Public safety
(3) Governing Board and Policy-Making Body of MMDA
The governing board and policy-making body of MMDA is the Metro Manila Council composed of the mayors of the cities and municipalities. The heads of the Department of Transportation and Communications (DOTC), Department of Public Works and Highways (DPWH), Department of Tourism (DOT), Department of Budget and Management (DBM), Housing and Urban Development Coordinating Committee (HUDCC) and Philippine National Police (PNP). or their duly authorized representatives, attend meetings of the council as non-voting members. Although the above three coordinating councils or
Preparatory Study for Pasig-Marikina River Channel Improvement Project (Phase III)
Final Report - Main ReportChapter 2
2-31
committees are arranged to cover the coordination for disaster prevention nationwide, it is not realistic for these councils or committees to cover the role of coordination specifically for the Pasig-Marikina river basin, because they already cover such a role for a very wide range and area.
(4) Organization
The organizational chart of MMDA is as shown in Figure 2.6.2
Figure 2.6.2 Organizational Chart of MMDA
2.6.3 Pasig River Rehabilitation Commission (PRRC)
As mentioned in Section 2.4, PRRC was established under Executive Order Nos. 54 and 65 in 1999 to rehabilitate the environmental conditions of Pasig River.
The organizational structure of PRRC is as shown in Figure 2.6.3.
Final Report - Main Report Chapter 2
Preparatory Study for Pasig-Marikina RiverChannel Improvement Project (Phase III)
2-32
Figure 2.6.3 Organizational Structure of PRRC
2.6.4 National Disaster Risk Reduction and Management Council (NDRRMC)
This council, which previously existed as National Disaster Coordination Council (NDCC), was set up under Republic Act No. 10121 in May 2010 to strengthen the Philippine disaster risk reduction and management system, providing for the national disaster risk reduction and management framework and institutionalizing the national disaster risk reduction and management plan, appropriating funds therefore and for other purposes.
The National Council, being empowered with policy-making, coordination, integration, supervision, monitoring and evaluation functions, has the following responsibilities:
To develop a National Disaster Risk Reduction Management Framework (NDRRMF);
To ensure that the National Disaster Risk Reduction Management Plan (NDRRMP) is consistent with the NDRRMF;
To advise the President on the status of disaster preparedness, prevention, mitigation, response and rehabilitation operation;
To ensure multi-stakeholder participation in the development, updating and sharing of a disaster risk reduction and management information system;
To establish a national early warning and emergency alert system; and
Others.
Under the National Council, the disaster risk reduction and management council in the regional level (RDRRC) and the council in the provincial, city, municipal and barangay levels were also set up.
2.6.5 Local Government Units (LGUs)
There are 15 cities and one (1) municipality covering the target area of the Pasig-Marikina River Channel Improvement Project, Phase III, as shown in the following table.
ORGANIZATIONAL STUCTURE
PASIG RIVER REHABILITATION COMMISSION
PRRC CHAIRPERSONC0-CHAIR
PRRC MEMBERS
EXECUTIVE DIRECTORCONSULTANTS
PMOINTERAGENCY MONITORING GROUP
TRANSPORTATION& FLOOD CONTROL
COMMITTEE
DPWHMMDADOTC
MARINADENRDOT
RIVERBANKS & TOURISM
DEVELOPMENTCOMMITTEE
DENRDPWHMMDADOT
DOTCOESDNDDILG
ORGANIZATIONAL STUCTUREPRRC CHAIRPERSON
C0-CHAIRPRRC MEMBERS
EXECUTIVE DIRECTORCONSULTANTS
PMOINTERAGENCY MONITORING GROUP
RIVERBANKS & TOURISM
DEVELOPMENTCOMMITTEE
DENRDPWHMMDADOT
DOTCOESDNDDILG
ENVIRONMENTAL MANAGEMENT
COMMITTEE
DENRMMDAMWSSHUDCCMWCIMWSILLDAC&GFI
HOUSING & RESETTLEMENT
COMMITTEE
HUDCCNHA
MMDAOESDOFDOLEDWPHDSW D
DTINGOsTLRC
INFORMATION &ADVOCACY COMMITTEE
MMDAOES
UNILEVERC&GFINGOs
PRIVATE SECTOR
TRANSPORTATION& FLOOD CONTROL
COMMITTEE
DPWHMMDADOTC
MARINADENRDOT
ORGANIZATIONAL STUCTUREPRRC CHAIRPERSON
C0-CHAIRPRRC MEMBERS
EXECUTIVE DIRECTORCONSULTANTS
PMOINTERAGENCY MONITORING GROUP
RIVERBANKS & TOURISM
DEVELOPMENTCOMMITTEE
DENRDPWHMMDADOT
DOTCOESDNDDILG
Preparatory Study for Pasig-Marikina River Channel Improvement Project (Phase III)
Final Report - Main ReportChapter 2
2-33
Table 2.6.1 Municipalities covering the Target Area of the Phase III Project
City / Municipality Basin Area (sq km) Antipolo City 211.5 Kalookan City 2.0 Makati City 3.5 Malabon City 0.0 Mandaluyong City 11.1 Manila City 1.3 Marikina City 13.9 Norzagaray 0.1 Pasig City 13.2 Quezon City 105.0
Rodriguez (Montalban) 180.6
San Jose Del Monte City 11.0
San Juan City 5.9 San Mateo 57.1 Tanay 24.4 Total 640.7
These cities and municipality are broadly classified into the following two groups:
Group 1: Directly related to Phase III and the potential areas in the Phase II project.
Group 2: Not directly related, but may affect flooding condition due to land development.
In Group 1, the following cities are included: Manila, Makati, Mandaluyong, Pasig, Quezon and San Juan, whereas, the cities/municipality included in Group 2 are Marikina, Rodriguez, San Mateo and Taguig. Besides, the area along the Mangahan Floodway into which part of the flood discharge of Pasig-Marikina River is diverted includes the municipalities of Cainta and Taytay.
Preparatory Study for Pasig-Marikina River Channel Improvement Project (Phase III)
Final Report - Main ReportChapter 3
3-1
CHAPTER 3 STUDIES AND INVESTIGATIONS
3.1 Hydrology and Hydraulics Study
3.1.1 Flood Runoff Analysis
Studies on hydrology and hydraulics for the Pasig-Marikina River Basin have been carried out to verify the reasonability of the PMRCIP. The following items have been examined:
Evaluation of probable discharge
Evaluation of probable rainfall
Review of design hyetograph
Land use condition in target year
Flood runoff analysis
Review of design discharge
(1) Evaluation of Probable Discharge
In PMRCIP, the probable discharge of 30-year return period at St. Niño is employed as the design flood discharge. The samples of discharge for statistical analysis converted from the observed water levels by the rating curve are as tabulated in Table 3.1.1.
Table 3.1.1 Annual Maximum Discharge at St. Niño
Regarding probability density distribution, the Gumbel-Chow Method is employed as in the D/D study. The probable peak discharge at Sto. Niño for each return period is as shown in Table 3.1.2. The probable discharge of 30-year return period computed in this study and the previous one are almost the same. In the previous study, 2,900m3/s, considering the
Note: Water level data from JICA D/D Report in 2002 and EFCOS data (2001 to 2009). Rating curve from JICA D/D Report in 2002:
Q=32.03*(H-20.80)2 when H < 17.0 (E.L.m) Q=17.49*(H-8.61)2 when H > 17.0 (E.L.m)
Final Report - Main Report Chapter 3
Preparatory Study for Pasig-Marikina River Channel Improvement Project (Phase III)
3-2
increment of discharge due to assumed urbanization in target year 2020, is employed as the design flood peak.
Table 3.1.2 Probable Discharge at St. Niño
(2) Evaluation of Probable Rainfall
As in the calculation of probable peak discharge, probable rainfall shall be examined. A 2-day rainfall is employed as the design flood duration. Rainfall intensities at the Port Area and Science Garden stations managed by PAGASA are as shown in Table-A 3.1.1 and Table-A 3.1.2 in ANNEX. Employed for probability density estimation is the Gumbel-Chow Method.
The results of probable rainfall analysis are as tabulated in Table 3.1.3 and Table 3.1.4. Also, previous values of probable rainfall are as shown Table 3.1.5. According to the results, rainfall intensities of daily and 2-day duration decrease by a few percent.
Table 3.1.3 Probable Rainfall (Port Area Station)
Year FrequencyT K 5 min. 10 min. 20 min. 30 min. 60 min. 120 min. 1 day 2 days
Note: “Report in 1992” is the “Detailed Engineering Design of The North Laguna Lakeshore Urgent Flood Control and Drainage Project” and “Report in 2002” is the “Detailed Engineering Design of Pasig-Marikina River Channel Improvement Project.”
In PMRCIP, historical rainfall data at Port Area Station are employed for the statistical analysis to establish the flood control plan because there are enough data at the Port Area as compared with Science Garden Station. For runoff analysis, it is necessary to convert the rainfall data at Port Area as point data to the average rainfall over the Pasig Marikina river basin. In this study, the adjustment factor shown in Table 3.1.6 is used for converting the point data.
Table 3.1.6 Adjustment Factor (D/D Study, 2002)
Return Period
Adjustment Factor
2 5
10 20 30 50
100
1.11 0.95 0.87 0.85 0.82 0.79 0.76
Final Report - Main Report Chapter 3
Preparatory Study for Pasig-Marikina River Channel Improvement Project (Phase III)
3-4
Figure 3.1.1 Location of PAGASA Rainfall Stations
(3) Model Hyetograph
For the calculation of design discharge distribution in the Pasig-Marikina River, the model hyetograph shall be revised. In the PMRCIP, the center concentrated type of hyetograph is employed as the design storm pattern. The model hyetograph of a 30-year return period is as shown in Figure 3.1.2 As a result of the updating of samples of rainfall data for statistical analysis, though the maximum hourly rainfall is a bit larger than the previous one, the revised model hyetograph is very similar to the previous one.
Figure 3.1.2 Model Hyetograph (Center Concentrated Type, Probability 1/30)
It is necessary to understand the land use condition in a target river basin because urbanization contributes to the reduction of flood travel time and the increment of peak discharge during flood events. The runoff analysis model employed in the D/D study is able to calculate discharges from a built-up area and a natural area, respectively, for considering the influence of urbanization.
Figure 3.1.3 Land Cover Map (2005)
bt
ar
n
Kimijima Type r: rainfall intensity (mm/hr) t: storm duration a, b, n: constant parameters
Final Report - Main Report Chapter 3
Preparatory Study for Pasig-Marikina River Channel Improvement Project (Phase III)
3-6
For the estimation of future land use in target year 2020, a built-up area shall be examined based on population forecasting and the land cover map in 2005, because the future land use information at each LGU is not available.
According to Subsection 2.2.2, the population growth rate around Metro Manila is approximately 1.5 percent per year. On the assumption that the population will increase constantly and the built-up area expands in proportion to population growth, the built-up area will increase by 30 percent. These predicted values are lower than the D/D values. However, there are high probabilities of non-predictable land development and rapid urbanization in Metro Manila and hence the urbanization ratio established in the D/D study is employed for runoff analysis.
To calculate the flood discharges at major points in the Pasig-Marikina River, the flood runoff analysis models established in the D/D study shall be revised. In the PMRCIP, two types of runoff analysis model are employed. As shown in Figure 3.1.4, the Storage Function Model is employed for the upstream of Rosario Weir and the Quasi-Linear Model is employed for the lower area. The former is suitable for a river basin consisting of mountainous area like the upper area of the Marikina River while the latter is suitable for an urban area which is highly developed like the Lower Marikina and Pasig river basins. Also, a runoff analysis model around the river mouth of the Pasig River was not established because the land slope around the lower area is flat and there is no natural discharge from interior land. Regarding the lower area, pump drainage of 165m3/s is planned for keeping the safety level of the low interior land.
Adopted
Preparatory Study for Pasig-Marikina River Channel Improvement Project (Phase III)
Final Report - Main ReportChapter 3
3-7
Figure 3.1.4 Sub-Catchment Area in Pasig-Marikina River
To verify the present parameters established in the D/D study, validation calculation at Sto. Niño, the flood control point in PMRCIP, shall be done. In this study, two large floods in the last decade; namely, Tropical Depression Wennie in August 2004 and Typhoon Yoyong in December 2004, were selected due to enough hydrological records for calculation. Regarding Typhoon Ondoy in 2009, the water level equipment was broken during the flood event and proper flood curve based on observed water level was not obtained.
As a result of the trial calculation, it was found that the time of runoff peak occurrence recalculated by the runoff model with existing parameter is different by two hours. Parameter “TL” defining the delay time of runoff from the catchment area was then revised to recreate the actually measured flood, adequately.
Storage Function Model
The Quasi-Linear Model
269.0
96.5
58.8
51.4
13.3
6.9
22.8
10.4
9.8
2.1
8.3
4.4
13.6
12.2 3.7
4.2
11.0
5.9
6.7 Values painted red indicate sub-catchment area (unit: km2)
The Rosario Weir
Final Report - Main Report Chapter 3
Preparatory Study for Pasig-Marikina River Channel Improvement Project (Phase III)
3-8
Figure 3.1.5 Rainfall Distribution in Typhoon Ondoy
The parameters used for the runoff analysis model in this study are as shown in Table A 3.1.3 to Table-A 3.1.8 in ANNEX. Regarding the downstream area calculated with the quasi-linear model, the revised parameters in the D/D study are employed because there is no measured discharge and the reliability of discharges converted by rating curve is low due to the influence of tide in the Manila Bay. As to the diversion at the Rosario Weir, the diversion formula was established by the hydraulic model experiment in 1983.
It was stated in the D/D report of 2002 that the riverbed of the Lower Marikina River, from the junction of Napindan to the Rosario Weir, had risen after the construction of Mangahan Floodway due to the reduction of flood flow into the Pasig River (refer to Figure 3.1.7) and
Fig- Flood Event 24 Aug - 26 Aug 2004
0
500
1,000
1,500
2,000
2,500
3,000
3,500
4,000
4,500
5,000
1900
/1/1
1900
/1/3
1900
/1/5
1900
/1/7
1900
/1/9
1900
/1/1
1
1900
/1/1
3
1900
/1/1
5
1900
/1/1
7
1900
/1/1
9
1900
/1/2
1
1900
/1/2
3
1900
/1/2
5
1900
/1/2
7
1900
/1/2
9
1900
/1/3
1
1900
/2/2
1900
/2/4
1900
/2/6
1900
/2/8
1900
/2/1
0
1900
/2/1
2
1900
/2/1
4
1900
/2/1
6
1900
/2/1
8
1900
/2/2
0
1900
/2/2
2
1900
/2/2
4
1900
/2/2
6
1900
/2/2
8
1900
/3/1
1900
/3/3
1900
/3/5
1900
/3/7
1900
/3/9
1900
/3/1
1
Floo
d R
unof
f (m
3/s
)
0.0
10.0
20.0
30.0
40.0
50.0
60.0
70.0
80.0
90.0
100.0
Ave
rage
rai
nfal
l ove
r w
ater
shed
(m
m/h
r)
Average rainfall (upper St.Nino)
St.Nino (Rating Curve Revised in 2010)
Present Parameters
Revised Parameters
2 hours difference
Fig- Flood Event 29 Nov - 1 Dec 2004
0
500
1,000
1,500
2,000
2,500
3,000
3,500
4,000
4,500
5,000
11/2
9 1:
00
11/2
9 3:
00
11/2
9 5:
00
11/2
9 7:
00
11/2
9 9:
00
11/2
9 11
:00
11/2
9 13
:00
11/2
9 15
:00
11/2
9 17
:00
11/2
9 19
:00
11/2
9 21
:00
11/2
9 23
:00
11/3
0 1:
00
11/3
0 3:
00
11/3
0 5:
00
11/3
0 7:
00
11/3
0 9:
00
11/3
0 11
:00
11/3
0 13
:00
11/3
0 15
:00
11/3
0 17
:00
11/3
0 19
:00
11/3
0 21
:00
11/3
0 23
:00
12/1
1:0
0
12/1
3:0
0
12/1
5:0
0
12/1
7:0
0
12/1
9:0
0
12/1
11:
00
12/1
13:
00
12/1
15:
00
12/1
17:
00
12/1
19:
00
12/1
21:
00
12/1
23:
00
Floo
d R
unof
f (m
3/s
)
0.0
10.0
20.0
30.0
40.0
50.0
60.0
70.0
80.0
90.0
100.0
Ave
rage
rai
nfal
l ove
r w
ater
shed
(m
m/h
r)
Average rainfall (upper St.Nino)
St.Nino (Rating Curve Revised in 2010)
Present Parameters
Revised Parameters
2hours difference
nm QQ
259283.0 nfloodwaynm QQQQ
259717.0 nfloodway QQ
When Qn < 500m3s/
When Qn > 500m3s/
Estimate Equation of Diversion (1983)
Qn : Runoff before diversion Qm : Runoff after diversion
River Condition: Existing 1980’s
Preparatory Study for Pasig-Marikina River Channel Improvement Project (Phase III)
Final Report - Main ReportChapter 3
3-9
there was a high possibility of change of diversion ratio at the weir. Therefore, it is necessary to review the present diversion ratio and simple analysis with the 1-dimensional unsteady flow analysis shall be done.
The result is shown in Figure 3.1.6. According to the result, it was found that the riverbed rising of Lower Marikina River induces the change of diversion ratio and flood discharge into the Manila Bay decreases. As a result of the riverbed rising, the area around the lower river basin becomes safe. In this study, a formula expressing the existing diversion ratio shall be made and volume of distribution to the Mangahan Floodway and the Pasig River shall be estimated newly.
Fig- Diversion at the Rosario Weir
0
100
200
300
400
500
600
700
800
900
1000
1100
1200
0 500 1000 1500 2000 2500 3000 3500
Q n Runoff before Diversion (m3/s)
Qm
Run
off a
fter
Div
ersi
on (m
3/s
)
Estimated by one-dimensional unsteadyflow analysis
Diversion Formula (from the modelexperiment 1983)
Figure 3.1.6 Diversion Ratio at the Rosario Weir (Existing)
Revised Estimate Equation of Diversion (River Condition: Existing 2002)
nm QQ When Qn < 500m3s/
When Qn > 500m3s/ 2641.52592.010805.2 25 nnm QQQ
Estimate Equation (1983)
It is thought that river flow from the Marikina River has been decreasing due to the rising of river bed.
Des
ign
Dis
char
ge 2
,900
m3 /s
980m3/s
1,080m3/s
Final Report - Main Report Chapter 3
Preparatory Study for Pasig-Marikina River Channel Improvement Project (Phase III)
3-10
Fig-
Pas
ig-M
arik
ina
Riv
er,
Lon
gitu
de P
rofi
le
0.00
5.00
10.0
0
15.0
0
20.0
0
25.0
0
30.0
0
35.0
0
0.0
5.0
10.0
15.0
20.0
25.0
30.0
35.0
40.0
45.0
Dis
tanc
e (k
m)
Elevation (m)
DFL
+Fr
eebo
ard
DFL
Low
est r
iver
bed
(198
8)
Low
est r
iver
bed
(Exi
stin
g 19
99)
Low
est r
iver
bed
(Pha
seII
I)
Ave
rage
Riv
erbe
d (E
xist
ing
1999
)
Lef
t Dik
e
Lef
t Dik
e
Pas
ig R
iver
Low
er M
arik
ina
Riv
erU
pper
Mar
ikin
a R
iver
Upp
er U
pper
Mar
ikin
a R
iver
San Juan River inflows
Nangka River inflows
Mangahan Floodwaywith Rosario Weir
Riv
erbe
d Sl
ope
I=1/
46,0
00I=
1/24
,000
I=1/
4,90
0I=
1/2,
800
I=1/
1,40
0I=
1/1,
600
Napindan Channel
St.Nino (Flood Control Point)
Riv
er N
ame
Fig
ure
3.1
.7
Pas
ig-M
arik
ina
Riv
er L
ongi
tud
inal
Pro
file
Preparatory Study for Pasig-Marikina River Channel Improvement Project (Phase III)
Final Report - Main ReportChapter 3
3-11
(6) Review of Design Discharge Distribution
The estimated discharge computed by the runoff analysis models is shown in Figure 3.1.9. The discharge at Sto. Niño Station is estimated as 2,730m3/s, which is a bit smaller than the present design discharge of 2,900m3/s. This is caused by the decrement of the 2-day rainfall intensity as a result of updating the rainfall samples for statistical analysis (refer to Section 3.1(1)). In comparison with probable discharge (refer to Table 3.1.2), the probable discharge created with runoff analysis is almost equal. Therefore, it is concluded that the reviewed design discharge distribution in the D/D study is appropriate.
San
Jua
n R
iver
Pasig River Marikina River
Marikina River
Man
gaha
n Flo
odw
ay
Nap
inda
n C
hann
el
Rosario Weir
St.Nino
Laguna de Bay
Man
ila B
ay
NHCS
Figure 3.1.8 Estimated Discharge Distribution (Existing)
The discharge distribution with completion of MCGS is shown in Figure 3.1.9. At downstream from MCGS, the distribution of discharge evaluated in this project is equal to the existing design discharge distribution. Upstream of the MCGS, it is found that the safety level of the Mangahan Floodway with 2,400 m3/s capacity is evaluated as 40-year return period. After the completion of Phase III project, the Lower Marikina River will ensure a 550m3/s flow capacity. Actually, the Lower Marikina River and the Mangahan Floodway will be able to accept 2,900m3/s flood.
San
Jua
n R
iver
Pasig River Marikina River
Marikina River
Man
gaha
n Flo
odw
ay
Nap
inda
n C
hann
el
Rosario Weir
St.Nino
Laguna de Bay
Man
ila B
ay
NHCS
MCGS
Figure 3.1.9 Estimated Discharge Distribution (with MCGS)
2,730 (2,890)
1,820 (1,810)
910 (1,080)
955 (1,155)
920 (1,100)
0
690 (680)
1,210 (1,430)
95 35
P P
Unit: m3/s
Parenthetic Values are calculated in D/D study in 2002
Probability: 30 year return period
2,730 (2,890)
2,230 (2,390)
500 (500)
575 (585)
530 (530)
0
690 (680)
1,160 (1,190)
95 35
P P
Unit: m3/s Parenthetic Values are calculated in D/D study in 2002
Probability: 30 year return period
Pump Drainage
Pump Drainage
Final Report - Main Report Chapter 3
Preparatory Study for Pasig-Marikina River Channel Improvement Project (Phase III)
3-12
Table 3.1.9 Calculated Discharge Distribution
(1) Existing Condition without MCGS Probable Discharge (m3/s) for Each Return Period Point
No. 2-year 5-year 10-year 20-year 30-year 40-year 50-year100- year
Preparatory Study for Pasig-Marikina River Channel Improvement Project (Phase III)
Final Report - Main ReportChapter 3
3-13
The design discharge distribution reviewed in this study is shown in Figure 3.1.10. Regarding design discharge at upstream of MCGS, since it is possible to accept 2,900m3/s flood, the same values as in the D/D study are employed. The actual safety level of flood upstream of MCGS is 40-year return period.
San
Jua
n R
iver
Pasig River Marikina River
Marikina River
Man
gaha
n Flo
odw
ay
Nap
inda
n C
hann
el
Rosario Weir
St.Nino
Laguna de Bay
Man
ila B
ay
NHCS
MCGS
Figure 3.1.10 Design Distribution of Discharge (with MCGS)
3.1.2 Flow Capacity of River Channel
To understand the existing safety level of flood in Pasig-Marikina River, the flow capacity shall be examined. The flow capacity of the Pasig-Marikina River is shown in Figure 3.1.11. The red line in the diagram indicates the flow capacity at the right bank side while the blue one indicates that of the left bank side. Due to the low height of the dike, the flow capacity is low in all stretches. The black line is the flow capacity evaluated by design flood level (DFL), which indicates the flow capacity on the assumption of completion of dike improvement works. Even if the dike improvement works is done, the capacity is not enough against the design flood level of 30-year return period.
Fig- The Flow Capacity of The Pasig-Marikina River (Existing)
0
200
400
600
800
1,000
1,200
1,400
1,600
1,800
2,000
2,200
2,400
2,600
2,800
3,000
3,200
3,400
3,600
3,800
4,000
0.0
5.0
10.0
15.0
20.0
25.0
30.0
35.0
40.0
45.0
Distance (km)
Flo
w C
apac
ity (
m3/s
)
Discharge Distribution P=1/2Discharge Distribution P=1/5
Discharge Distribution P=1/10Discharge Distribution P=1/20Discharge Distribution P=1/30Right Bank
Left BankDFL
←The Pasig River The Maikina River →
The Mangahan Floodway ↓
↓The San Juan River
0.0
6.6
Probability : 1/10
Probability : 1/30
Probability : 1/20
Probability : 1/2
Probability : 1/5
Calculation Method: One-Dimensional non-uniform flow analysis, Channel Condition: Existing; Roughness Coefficient: 0.028 (all stretches), same as D/D study, Boundary Condition at River mouth: 11.40E.L.m (Mean Spring High Water, MSHW)
Preparatory Study for Pasig-Marikina River Channel Improvement Project (Phase III)
3-14
Regarding the flood safety level at the target reach of the PMRCIP, the Pasig River has only a 2-year return period and the Lower Marikina River has less than 2-year return period which requires early countermeasures. However, it is difficult to carry out the river improvement work of widening the river because of the highdensity residential area along the river. Therefore, it is indispensible to take measures such as dike improvement, dredging and flood control by the MCGS.
The flow capacity after the completion of the Phase III Project is shown in Figure 3.1.13. In Phase III, dike improvement work along the Pasig River has been completed and, as shown in Figure 3.1.15, the elevation of the hinterland along the Lower Marikina River is higher than the existing river dike and the hinterland plays a role in the river dike. Actually, therefore, flood discharge at the design flood level can run though the Lower Marikina River safely. However, the improved river with Phase III will not be able to respond against the design flood level.
On the other hand, the flow capacity after the completion of Phase IV is shown in Figure 3.1.14. Due to the operation of the MCGS, discharge distribution will change significantly and in the Pasig River before the confluence of the San Juan River to the MCGS, the flood flow velocities decrease. As a result, outward appearance of the flow capacity becomes low; however, it satisfies the design flood level of 30-year return period (refer to Figure 3.1.10).
Fig- The Flow Capacity of The Pasig-Marikina River (w/o the Project)
0
100
200
300
400
500
600
700
800
900
1,000
1,100
1,200
1,300
1,400
1,500
1,600
1,700
1,800
1,900
2,000
0.0
5.0
10.0
15.0
20.0
25.0
Distance (km)
Flow
Cap
acity
(m
3/s
)
Discharge Distribution P=1/2
Discharge Distribution P=1/5
Discharge Distribution P=1/10
Discharge Distribution P=1/20
Discharge Distribution P=1/30
Left Dike (existing)
Left Dike (existing)
DFL
←The Pasig River The Marikina River → The Mangahan Floodway ↓
↓The San Juan River
0.0k
m
P robability: 1/10
Probability: 1/2
Probability: 1/5
Probability: 1/30
Probability: 1/20
Figure 3.1.12 Flow Capacity (without PMRCIP)
Preparatory Study for Pasig-Marikina River Channel Improvement Project (Phase III)
Final Report - Main ReportChapter 3
3-15
Fig- The Flow Capacity of The Pasig-Marikina River (Phase III)
0
100
200
300
400
500
600
700
800
900
1,000
1,100
1,200
1,300
1,400
1,500
1,600
1,700
1,800
1,900
2,000
0.0
5.0
10.0
15.0
20.0
25.0
Distance (km)
Flow
Cap
acity
(m
3/s
)
Discharge Distribution P=1/2
Discharge Distribution P=1/5
Discharge Distribution P=1/10
Discharge Distribution P=1/20
Discharge Distribution P=1/30
Phase III (without dredging)
Phase III (with dredging)
←The Pasig River The Marikina River →
The Mangahan Floodway
↓
↓The San Juan River
0.0k
m
6.6k
m
Probability : 1/10
Probability : 1/2
Probability : 1/5
Probability : 1/30
Probability : 1/20
Figure 3.1.13 Flow Capacity (with Phase III)
Fig- The Flow Capacity of The Pasig-Marikina River (Phase IV)
Safe Level 2 year return period 2 year return period under 2 year return
period Phase II
Discharge Distribution 720 m3/s 455 m3/s 450 m3/s Lowest Flow Capacity 1,190 m3/s 805 m3/s 520 m3/s Safe Level 20 year return period 10 year return period 2 year return period Phase III Discharge Distribution 1,170 m3/s 725 m3/s 450 m3/s Lowest Flow Capacity 1,190 m3/s 601 m3/s 534 m3/s Safe Level 30 year return period 30 year return period 30 year return period Phase IV
(MCGS) Design Discharge Distribution
1,160 m3/s 575 m3/s 530 m3/s
The flow capacity of the Mangahan Floodway is shown in Figure 3.1.16. The Mangahan Floodway completed in 1988 is a man-made river channel and it has 2,400 m3/s of flow capacity. However, the existing flow capacity has decreased in comparison with that in 1988 due to the obstruction of river flow by informal settlers in the high water channel and the sediment in the floodway. For keeping the effect of the floodway, it is necessary to relocate the informal settlers and conduct dredging.
Fig- Flow Capacity of The Manghan Floodway
1,000
1,500
2,000
2,500
3,000
3,500
4,000
0.0
0.4
0.8
1.2
1.6
2.0
2.4
2.8
3.2
3.6
4.0
4.4
4.8
5.2
5.6
6.0
6.4
6.8
7.2
7.6
8.0
Flow
Cap
acity
(m
3/s
)
Present Condition considering Informal Settlers
Design River Channel
Design Discharge (Probability 1/30)
STA
.8.2
km
STA
.7.8
km
STA
.7.4
km
STA
.7.0
km
STA
.6.6
km
STA
.6.2
km
STA
.5.8
km
STA
.5.4
km
STA
.5.0
km
STA
.4.6
km
STA
.4.2
km
STA
.3.8
km
STA
.3.4
km
STA
.3.0
km
STA
.2.6
km
STA
.2.2
km
STA
.1.8
km
STA
.1.4
km
STA
.1.0
km
STA
.0.6
km
STA
.0.2
km
Figure 3.1.16 Diagram of Flow Capacity (Mangahan Floodway)
3.1.3 Flood Inundation Analysis
To evaluate the flood damage amount and the influences of climate change, an inundation analysis model shall be built. The outline of the model is as shown in the following diagram.
Calculation Method: One-dimensional non-uniform flow analysis Channel Condition: Existing, considering informal settlers Roughness Coefficient: 0.021 (from 0.0 km to 1.2km), low channel is 0.030 and high channel is 0.30 (from 1.2km to 8.2km) Boundary Condition at river mouth: H-Q curve based on data observed by EFCOS project
To make floodwaters of 2,400m3/s flow into the Laguna de Bay, it is necessary to restore the river cross section into its original condition.
Preparatory Study for Pasig-Marikina River Channel Improvement Project (Phase III)
Final Report - Main ReportChapter 3
3-17
Figure 3.1.17 Outline of Inundation Analysis Model
The calculation conditions are given in Table 3.1.11.
Table 3.1.11 Calculation Conditions of Inundation Analysis
Items Remarks
Calculation Method River Channel: one-dimensional unsteady flow analysis River Basin: two-dimensional unsteady flow analysis
River Condition Existing / Improved (Phase III) Roughness Coefficient (land) 0.050, general value Resolution 100m × 100m Overflow formula Honma Formula
Border Condition Manila Bay: h-t, maximum sea level is 11.40 E.L.m Laguna de Bay: 12.2 E.L.m average water level during historical flood event
Input Design Hydrograph computed by runoff analysis model Typhoon Ondoy (estimated by runoff analysis model)
The estimated inundation area of Typhoon Ondoy is shown in Figure 3.1.18. Based on the results of interview survey on flood damage, main overflow spots are marked as red lines on the following map. The inundation situation calculated by this model fits the testimonies from the interview survey; therefore, it is thought that this model is able to describe the characteristics of inundation in the Pasig-Marikina River Basin.
One-dimensional unsteady flow analysis is employed to calculate runoff and water level.
To check the presence or absence of over flow by comparing calculated water level and river dike.
Water volume of overflow is calculated by Honma-formula.
Inundation depth is computed by two-dimensional analysis model.
Flood plain is described by grid model. Its resolution is 100m mesh.
River Channel
Over flow
Flood Plain
Flood PlainRiver Channel
Dike
River cross section for analysis
Boundary Condition at rive end (ex tide level)
Final Report - Main Report Chapter 3
Preparatory Study for Pasig-Marikina River Channel Improvement Project (Phase III)
3-18
Figure 3.1.18 Inundation Map (Typhoon Ondoy, September 2009)
San
Jua
n R
iver
Pasig River Marikina River (Lower)
Mar
ikin
a R
iver
Nangka River
Man
gaha
n F
lood
way
Nap
inda
n C
hann
el
St.Nino
Rodriguez Bridge
Pasig River
Laguna de Bay
Ma
nila
Bay
Propsed Dam Site
3,500
2,200
1300
Estimated Discharge Typhoon Ondoy (Sep 2009)
500
800
unit:m3/s
Inundation water flows along the Mangahan Floodway forward Laguna Lake
It leaks from right-side of embankment of the Mangahan Floodway
4,500
Figure 3.1.19 Estimated Discharge Distribution in Typhoon Ondoy
In order to evaluate the effect of the Phase III project, inundation analysis shall be done on the assumption that Typhoon Ondoy will attack after the completion of Phase III project. The estimated inundation is shown in Figure 3.1.21. Although the effect of Phase III seems not to appear so much because the overflow water upstream of the Marikina River is large and floodwaters coming into the downstream decreases, the estimated inundation area decreases with the Phase III project.
Estimated inundation area: 86.77km2
: Overflow spot (Interview Survey)
Preparatory Study for Pasig-Marikina River Channel Improvement Project (Phase III)
In addition, to understand the importance of the Mangahan Floodway, the inundation analysis without the floodway shall be done. If the floodway was not constructed, floodwaters flowing into the Pasig River and the Napindan Channel increase and make the lower area of the river hazardous. The inundation area at the lower area becomes large. As the result of this analysis, the high advantage of the Mangahan Floodway has been confirmed.
Figure 3.1.21 Inundation Map (TyphoonOndoy, Without Mangahan Floodway)
3.1.4 Effectiveness of Rosario Weir
The Rosario Weir was constructed in 1988 to divert portions of flood runoff from the Marikina River into the Laguna de Bay. During flood events, gate operation is conducted according to the flood scale and the portion of flood flow into Laguna de Bay to secure the safety of the Lower Marikina-Pasig river basin. Also, when the water level of Laguna de Bay is higher than the Marikina River, the gates will open to decrease the water level of Laguna de Bay for the safety of the area surrounding the outlet of the Mangahan Floodway. Additionally, from the point of view of environmental conservation, the Rosario Weir has the role to separate the Pasig-Marikina River System and the Laguna Lake System, which were originally different water systems.
Estimated Inundation Area: 72.93km2
San
Jua
n R
iver
Pasig River Marikina River (Lower)
Mar
ikin
a R
iver
Nangka River
Man
gaha
n F
lood
way
Nap
inda
n C
hann
el
St.Nino
Rodriguez Bridge
Pasig River
Laguna de Bay
Man
ila B
ay
Propsed Dam Site
3,500
2,100
1300
Estimated Discharge Typhoon Ondoy (Sep 2009)With Phase II and III
500
850
unit:m3/s
Inundation water flows along the Mangahan Floodway forward Laguna Lake
It leaks from right-side of embankment of the Mangahan Floodway
4,500
650 3,400
San
Jua
n R
iver
Pasig River Marikina River (Lower)
Mar
ikin
a R
iver
Nangka River
Man
gaha
n F
lood
way
Nap
inda
n C
hann
el
St.Nino
Rodriguez Bridge
Pasig River
Laguna de Bay
Man
ila B
ay
Propsed Dam Site
3,500
1500
Estimated Discharge Typhoon Ondoy (Sep 2009)without the Mangahan Floodway
500
1000
unit:m3/s
Inundation water flows along the Mangahan Floodway forward Laguna Lake
It leaks from right-side of embankment of the Mangahan Floodway
4,500
0
Estimated inundation area: 113.28km2
Final Report - Main Report Chapter 3
Preparatory Study for Pasig-Marikina River Channel Improvement Project (Phase III)
3-20
Usually, all gates of the Rosario Weir close and lake water is not able to flow into the Marikina River. At present, some parts of the embankment along the West Mangahan area are completed; however, flood inundation caused by the rise of water level of the Laguna de Bay still happens. Until now, no study on the relation of flood characteristics of both the Pasig-Marikina River and the Laguna de Bay has been done. Since the Rosario Weir has the potential to mitigate the flood damage around the Laguna de Bay depending on the gate operation, the operation rule of the Rosario Weir should be revised.
3.1.5 Consideration of Influence by Climate Change
To investigate the fluctuation of rainfall caused by climate change, the influence of climate change shall be examined by using the simulation result of 19 Global Climate Models (GCM) and the Atmospheric Global Climate Model (AGCM).
Table 3.1.12 Available GCM Model Simulation Data
Rainfall Data Availability Model ID 20C3M* Scenario, A1B
cccma_cgcm3_1, Canada 1981-2000 2046-2065, 2081-2100 cccma_cgcm3_1_t63, Canada 1981-2000 2046-2065, 2081-2100 cnrm_cm3, France 1981-2000 2046-2065, 2081-2100 csiro_mk3_0, Australia 1981-2000 2046-2065, 2081-2100 csiro_mk3_5, Australia 1981-2000 2046-2065, 2081-2100 gfdl_cm2_0, USA 1981-2000 2046-2065, 2081-2100 gfdl_cm2_1, USA 1981-2000 2046-2065, 2081-2100 giss_aom, USA 1981-2000 2046-2065, 2081-2100 giss_model_e_r, USA 1981-2000 2046-2065, 2081-2100 iap_fgoals1_0_g, China 1981-2000 2046-2065, 2081-2100 ingv_echam4, Italy 1981-2000 2046-2065, 2081-2100 inmcm3_0, Russia 1981-2000 2046-2065, 2081-2100 ipsl_cm4, France 1981-2000 2046-2065, 2081-2100 miroc3_2_hires, Japan 1981-2000 2046-2065, 2081-2100 miroc3_2_medres, Japan 1981-2000 2046-2065, 2081-2100 mri_cgcm2_3_2a, Japan 1981-2000 2046-2065, 2081-2100 miub_echo_g, Germany/Korea 1981-2000 2046-2065, 2081-2100 mpi_echam5, Germany 1981-2000 2046-2065 ncar_pcm1, USA 1981-1999 2046-2065, 2081-2100
Preparatory Study for Pasig-Marikina River Channel Improvement Project (Phase III)
Final Report - Main ReportChapter 3
3-21
Figure 3.1.22 AGCM Grid
Figure 3.1.23 Procedure of Evaluation of Climate Change
Figure 3.1.24 Rejection Method of GCM Models
As the result of rejection of the GCM, 11 GCMs were employed for the evaluation of climate change. It was estimated that the medium term forecast of rainfall is 0.78 to 1.47 times larger than the result of the historical experiment and the long term forecast is 0.73 to 1.63 times larger than the result of historical experiment.
Fig- Average Monthly Rainfall (GCM Model: csiro_mk3_0)
0.0
100.0
200.0
300.0
400.0
500.0
600.0
700.0
800.0
900.0
1000.0
Janu
ary
Feb
ruar
y
Mar
ch
Apr
il
May
June
July
Aug
ust
Sep
tem
ber
Oct
ober
Nov
embe
r
Dec
embe
r
Rai
nfal
l (m
m)
1981 - 2000
Manila Observed 1971 - 2000 (PAGASA)
Fig- Average Monthly Rainfall (GCM Model: gfdl_cm2_0)
0.0
100.0
200.0
300.0
400.0
500.0
600.0
700.0
800.0
900.0
1000.0
Janu
ary
Feb
ruar
y
Mar
ch
Apr
il
May
June
July
Aug
ust
Sep
tem
ber
Oct
ober
Nov
embe
r
Dec
embe
r
Rai
nfal
l (m
m)
1981 - 2000
Manila Observed 1971 - 2000 (PAGASA)
Rainfall distribution and seasonal pattern fit the observed → High compatible
Seasonal rainfall pattern (dry/wet season) is not described. → Low-compatible
Data Reduction
Statistical Analysis
Data Source: 19GCM and AGCM Sample duration: 2 days maximum
Samples for analysis are as follows: 1) Historical experiment: GCM 1981~2000, AGCM 1980~2004 2) Medium term forecast: GCM 2046~2065, AGCM 2015~2039 3) Long term forecast: GCM 2081~2100, AGCM 2075~2099 Statistical analysis is conducted using the Gumbel Chow Method
Study on fluctuation of rainfall
Based on the result of historical experiment, change ratio between medium/long and historical shall be examined.
Selection of GCM/AGCM model
Comparing the result of historical experiment with observed data (see Figure. 3.1.24), proper GCM/AGCM results shall be selected for evaluation of climate change.
Evaluation To find the possible change of rainfall intensity in the future and decide on how to consider the impact of climate change for the flood control plan, etc.
Final Report - Main Report Chapter 3
Preparatory Study for Pasig-Marikina River Channel Improvement Project (Phase III)
3-22
Figure 3.1.25 Rate of Change of Rainfall Predicted by GCM (Return Period: 30-Yr)
Regarding the result of AGCM, all the results describe the historical experiment adequately and weighted average rainfall using eight forecast data was employed for the statistical analysis. As a result of the study, it is estimated that the medium term forecast increases by 10% and the long-term forecast increases by 32%.
The PMRCIP will have been completed by 2020 and the increment of rainfall intensity caused by climate change should be considered. However, GCM and AGCM have elements of uncertainty because it is difficult to predict the future amount of emission of global greenhouse gas by economic and production activities and also the improvement work is going on, which make it difficult to deal with the increase of flood runoff due to climate change with structural countermeasures. Therefore, nonstructural countermeasures should be applied to deal with the influence of climate change. In this study, the inundation analysis considering the medium term result of the AGCM which is near the target year 2020 shall be conducted and the influence of climate change shall be examined.
Figure 3.1.26 Rate of Change of Rainfall Predicted by AGCM (Return Period: 30-Yr)
Based on the result of the AGCM, it is estimated that rainfall from 2015 to 2039 increases by 10%. If the river channel is under the existing condition, the estimated inundation area considering the influence of climate change is 1.8 times as large as the area without the influence of climate change. If the existing river is improved by the Phase III project, the estimated inundation area considering climate change is 1.6 times as large as the area without the influence of climate change.
Fig - Incremental Ratios for Probabie Rainfall 1/30 2-days rainfall Target Year 2046-2065
Preparatory Study for Pasig-Marikina River Channel Improvement Project (Phase III)
Final Report - Main ReportChapter 3
3-23
Figure 3.1.27 Estimated Inundation Area (River Condition: Existing)
Present Condition
Estimated inundation area: 16.52km2
Estimated inundation area: 28.97km2
Future Condition with Climate Change Impact
Final Report - Main Report Chapter 3
Preparatory Study for Pasig-Marikina River Channel Improvement Project (Phase III)
3-24
Figure 3.1.28 Estimated Inundation Area (River Condition: Improved by Phase III)
Present Condition
Estimated inundation area: 15.27km2
Estimated inundation area: 24.26km2
Future Condition with Climate Change Impact
Preparatory Study for Pasig-Marikina River Channel Improvement Project (Phase III)
Final Report - Main ReportChapter 3
3-25
3.1.6 Necessity of the MCGS
The MCGS is a movable weir planned to be built at Sta. 6+300km in the Lower Marikina River for the control of flood flow. In the master plan of PMRCIP, it is reported that the MCGS is set to divide the design discharge of 2,900m3/s at Sto. Niño to the Laguna de Bay with 2,400m3/s and the Manila Bay, 500m3/s, and with the MCGS the flood safety level will be improved up to 30-year return period. According to Subsection 3.1.3 (5) and Figure 3.1.29 below, the diversion ratio without MCGS depends on the river shape. River shape is to be changed with frequency and diversion condition is changed at the same time. For the stable regulation of diversion, it is necessary to control flood flow by the movable weir.
The main concern on MCGS is the uncertainty of gate operation. If appropriate gate operation is not conducted during flood event, there is the possibility to extend the flood damage upstream of the MCGS. In the case of fixed weir, there is no risk on the extent of damage area. However, fixed weirs have disadvantages such as periodical river maintenance for keeping the planned distribution and mal-adaptation against various flood patterns.
From the point of view of improving the flood safety level, the flood distribution by weir is indispensible. Considering the features of movable and fixed weirs, the specification of the MCGS shall be discussed continuously.
Fig- Diversion at the inlet of the Manghan Floodway
0
500
1000
1500
2000
2500
0 500 1000 1500 2000 2500 3000 3500Q n Runoff before Diversion (m
3/s)
Qfl
ood
wa
y (m
3/s
)
Improved by Phase III
Present Condition
approx 1,750m 3 /s
approx 1,960m 3 /s
Fig- Diversion at the inlet of the Manghan Floodway
0
500
1000
1500
2000
2500
0 500 1000 1500 2000 2500 3000 3500Q n Runoff before Diversion (m
3/s)
Qfl
ood
way
(m
3 /s)
Improved by Phase III ,dradging of the MangahanFloodway and the relocation of inforam settlersPresent Condition
approx 1,960m 3 /s
approx 1,850m 3 /s
Figure 3.1.29 Changes of Diversion triggered by River Shape
Final Report - Main Report Chapter 3
Preparatory Study for Pasig-Marikina River Channel Improvement Project (Phase III)
3-26
3.1.7 Influence caused by Land Development
Since there is no boundary of the river ground of the Pasig-Marikina River, developers who insist on the rights of property inside the river are planning to expand their land development projects into the river. According to the result of interview survey on the development inside the river channel, the following development projects are under consideration. Detailed information is given in Subsection 3.6.1.
Figure 3.1.30 Location of Main Encroachment in the Marikina River
To understand the impact of the above development projects, one-dimensional non-uniform flow analysis shall be done. If the design-flood discharge, 2,900m3/s, flows into the Marikina River, the influences of water level rise are as tabulated in Table 3.1.13. Despite the major and minor influences of the development projects, the development works inside the river channel will cause water level rising and endanger the upstream area from the development sites, which is undesirable for the flood mitigation plan of PMRCIP. Therefore, countermeasures against unregulated development are discussed at the Flood Mitigation Committee (FMC) and development projects inside a river channel should be restrained for keeping the flood control function of the river.
Table 3.1.13 Hydrological Influence of the Development Projects
Development Project Maximum Water Rise
Extent of Influence Remarks
CIRCULO VERDE Project
50.3 cm 11.4km (over 1cm)3.6km (over 10cm)
Largely affected. There is the high possibility to endanger the upstream area and to change the distributed flow into the Mangahan Floodway.
Eastwood 11.1 cm 6.8km (over 1cm)2.05km (over 5cm)
Affected
SM Mall 1.0 cm 200m (over 1cm) Lightly affected STP (Sewage facility)
9.5 cm 6.58km (over 1cm) Affected
Cement Factory 2.5 cm 2.5km (over 1cm) Lightly affected
(1) CIRCULO VERDE Project Location: Right side, 6.20 – 7.10km
(2) Structure in front of Eastwood Location: Right side, 8.30 – 8.35km
(3) SM Mall Location: Left side, 10.10 – 10.20km
(4) STP (sewage facility) Location: Right side, 9.45 – 9.60km