Page 1
The Price Elasticity of U.S. Shale
Oil Reserves
James L. Smith and Thomas K. Lee July 2017
Independent Statistics & Analysis
www.eia.gov
U.S. Energy Information Administration
Washington, DC 20585
This paper is released to encourage discussion and critical comment. The analysis and conclusions expressed here
are those of the authors and not necessarily those of the U.S. Energy Information Administration.
WORKING PAPER SERIES
Page 2
Smith and Lee | U.S. Energy Information Administration | This paper is released to encourage discussion and critical comment. The analysis and conclusions expressed here are those of the authors and not necessarily those of the U.S. Energy Information Administration.
Abstract
We formulated a model of shale oil development that identifies how much of the U.S. resource base is likely to be economically viable at various price levels, and what share of potential drilling sites are likely to be exploited. The analysis is driven by the lognormal variability in productivity of individual wells. We find the volume of reserves to be highly inelastic with respect to price. The overall elasticity of U.S. shale oil reserves appears to lie between 0.3 and 0.5. The elasticity of supply of economically viable drilling sites appears to be roughly double the elasticity of reserves, but still inelastic. A key finding is that the volume of reserves is not proportional to the number of viable drilling sites. In a skewed distribution, relatively few of the highest productivity
drilling sites account for the large majority of reserves. The majority of drilling sites have relatively low productivity, and contribute a relatively small portion to the aggregate volume of reserves. When those low productivity sites are cast out due to falling prices, the volume of remaining reserves is little affected. However, variations in the rate of drilling and production are driven by many factors, including price expectations, availability of infrastructure, financing, lease provisions, resource depletion, etc. To forecast the near-term production rate of shale oil, one must incorporate all these factors, how they are changing, and how those changes are expected to impact drilling activity. That is a challenging research problem in itself, and one that must be left to future research.
Keywords: shale oil, price elasticity, drilling productivity, lognormal distribution
JEL Codes: L71, Q31, Q33, Q35, Q41
Acknowledgements: The views in this paper are solely the responsibility of the authors and should not be interpreted as reflecting the views of the U.S. Energy Information Administration. The authors thank Robert Cairns, Timothy Fitzgerald, James Griffin, Hill Huntington, Svetlana Ikonnikova, Petter Osmundsen, and Ron Ripple for comments on a previous draft. They also wish to thank Guanhuan Wang and Xin Zheng for their very capable research assistance.
Corresponding author: James L. Smith, the Department of Finance, Cox School of
Business, Southern Methodist University, Dallas, Texas 75275, USA. Email: [email protected]
Thomas K. Lee, U.S. Energy Information Administration, 1000 Independence Ave., SW, Washington, DC 20585, USA. Email: [email protected]
Page 3
ii Smith and Lee | U.S. Energy Information Administration | This paper is released to encourage discussion and critical comment. The analysis and conclusions expressed here are those of the authors and not necessarily those of the U.S. Energy Information Administration.
Table of Contents
Abstract ............................................................................................................................................. i
1. Introduction .................................................................................................................................. 1
2. Overview ....................................................................................................................................... 2
2.1 Research Objectives ............................................................................................................. 2
2.2 Summary of Findings ............................................................................................................ 3
2.3 Overview of Methodology .................................................................................................... 7
2.4 Data Sources and Validation ................................................................................................ 8
3. Research Methodology ................................................................................................................ 9
3.1 The Individual Well Economic Model ................................................................................... 9
Model Structure .................................................................................................................... 9
Prices ................................................................................................................................... 10
Costs ................................................................................................................................... 10
Income Tax .......................................................................................................................... 11
Production .......................................................................................................................... 11
Application of the Individual Well Model ........................................................................... 11
3.2 The Distribution of Well Productivity (EUR) ....................................................................... 12
3.3 Combining the Two Models ............................................................................................... 14
4. Data Sources and Validation ...................................................................................................... 16
5. Research Results ........................................................................................................................ 20
5.1 The Volume of Shale Oil Reserves ...................................................................................... 20
5.2 The Number of Viable Drill Sites ......................................................................................... 23
5.3 The Distinction Between Average and Median Productivity ............................................. 26
5.4 Combo Plays are Different ................................................................................................. 28
5.5 Resilience of Drilled but not Completed Wells (DUCs) ...................................................... 31
5.6 The Impact of Low Prices on Mature Shale Oil Wells......................................................... 34
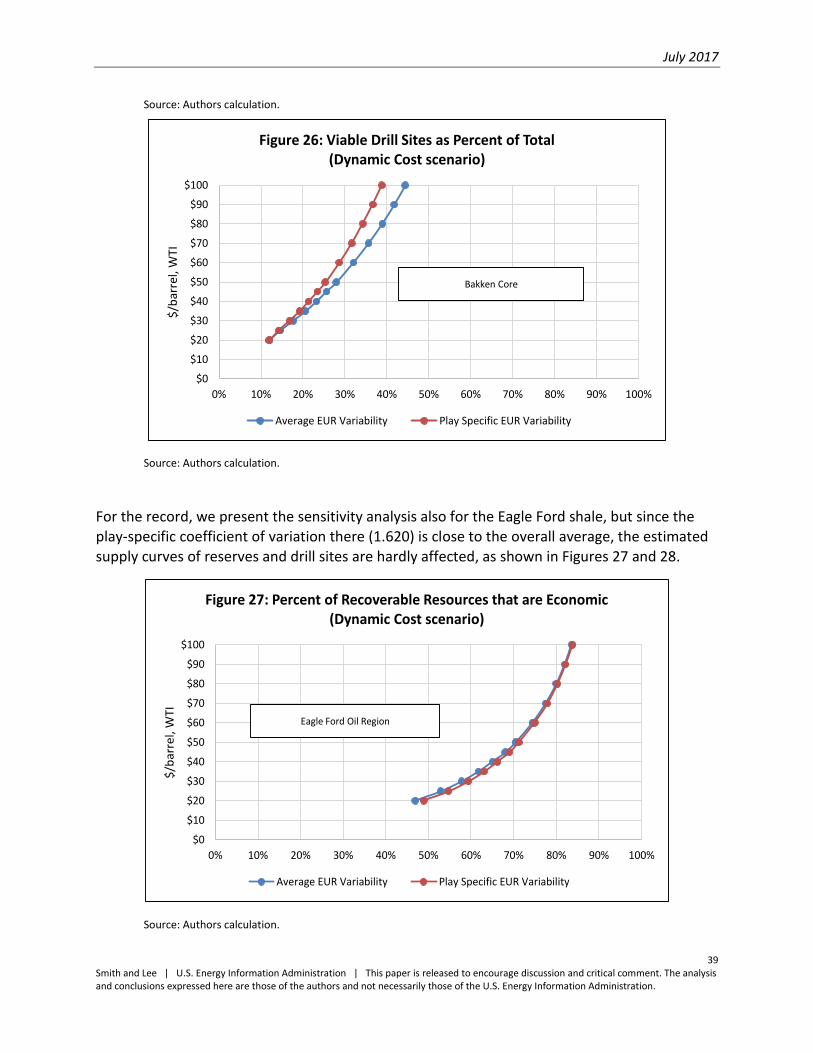
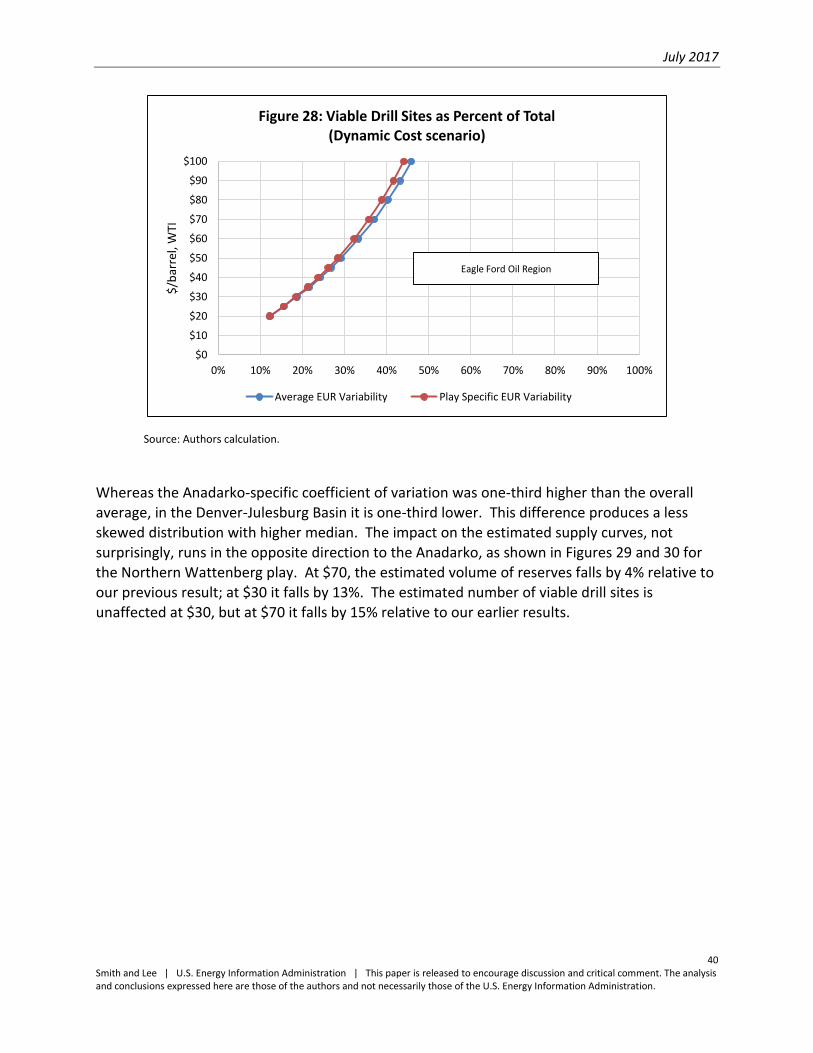
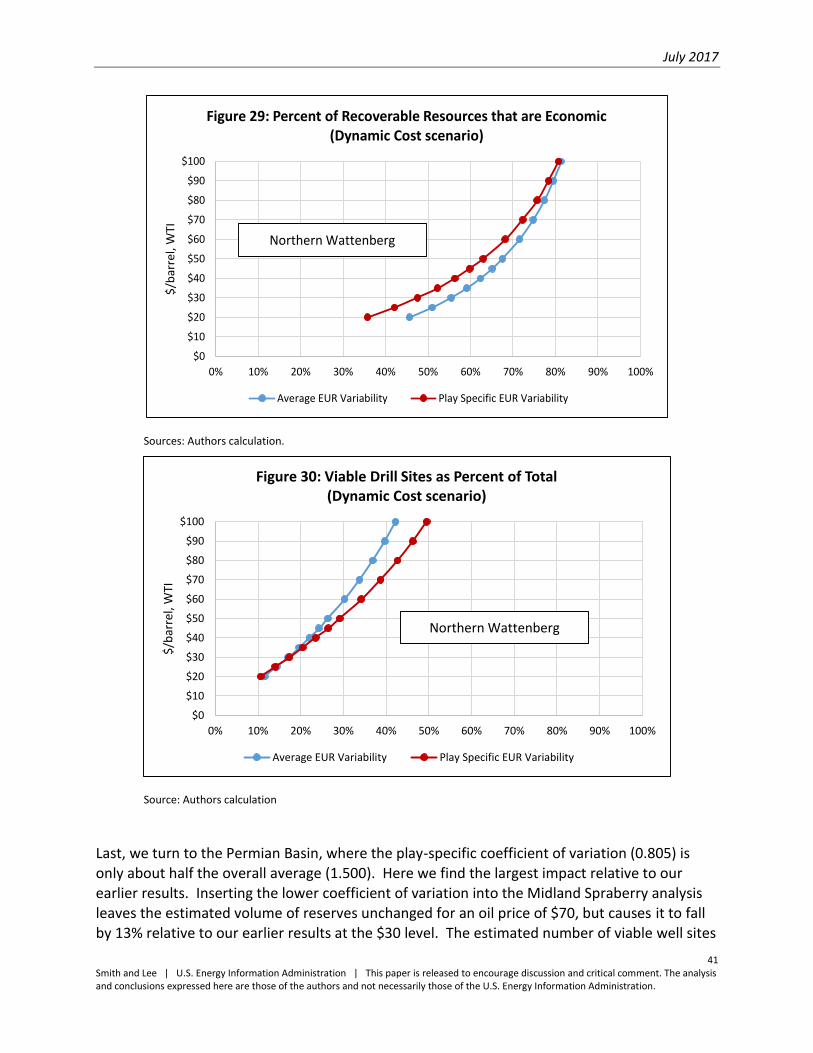
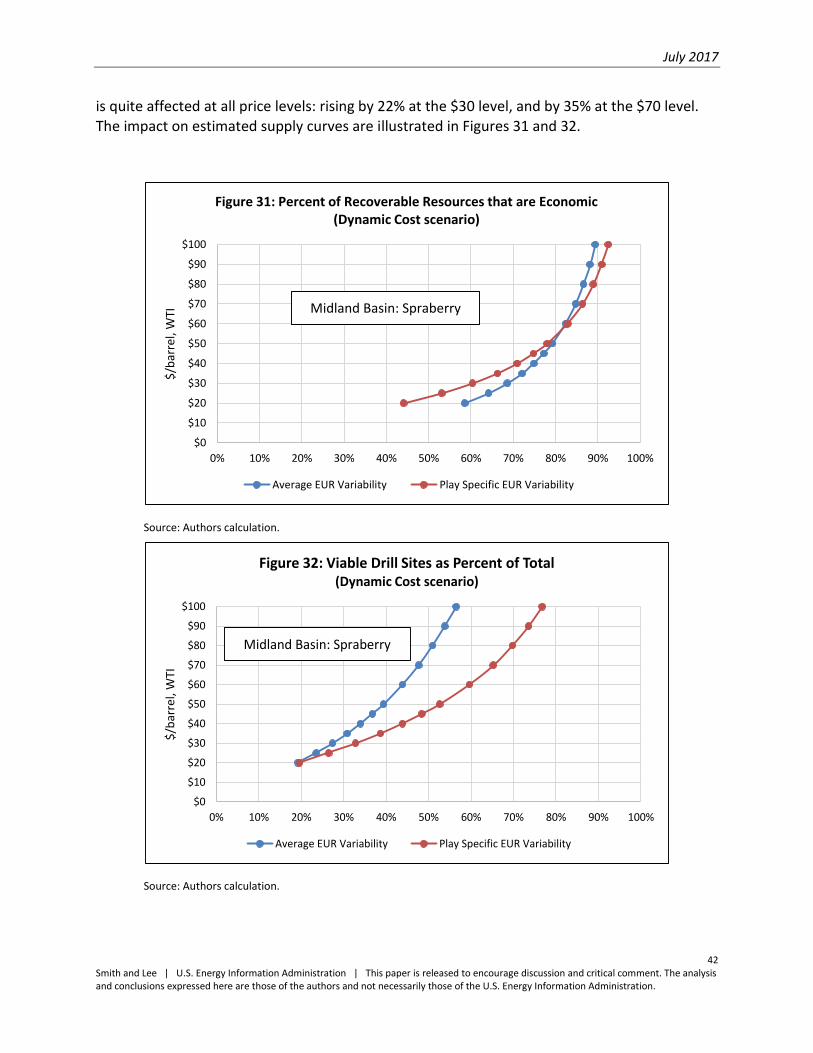
5.7 Sensitivity of Results to the Coefficient of Variation in Well Productivity ......................... 35
6. Limitations of the Study and Suggestions for Further Research ............................................... 43
References ...................................................................................................................................... 45
Page 4
iii Smith and Lee | U.S. Energy Information Administration | This paper is released to encourage discussion and critical comment. The analysis and conclusions expressed here are those of the authors and not necessarily those of the U.S. Energy Information Administration.
Appendices (separate attachments)
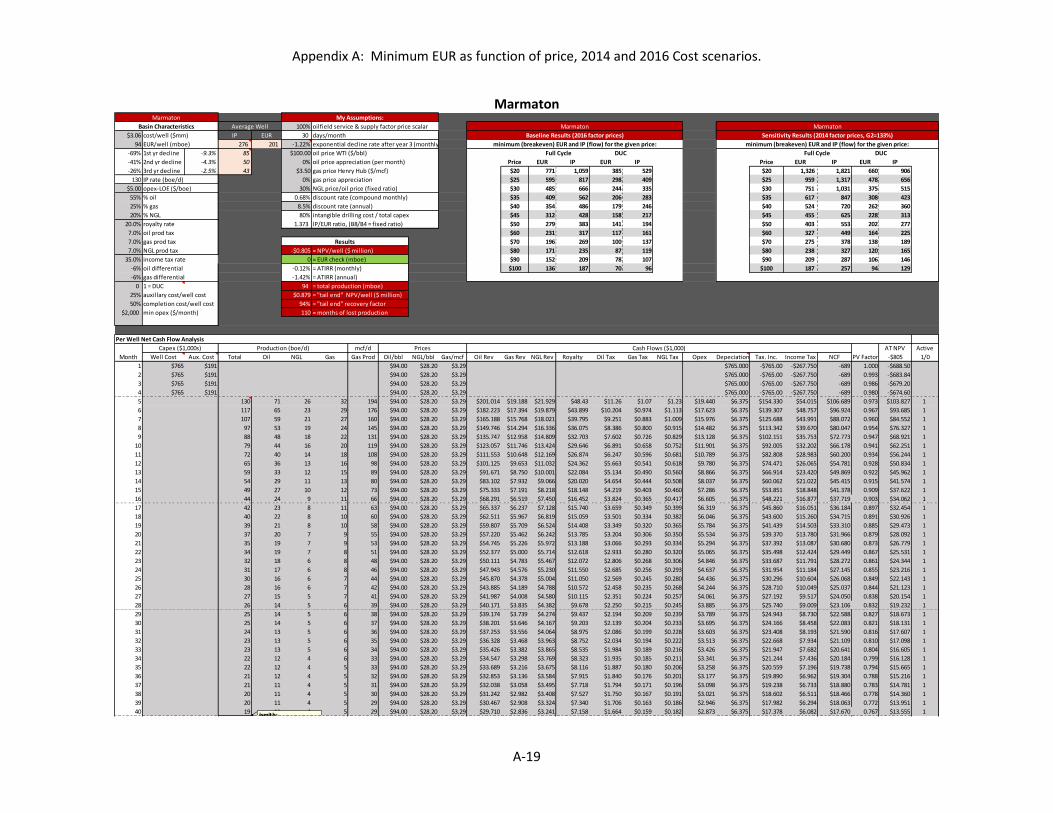
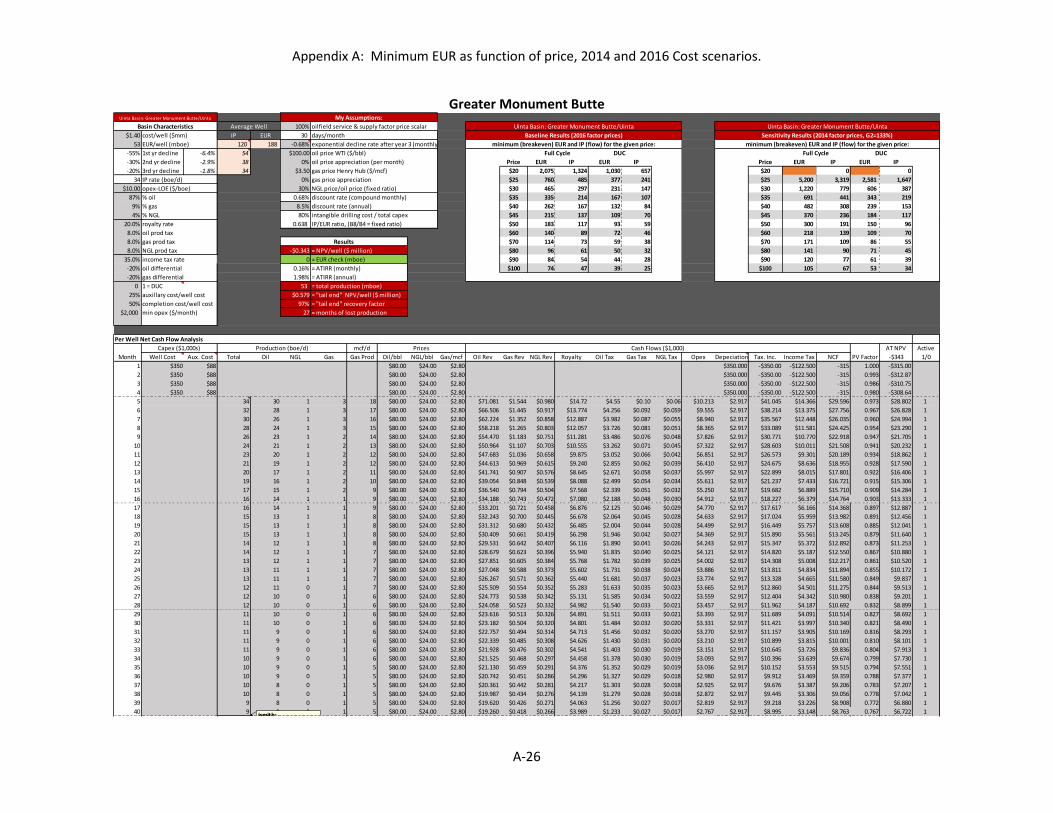
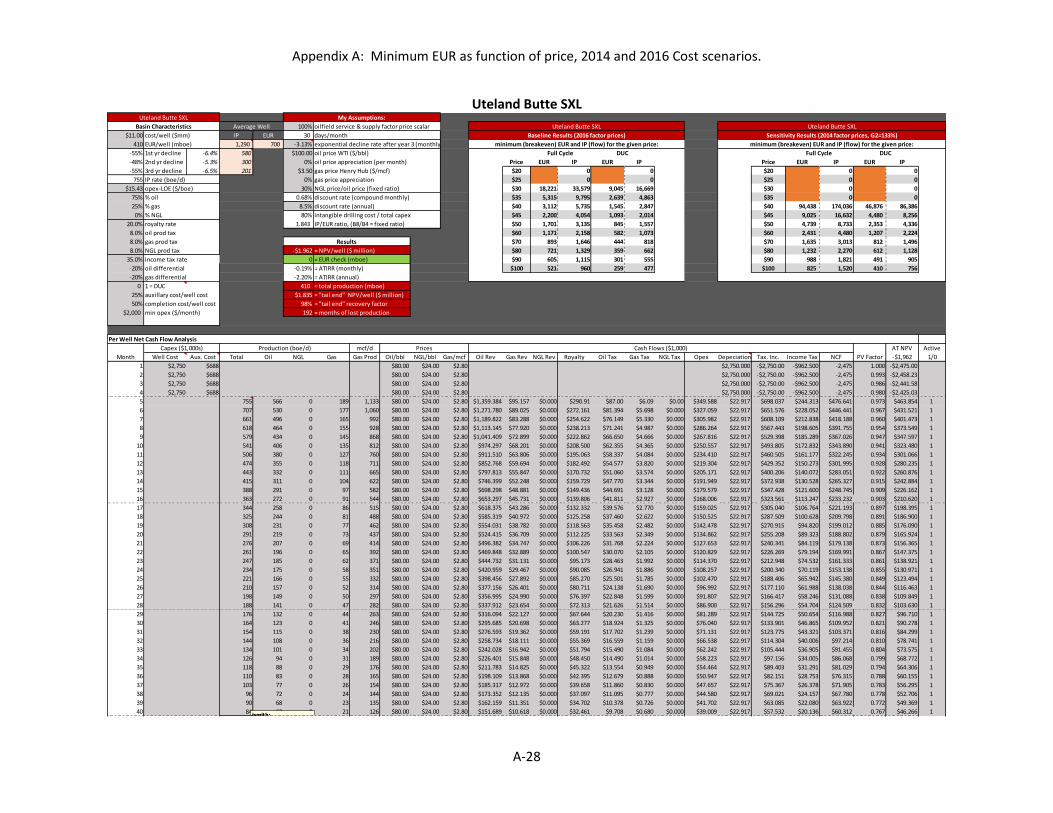
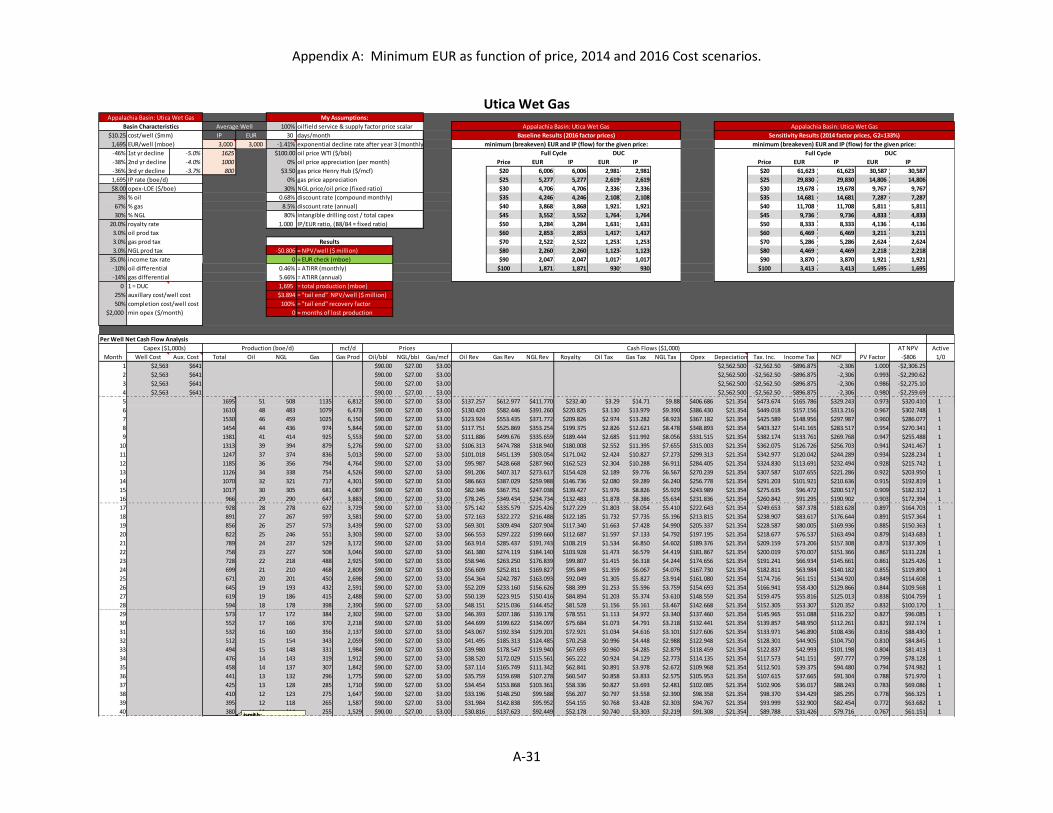
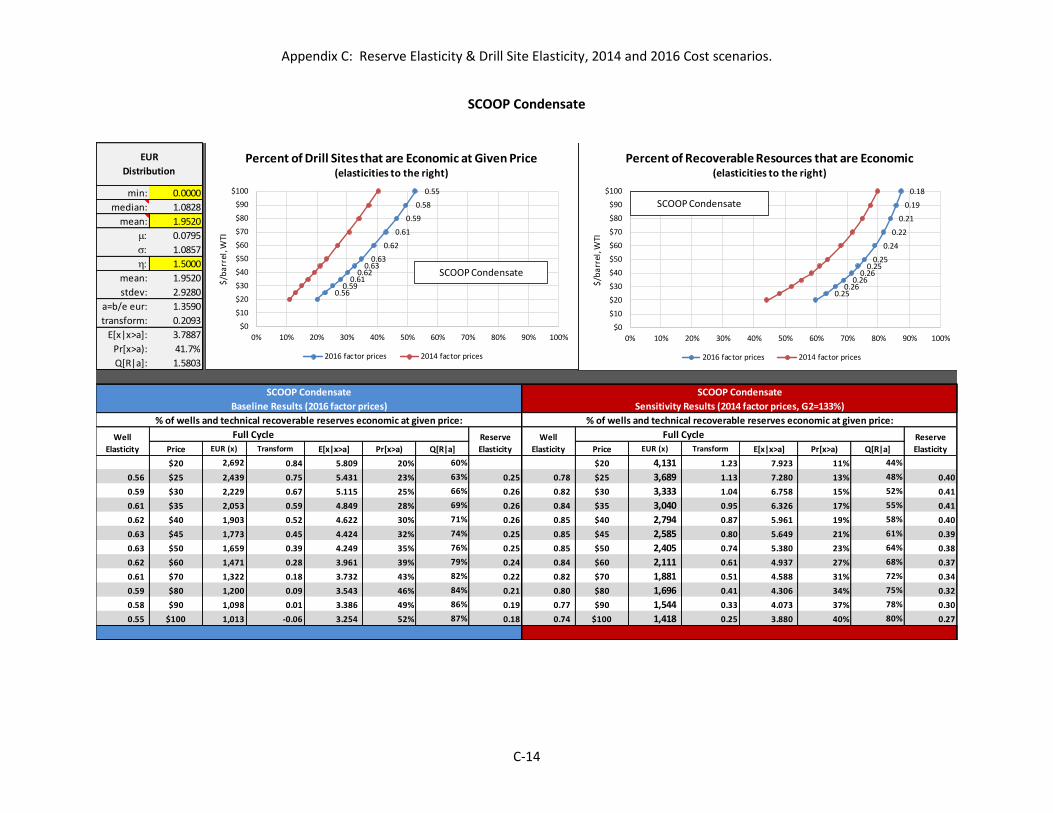
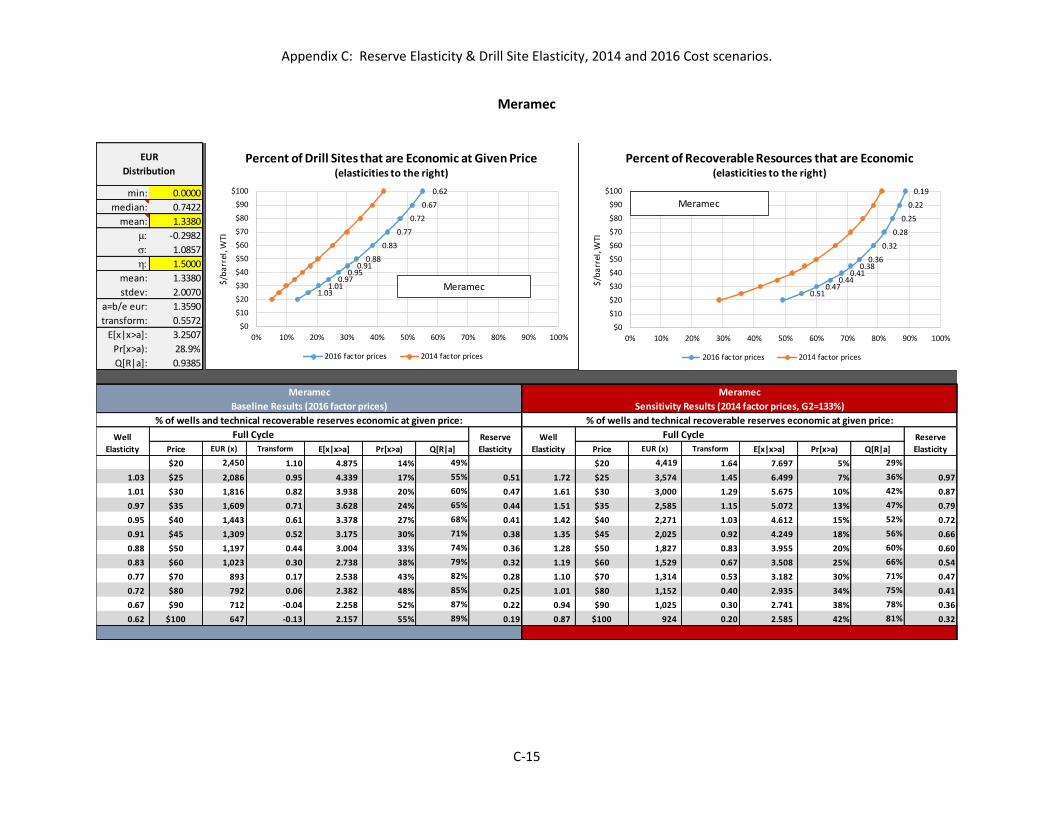
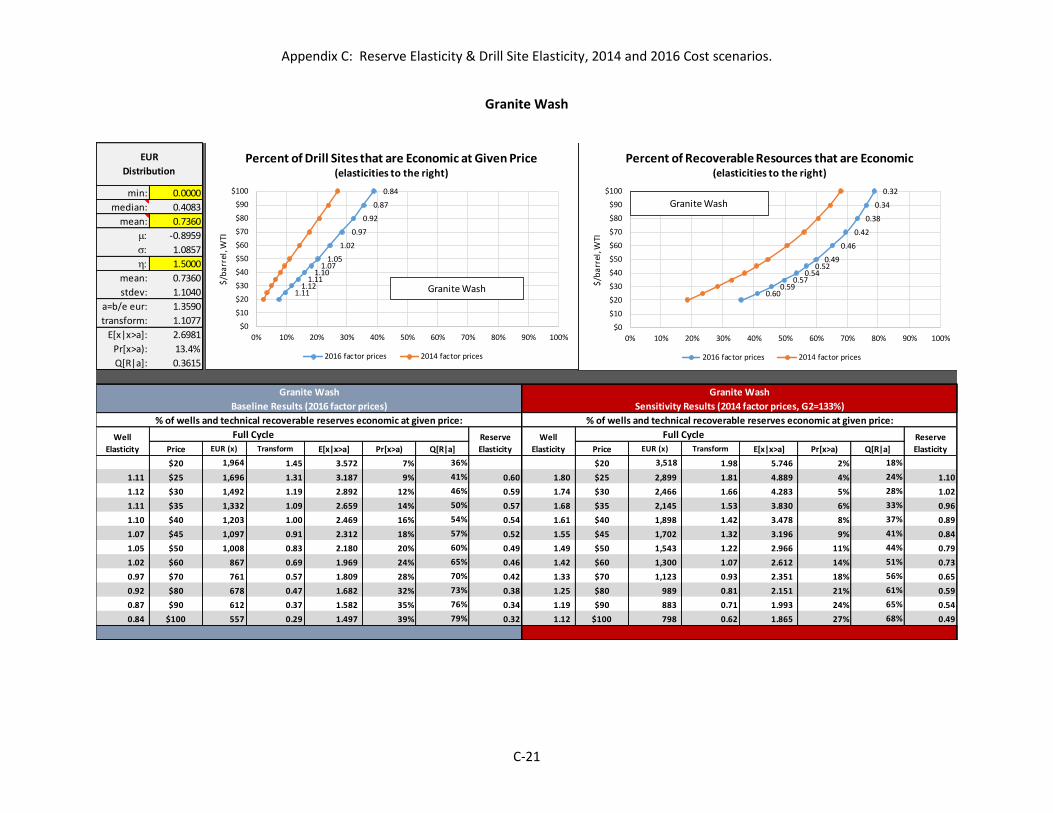
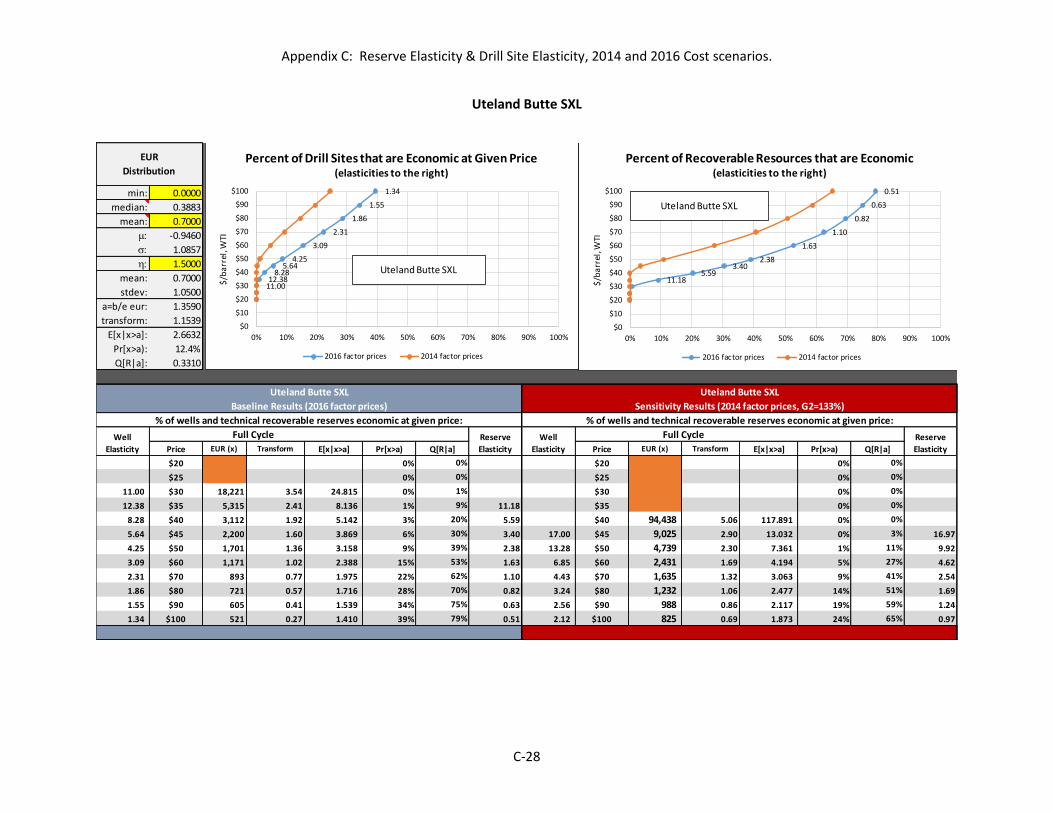
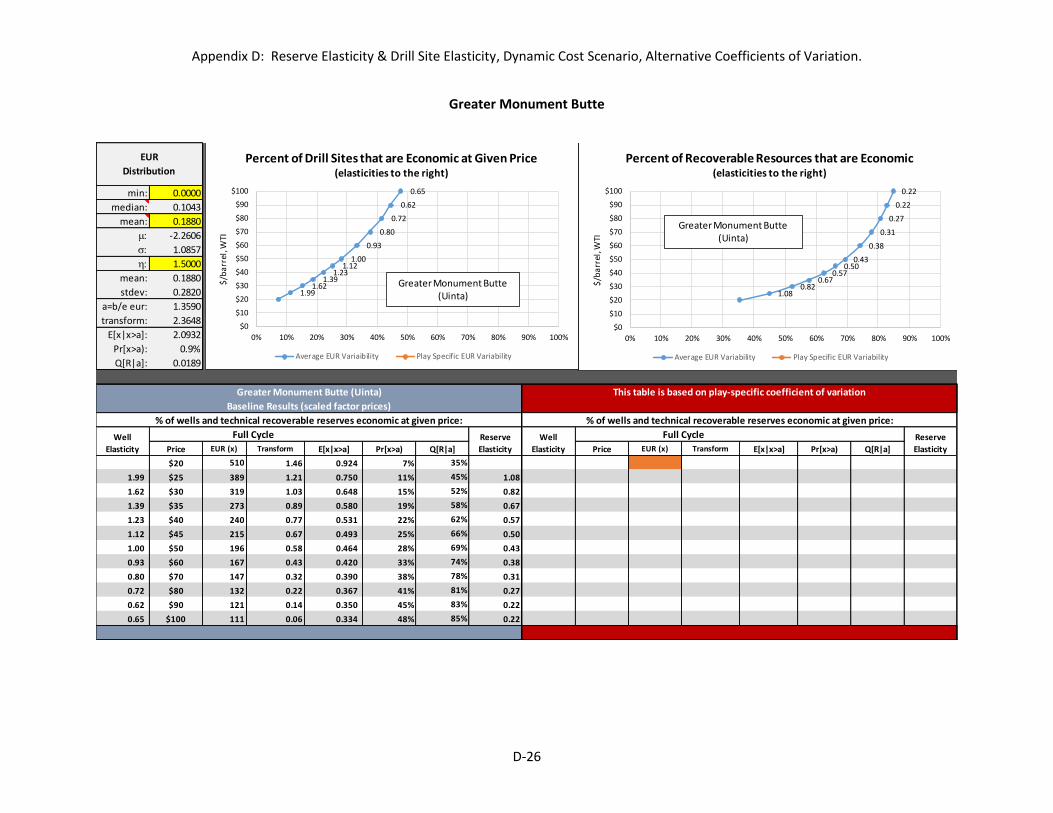
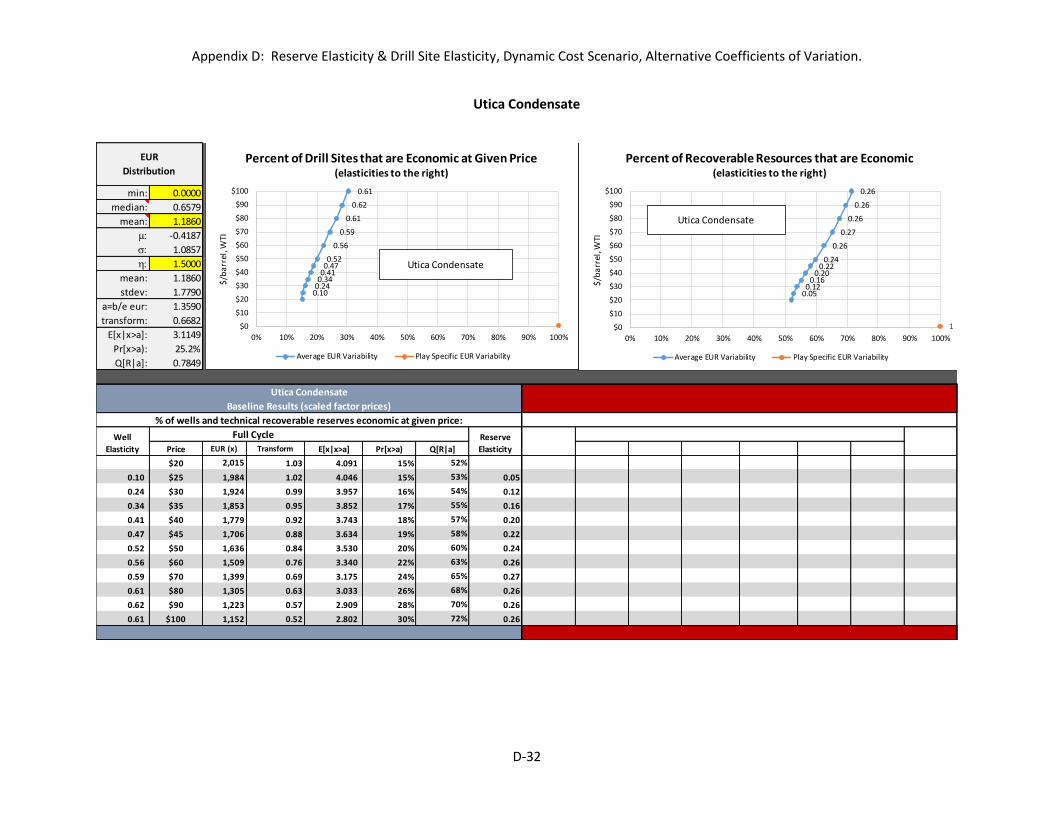
A. Minimum EUR as Function of Price, 2014 & 2016 Cost Scenarios
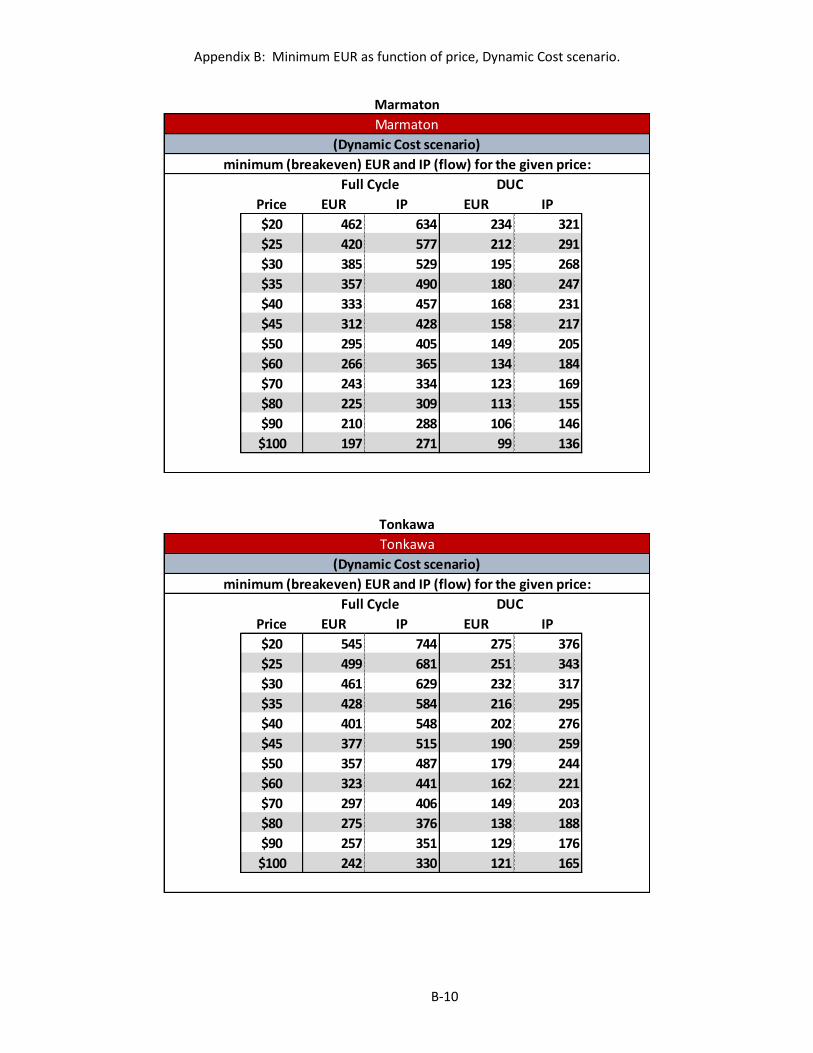
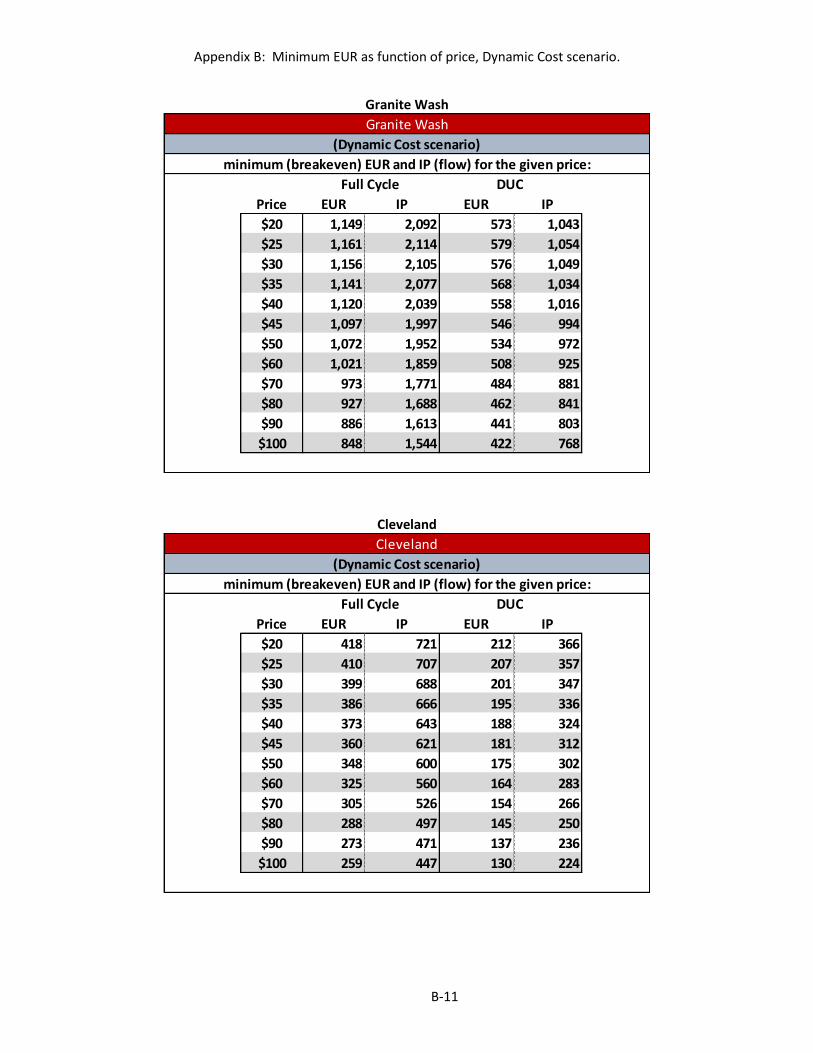
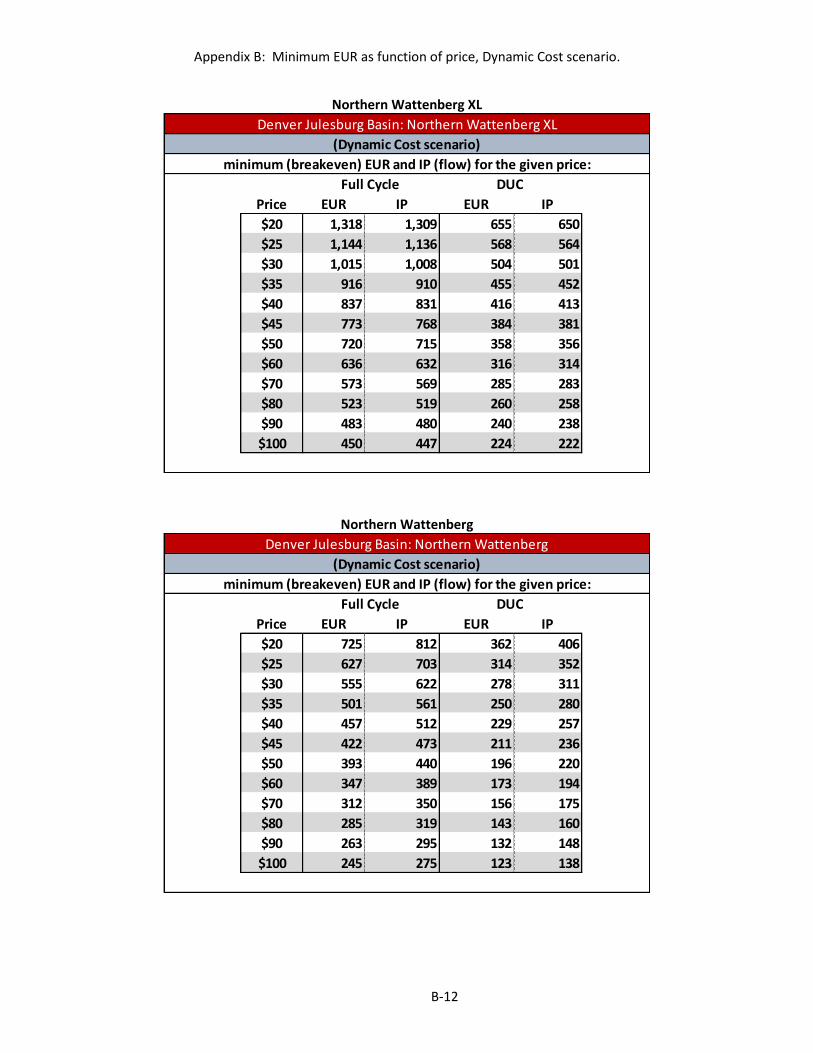
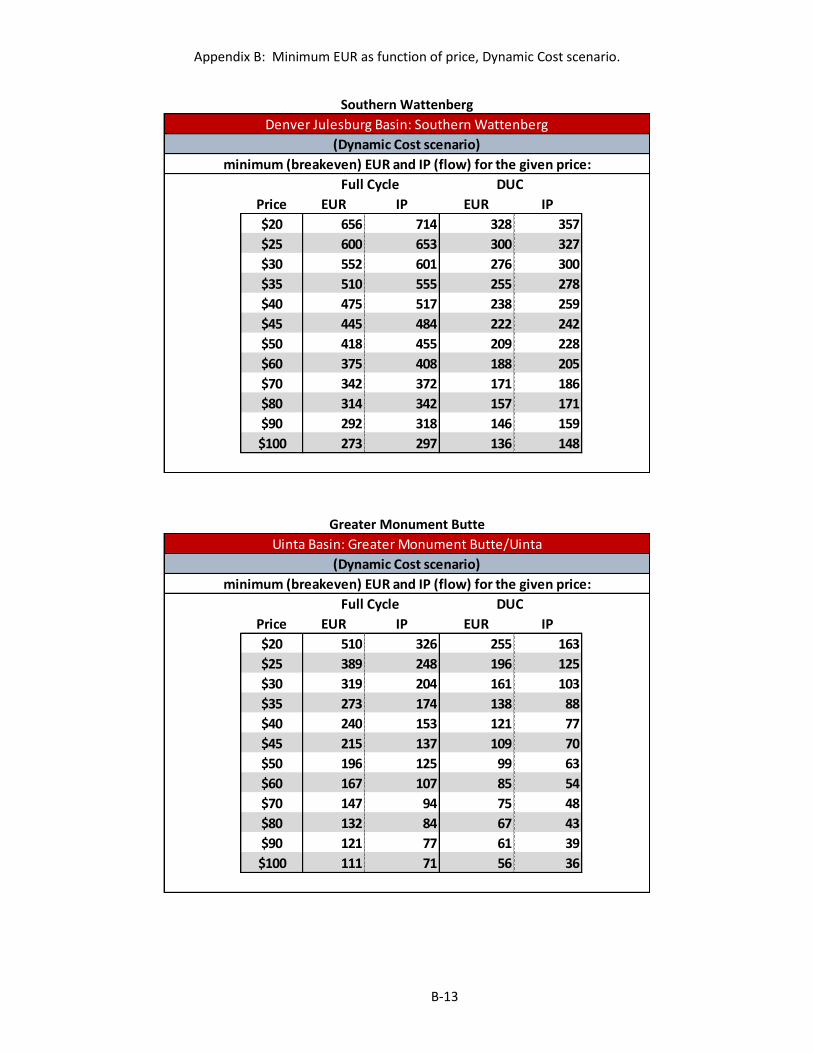
B. Minimum EUR as Function of Price, Dynamic Cost Scenario
C. Reserve Elasticity & Drill Site Elasticity, 2014 & 2016 Cost Scenarios
D. Reserve Elasticity & Drill Site Elasticity, Dynamic Cost Scenario, with Alternative Coefficients of Variation
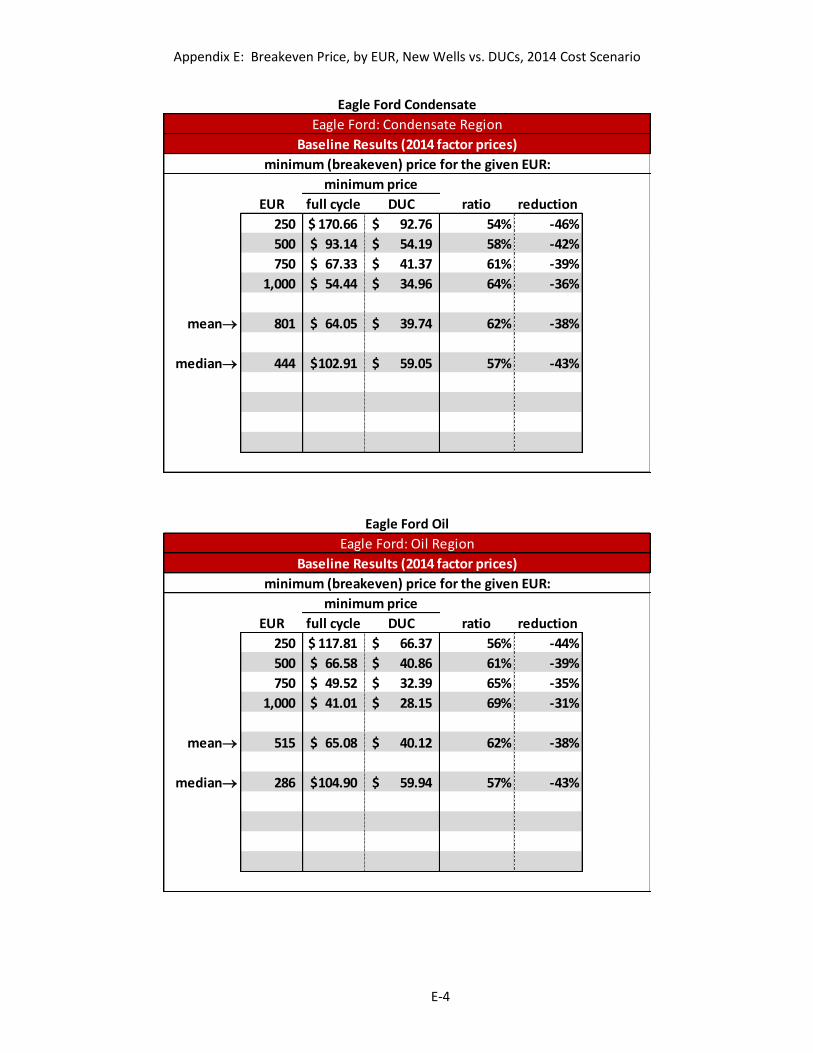
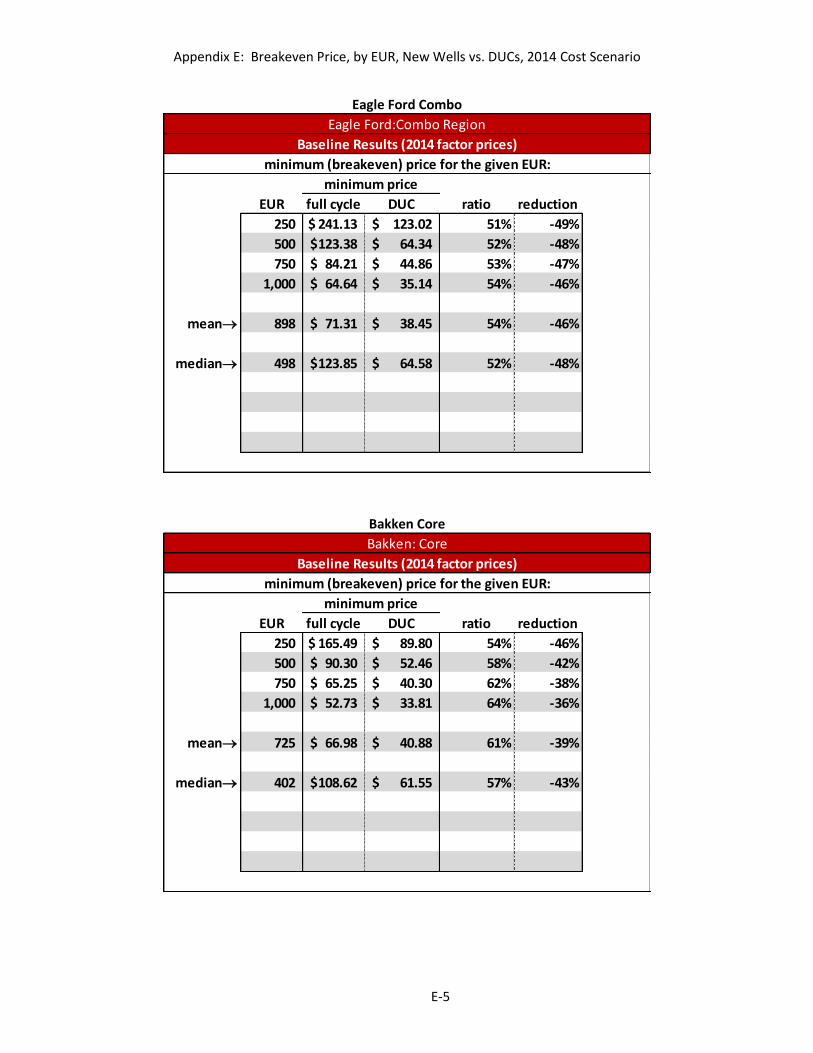
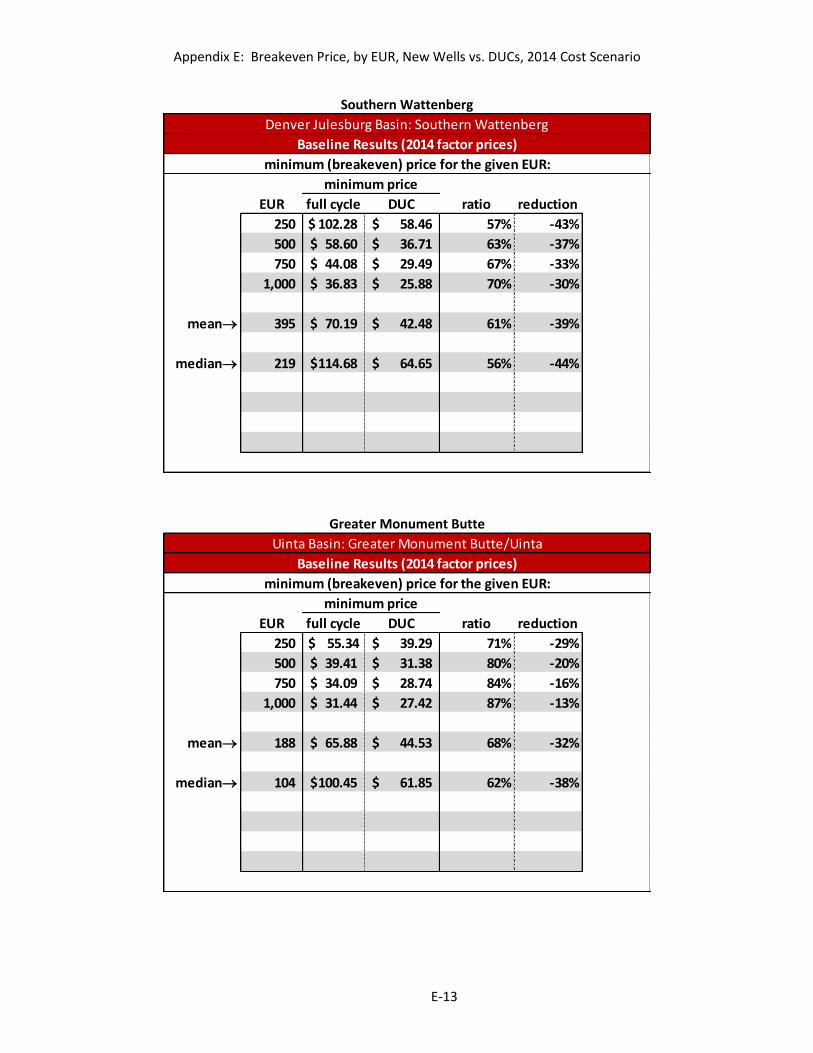
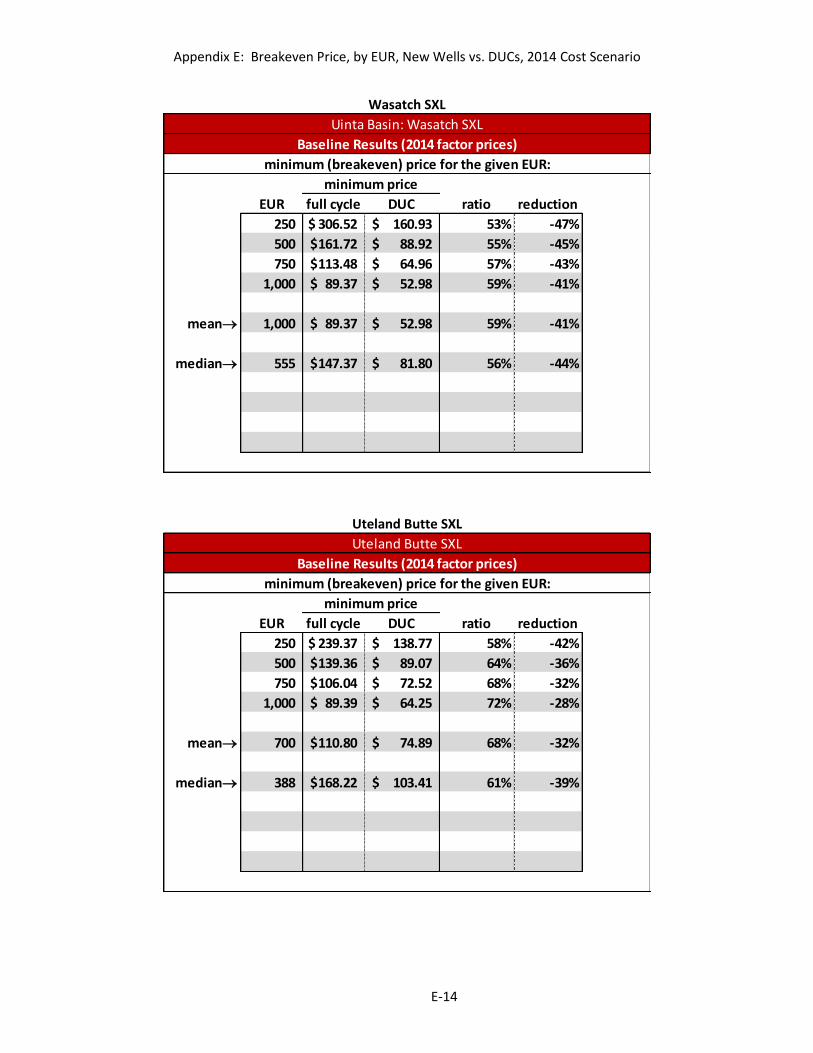
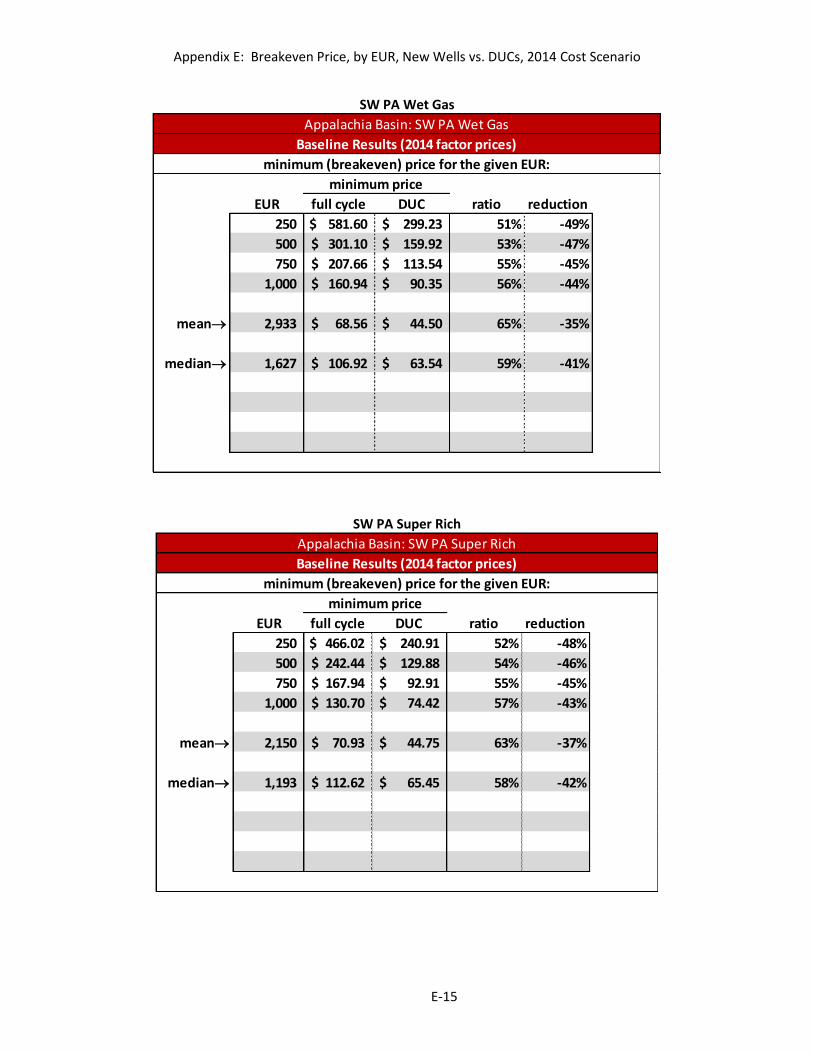
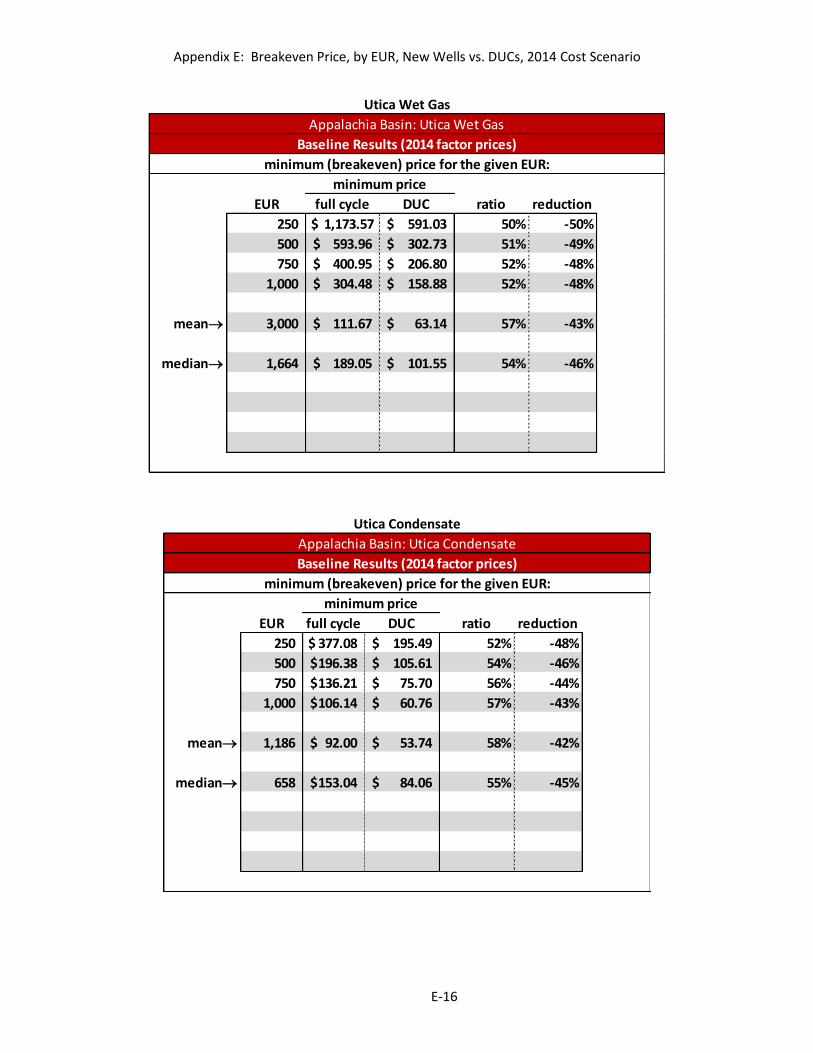
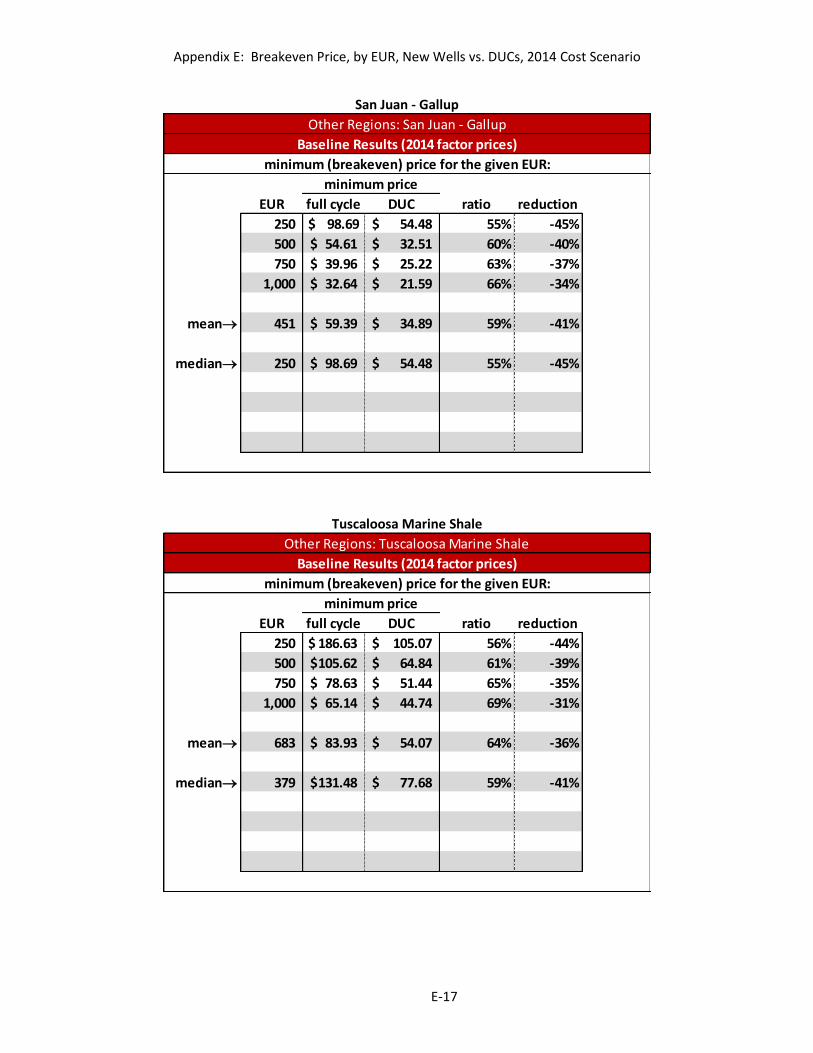
E. Breakeven Price, by EUR, New Wells vs. DUCs, 2014 Cost Scenario
F. Tail-End Economics, 2016 Cost Scenario
G. Notes on the Lognormal Distribution
Page 5
July 2017
1 Smith and Lee | U.S. Energy Information Administration | This paper is released to encourage discussion and critical comment. The analysis and conclusions expressed here are those of the authors and not necessarily those of the U.S. Energy Information Administration.
1. Introduction
The motivation for this analysis is to better understand the impact of changing price levels on the volume of U.S. shale oil reserves. During the course of research, an analytical approach was developed that focuses on the heterogeneity of shale oil resources, both across various shale oil basins and within those basins. It is this heterogeneity that permits certain portions of the shale oil industry to survive under low prices while others do not. This study describes the analytical approach and also the empirical results obtained when real-world data are joined to this framework.
The study is organized as follows. Section 2 provides an overview of the study’s objectives,
research methods, and principal findings. The methodology is described in detail in Section 3. Data sources and methods of validation are outlined in Section 4. Detailed findings regarding the research questions are reported in Section 5. Limitations of the present study and
suggestions for future research are outlined in Section 6. Charts and tables that document all inputs to the research as well as a comprehensive tabulation of all empirical results are attached as appendices.
Page 6
July 2017
2 Smith and Lee | U.S. Energy Information Administration | This paper is released to encourage discussion and critical comment. The analysis and conclusions expressed here are those of the authors and not necessarily those of the U.S. Energy Information Administration.
2. Overview
2.1 Research Objectives
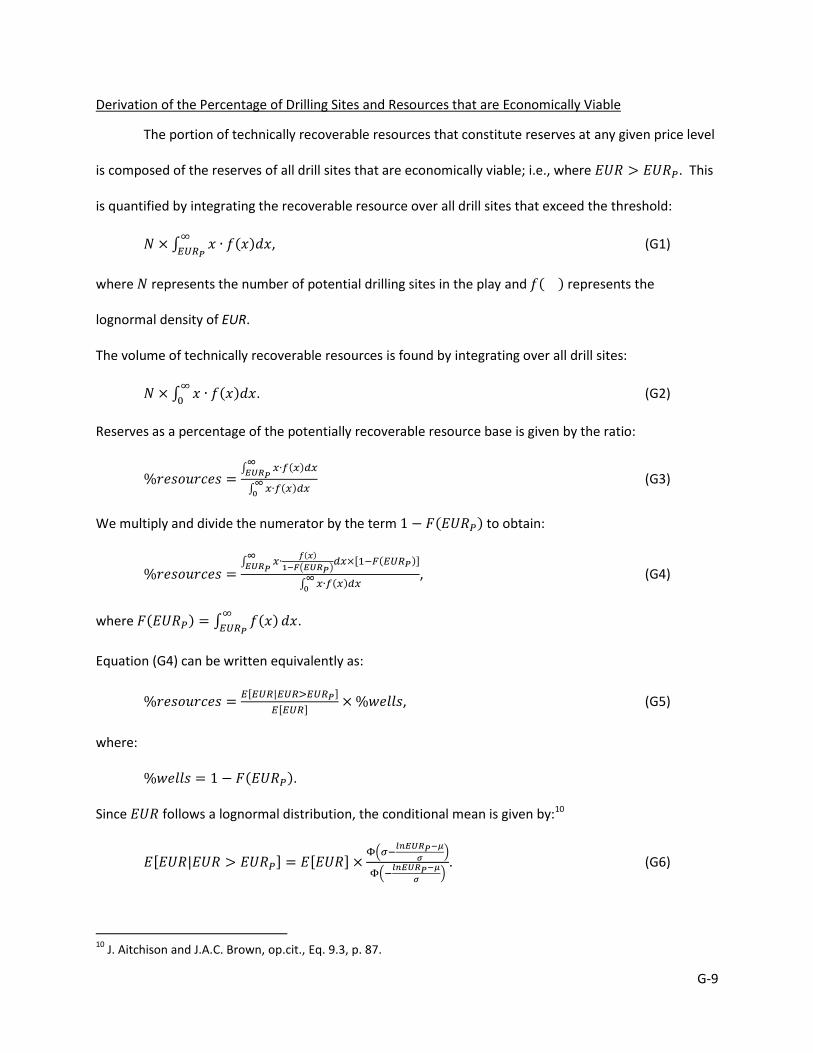
The study attempts to measure how the economic viability of U.S. shale oil supply varies with the price of oil. It is well understood that the volume of economically recoverable shale oil reserves is but a subset of the volume of technically recoverable resources. Our objective is to measure how the size of that subset varies with the price of oil. Reserves represent the potential production only from those wells that are economic to develop and operate. Within any particular shale oil play, the number of such wells is directly influenced by the assumed
price level. Cost and well productivity also play an important role in delineating the volume of reserves, and those factors will be addressed too, but the main focus of the study is to measure how the number of viable shale oil drilling locations and the volume of potential production (reserves) varies with the price of oil.
The relationship can be quantified in terms of an elasticity. We define the “price elasticity of reserves” in the conventional way; it represents the percentage increase in the volume of reserves that results from a 1% increase in the price of oil, holding costs and technology constant. A similar definition applies to the number of viable drill sites (which determines the number of wells that could be drilled): the “price elasticity of drill sites” represents the percentage increase in the number of economically viable drilling locations that results from 1% increase in the price of oil. Most of the analysis undertaken in this study is for the purpose of
estimating these two elasticities for each of the major shale oil plays in the U.S.
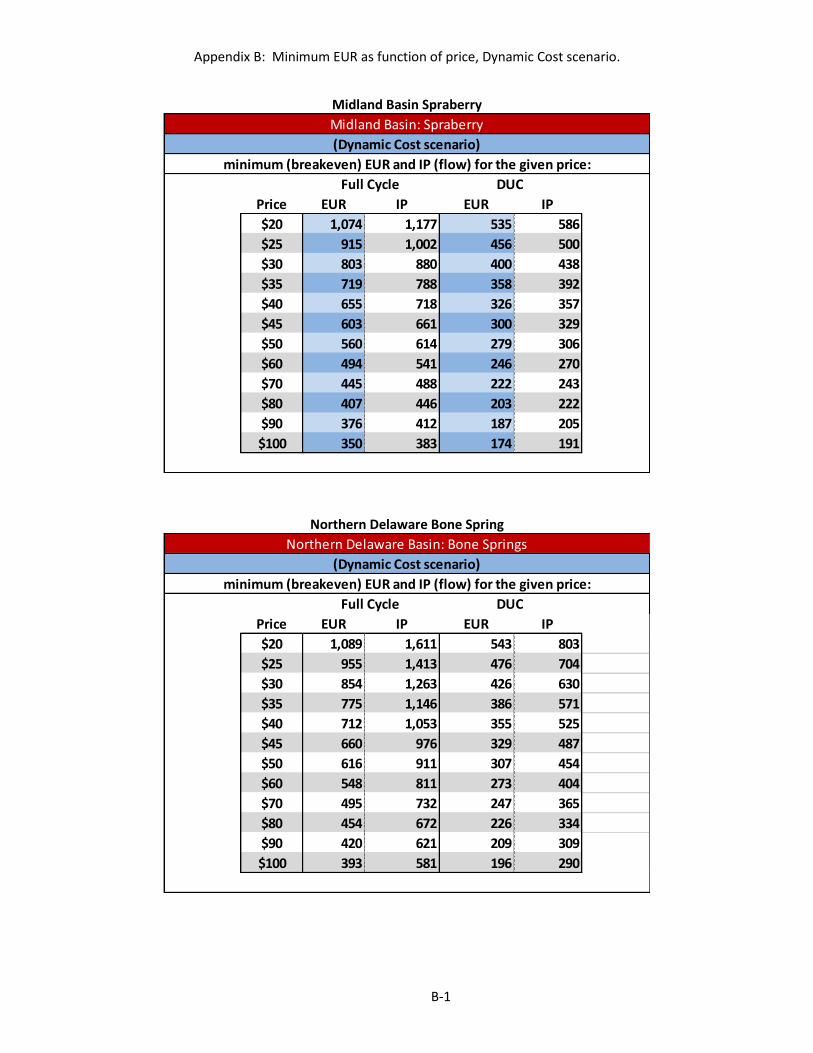
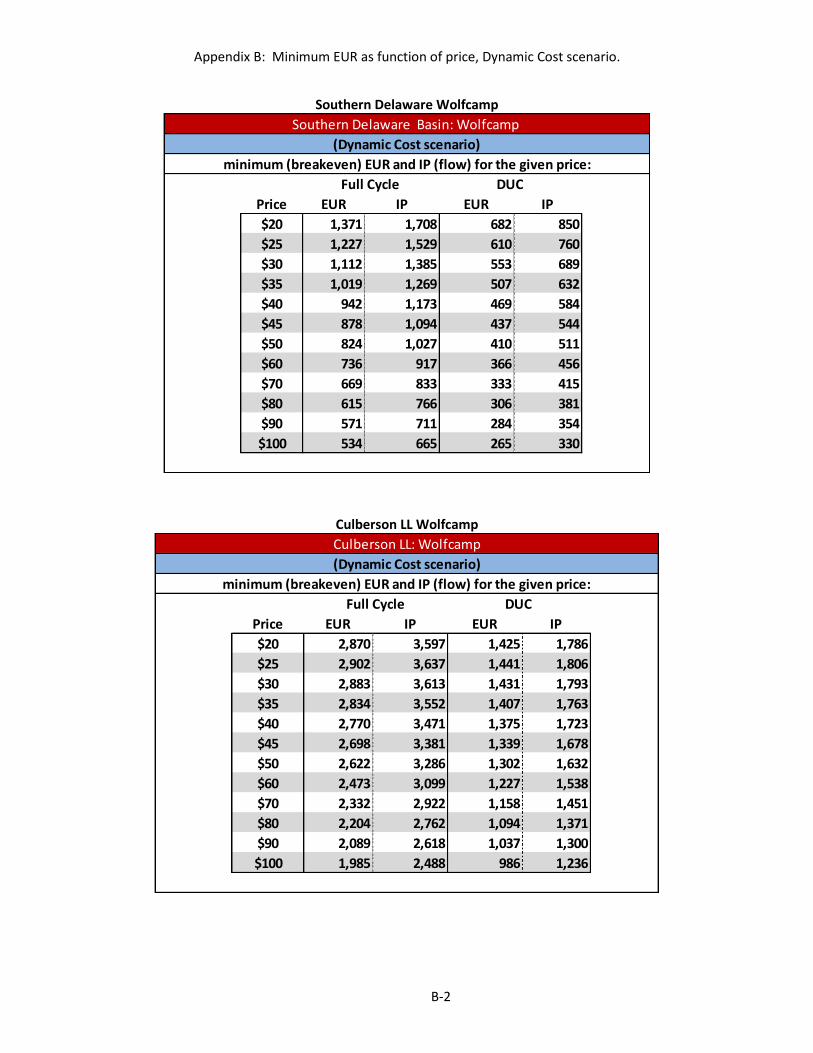
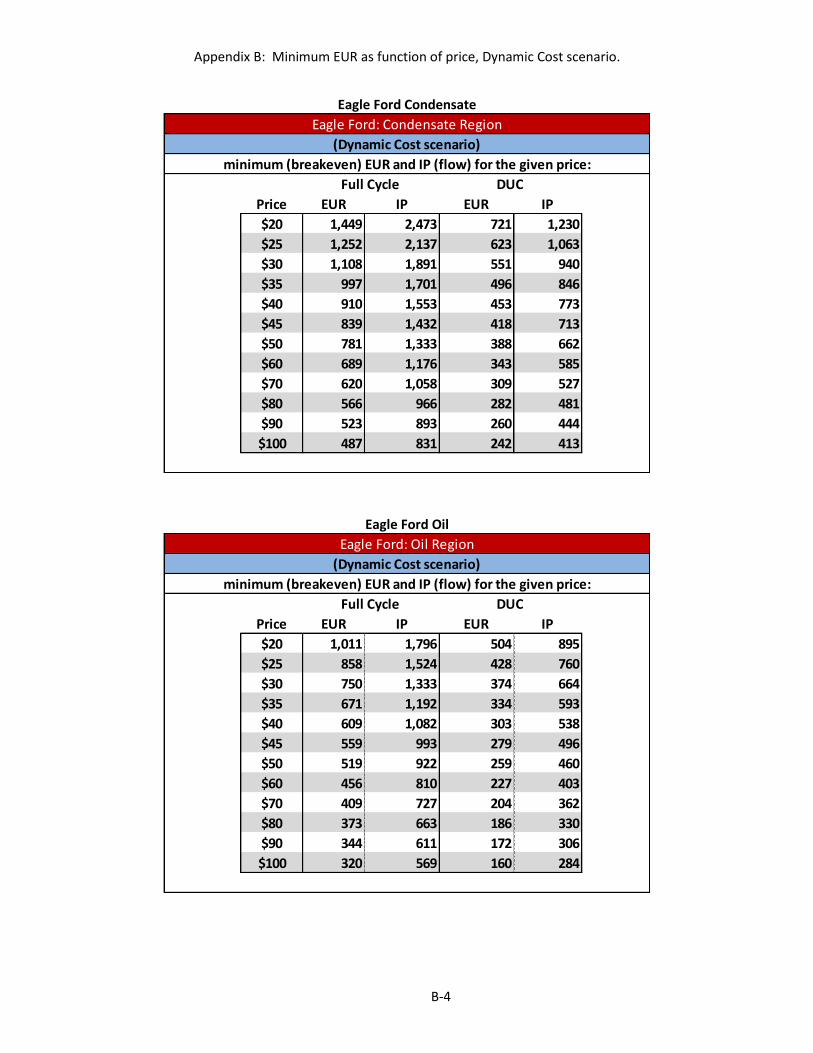
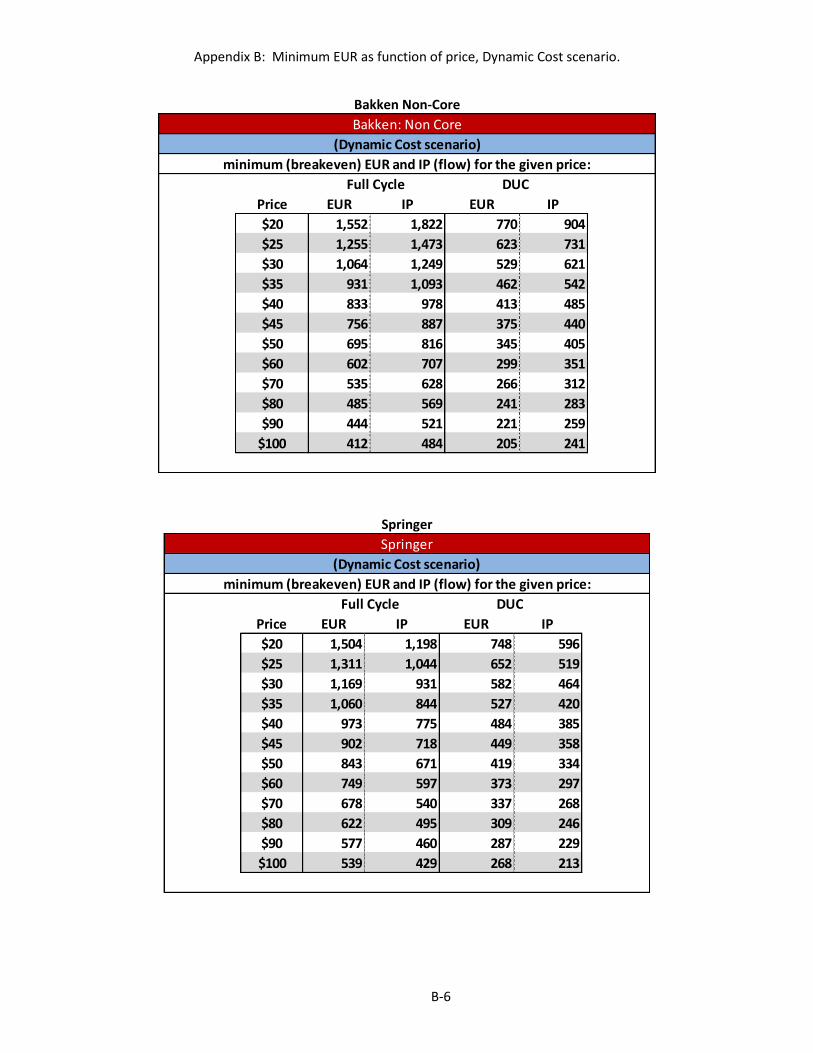
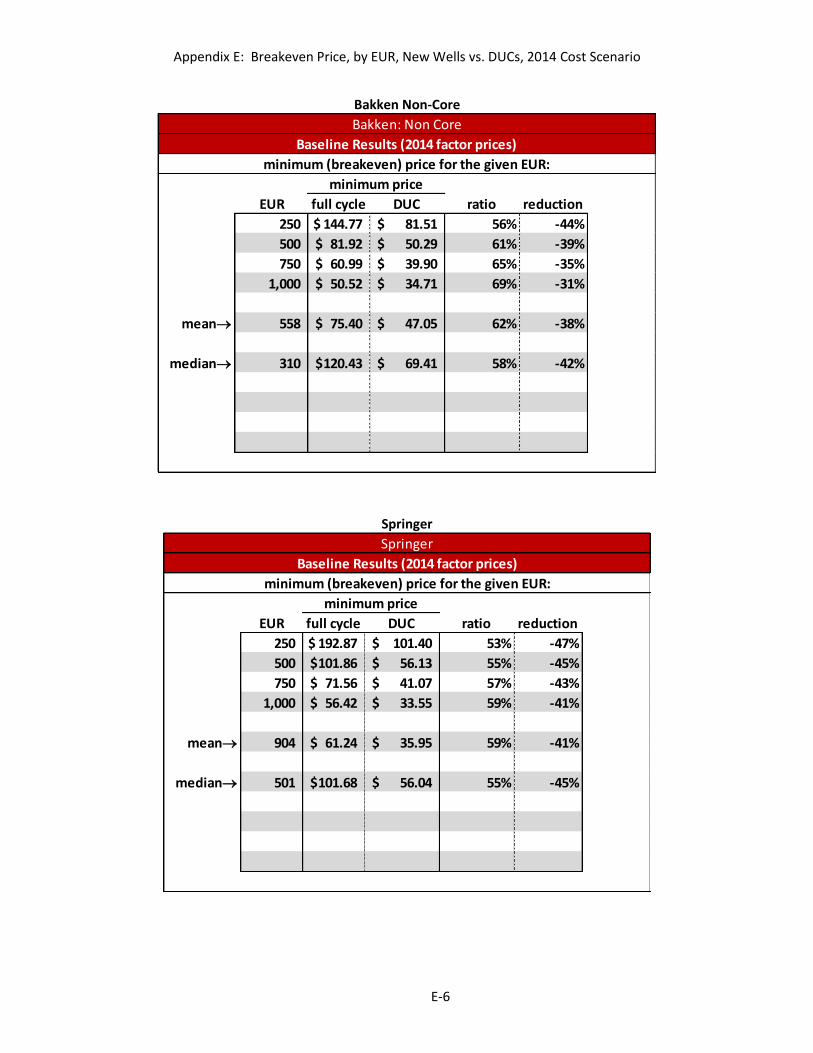
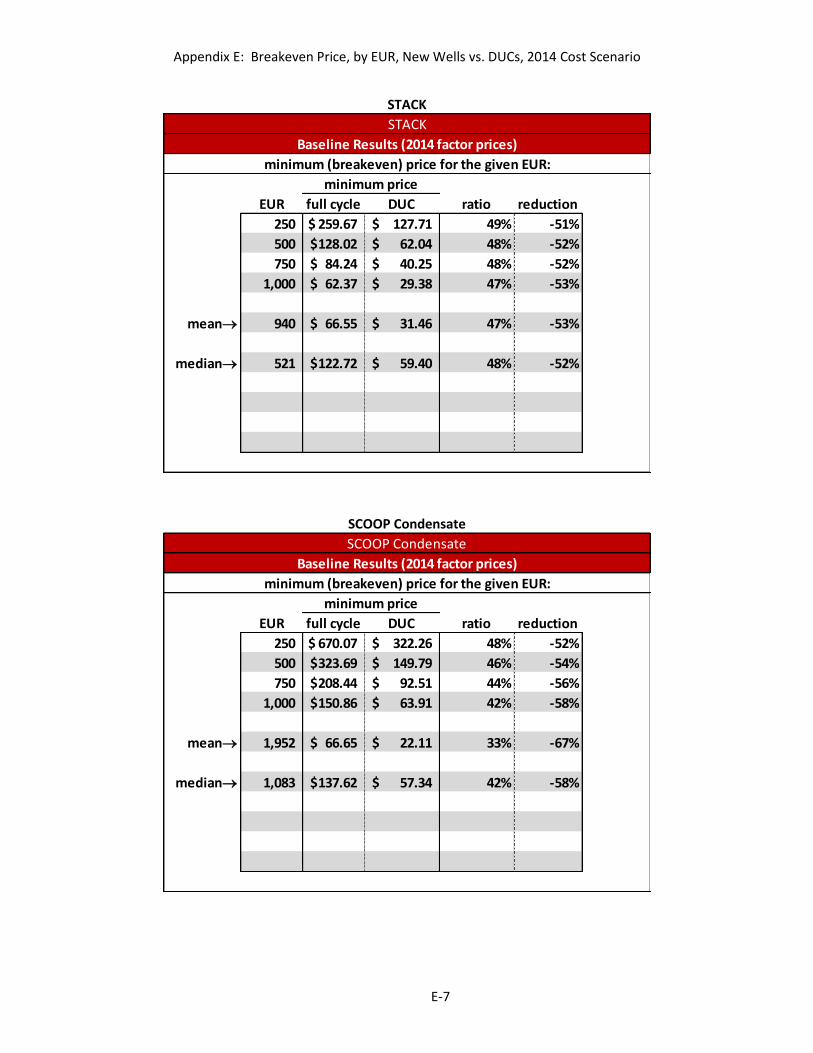
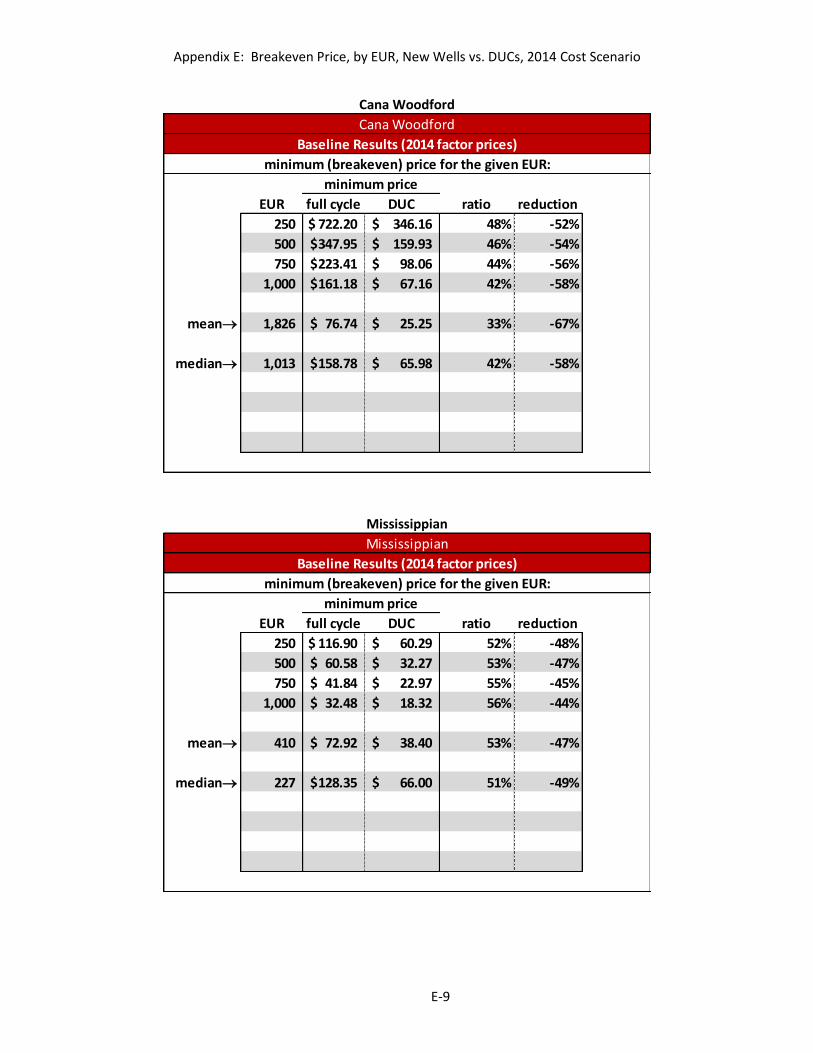
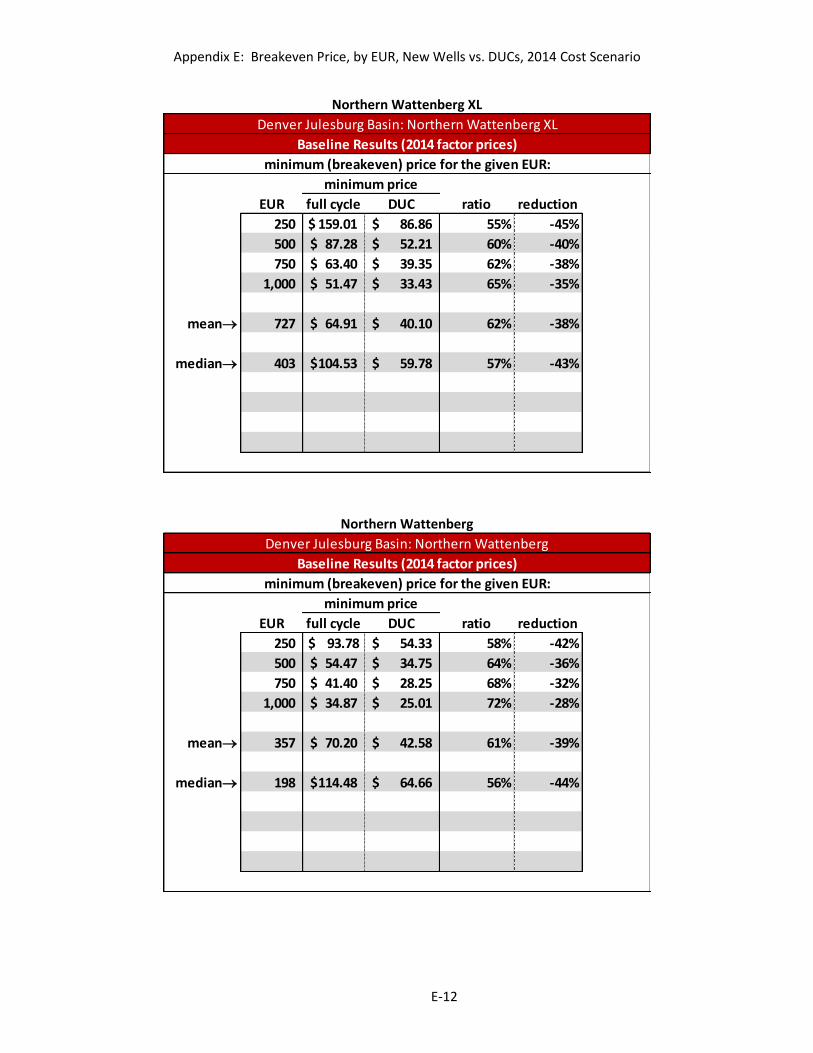
This study also examines the impact of price on the potentially large inventory of drilled but not completed wells (DUCs) that exist in many shale oil basins. The question of economic viability in such cases hinges mainly on the size of the incremental investment that remains to complete the well, and the threshold price required to develop those resources should therefore be lower than for a new well—but how much lower? For each major shale oil play, we provide and compare estimates of the minimum price to develop new wells vs. DUCs, and show how the difference between these two thresholds is affected by the inherent productivity of the well in question.
A further objective of the study is to understand how low oil prices affect the continued operation of mature shale oil wells. Would many of the existing and already producing wells be likely to shut down early? If so, how many and how early? And how much potential production would be lost as a result? The analysis reported herein addresses these questions and provides pretty clear answers.
Our final goal, in addition to producing a clear analysis and discussion of the questions posed above, is to provide EIA with a working analytical framework and the associated tools by which this analysis can be updated and expanded as more information becomes available and as new
Page 7
July 2017
3 Smith and Lee | U.S. Energy Information Administration | This paper is released to encourage discussion and critical comment. The analysis and conclusions expressed here are those of the authors and not necessarily those of the U.S. Energy Information Administration.
questions arise in the future. To that end, the complete computer models and full documentation used to produce our results accompany this narrative report.
2.2 Summary of Findings
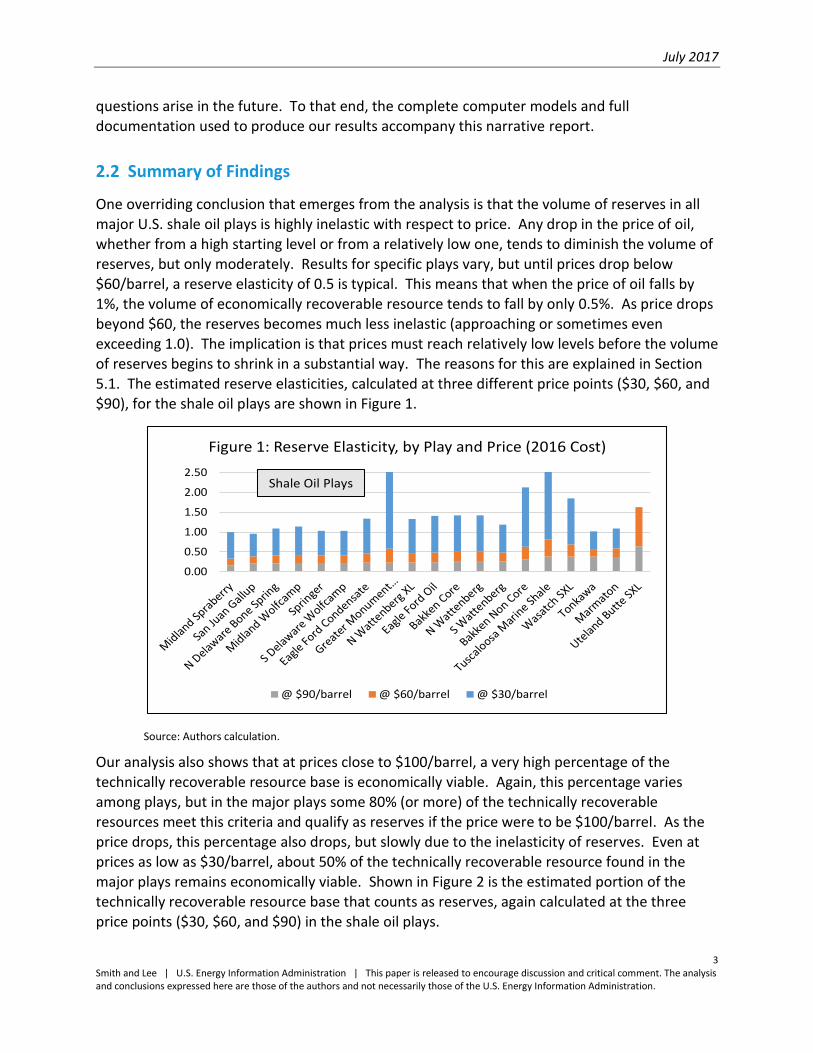
One overriding conclusion that emerges from the analysis is that the volume of reserves in all major U.S. shale oil plays is highly inelastic with respect to price. Any drop in the price of oil, whether from a high starting level or from a relatively low one, tends to diminish the volume of reserves, but only moderately. Results for specific plays vary, but until prices drop below $60/barrel, a reserve elasticity of 0.5 is typical. This means that when the price of oil falls by 1%, the volume of economically recoverable resource tends to fall by only 0.5%. As price drops
beyond $60, the reserves becomes much less inelastic (approaching or sometimes even exceeding 1.0). The implication is that prices must reach relatively low levels before the volume of reserves begins to shrink in a substantial way. The reasons for this are explained in Section 5.1. The estimated reserve elasticities, calculated at three different price points ($30, $60, and $90), for the shale oil plays are shown in Figure 1.
Source: Authors calculation.
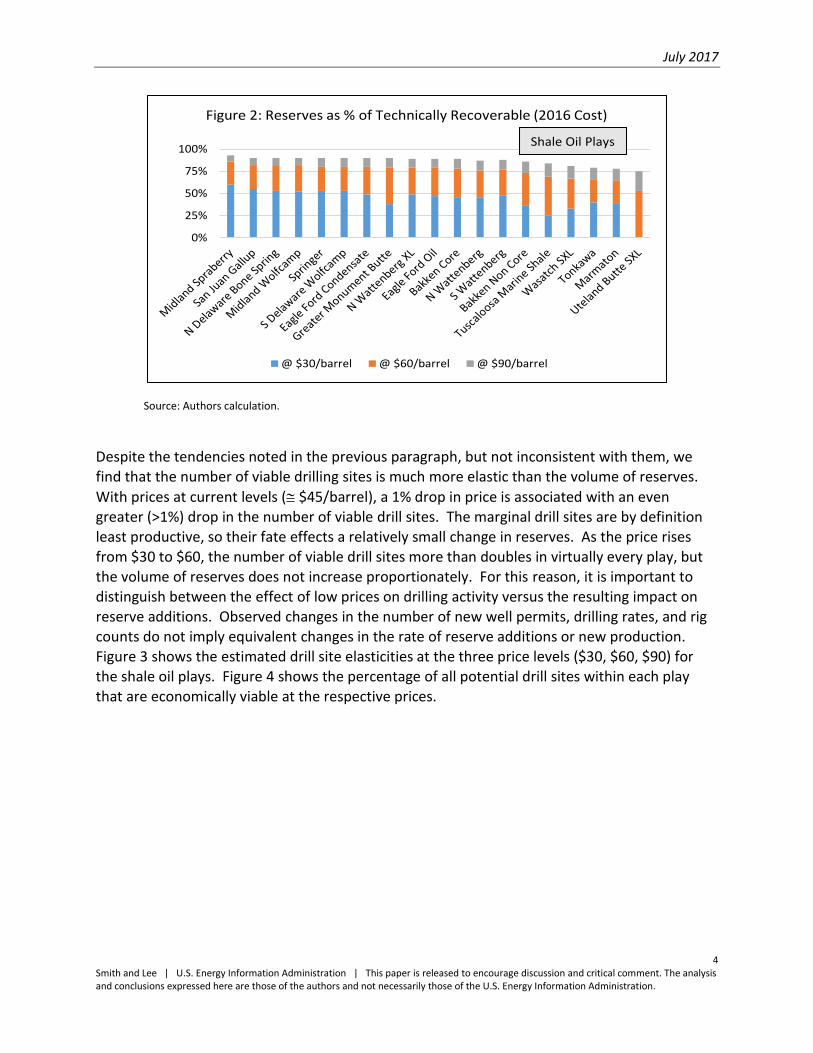
Our analysis also shows that at prices close to $100/barrel, a very high percentage of the technically recoverable resource base is economically viable. Again, this percentage varies among plays, but in the major plays some 80% (or more) of the technically recoverable resources meet this criteria and qualify as reserves if the price were to be $100/barrel. As the price drops, this percentage also drops, but slowly due to the inelasticity of reserves. Even at prices as low as $30/barrel, about 50% of the technically recoverable resource found in the major plays remains economically viable. Shown in Figure 2 is the estimated portion of the technically recoverable resource base that counts as reserves, again calculated at the three price points ($30, $60, and $90) in the shale oil plays.
0.00
0.50
1.00
1.50
2.00
2.50
Figure 1: Reserve Elasticity, by Play and Price (2016 Cost)
@ $90/barrel @ $60/barrel @ $30/barrel
Shale Oil Plays
Page 8
July 2017
4 Smith and Lee | U.S. Energy Information Administration | This paper is released to encourage discussion and critical comment. The analysis and conclusions expressed here are those of the authors and not necessarily those of the U.S. Energy Information Administration.
Source: Authors calculation.
Despite the tendencies noted in the previous paragraph, but not inconsistent with them, we find that the number of viable drilling sites is much more elastic than the volume of reserves.
With prices at current levels ( $45/barrel), a 1% drop in price is associated with an even greater (>1%) drop in the number of viable drill sites. The marginal drill sites are by definition least productive, so their fate effects a relatively small change in reserves. As the price rises
from $30 to $60, the number of viable drill sites more than doubles in virtually every play, but the volume of reserves does not increase proportionately. For this reason, it is important to distinguish between the effect of low prices on drilling activity versus the resulting impact on reserve additions. Observed changes in the number of new well permits, drilling rates, and rig counts do not imply equivalent changes in the rate of reserve additions or new production. Figure 3 shows the estimated drill site elasticities at the three price levels ($30, $60, $90) for the shale oil plays. Figure 4 shows the percentage of all potential drill sites within each play that are economically viable at the respective prices.
0%
25%
50%
75%
100%
Figure 2: Reserves as % of Technically Recoverable (2016 Cost)
@ $30/barrel @ $60/barrel @ $90/barrel
Shale Oil Plays
Page 9
July 2017
5 Smith and Lee | U.S. Energy Information Administration | This paper is released to encourage discussion and critical comment. The analysis and conclusions expressed here are those of the authors and not necessarily those of the U.S. Energy Information Administration.
Source: Authors calculation.
Source: Authors calculation.
The four figures presented so far are predicated on the assumption that upstream costs will remain at 2016 levels regardless of the oil price (the “2016 Cost” scenario). Many observers of the upstream petroleum industry have noted a link between the price of oil and the cost of oil field services and supplies. We refer to this as the “Dynamic Cost” scenario. When such a link is incorporated into the analysis, the response of both reserves and the number of viable drill sites becomes even more inelastic. It turns out, not surprisingly, that declining costs reduce the disincentive created by falling prices, just as rising costs decrease the incentive created by rising prices. This effect is examined in some detail in Sections 5.1 and 5.2.
0.000.501.001.502.002.503.003.50
Figure 3: Drill Site Elasticity, by Play and Price (2016 Cost)
@ $90/barrel @ $60/barrel @ $30/barrel
Shale Oil Plays
0%
25%
50%
75%
100%
Figure 4: Viable Drill Sites as % of Total Drill Sites (2016 Cost)
@ $30/barrel @ $60/barrel @ $90/barrel
Shale Oil Plays
Page 10
July 2017
6 Smith and Lee | U.S. Energy Information Administration | This paper is released to encourage discussion and critical comment. The analysis and conclusions expressed here are those of the authors and not necessarily those of the U.S. Energy Information Administration.
It is also important to realize that the performance of an “average” well (the arithmetic mean of the entire distribution) in any given play is not representative of the majority of wells in that play. The distribution of well productivity is highly skewed to the right (relatively few highly productive wells exist in combination with many less productive wells), which means that the productivity at the median of the distribution is only about 55% of that of the average well. By definition, half of the drill sites in each play are less productive than the median, while relatively few are more productive than the mean. Any analysis of the potential supply of shale oil that ignores this distinction will not provide an accurate picture of the economic viability of the resource base.
Not all shale oil plays are created equal. Some plays are characterized by high costs, primarily
due to greater depth of drilling targets. Some are characterized by low productivity, depending on the nature and properties of the source rock. In some plays, shale oil is produced in conjunction with large quantities of natural gas; in others, not. These differences are reflected in our results and show up in terms of the estimated elasticities, and also in terms of the portion of the technically recoverable resource base that is thought to be economically viable at any given price.
The mixture of fluids (oil/gas/NGL) released from the source rock in a given play has a substantial effect on price elasticity. We distinguish “oil plays” (where production consists primarily of crude oil) from “combo plays” (where associated gas and NGL constitutes more than half of production) and find very different sensitivity to variations in the crude oil price. Indeed, very “gassy” combo plays may exhibit a backward-bending supply curve (negative
elasticity), wherein the volume of reserves actually rises when the price of oil moves downward. This stems from the hypothesized link between oil prices and upstream costs. Since oil and gas prices tend to move independently, a sustained reduction in the price of oil may reduce development costs without lowering the price of natural gas. Such a reduction in the price of oil tends to benefit sub-marginal fields located in gassy plays.
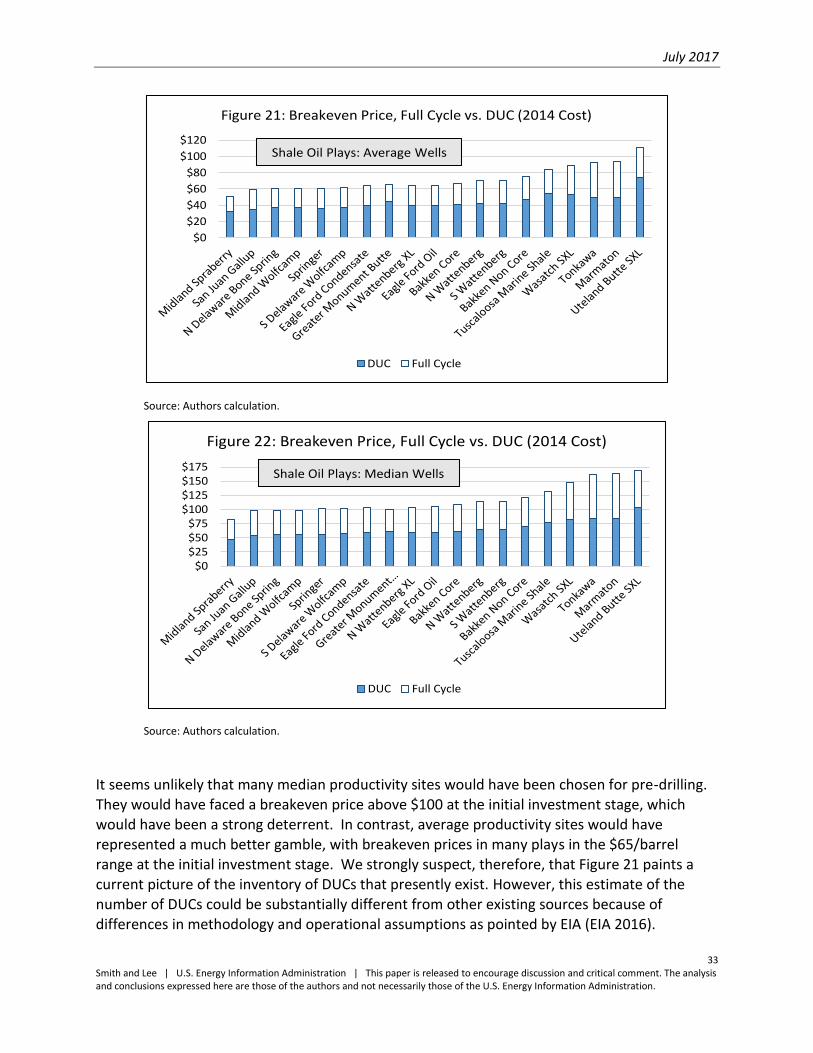
Regarding DUCs that presently exist, our findings are exactly as one would expect. Due to the substantial sunk costs that have already been invested to prepare the drill site and drill the vertical portion of the borehole, the price required to bring these wells into production is
substantially reduced, by at least 30%-40%, when compared to new wells. The details are presented, play by play, in Section 5.4.
Finally, our findings regarding the impact of low prices on mature wells (those that have already passed through the first three years of rapid decline) are not surprising. Only a negligible portion of the remaining reserves of producing wells are in danger of being shut in due to low prices. Although abandonment might be advanced by several years for some low productivity wells in certain plays, the volume of potential reserves lost is small since these wells produce very little late in their life.
Page 11
July 2017
7 Smith and Lee | U.S. Energy Information Administration | This paper is released to encourage discussion and critical comment. The analysis and conclusions expressed here are those of the authors and not necessarily those of the U.S. Energy Information Administration.
2.3 Overview of Methodology
We take a bottom-up approach that is based on the economic viability of individual shale oil wells under given price, cost and technological assumptions, with particular focus on the impact of variations in well productivity as measured by the expected ultimate recovery from the well (EUR). Economic viability is determined in the usual way, according to a discounted cash flow (DCF) model that projects expenditures and receipts on a monthly basis over the potential life of the each well (assumed to be 30 years). The purpose of the DCF model is to identify the threshold EUR that is economically viable (non-negative NPV) for a given oil price. More to the point, this model is used to determine the variation in the threshold productivity level that is associated with variations in the price level.
Given a specific price level, all wells in a given play that meet the economic threshold contribute to the aggregate volume of reserves. Those wells also contribute to the number of economically viable drill sites. Any increase or decrease in price changes the productivity threshold, and also therefore the estimated volume of reserves and the number of viable drill sites. The elasticity of reserves and the elasticity of drill sites is then calculated by comparing the associated variations in price and quantity.
To implement this approach, it is necessary to know how productivity varies among wells within each play, and to determine what fraction of them are likely to reach any given economic threshold. For this, we draw on results from the U.S. Geological Survey’s (USGS) ongoing study of the frequency distribution of individual well EURs in unconventional oil and gas plays in the
U.S.1 Those studies perceive the distribution of EUR to be lognormal, and provide estimates of the population mean and standard deviation of EUR based on the variation across all potential drill sites included within a given play. By linking our EUR threshold analysis to the USGS distributions, we directly obtain estimates of the fraction of all drill sites that are economically viable for a given price. We also obtain the fraction of the technically recoverable resource base that qualifies as reserves.
There is something to be said about the impact of technical change. Several of the USGS studies of well productivity are already several years old. Many are being updated, but the new estimates are not yet available. Given the rapid pace of innovation in the shale oil business, it is reasonable to ask what relevance the earlier studies can have for present purposes. The
answer hinges on the nature of technological progress that has occurred during the interim. If it is fair to assume that progress has been neutral, in the sense of affecting low-productivity and high-productivity wells equally, then even the older USGS studies are directly relevant. An example of neutral technical progress would be an innovation that increases the production of all wells within a play, say by 25%. Under that assumption, both the mean and the standard deviation of EUR in the play would increase by the same 25%. But, the ratio of the two (i.e., the
1 Many such studies been completed and more are underway. We use the estimates presented in “Variability of Distributions
of Well-Scale Estimated Ultimate Recovery for Continuous (Unconventional) Oil and Gas Resources in the United States,” Open-
File Report 2012-1118, U.S. Department of the Interior and U.S. Geological Survey (2012).
Page 12
July 2017
8 Smith and Lee | U.S. Energy Information Administration | This paper is released to encourage discussion and critical comment. The analysis and conclusions expressed here are those of the authors and not necessarily those of the U.S. Energy Information Administration.
“coefficient of variation”) would not have changed. Now, it is the coefficient of variation that is crucial to our method, and so long as technical change has been neutral, the previous USGS estimates of that particular parameter are no less informative than current or future ones. Because the assumption of neutral technical progress does not seem unreasonable, and because it admits a larger set of supporting data, we follow that course.
2.4 Data Sources and Validation
The primary data on which our analysis rest come from two sources. Play-specific characteristics of individual wells (capital and operating costs, average EURs, production splits, decline rates, severance taxes and royalties, and price differentials relative to the benchmark
West Texas Intermediate (WTI) crude oil price and Henry Hub natural gas price) come from Simmons and Company.2 A major advantage of the Simmons data is that it all comes from one source and covers some 34 different shale oil plays. These data were gathered and prepared using consistent methods and any estimates that Simmons may have applied to fill in gaps in the data would have passed through a common filter. Therefore any reported differences among plays are less likely to reflect the type of definitional or pedagogical disparities that could arise when combining micro-level data from different sources. The estimated distributions of well productivity (EUR) all come from the USGS, as mentioned previously.
We have reviewed many additional data sources, including the anecdotal accounts of drilling costs and production rates published in the trade press, the commercially available Drillinginfo and IHS well databases, public records available from the States of North Dakota and Texas, as
well as analyst reports produced by various financial institutions. Potentially, the most useful of these would be the Drillinginfo and IHS databases due to their comprehensive nature and detailed contents.
We have reviewed many additional sources of information from the trade press that report isolated statements about average well productivity, the level of and recent decline in drilling costs, as well as threshold price levels for specific shale oil plays. In combination, those reports tend to validate the Simmons input data on which we rely as well as our resulting play-specific estimates of threshold prices for economic viability.
2 Simmons & Company International, “U.S. Well Economics,” August, 2015.
Page 13
July 2017
9 Smith and Lee | U.S. Energy Information Administration | This paper is released to encourage discussion and critical comment. The analysis and conclusions expressed here are those of the authors and not necessarily those of the U.S. Energy Information Administration.
3. Research Methodology
The analytical approach may be described as a bottom-up methodology in which the productivity and resulting profitability of the individual wells that potentially contribute to production in a given shale oil play are combined with the estimated frequency distribution of such wells within that play. The volume of reserves within a play is found by aggregating up the reserve potential of all individual wells deemed to be economically viable under a presumed set of specific economic and technological conditions. Any change to the volume of reserves stemming from changes in the economic and technological environment are likewise determined by aggregating effects over the population of individual wells.
3.1 The Individual Well Economic Model
Reserves are distinguished from technically recoverable resources. The latter includes all potential production achievable with existing technology from all drill sites located within the play, whether or not such production is economically viable. The former excludes the production potential of any drill site that is not economically viable. Our measure of economic viability is based on a conventional DCF model applied at the level of the individual well, taking into account the specific characteristics, both physical and economic, of the well in question.
Monthly cash flows are projected over the lifetime of a well and valued in an Excel spreadsheet that includes a detailed accounting of the expenditures and receipts associated with the well’s
development and operation.
Model Structure
The NPV of a single well is defined as follows:
𝑁𝑃𝑉 = ∑[𝑃𝑡
𝑜𝑄𝑡𝑜(1−𝑠𝑜)+𝑃𝑡
𝑔𝑄𝑡
𝑔(1−𝑠𝑔)+𝑃𝑡
𝑙𝑄𝑡𝑙(1−𝑠𝑜)](1−𝑟)−𝑐𝑎𝑝𝑒𝑥𝑡−𝑜𝑝𝑒𝑥𝑡−𝑡𝑎𝑥𝑡
(1+𝑖)𝑡−1𝑇𝑡=1 ,
where:
𝑃𝑡𝑜 = wellhead price of oil during month t ($/b).
𝑃𝑡𝑔
= wellhead price of natural gas during month t ($/mcf).
𝑃𝑡𝑙 = wellhead price of NGL during month t ($/b).
𝑄𝑡𝑜 = crude oil production during month t (b).
𝑄𝑡𝑔
= natural gas production during month t (mcf).
𝑄𝑡𝑙 = NGL production during month t (b).
𝑠𝑡𝑜 = severance tax rate on crude oil (%).
Page 14
July 2017
10 Smith and Lee | U.S. Energy Information Administration | This paper is released to encourage discussion and critical comment. The analysis and conclusions expressed here are those of the authors and not necessarily those of the U.S. Energy Information Administration.
𝑠𝑡𝑔
= severance tax rate on natural gas (%).
𝑟 = royalty rate (%).
𝑖 = monthly discount rate (%).
𝑐𝑎𝑝𝑒𝑥𝑡 = capital expenditures incurred during month t ($).
𝑜𝑝𝑒𝑥𝑡 = operating expenditures incurred during month t ($).
𝑡𝑎𝑥𝑡 = income tax expenditures incurred during month t ($).
𝑇 = 360, or whenever net cash flow from production first becomes negative.
Prices
Wellhead prices in the area of each shale oil play are related to market index prices according to fixed differentials that reflect regional premiums and/or discounts relative to the benchmarks.
𝑃𝑡𝑜 = (1 − 𝑑𝑜)𝑊𝑇𝐼𝑡.
𝑃𝑡𝑔
= (1 − 𝑑𝑔)𝐻𝐻𝑡.
𝑃𝑡𝑙 = (1 − 𝑑𝑙)𝑃𝑡
𝑜 .
where:
𝑑𝑜 = differential between wellhead price of oil and WTI (%).
𝑑𝑔 = differential between wellhead price of natural gas and HH (%).
𝑑𝑙 = differential between wellhead price of NGL and wellhead price of oil (%).
Costs
Operating costs for a given well are calculated as a constant variable cost per barrel of production ($/boe), with a minimum of $2,000 per month. Thus:
𝑜𝑝𝑒𝑥𝑡 = 𝑚𝑎𝑥[$2,000, 𝑜𝑐 × (𝑄𝑡𝑜 + 𝑄𝑡
𝑙 + 𝑄𝑡𝑔
6⁄ ) ].
where:
𝑜𝑐 = fixed unit operating cost ($/boe).
Capital expenditures reflect the up-front, lump-sum amount required to drill, frack, and complete the well, plus the capital cost of any auxiliary equipment.
Page 15
July 2017
11 Smith and Lee | U.S. Energy Information Administration | This paper is released to encourage discussion and critical comment. The analysis and conclusions expressed here are those of the authors and not necessarily those of the U.S. Energy Information Administration.
Income Tax
Taxable income is based on a simplified treatment of the IRS rules that apply to upstream oil and gas operations. Intangible capital expenditures are expensed immediately and tangible capital expenditures are subject to ten-year, straight-line depreciation. We assume that any tax credit due to a net operating loss may be taken when incurred, which means a monthly net operating loss from the well in question is used to offset taxable income from other sources.
Production
Monthly production flows are modeled using a hybrid-decline model. Distinct (and steep) monthly decline rates are applied to the initial production (IP) rate in each of the first three
years, after which production reverts to exponential decline for the remainder of field life at a fixed rate that ensures cumulative production (over 360 months) matches the stated EUR of the well. The hybrid-decline model is calibrated for each shale oil play to reflect a representative “type curve” attributed to that play by industry sources. Representative EURs (which measure well productivity) for each play are also based on industry sources, and include an estimate of the range of variation in well productivity within each play. Production of oil, natural gas, and NGL are assumed to remain in fixed proportions over the life of the well.
Application of the Individual Well Model
The principal purpose of the individual well model, in this project, is to identify for each shale oil play the breakeven EUR that corresponds to a given price and cost level; i.e., the minimum
reserve size that is economically viable. Holding cost constant, the threshold productivity level required to ensure economic viability at price 𝑃 will be denoted 𝐸𝑈𝑅𝑃.
In conjunction with the estimated distribution of EUR within a given play, 𝐸𝑈𝑅𝑃 determines the portion of the “technically recoverable resource” within the play that may be counted as “reserves.” Then, by varying the price scenario and noting the indicated change in the volume of reserves in each play, we can calculate the play-specific elasticity of reserves with respect to price.
The scenarios we study involve constant real prices through time. For example, the minimum EUR in a specific play based on $40 oil is the minimum well productivity required to achieve a
non-negative NPV under a constant $40 price level. Costs are set at levels indicative of the various shale oil plays based on industry sources, and sensitivity of results to various cost scenarios is explored.
It is well known that upstream costs have declined substantially over the past two years in response to the marked reduction in activity caused by the oil price crash. For this reason, we have conducted two sets of parallel analyses, applying in the first case factor prices that prevailed in 2014 (before the crash), and in the second case reducing those costs by 25% to mimic the conditions that exist today. We have also examined a third scenario (“Dynamic Cost”) in which all factor prices are tied by constant elasticity to the prevailing oil price level,
Page 16
July 2017
12 Smith and Lee | U.S. Energy Information Administration | This paper is released to encourage discussion and critical comment. The analysis and conclusions expressed here are those of the authors and not necessarily those of the U.S. Energy Information Administration.
whatever it may be. Thus, if the oil price were to rise by 𝑥%, say, we assume in the Dynamic Cost scenario that costs rise simultaneously by 𝜂 × 𝑥%, where 𝜂 represents the constant elasticity of cost with respect to price.
A rough estimate of 𝜂 can be obtained by reference to the 25% cost decline. A constant elasticity cost function takes the form:
𝐶𝑡 = 𝐴𝑃𝑡𝜂, (1)
where 𝐶𝑡 and 𝑃𝑡 represent the levels of cost and oil price prevailing at time 𝑡. We take two observations of the price level: 𝑃2014 = $90 and 𝑃2016 = $45 and pair these with the associated cost levels: 𝐶2014 and 𝐶2016 = 0.75 × 𝐶2014. After substituting these values into
Equation (1) and solving for 𝜂, the implied elasticity is seen to be 0.415.
Fixed, play-specific, type curves (i.e., decline curves) are adopted throughout, also based on industry sources. This means that the same monthly pattern of production decline applies to all wells in a given play, independent of variations in the EUR of the individual wells. Other input variables that are common to all wells located within a single play include the royalty rate, oil and gas severance tax rates, the differential (if any) between wellhead prices and the reference WTI and gas HH prices, the gas/oil/NGL production mix, drilling and completion costs, and the variable operating cost of the well.
Fixed values of several macroeconomic parameters are applied uniformly across all plays, including the discount rate, the potential life of the well, the income tax rate, and depreciation
schedules.
Values of all input parameters used to value wells in each shale oil play included in this study are tabulated in the appendices.
3.2 The Distribution of Well Productivity (EUR)
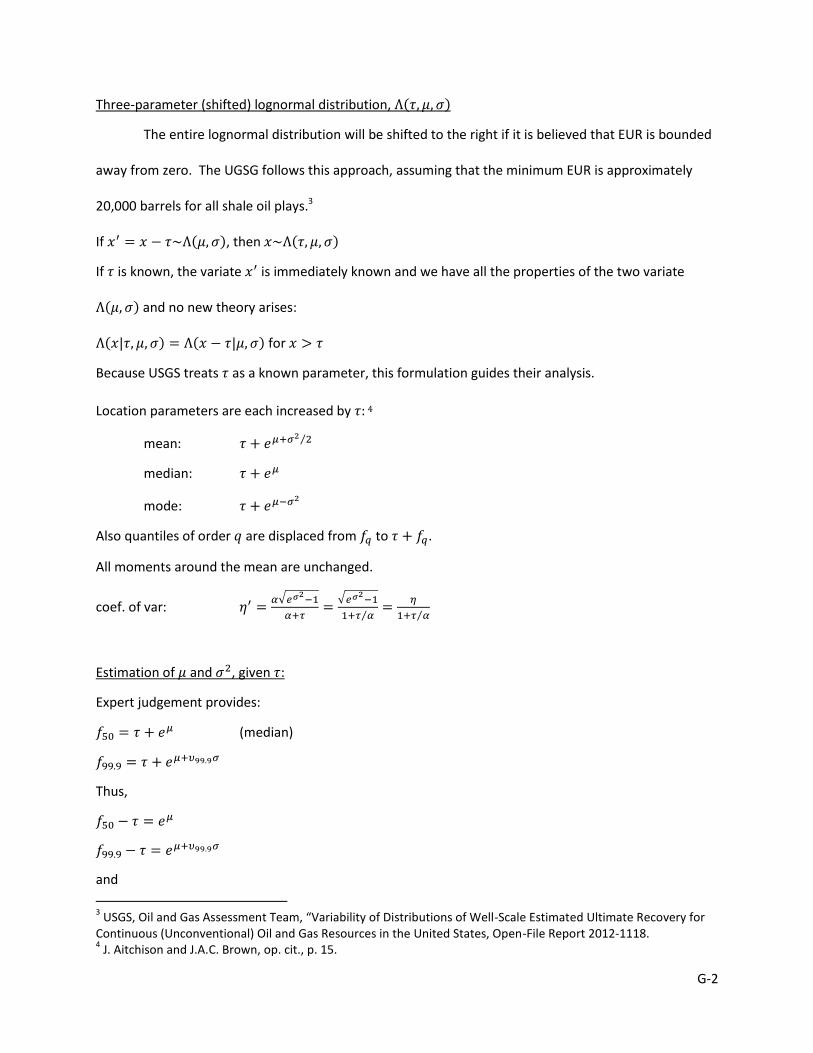
It is assumed that the variation of EUR across all wells located in a given play follows a lognormal distribution with density 𝑓(𝐸𝑈𝑅|𝜇, 𝜎):
𝑓(𝐸𝑈𝑅) =1
𝐸𝑈𝑅√2𝜋𝜎2𝑒−
1
2(
𝑙𝑛𝐸𝑈𝑅−𝜇
𝜎)
2
for 𝐸𝑈𝑅 > 0.
It follows that 𝑙𝑛(𝐸𝑈𝑅) follows a normal distribution with mean 𝜇 and standard deviation 𝜎. The corresponding moments of the lognormal distribution of EUR are then as follows:3
𝑚𝑒𝑎𝑛 = 𝑒𝜇+𝜎2 2⁄ , (2a)
𝑠𝑡𝑑𝑒𝑣 = 𝑒𝜇+𝜎2 2⁄ × √𝑒𝜎2− 1, (2b)
3 J. Aitchison and J. A. C. Brown, The Lognormal Distribution, Cambridge University Press, 1966, p. 9.
Page 17
July 2017
13 Smith and Lee | U.S. Energy Information Administration | This paper is released to encourage discussion and critical comment. The analysis and conclusions expressed here are those of the authors and not necessarily those of the U.S. Energy Information Administration.
𝑚𝑒𝑑𝑖𝑎𝑛 = 𝑒𝜇, (2c)
Further, the coefficient of variation of EUR within the play is calculated as the ratio:
𝑐𝑜𝑒𝑓𝑣𝑎𝑟 =𝑠𝑡𝑑𝑒𝑣
𝑚𝑒𝑎𝑛= √𝑒𝜎2
− 1. (3)
Given a set of estimated parameters that describe the variation in well productivity within a play, it is then straightforward to compute the percentage of drilling sites within the play that are economically viable for any given price:
%𝑑𝑟𝑖𝑙𝑙𝑠𝑖𝑡𝑒𝑠 = ∫ 𝑓(𝑥|𝜇, 𝜎)∞
𝑥=𝐸𝑈𝑅𝑝= 1 − Φ (
𝑙𝑛(𝐸𝑈𝑅𝑃)−𝜇
𝜎),
where Φ(∙) represents the standard normal cumulative distribution.
It is possible also to compute the percentage of technically recoverable resources that are economically viable:
%𝑟𝑒𝑠𝑜𝑢𝑟𝑐𝑒𝑠 =∫ 𝑥𝑓(𝑥|𝜇,𝜎)
∞𝑥=𝐸𝑈𝑅𝑃
∫ 𝑥𝑓(𝑥|𝜇,𝜎)∞
𝑥=0
=𝐸[𝑥|𝑥>𝐸𝑈𝑅𝑝]×%𝑑𝑟𝑖𝑙𝑙𝑠𝑖𝑡𝑒𝑠
𝑚𝑒𝑎𝑛, (4)
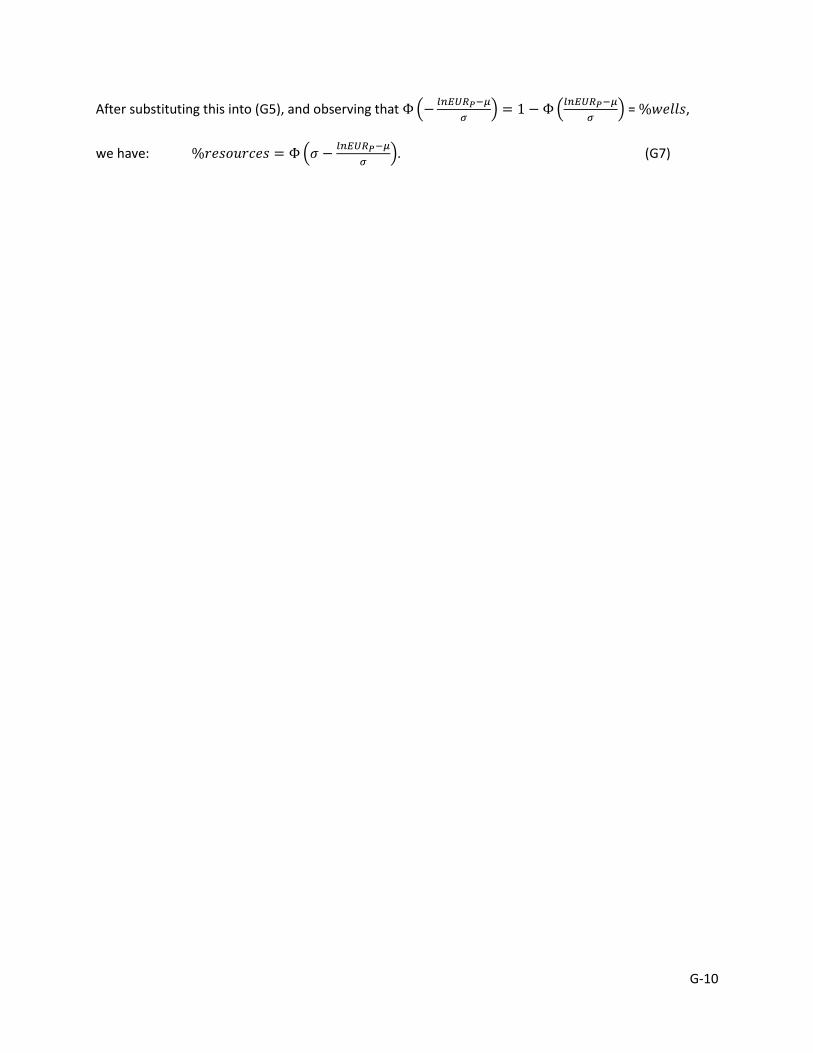
which after simplifying can be written as:
%𝑟𝑒𝑠𝑜𝑢𝑟𝑐𝑒𝑠 = Φ (𝜎 −𝑙𝑛(𝐸𝑈𝑅𝑃)−𝜇
𝜎), (5)
where we have used the following fact that is true for any lognormal variate:4
𝐸[𝑥|𝑥 > 𝐸𝑈𝑅𝑃] = 𝐸[𝑥] ×Φ(𝜎−
𝑙𝑛(𝐸𝑈𝑅𝑃)−𝜇
𝜎)
1−Φ(𝑙𝑛(𝐸𝑈𝑅𝑃)−𝜇
𝜎).
To perform the calculations indicated in Equations (4) and (5), we need to calibrate the parameters of the lognormal distribution to each specific play. We proceed as follows. First, the 𝑚𝑒𝑎𝑛 well productivity for a given play is set equal to the average EUR reported by Simmons. These values were reported in August 2015 and we assume they represent the state of technology as of that time. Next, we compute 𝜎 by solving Equation (3) using the value of 𝑐𝑜𝑒𝑓𝑣𝑎𝑟 drawn from the USGS studies. As mentioned in Section 2.3, we believe the value of 𝑐𝑜𝑒𝑓𝑣𝑎𝑟 for a given play is determined by nature and is essentially timeless, at least that would
be true if technological progress has increased the EUR of all wells within the play by a common percentage. We feel that is a reasonable working assumption. Finally, 𝜇 is obtained by solving Equation (2a). The 𝑚𝑒𝑑𝑖𝑎𝑛 well productivity of the play is then determined by Equation (2c).
The USGS has provided estimates of all these parameters for a miscellaneous set of “assessment units” spread throughout the U.S. Their concept of “assessment unit” is similar to our concept of play—a bed of shale deposits created by common geological events. However, their set of 20 assessment units does not match our set of 34 plays. Some of their assessment
4 J. Aitchison and J. A. C. Brown, op. cit., p. 87.
Page 18
July 2017
14 Smith and Lee | U.S. Energy Information Administration | This paper is released to encourage discussion and critical comment. The analysis and conclusions expressed here are those of the authors and not necessarily those of the U.S. Energy Information Administration.
units lie outside the geographical scope of our study, and some of our plays may be composites formed as the combination of several of their units (for example, our two Williston Basin plays are treated as four units by the USGS) while some of their units may be formed as the combination of several of our plays (for example, their single Eagle Ford oil unit is treated as three plays—oil, condensate, and combo—in our study). And some of our more recent plays (for example, all but the Spraberry in the Permian Basin) have yet to be addressed by the USGS.
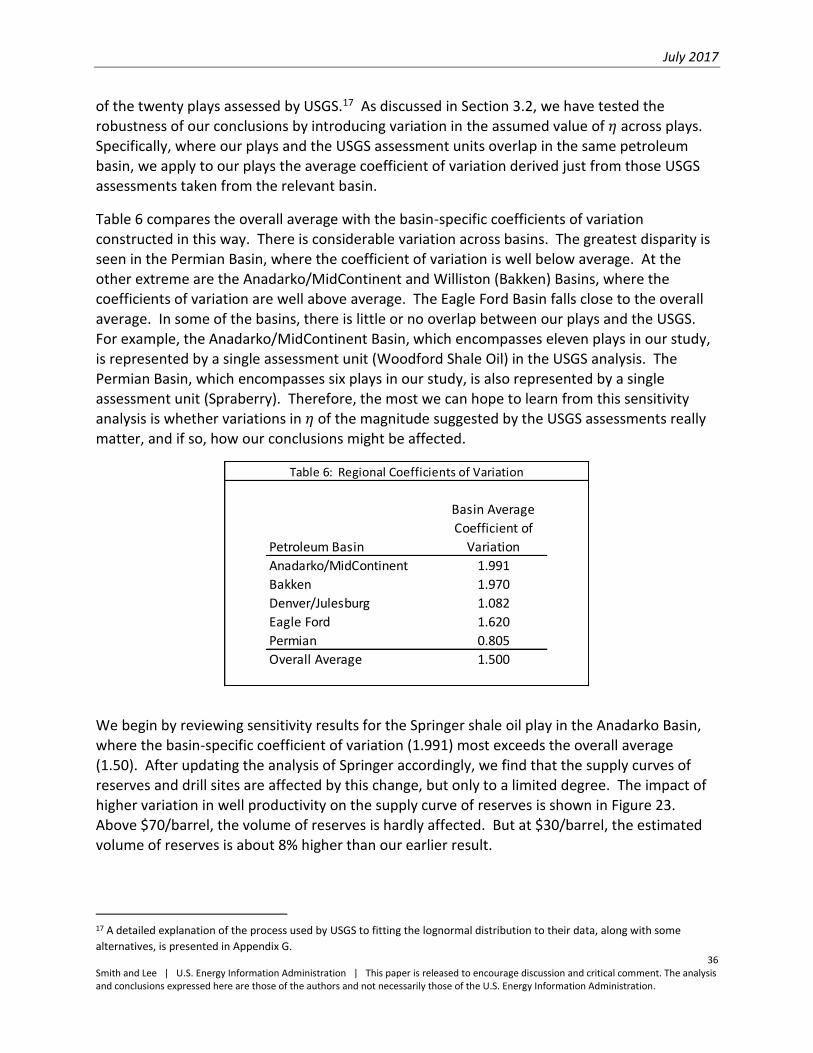
As a consequence, some judgment must be exercised when extracting and applying the USGS estimates of 𝑐𝑜𝑒𝑓𝑣𝑎𝑟 to our plays. We have followed two courses in this regard. The first is to simply compute the average value of 𝑐𝑜𝑒𝑓𝑣𝑎𝑟 over all of the USGS units and apply it uniformly to all of our plays. The USGS estimates of 𝑐𝑜𝑒𝑓𝑣𝑎𝑟 range between 0.805 and 2.543, averaging
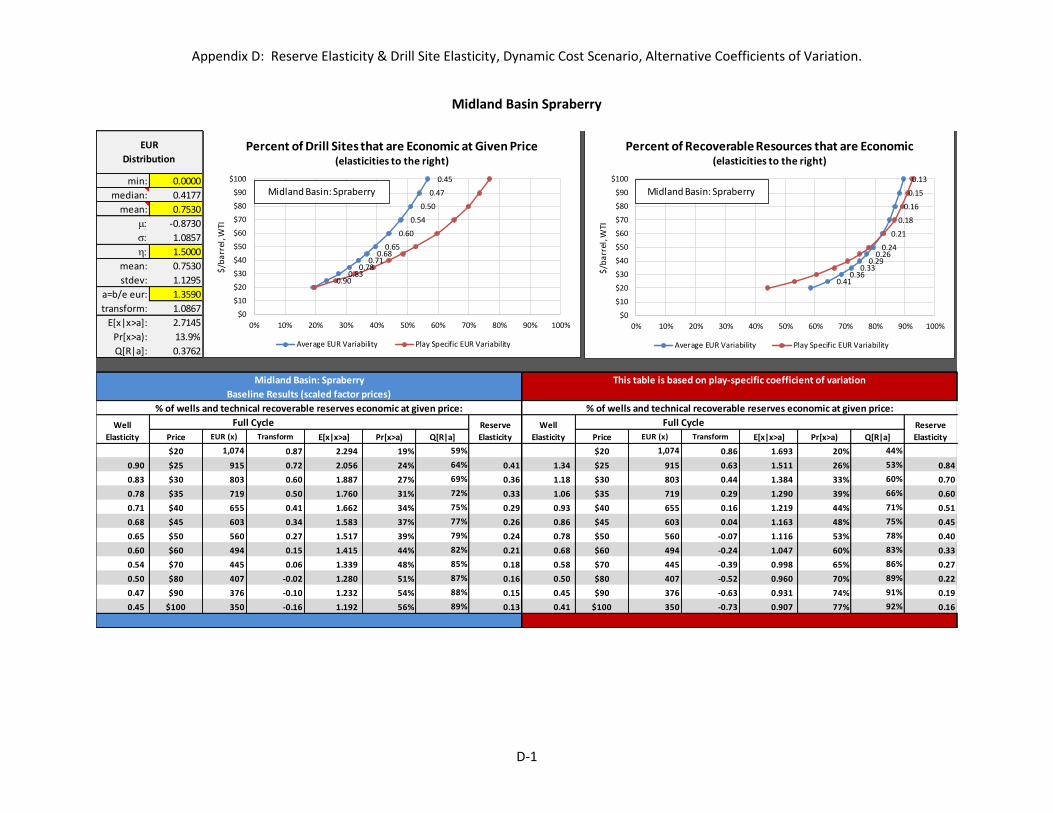
1.475 overall. Variations in 𝑐𝑜𝑒𝑓𝑣𝑎𝑟 within this range do not alter the inherent skewness of the distribution, and it is this skewness that drives many of our results. Having said that, we also pursue a second method, which is to apply to each of our plays an average value of 𝑐𝑜𝑒𝑓𝑣𝑎𝑟 based on the subset of USGS units located in that same basin. We will contrast these two approaches and show that our estimates of the elasticity of reserves and drilling sites are not much affected either way.
3.3 Combining the Two Models
To calculate the elasticity of reserves with respect to price, we account for the relationship between price and breakeven EUR, which moves technically recoverable reserves into or out of the “economic” category as the price rises or falls. The percentage change in economic
reserves due to a one percent change in price is what we call the “reserve elasticity.”
The previously described analysis assumes that all wells within a play can be developed at uniform cost, and the reserve elasticity is conditioned on that number. Recognizing that the cost of drilling individual wells varies even within a given play, one might wish to work with the joint distribution of EUR and well cost. Reserves would then be computed by aggregating over the set of all wells with a combination of EUR and well cost (whether higher or lower than average) that are deemed economically viable.
We have not followed that course for three reasons. First, no information on the joint distribution of EUR and well cost is at hand. Second, the range of variation in EUR across wells
within each basin swamps the range of variation in cost per well. USGS reports that production from the most productive wells in any given play exceeds that of the least productive wells by a factor of 100:1.5 In contrast, the difference between most and least expensive wells in a given play is on the order of 2:1.6 Drilling costs are mostly a function of drilling depth, and the relatively uniform depth of shale deposits within each play accounts for the relatively small
5 USGS, op. cit., p. 1. 6 Reporting on twenty-two U.S. and Canadian shale oil plays, Rodgers see the expense ratio of high cost to low cost for wells
within individual plays as ranging between 1.17 to 2.0, with an overall average of 1.45. He estimates the average ratio of
greatest to shallowest well depths within those plays as 1.51. See Barry Rodgers, “North American Resource Value—2: North
American Tight Oil Play Economics Compared,” Oil and Gas Journal, May 6, 2013.
Page 19
July 2017
15 Smith and Lee | U.S. Energy Information Administration | This paper is released to encourage discussion and critical comment. The analysis and conclusions expressed here are those of the authors and not necessarily those of the U.S. Energy Information Administration.
variation in cost per well. Third, any further adjustments we would make to the volume of reserves based on variations in costs would tend to cancel out. Some low-cost wells would be added to our reserve estimate despite having a low EUR, but other high-cost wells would be subtracted in spite of a high EUR. The two adjustments work in opposite directions and their net impact is thought to be of second-order importance. Due to the skewness of the EUR distribution and the nonlinearity of EUR as a function of both price and cost, the opposing forces will not in general exactly cancel out, so our estimated reserve elasticity must be regarded as an approximation that takes best advantage of the available information.
Page 20
July 2017
16 Smith and Lee | U.S. Energy Information Administration | This paper is released to encourage discussion and critical comment. The analysis and conclusions expressed here are those of the authors and not necessarily those of the U.S. Energy Information Administration.
4. Data Sources and Validation
This study encompasses 34 distinct shale plays in the U.S. 19 of these are categorized as “shale oil plays” because oil is the dominant produced fluid (>50%). The remaining 15 are categorized as “combo plays” because in each one oil constitutes less than 50% of production. All major plays that contribute significantly to U.S. shale oil production are included. The individual plays are described in Tables 1 and 2.
The tables identify the broader sedimentary basin in which each play is located, and provide additional information regarding typical drilling and completion costs (“Well Cost”), the average productivity of all potential drill sites within the play (EUR), the average 30-day initial production rate for those drill sites (IP), as well as the composition of the production stream.
Uniform Specific Well Cost EUR IP Rate Oil Gas NGL
Basin Play Coef Var Coef Var $mm mboe boe/d % % %
Anadarko/MidCont Springer 1.500 1.991 9.0 904 720 68% 16% 17%
Anadarko/MidCont Marmaton 1.500 1.991 3.1 201 276 55% 25% 20%
Anadarko/MidCont Tonkawa 1.500 1.991 3.7 249 340 56% 28% 17%
Bakken Bakken Core 1.500 1.970 7.5 725 851 85% 13% 2%
Bakken Bakken Non Core 1.500 1.970 6.5 558 655 88% 9% 3%
Denver/Julesburg N Wattenberg 1.500 1.082 4.0 357 400 71% 20% 10%
Denver/Julesburg N Wattenberg XL 1.500 1.082 6.6 727 722 67% 21% 13%
Denver/Julesburg S Wattenberg 1.500 1.082 3.4 395 430 51% 33% 17%
Eagle Ford Eagle Ford Oil 1.500 1.620 6.0 515 915 71% 15% 14%
Eagle Ford Eagle Ford Condensate 1.500 1.620 8.0 801 1,367 63% 20% 17%
Other San Juan Gallup 1.500 1.500 4.2 451 550 65% 18% 18%
Other Tuscaloosa Marine Shale 1.500 1.500 11.0 683 1,048 92% 8% 0%
Permian Midland Spraberry 1.500 0.805 6.5 753 825 76% 12% 12%
Permian N Delaware Bone Spring 1.500 0.805 6.5 676 1,000 60% 20% 20%
Permian S Delaware Wolfcamp 1.500 0.805 7.8 883 1,100 55% 25% 20%
Permian Midland Wolfcamp 1.500 0.805 6.5 746 745 60% 19% 21%
Uinta Greater Monument Butte 1.500 1.500 1.4 188 120 87% 9% 4%
Uinta Wasatch SXL 1.500 1.500 14.0 1,000 1,444 75% 25% 0%
Uinta Uteland Butte SXL 1.500 1.500 11.0 700 1,290 75% 25% 0%
Table 1: Oil Plays
Uniform Specific Well Cost EUR IP Rate Oil Gas NGL
Basin Play Coef Var Coef Var $mm mboe boe/d % % %
Anadarko/MidCont Cana Woodford 1.500 1.991 7.0 1,826 1,606 5% 63% 32%
Anadarko/MidCont SCOOP Oil 1.500 1.991 9.4 979 762 48% 23% 29%
Anadarko/MidCont SCOOP Condensate 1.500 1.991 9.6 1,952 1,400 10% 50% 40%
Anadarko/MidCont STACK 1.500 1.991 8.5 940 826 40% 30% 30%
Anadarko/MidCont Meramec 1.500 1.991 7.6 1,338 1,425 22% 47% 31%
Anadarko/MidCont Mississippian 1.500 1.991 2.8 410 409 34% 46% 20%
Anadarko/MidCont Granite Wash 1.500 1.991 7.5 736 1,340 20% 50% 30%
Anadarko/MidCont Cleveland 1.500 1.991 2.8 232 400 30% 45% 25%
Appalachia SW PA Wet Gas 1.500 1.500 5.9 2,933 2485 0 49% 50%
Appalachia SW PA Super Rich 1.500 1.500 5.9 2,150 1,536 8% 46% 46%
Appalachia Utica Wet Gas 1.500 1.500 10.3 3,000 3,000 3% 67% 30%
Appalachia Utica Condensate 1.500 1.500 9.4 1,186 1,186 28% 48% 24%
Eagle Ford Eagle Ford Combo 1.500 1.620 5.5 898 1,085 21% 45% 34%
Permian Culberson LL Wolfcamp 1.500 0.805 11.9 1,955 2,450 20% 50% 30%
Permian S Midland Basin Wolfcamp 1.500 0.805 4.8 500 525 48% 27% 25%
Table 2: Combo Plays
Page 21
July 2017
17 Smith and Lee | U.S. Energy Information Administration | This paper is released to encourage discussion and critical comment. The analysis and conclusions expressed here are those of the authors and not necessarily those of the U.S. Energy Information Administration.
All of these data were provided by Simmons and Company.7 The tables also show the estimated coefficient of variation regarding EUR that is attributed to each play, based on the USGS estimates that include both the overall average (labeled as “Uniform Coef Var”) from all USGS assessment units and the basin-specific averages (labeled as “Specific Coef Var”) that serves as an alternative in some of our analysis.
Additional play-specific information provided by Simmons and Company includes the following parameters:
production decline rates (%)
operating cost ($/boe)
royalty rate (%)
oil severance tax rate (%)
natural gas severance tax rate (%)
oil price differential (%)
natural gas price differential (%)
NGL price differential (%)
The specific values of these parameters pertaining to each play are documented in the Appendix A. These values were applied to all potential drill sites within a given play and held fixed throughout our analysis. Finally, a uniform income tax rate of 35% has been applied to the net income of the DCF model, and net cash flows are discounted at the annual rate of 8.5%.
We have attempted to validate the input parameters in various ways. We have, for example,
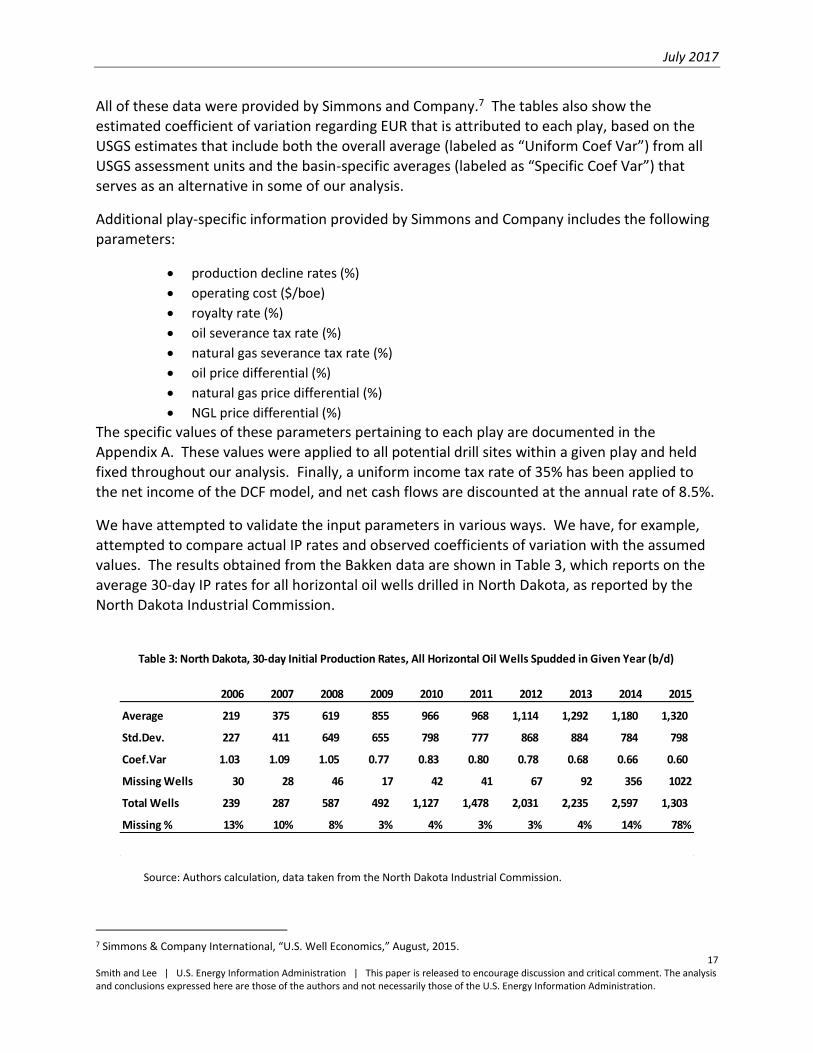
attempted to compare actual IP rates and observed coefficients of variation with the assumed values. The results obtained from the Bakken data are shown in Table 3, which reports on the average 30-day IP rates for all horizontal oil wells drilled in North Dakota, as reported by the North Dakota Industrial Commission.
Source: Authors calculation, data taken from the North Dakota Industrial Commission.
7 Simmons & Company International, “U.S. Well Economics,” August, 2015.
2006 2007 2008 2009 2010 2011 2012 2013 2014 2015
Average 219 375 619 855 966 968 1,114 1,292 1,180 1,320
Std.Dev. 227 411 649 655 798 777 868 884 784 798
Coef.Var 1.03 1.09 1.05 0.77 0.83 0.80 0.78 0.68 0.66 0.60
Missing Wells 30 28 46 17 42 41 67 92 356 1022
Total Wells 239 287 587 492 1,127 1,478 2,031 2,235 2,597 1,303
Missing % 13% 10% 8% 3% 4% 3% 3% 4% 14% 78%
Table 3: North Dakota, 30-day Initial Production Rates, All Horizontal Oil Wells Spudded in Given Year (b/d)
Page 22
July 2017
18 Smith and Lee | U.S. Energy Information Administration | This paper is released to encourage discussion and critical comment. The analysis and conclusions expressed here are those of the authors and not necessarily those of the U.S. Energy Information Administration.
As we had anticipated, average productivity of Bakken wells has increased dramatically since 2006, with fastest growth in the early years when operators were first learning about the shale. The standard deviation has grown along with the mean, but the coefficient of variation has remained fairly constant, especially if we discount the 2015 data which are mostly incomplete. The observed coefficient of variation has varied between 0.60 and 1.09, and never approached our USGS benchmark estimate of 1.50. The average IP rate averaged 1,180 barrels/day for wells spudded in 2014 (even higher in 2015, but those data are again largely incomplete), which is well above our benchmark rates of 851 barrels/day (Bakken Core) and 655 barrels/day (Bakken non-Core).
These differences are not troubling. Indeed, the discrepancies are exactly in the direction we
should expect if the industry has been selective in its choice of drilling sites. If more productive drill sites receive priority, then the set of wells actually drilled is not representative of the entire population of potential drill sites and the observed average would exceed the population mean, which is what we observe. For the same reason, the observed standard deviation would fall below the population standard deviation. The impact on the mean and standard deviation together would in turn reduce the observed coefficient of variation below the population coefficient of variation, which is what we observe in the case of the Bakken Shale. This is admittedly a weak test of the reasonableness of our parameter inputs, but it is a test that we easily could have failed if our input parameters were askew.
We have no reason to believe that the Simmons data or the USGS estimates are biased in any particular direction. We do acknowledge, however, that we are working with estimated values
of the input parameters and that it would be useful to pursue further research to verify the accuracy of our assumptions and to update them if new or better information becomes available.
We have also compared our input parameters, as well as our conclusions, with play-specific, industry pronouncements regarding well costs, IP rates, EUR volumes, and break-even prices. This type of comparison finds close correspondence between our inputs and outputs and various quite detailed play-specific reports from operators who are active in the field. A sampling of this literature is listed below. Although these various reports provide at most to
anecdotal support, again it is a test that we might have failed.
Page 23
July 2017
19 Smith and Lee | U.S. Energy Information Administration | This paper is released to encourage discussion and critical comment. The analysis and conclusions expressed here are those of the authors and not necessarily those of the U.S. Energy Information Administration.
A Sampling of Relevant Trade Press Reports:
"Tight Oil Test: U.S. Production Growth Remains Resilient Amid Lower Crude Oil
Prices," IHS Online Pressroom , November 20, 2014.
"Price Slump Will Slow, Not Stop, US Oil Growth," Petroleum Intelligence Weekly ,
January 19, 2015.
"Bakken, Not Beaten," Oil and Gas Investor , March 1, 2015.
"Shale Producers Eye Risky Drilling Ramp-Up," Petroleum Intelligence Weekly ,
April 27, 2015.
"Permian Perseveres," Oil and Gas Investor , May 1, 2015.
"Well Backlog Won't Halt Fall in US Oil Output," Petroleum Intelligence Weekly ,
May 4, 2015.
"Optimizing the Eagle Ford," Oil and Gas Investor , September 1, 2015.
"Permian Holds Up Best Among US Shale Plays," Petroleum Intelligence Weekly ,
September 7, 2015.
"Did OPEC Misjudge Shale Economics?" Petroleum Intelligence Weekly ,
October 5, 2015.
"Pundits Skeptical Over Fresh Fall in Oil Prices," Petroleum Intelligence Weekly ,
October 12, 2015.
"Will 2016 Push US Shale Over the Edge?" Petroleum Intelligence Weekly ,
January 11, 2016.
"Bankruptcies May Spell End for Some Shale Plays," Petroleum Intelligence Weekly ,
February 1, 2016.
"Break-even model: Cracking the shale enigma," Bloomberg Intelligence ,
February 8, 2016
"Continental Thrilled with Trio of Meramec Wells, Keeps Capex at $920M," NGI's
Shale Daily , February 26, 2016
"Want to Bet on Oil Companies? It's All About the ZIP Code," Wall Street Journal ,
March 27, 2016.
"Stacked in Oklahoma," Oil and Gas Investor, May 1, 2016.
"US Shale Oil Starts Showing Some Life," Petroleum Intelligence Weekly ,
June 20, 2016.
"Devon STACK spacing test flows 1,400 boe/d/well," Oil and Gas Journal ,
July 19, 2016.
"Premium Blend: What's the 'Magic' Oil Price at Which DUCs Could be
Completed?", Oil and Gas Investor (video interview), July 26, 2016.
Page 24
July 2017
20 Smith and Lee | U.S. Energy Information Administration | This paper is released to encourage discussion and critical comment. The analysis and conclusions expressed here are those of the authors and not necessarily those of the U.S. Energy Information Administration.
5. Research Results
In this section, we discuss the main conclusions that have emerged from the study. The detailed background tables provided in the appendices provide complete documentation of all of our empirical findings. The discussion in this section is organized around seven main issues:
The impact of low prices on the volume of shale oil reserves.
The impact of low prices on the number of viable drill sites.
The distinction between average and median well productivity as it affects economic viability.
The significance of substantial natural gas resources within the “combo plays” and how their
presence affects our results.
The impact of low prices on the present inventory of drilled but not completed wells (DUCs).
The impact of low prices on mature shale oil wells that are already in production.
Robustness of results with respect to the estimated coefficient of variation.
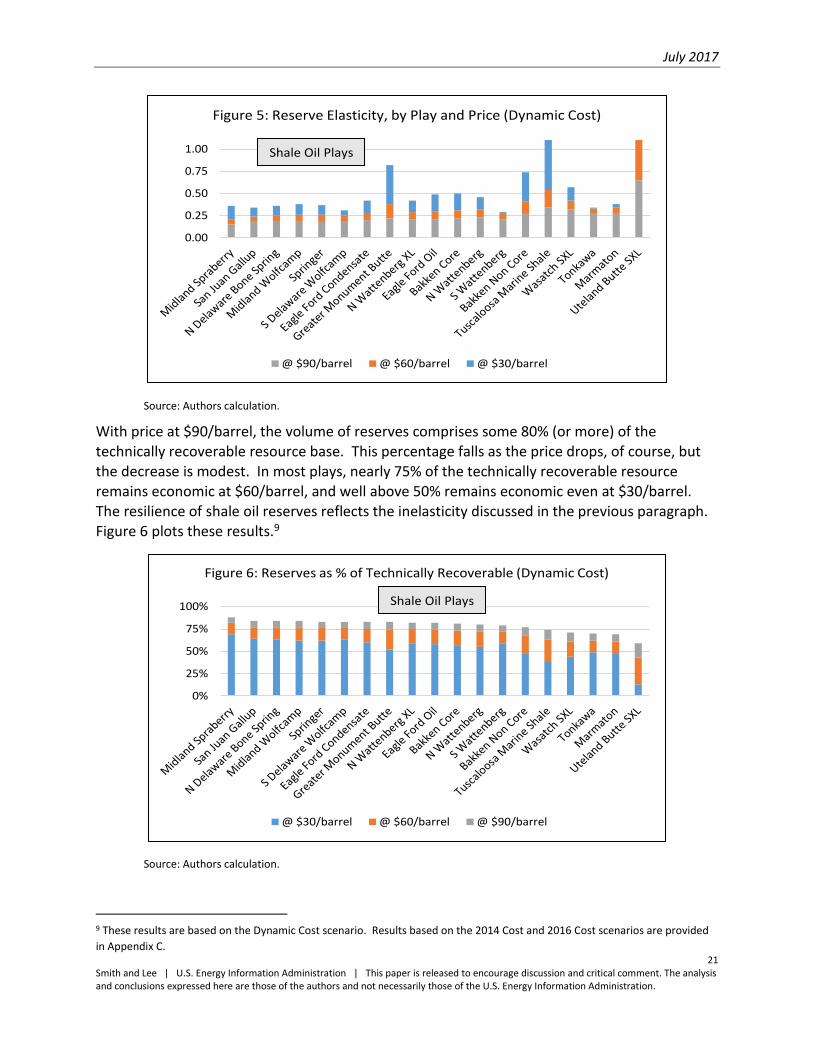
5.1 The Volume of Shale Oil Reserves
(This section pertains only to those plays categorized as “oil plays” on the basis of dominant crude oil production split. The “combo plays” behave quite differently and are discussed separately in Section 5.4).
The price elasticity of reserves varies across all shale oil plays but is generally quite inelastic, which means that the impact of price changes is damped. In almost all plays, the price elasticity
is below 0.25 when prices are around $90.8 The elasticity rises a little but remains well below 0.50 as price drops to $60, and for most plays the elasticity remains below 0.50 as the price drops further to $30.
These estimates, shown in Figure 5, reflect the Dynamic Cost scenario, where it is assumed that upstream costs track oil prices with an elasticity of 0.415. More detailed results that cover a finer and broader range of price levels are provided in the appendices. Similar results obtained
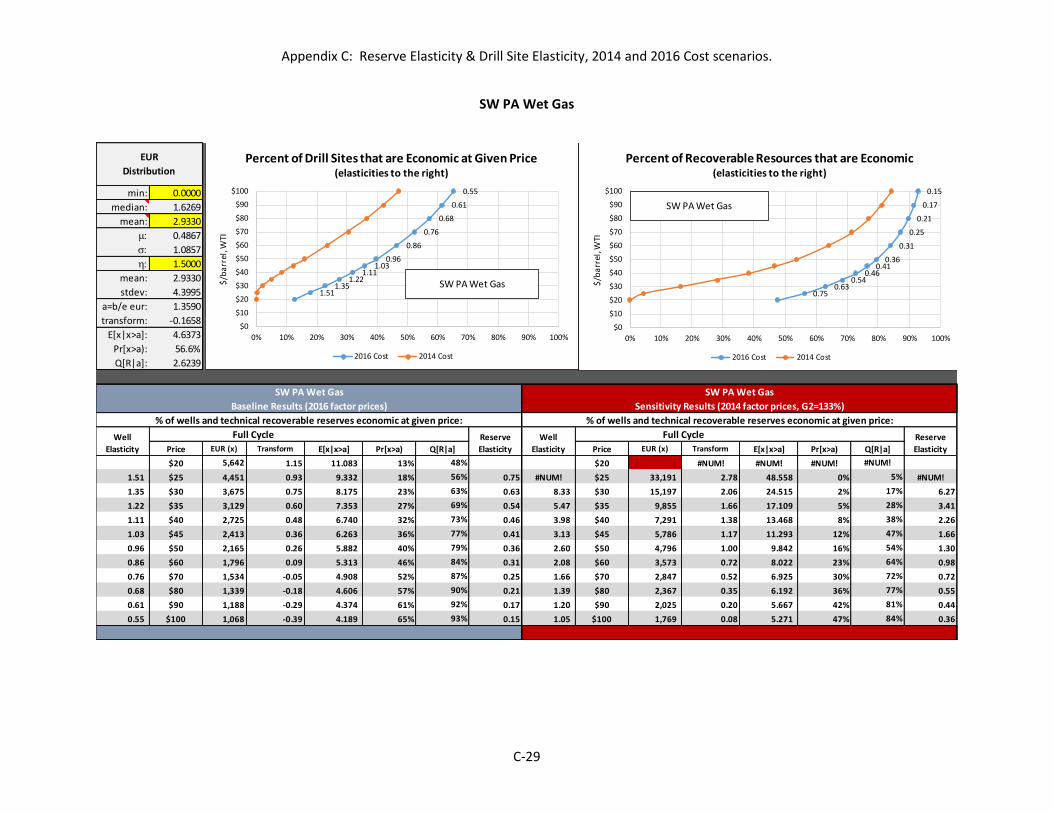
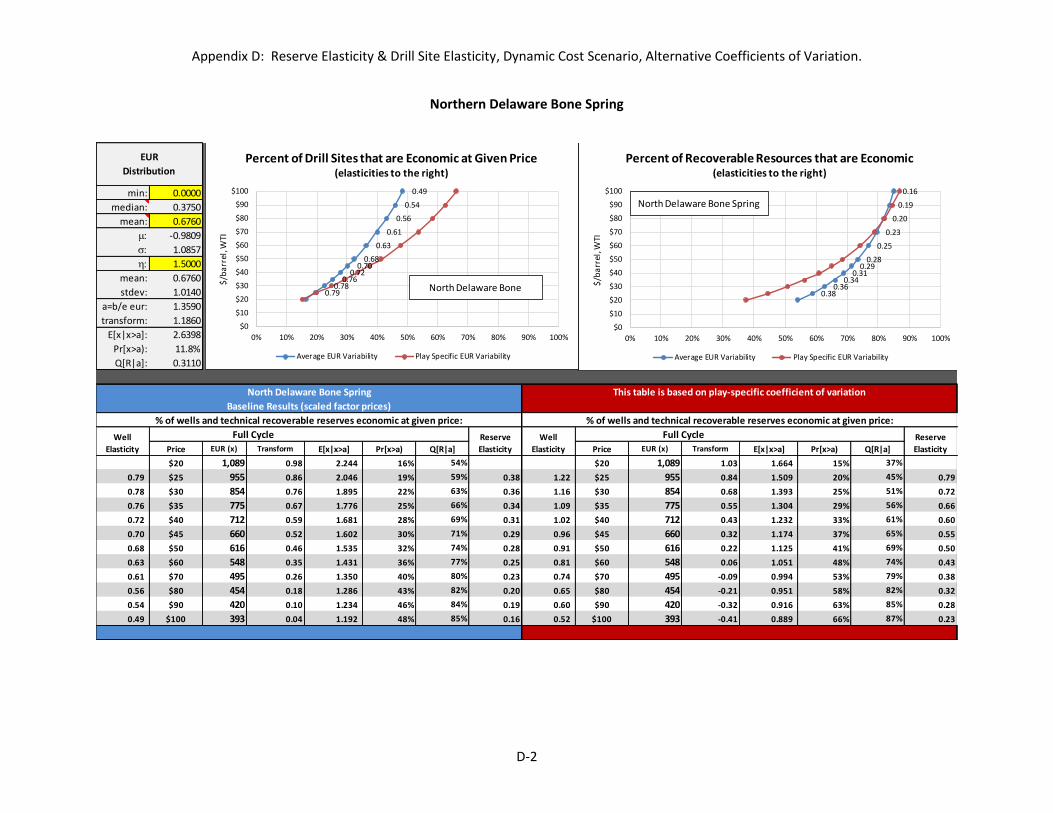
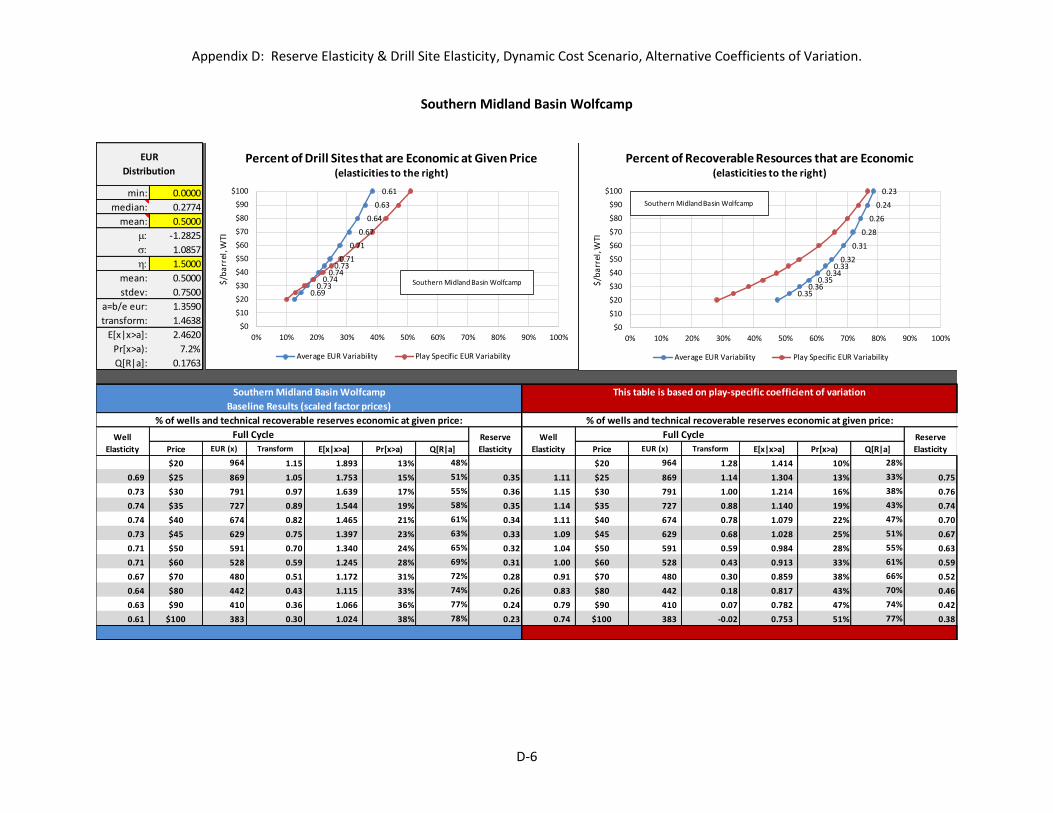
under the static 2016 Cost scenario were discussed previously in Section 2, and results for the static 2014 Cost scenario are presented in Appendix C. Given the observed tendency for upstream costs to move with oil prices, we feel the Dynamic Cost scenario shown here is the most relevant.
8 These figures reflect the arc elasticity calculated by observing the impact of a small change from the stated price level on the
volume of reserves.
Page 25
July 2017
21 Smith and Lee | U.S. Energy Information Administration | This paper is released to encourage discussion and critical comment. The analysis and conclusions expressed here are those of the authors and not necessarily those of the U.S. Energy Information Administration.
Source: Authors calculation.
With price at $90/barrel, the volume of reserves comprises some 80% (or more) of the technically recoverable resource base. This percentage falls as the price drops, of course, but the decrease is modest. In most plays, nearly 75% of the technically recoverable resource remains economic at $60/barrel, and well above 50% remains economic even at $30/barrel. The resilience of shale oil reserves reflects the inelasticity discussed in the previous paragraph. Figure 6 plots these results.9
Source: Authors calculation.
9 These results are based on the Dynamic Cost scenario. Results based on the 2014 Cost and 2016 Cost scenarios are provided
in Appendix C.
0.00
0.25
0.50
0.75
1.00
Figure 5: Reserve Elasticity, by Play and Price (Dynamic Cost)
@ $90/barrel @ $60/barrel @ $30/barrel
Shale Oil Plays
0%
25%
50%
75%
100%
Figure 6: Reserves as % of Technically Recoverable (Dynamic Cost)
@ $30/barrel @ $60/barrel @ $90/barrel
Shale Oil Plays
Page 26
July 2017
22 Smith and Lee | U.S. Energy Information Administration | This paper is released to encourage discussion and critical comment. The analysis and conclusions expressed here are those of the authors and not necessarily those of the U.S. Energy Information Administration.
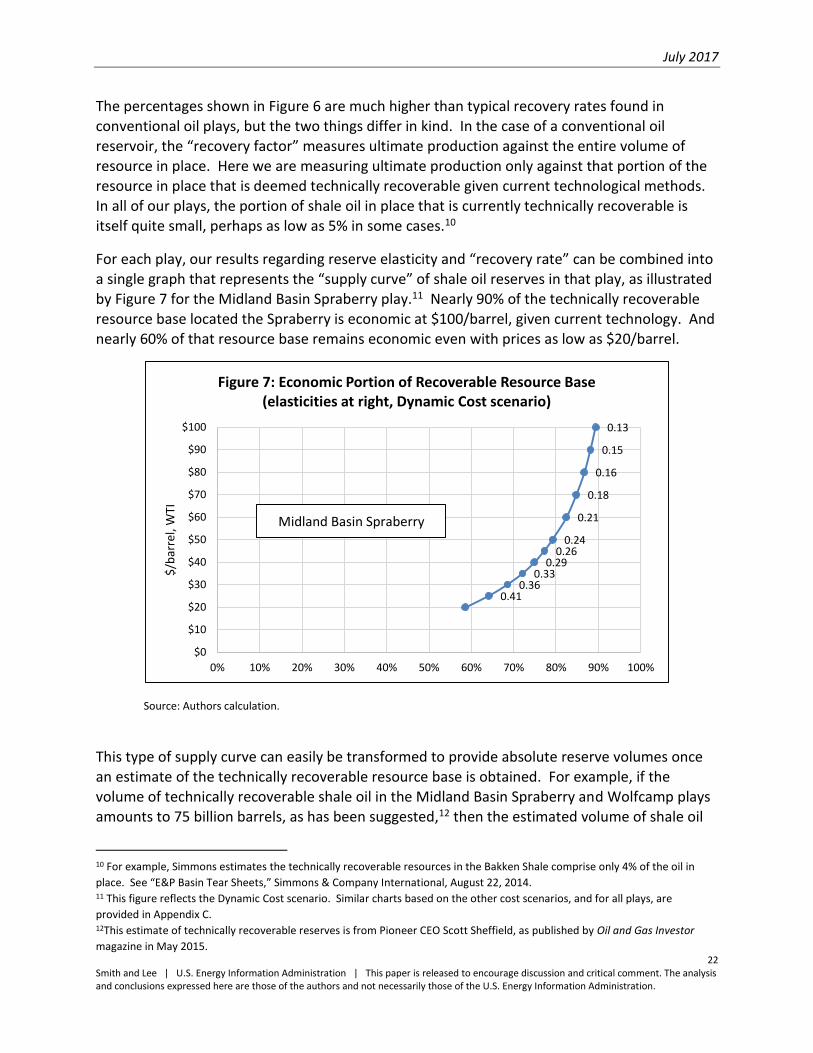
The percentages shown in Figure 6 are much higher than typical recovery rates found in conventional oil plays, but the two things differ in kind. In the case of a conventional oil reservoir, the “recovery factor” measures ultimate production against the entire volume of resource in place. Here we are measuring ultimate production only against that portion of the resource in place that is deemed technically recoverable given current technological methods. In all of our plays, the portion of shale oil in place that is currently technically recoverable is itself quite small, perhaps as low as 5% in some cases.10
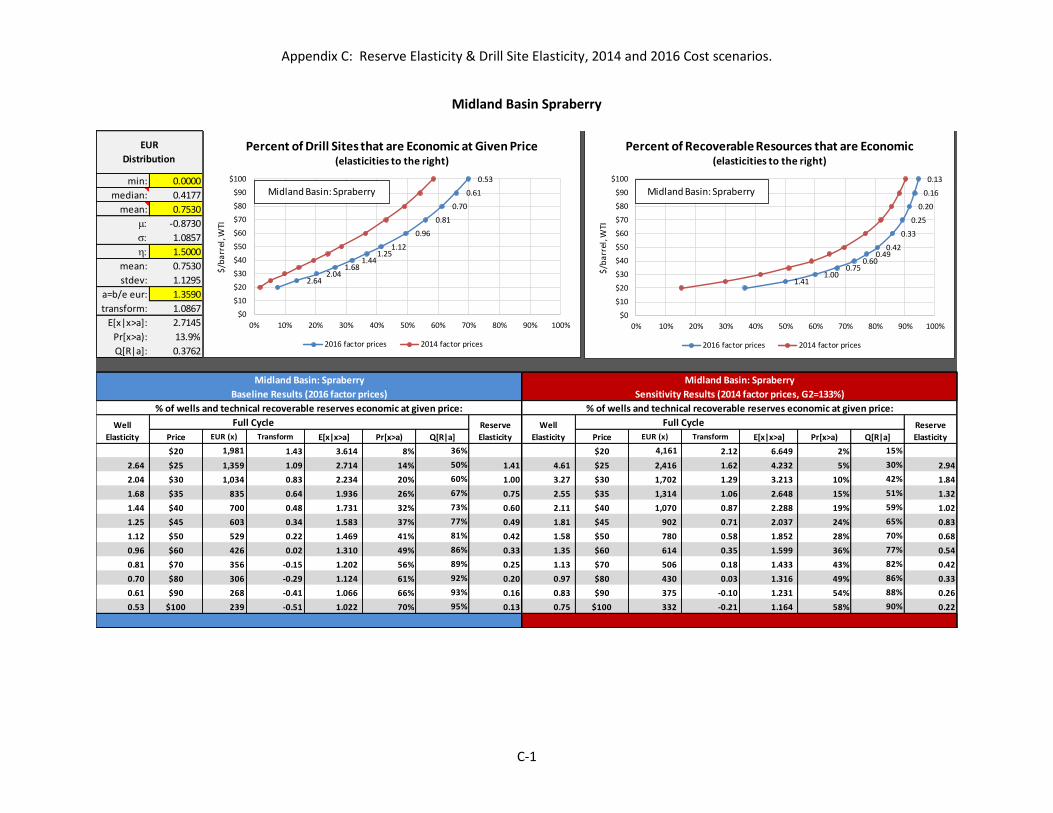
For each play, our results regarding reserve elasticity and “recovery rate” can be combined into a single graph that represents the “supply curve” of shale oil reserves in that play, as illustrated by Figure 7 for the Midland Basin Spraberry play.11 Nearly 90% of the technically recoverable
resource base located the Spraberry is economic at $100/barrel, given current technology. And nearly 60% of that resource base remains economic even with prices as low as $20/barrel.
Source: Authors calculation.
This type of supply curve can easily be transformed to provide absolute reserve volumes once
an estimate of the technically recoverable resource base is obtained. For example, if the volume of technically recoverable shale oil in the Midland Basin Spraberry and Wolfcamp plays amounts to 75 billion barrels, as has been suggested,12 then the estimated volume of shale oil
10 For example, Simmons estimates the technically recoverable resources in the Bakken Shale comprise only 4% of the oil in
place. See “E&P Basin Tear Sheets,” Simmons & Company International, August 22, 2014. 11 This figure reflects the Dynamic Cost scenario. Similar charts based on the other cost scenarios, and for all plays, are
provided in Appendix C. 12This estimate of technically recoverable reserves is from Pioneer CEO Scott Sheffield, as published by Oil and Gas Investor
magazine in May 2015.
0.41
0.360.33
0.290.26
0.24
0.21
0.18
0.16
0.15
0.13
$0
$10
$20
$30
$40
$50
$60
$70
$80
$90
$100
0% 10% 20% 30% 40% 50% 60% 70% 80% 90% 100%
$/b
arre
l, W
TI
Figure 7: Economic Portion of Recoverable Resource Base(elasticities at right, Dynamic Cost scenario)
Midland Basin Spraberry
Page 27
July 2017
23 Smith and Lee | U.S. Energy Information Administration | This paper is released to encourage discussion and critical comment. The analysis and conclusions expressed here are those of the authors and not necessarily those of the U.S. Energy Information Administration.
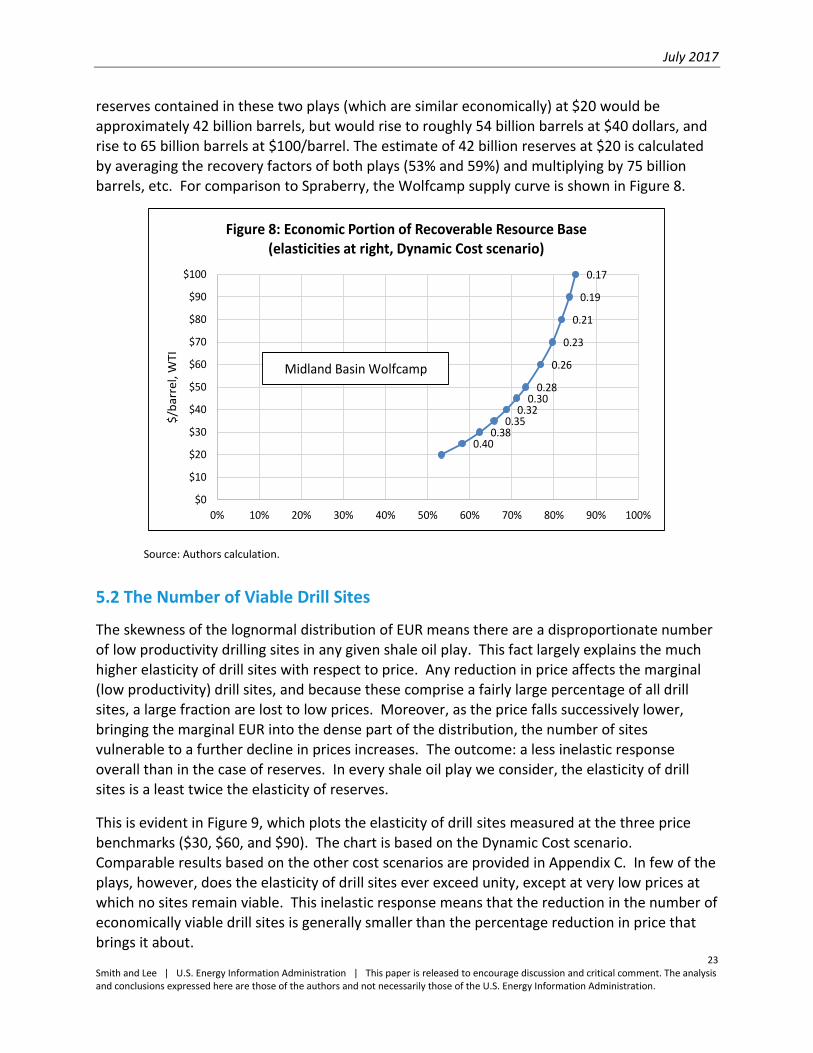
reserves contained in these two plays (which are similar economically) at $20 would be approximately 42 billion barrels, but would rise to roughly 54 billion barrels at $40 dollars, and rise to 65 billion barrels at $100/barrel. The estimate of 42 billion reserves at $20 is calculated by averaging the recovery factors of both plays (53% and 59%) and multiplying by 75 billion barrels, etc. For comparison to Spraberry, the Wolfcamp supply curve is shown in Figure 8.
Source: Authors calculation.
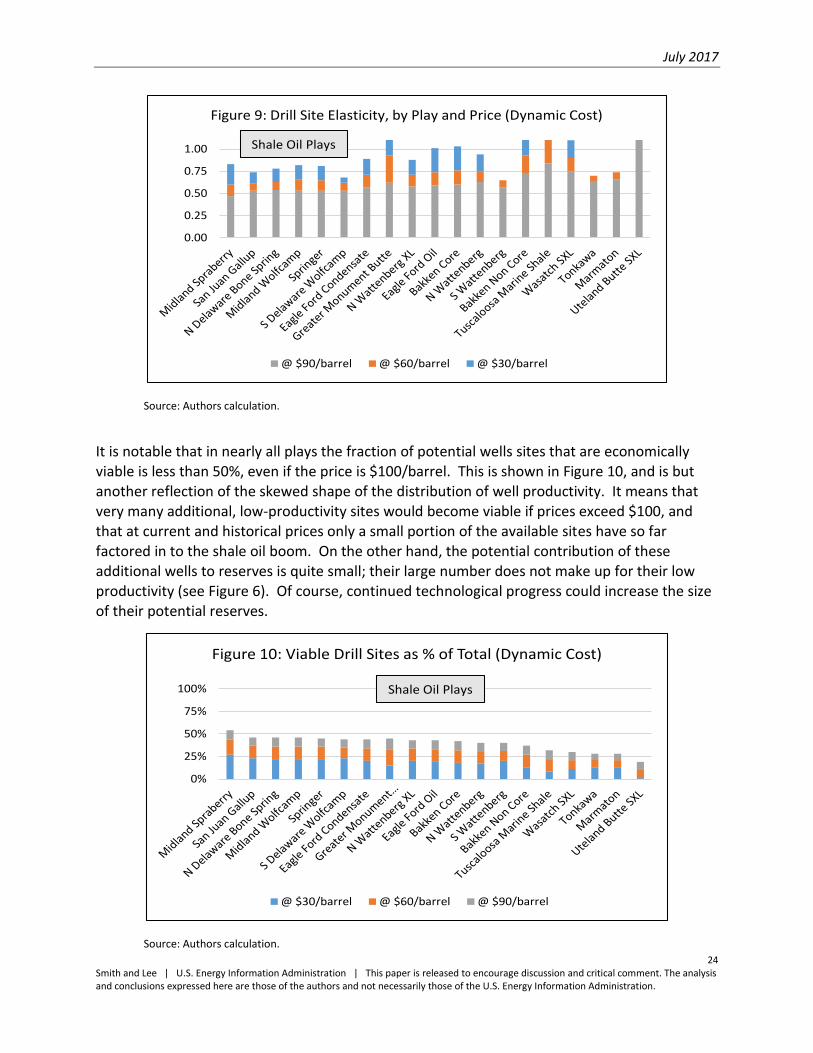
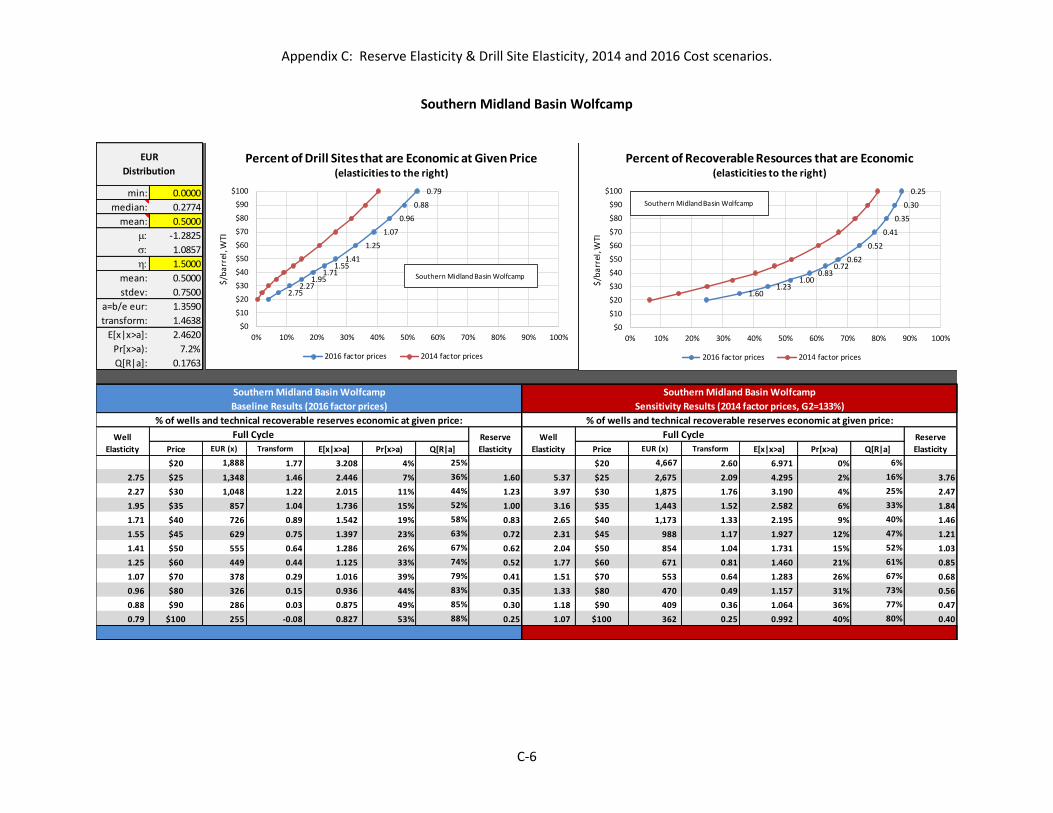
5.2 The Number of Viable Drill Sites
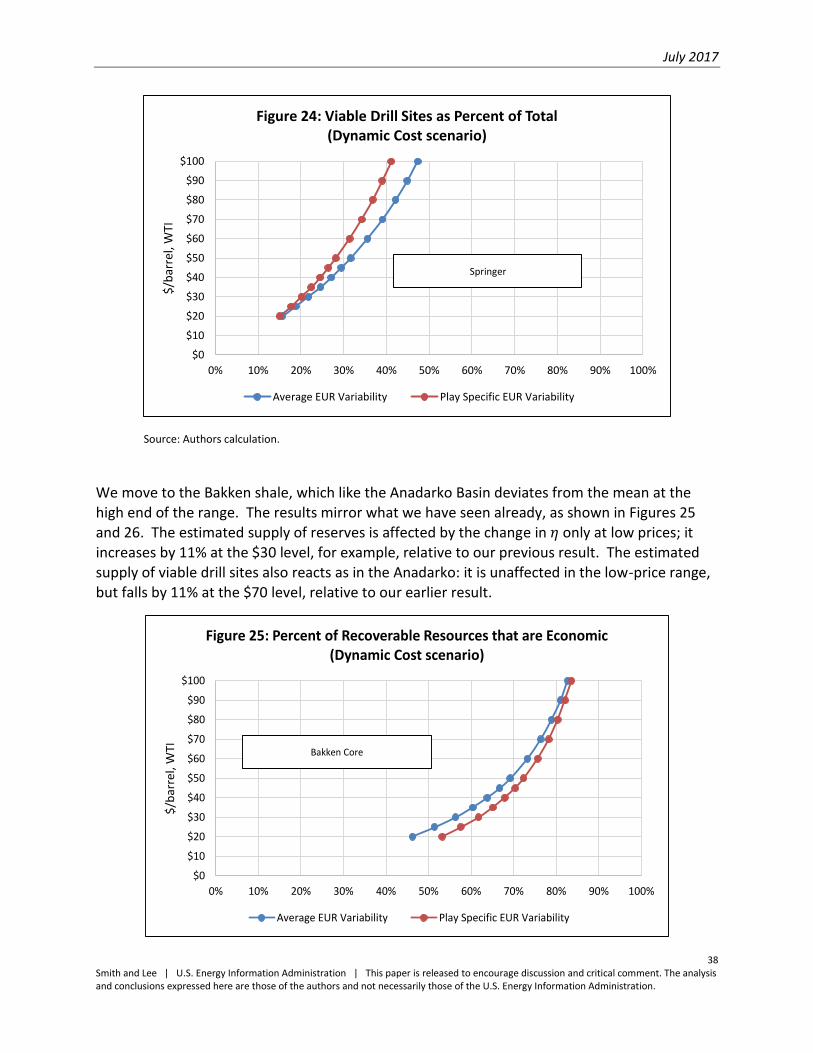
The skewness of the lognormal distribution of EUR means there are a disproportionate number of low productivity drilling sites in any given shale oil play. This fact largely explains the much higher elasticity of drill sites with respect to price. Any reduction in price affects the marginal (low productivity) drill sites, and because these comprise a fairly large percentage of all drill sites, a large fraction are lost to low prices. Moreover, as the price falls successively lower, bringing the marginal EUR into the dense part of the distribution, the number of sites vulnerable to a further decline in prices increases. The outcome: a less inelastic response
overall than in the case of reserves. In every shale oil play we consider, the elasticity of drill sites is a least twice the elasticity of reserves.
This is evident in Figure 9, which plots the elasticity of drill sites measured at the three price benchmarks ($30, $60, and $90). The chart is based on the Dynamic Cost scenario. Comparable results based on the other cost scenarios are provided in Appendix C. In few of the plays, however, does the elasticity of drill sites ever exceed unity, except at very low prices at which no sites remain viable. This inelastic response means that the reduction in the number of economically viable drill sites is generally smaller than the percentage reduction in price that brings it about.
0.40
0.380.35
0.320.30
0.28
0.26
0.23
0.21
0.19
0.17
$0
$10
$20
$30
$40
$50
$60
$70
$80
$90
$100
0% 10% 20% 30% 40% 50% 60% 70% 80% 90% 100%
$/b
arre
l, W
TI
Figure 8: Economic Portion of Recoverable Resource Base(elasticities at right, Dynamic Cost scenario)
Midland Basin Wolfcamp
Page 28
July 2017
24 Smith and Lee | U.S. Energy Information Administration | This paper is released to encourage discussion and critical comment. The analysis and conclusions expressed here are those of the authors and not necessarily those of the U.S. Energy Information Administration.
Source: Authors calculation.
It is notable that in nearly all plays the fraction of potential wells sites that are economically viable is less than 50%, even if the price is $100/barrel. This is shown in Figure 10, and is but another reflection of the skewed shape of the distribution of well productivity. It means that very many additional, low-productivity sites would become viable if prices exceed $100, and that at current and historical prices only a small portion of the available sites have so far
factored in to the shale oil boom. On the other hand, the potential contribution of these additional wells to reserves is quite small; their large number does not make up for their low productivity (see Figure 6). Of course, continued technological progress could increase the size of their potential reserves.
Source: Authors calculation.
0.00
0.25
0.50
0.75
1.00
Figure 9: Drill Site Elasticity, by Play and Price (Dynamic Cost)
@ $90/barrel @ $60/barrel @ $30/barrel
Shale Oil Plays
0%
25%
50%
75%
100%
Figure 10: Viable Drill Sites as % of Total (Dynamic Cost)
@ $30/barrel @ $60/barrel @ $90/barrel
Shale Oil Plays
Page 29
July 2017
25 Smith and Lee | U.S. Energy Information Administration | This paper is released to encourage discussion and critical comment. The analysis and conclusions expressed here are those of the authors and not necessarily those of the U.S. Energy Information Administration.
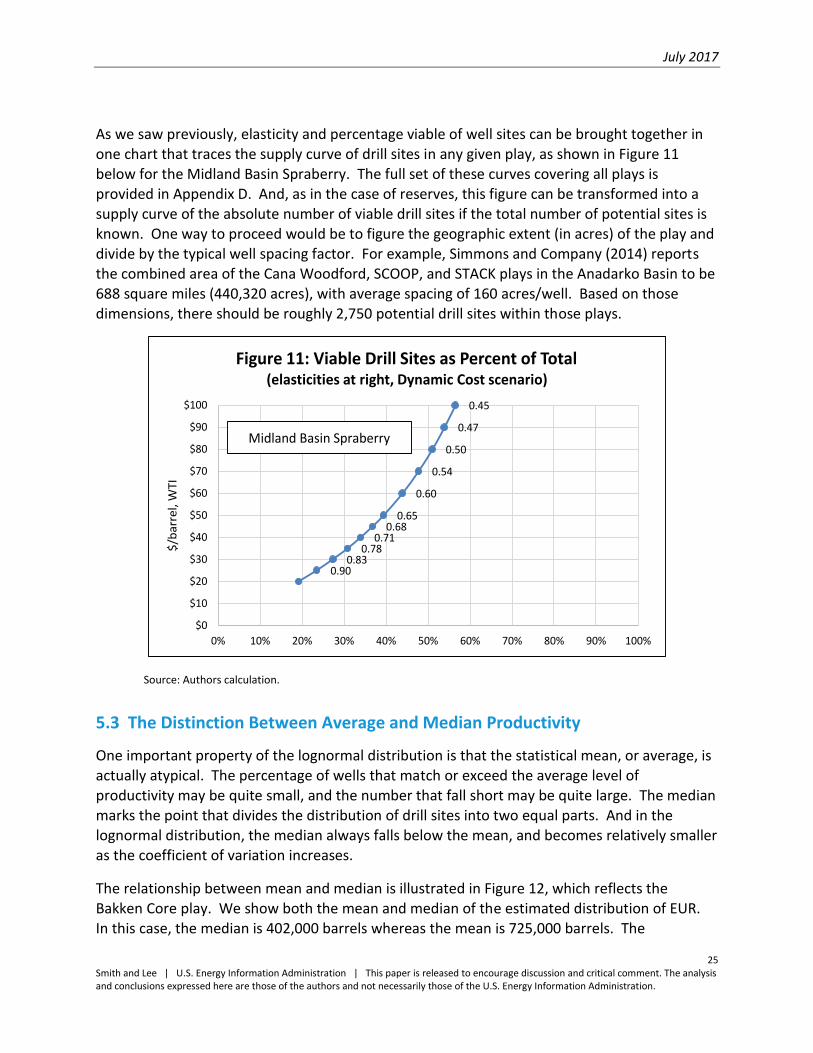
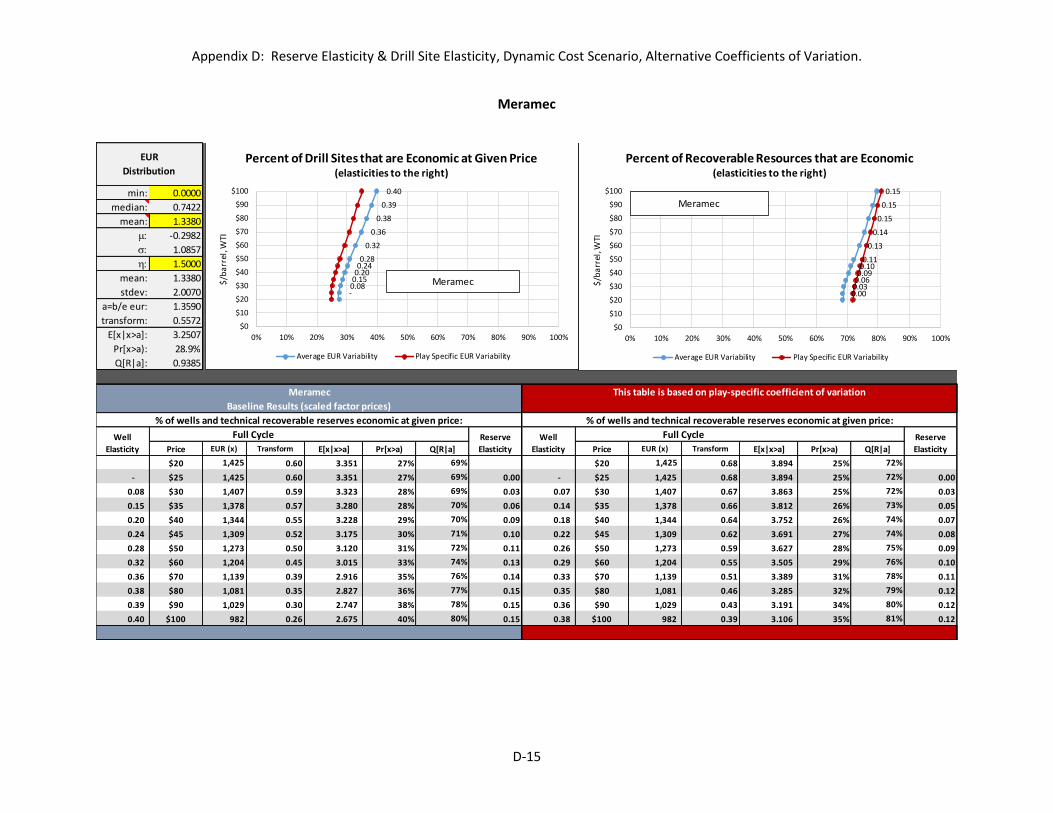
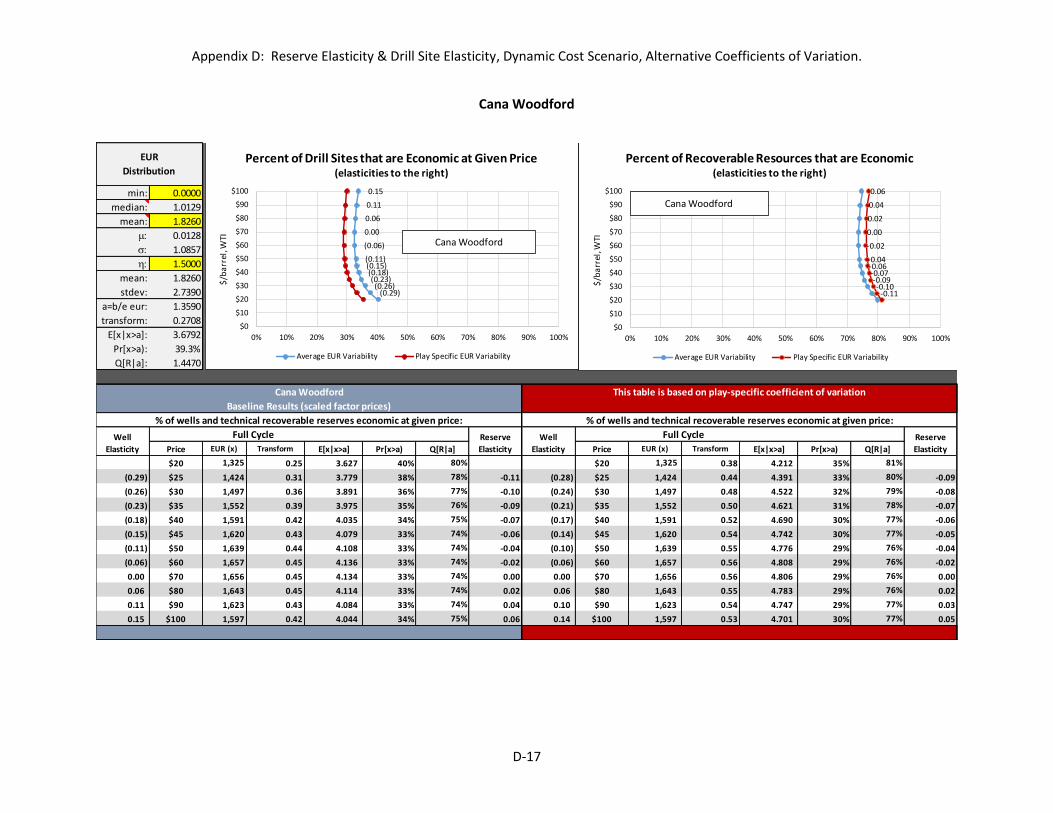
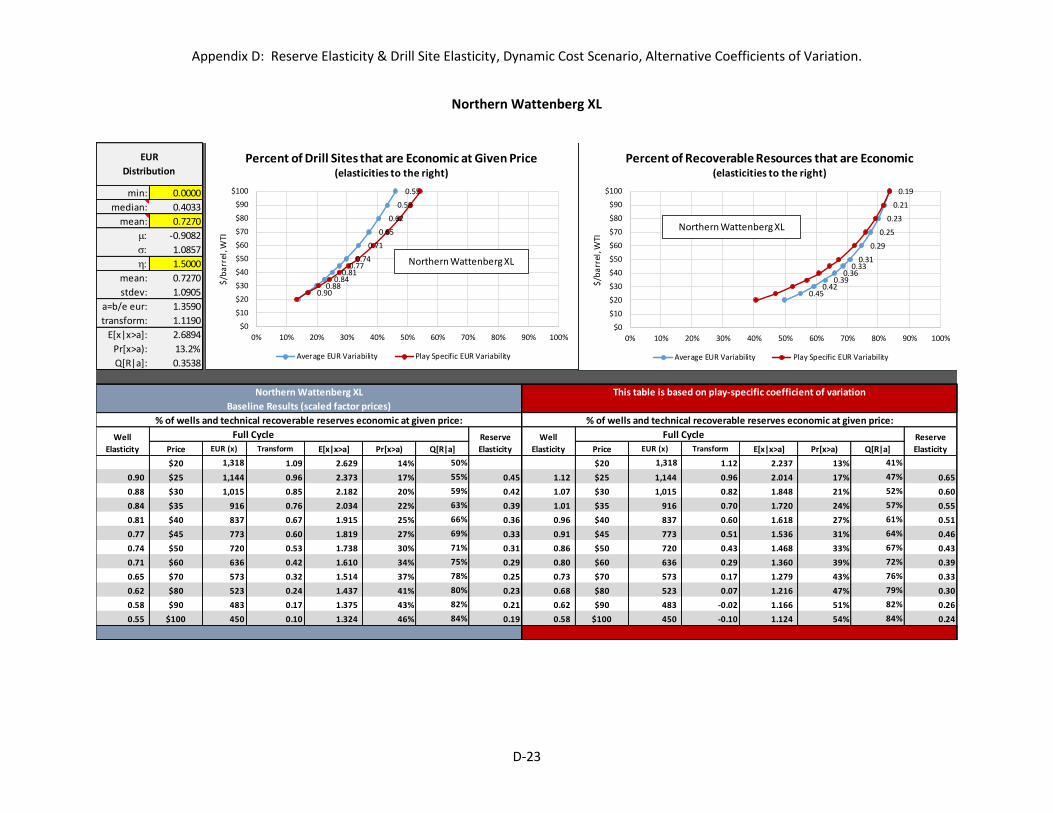
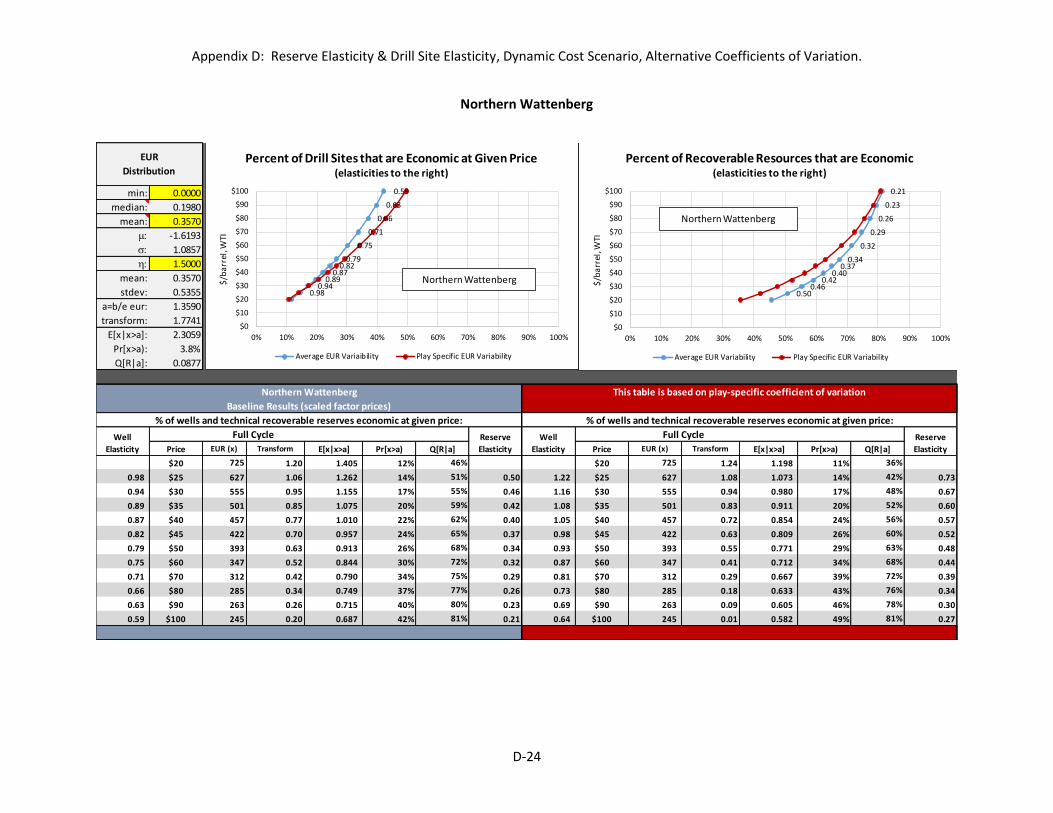
As we saw previously, elasticity and percentage viable of well sites can be brought together in one chart that traces the supply curve of drill sites in any given play, as shown in Figure 11 below for the Midland Basin Spraberry. The full set of these curves covering all plays is provided in Appendix D. And, as in the case of reserves, this figure can be transformed into a supply curve of the absolute number of viable drill sites if the total number of potential sites is known. One way to proceed would be to figure the geographic extent (in acres) of the play and divide by the typical well spacing factor. For example, Simmons and Company (2014) reports the combined area of the Cana Woodford, SCOOP, and STACK plays in the Anadarko Basin to be 688 square miles (440,320 acres), with average spacing of 160 acres/well. Based on those dimensions, there should be roughly 2,750 potential drill sites within those plays.
Source: Authors calculation.
5.3 The Distinction Between Average and Median Productivity
One important property of the lognormal distribution is that the statistical mean, or average, is
actually atypical. The percentage of wells that match or exceed the average level of productivity may be quite small, and the number that fall short may be quite large. The median marks the point that divides the distribution of drill sites into two equal parts. And in the lognormal distribution, the median always falls below the mean, and becomes relatively smaller as the coefficient of variation increases.
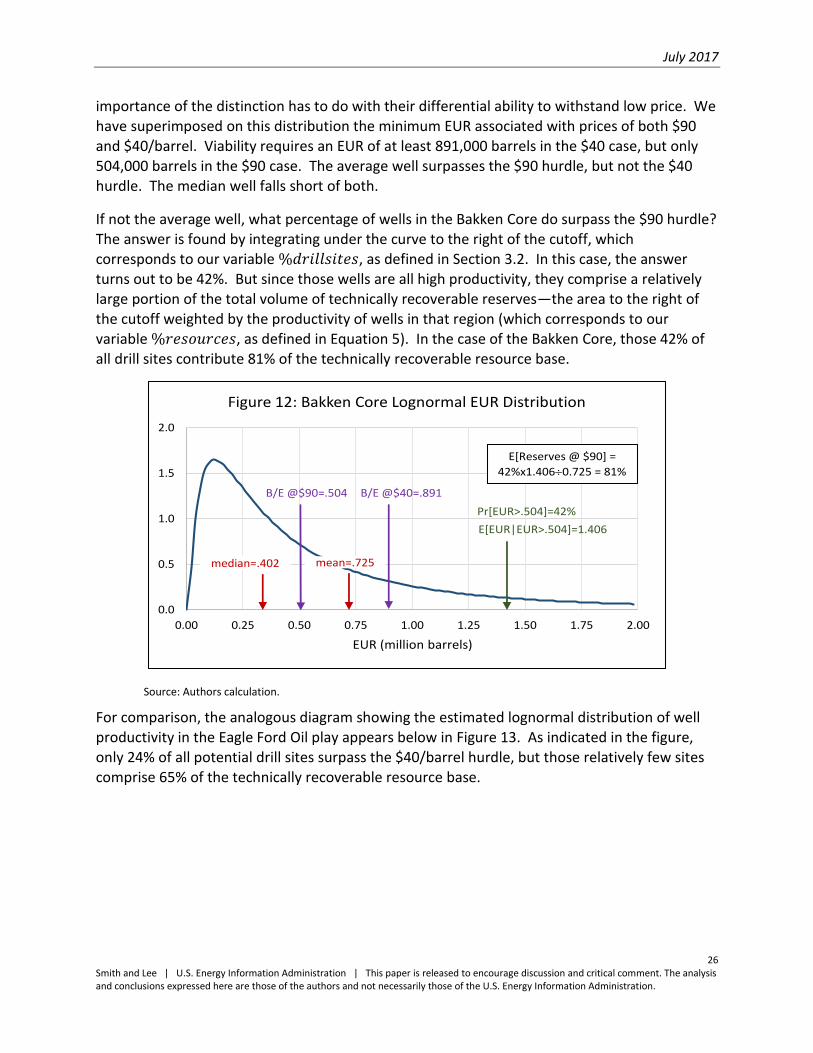
The relationship between mean and median is illustrated in Figure 12, which reflects the Bakken Core play. We show both the mean and median of the estimated distribution of EUR. In this case, the median is 402,000 barrels whereas the mean is 725,000 barrels. The
0.90
0.83 0.78
0.71 0.68
0.65
0.60
0.54
0.50
0.47
0.45
$0
$10
$20
$30
$40
$50
$60
$70
$80
$90
$100
0% 10% 20% 30% 40% 50% 60% 70% 80% 90% 100%
$/b
arre
l, W
TI
Figure 11: Viable Drill Sites as Percent of Total(elasticities at right, Dynamic Cost scenario)
Midland Basin Spraberry
Page 30
July 2017
26 Smith and Lee | U.S. Energy Information Administration | This paper is released to encourage discussion and critical comment. The analysis and conclusions expressed here are those of the authors and not necessarily those of the U.S. Energy Information Administration.
importance of the distinction has to do with their differential ability to withstand low price. We have superimposed on this distribution the minimum EUR associated with prices of both $90 and $40/barrel. Viability requires an EUR of at least 891,000 barrels in the $40 case, but only 504,000 barrels in the $90 case. The average well surpasses the $90 hurdle, but not the $40 hurdle. The median well falls short of both.
If not the average well, what percentage of wells in the Bakken Core do surpass the $90 hurdle? The answer is found by integrating under the curve to the right of the cutoff, which corresponds to our variable %𝑑𝑟𝑖𝑙𝑙𝑠𝑖𝑡𝑒𝑠, as defined in Section 3.2. In this case, the answer turns out to be 42%. But since those wells are all high productivity, they comprise a relatively large portion of the total volume of technically recoverable reserves—the area to the right of
the cutoff weighted by the productivity of wells in that region (which corresponds to our variable %𝑟𝑒𝑠𝑜𝑢𝑟𝑐𝑒𝑠, as defined in Equation 5). In the case of the Bakken Core, those 42% of all drill sites contribute 81% of the technically recoverable resource base.
Source: Authors calculation.
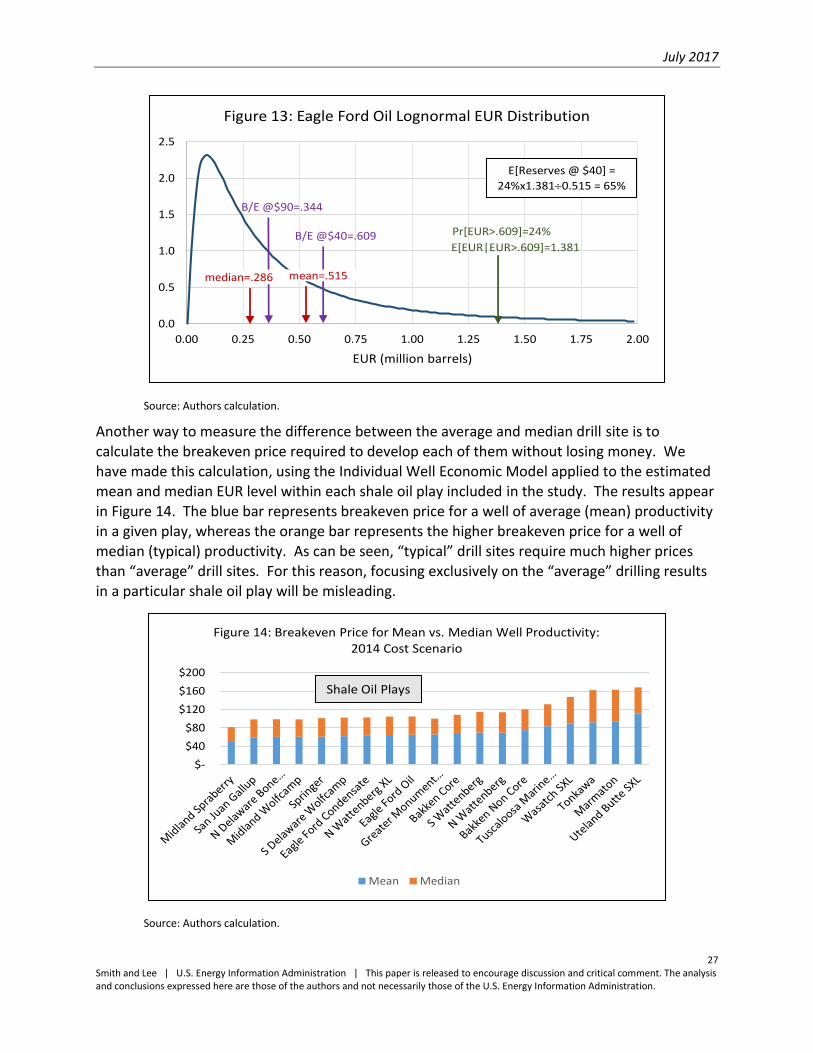
For comparison, the analogous diagram showing the estimated lognormal distribution of well productivity in the Eagle Ford Oil play appears below in Figure 13. As indicated in the figure, only 24% of all potential drill sites surpass the $40/barrel hurdle, but those relatively few sites
comprise 65% of the technically recoverable resource base.
0.0
0.5
1.0
1.5
2.0
0.00 0.25 0.50 0.75 1.00 1.25 1.50 1.75 2.00
EUR (million barrels)
Figure 12: Bakken Core Lognormal EUR Distribution
mean=.725median=.402
B/E @$40=.891B/E @$90=.504
E[EUR|EUR>.504]=1.406
Pr[EUR>.504]=42%
E[Reserves @ $90] =
42%x1.4060.725 = 81%
Page 31
July 2017
27 Smith and Lee | U.S. Energy Information Administration | This paper is released to encourage discussion and critical comment. The analysis and conclusions expressed here are those of the authors and not necessarily those of the U.S. Energy Information Administration.
Source: Authors calculation.
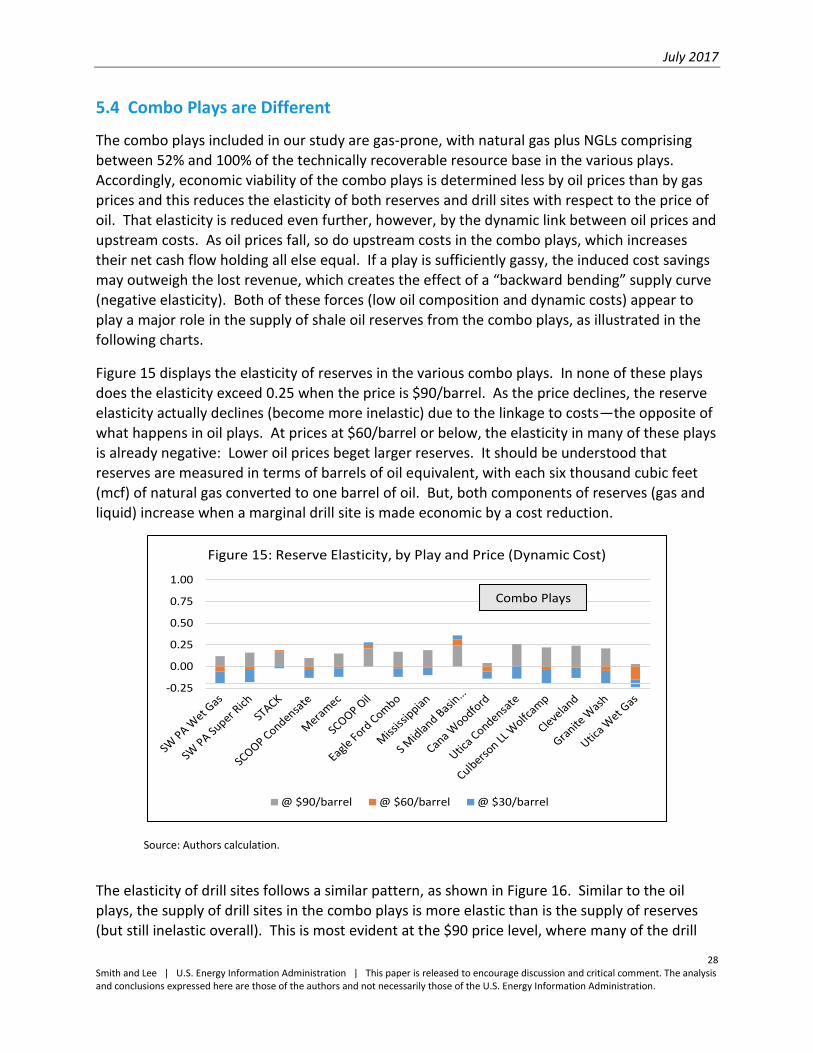
Another way to measure the difference between the average and median drill site is to calculate the breakeven price required to develop each of them without losing money. We have made this calculation, using the Individual Well Economic Model applied to the estimated mean and median EUR level within each shale oil play included in the study. The results appear in Figure 14. The blue bar represents breakeven price for a well of average (mean) productivity in a given play, whereas the orange bar represents the higher breakeven price for a well of
median (typical) productivity. As can be seen, “typical” drill sites require much higher prices than “average” drill sites. For this reason, focusing exclusively on the “average” drilling results in a particular shale oil play will be misleading.
Source: Authors calculation.
0.0
0.5
1.0
1.5
2.0
2.5
0.00 0.25 0.50 0.75 1.00 1.25 1.50 1.75 2.00
EUR (million barrels)
Figure 13: Eagle Ford Oil Lognormal EUR Distribution
mean=.515median=.286
B/E @$40=.609
B/E @$90=.344
E[EUR|EUR>.609]=1.381
Pr[EUR>.609]=24%
E[Reserves @ $40] =
24%x1.3810.515 = 65%
$-
$40
$80
$120
$160
$200
Figure 14: Breakeven Price for Mean vs. Median Well Productivity: 2014 Cost Scenario
Mean Median
Shale Oil Plays
Page 32
July 2017
28 Smith and Lee | U.S. Energy Information Administration | This paper is released to encourage discussion and critical comment. The analysis and conclusions expressed here are those of the authors and not necessarily those of the U.S. Energy Information Administration.
5.4 Combo Plays are Different
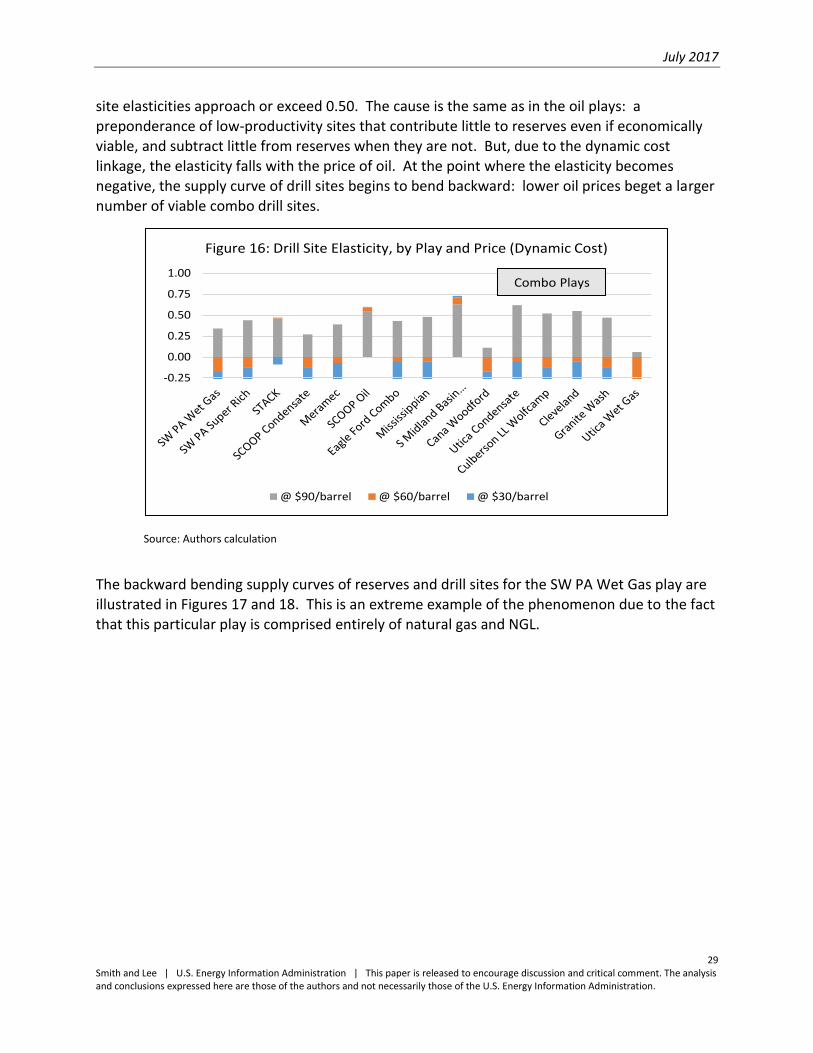
The combo plays included in our study are gas-prone, with natural gas plus NGLs comprising between 52% and 100% of the technically recoverable resource base in the various plays. Accordingly, economic viability of the combo plays is determined less by oil prices than by gas prices and this reduces the elasticity of both reserves and drill sites with respect to the price of oil. That elasticity is reduced even further, however, by the dynamic link between oil prices and upstream costs. As oil prices fall, so do upstream costs in the combo plays, which increases their net cash flow holding all else equal. If a play is sufficiently gassy, the induced cost savings may outweigh the lost revenue, which creates the effect of a “backward bending” supply curve (negative elasticity). Both of these forces (low oil composition and dynamic costs) appear to
play a major role in the supply of shale oil reserves from the combo plays, as illustrated in the following charts.
Figure 15 displays the elasticity of reserves in the various combo plays. In none of these plays does the elasticity exceed 0.25 when the price is $90/barrel. As the price declines, the reserve elasticity actually declines (become more inelastic) due to the linkage to costs—the opposite of what happens in oil plays. At prices at $60/barrel or below, the elasticity in many of these plays is already negative: Lower oil prices beget larger reserves. It should be understood that reserves are measured in terms of barrels of oil equivalent, with each six thousand cubic feet (mcf) of natural gas converted to one barrel of oil. But, both components of reserves (gas and liquid) increase when a marginal drill site is made economic by a cost reduction.
Source: Authors calculation.
The elasticity of drill sites follows a similar pattern, as shown in Figure 16. Similar to the oil plays, the supply of drill sites in the combo plays is more elastic than is the supply of reserves (but still inelastic overall). This is most evident at the $90 price level, where many of the drill
-0.25
0.00
0.25
0.50
0.75
1.00
Figure 15: Reserve Elasticity, by Play and Price (Dynamic Cost)
@ $90/barrel @ $60/barrel @ $30/barrel
Combo Plays
Page 33
July 2017
29 Smith and Lee | U.S. Energy Information Administration | This paper is released to encourage discussion and critical comment. The analysis and conclusions expressed here are those of the authors and not necessarily those of the U.S. Energy Information Administration.
site elasticities approach or exceed 0.50. The cause is the same as in the oil plays: a preponderance of low-productivity sites that contribute little to reserves even if economically viable, and subtract little from reserves when they are not. But, due to the dynamic cost linkage, the elasticity falls with the price of oil. At the point where the elasticity becomes negative, the supply curve of drill sites begins to bend backward: lower oil prices beget a larger number of viable combo drill sites.
Source: Authors calculation
The backward bending supply curves of reserves and drill sites for the SW PA Wet Gas play are illustrated in Figures 17 and 18. This is an extreme example of the phenomenon due to the fact that this particular play is comprised entirely of natural gas and NGL.
-0.25
0.00
0.25
0.50
0.75
1.00
Figure 16: Drill Site Elasticity, by Play and Price (Dynamic Cost)
@ $90/barrel @ $60/barrel @ $30/barrel
Combo Plays
Page 34
July 2017
30 Smith and Lee | U.S. Energy Information Administration | This paper is released to encourage discussion and critical comment. The analysis and conclusions expressed here are those of the authors and not necessarily those of the U.S. Energy Information Administration.
Source: Authors calculation.
Source: Authors calculation.
The impact of the cost linkage can be gauged by comparing the two previous charts to the alternative results derived for the same play but on the assumption that costs remain fixed at the 2016 level as the oil price is varied (2016 Cost scenario), as shown in Figures 19 and 20.
-0.10
-0.08-0.05-0.020.010.03
0.06
0.09
0.11
0.12
0.13
$0
$10
$20
$30
$40
$50
$60
$70
$80
$90
$100
0% 10% 20% 30% 40% 50% 60% 70% 80% 90% 100%
$/b
arre
l, W
TI
Figure 17: Percent of Recoverable Resources that are Economic(elasticities at right, Dynamic Cost scenario)
SW PA Wet Gas
(0.27)
(0.20)(0.12)(0.05)0.02 0.08
0.16
0.24
0.30
0.34
0.37
$0
$10
$20
$30
$40
$50
$60
$70
$80
$90
$100
0% 10% 20% 30% 40% 50% 60% 70% 80% 90% 100%
$/b
arre
l, W
TI
Figure 18: Viable Drill Sites as Percent of Total(elasticities at right, Dynamic Cost scenario)
SW PA Wet Gas
Page 35
July 2017
31 Smith and Lee | U.S. Energy Information Administration | This paper is released to encourage discussion and critical comment. The analysis and conclusions expressed here are those of the authors and not necessarily those of the U.S. Energy Information Administration.
Source: Authors calculation.
Source: Authors calculation.
5.5 Resilience of Drilled but not Completed Wells (DUCs)
The individual well economic model was also applied to evaluate the profitability of completing pre-drilled wells. The cost of drilling the well is treated as a sunk cost and excluded from the calculation. The lead time to first production is also reduced by time saved through pre-drilling.
0.75
0.630.54
0.460.41
0.36
0.31
0.25
0.21
0.17
0.15
$0
$10
$20
$30
$40
$50
$60
$70
$80
$90
$100
0% 10% 20% 30% 40% 50% 60% 70% 80% 90% 100%
$/b
arre
l, W
TI
Figure 19: Percent of Recoverable Reserves that are Economic(elasticities at right, 2016 Cost scenario)
SW PA Wet Gas
1.51
1.35 1.22
1.11 1.03
0.96
0.86
0.76
0.68
0.61
0.55
$0
$10
$20
$30
$40
$50
$60
$70
$80
$90
$100
0% 10% 20% 30% 40% 50% 60% 70% 80% 90% 100%
$/b
arre
l, W
TI
Figure 20: Viable Drill Sites as Percent of Total(elasticities at right, 2016 Cost scenario)
SW PA Wet Gas
Page 36
July 2017
32 Smith and Lee | U.S. Energy Information Administration | This paper is released to encourage discussion and critical comment. The analysis and conclusions expressed here are those of the authors and not necessarily those of the U.S. Energy Information Administration.
The objective of the analysis is to identify the breakeven price that justifies the incremental cost of completing the DUC; i.e., the minimum oil price that is consistent with nonnegative NPV.
To create a benchmark, we assume that 50% of the total capital cost of drilling and completion is sunk. However, in many cases the cost of drilling could be lower and the remaining cost of completion higher than we have assumed.13 The actual percentage varies among wells depending on the design of the well.
Because the NPV of a well depends on its productivity, so does the breakeven price for each DUC vary with the productivity of the drill site in question. For each shale oil play, we have therefore calculated two breakeven prices: one based on average well productivity (EUR) and one based on median well productivity within the play. The results appear in Figures 21
(average productivity wells) and 22 (median productivity wells). Breakeven prices required to recover the full cost of drilling and completing an average well vary across the shale oil plays
between roughly $50 and $100/barrel (2014 Cost scenario). In contrast, the price required to recover the incremental cost to complete a DUC well is considerably lower, ranging roughly from $35 to $75/barrel. On average, across all oil plays, the breakeven price for a DUC of average productivity is 39% below the breakeven price for a new well. For wells with completion costs that exceed 50% of total capital expenditure, breakeven prices would be higher, but still substantially below the threshold for a new well.
Breakeven prices for median wells are much higher due to their lower productivity, as seen in Figure 22. The breakeven price to recover the full cost of a new well of median productivity
varies across plays from roughly $80 to $170/barrel. Breakeven cost to recover the incremental portion of this cost varies between roughly $50 and $100/barrel. Across all these combo plays, the breakeven price for a median DUC is 43% below the breakeven cost for a new well of similar productivity.
13Cowan provides a detailed breakdown of expenditure on a typical Eagle Ford well that puts completion costs at 62% of the
total. See Trey Cowan, “Costs for Drilling the Eagle Ford,” Rigzone (online), June 20, 2011. A more recent analysis by
Bloomberg Intelligence that encompasses the Eagle Ford and Permian Basins sees completion costs at 70% of the total. See
Bloomberg Intelligence, “Break-even model: Cracking the Shale Enigma,” (online) February 8, 2016.
Page 37
July 2017
33 Smith and Lee | U.S. Energy Information Administration | This paper is released to encourage discussion and critical comment. The analysis and conclusions expressed here are those of the authors and not necessarily those of the U.S. Energy Information Administration.
Source: Authors calculation.
Source: Authors calculation.
It seems unlikely that many median productivity sites would have been chosen for pre-drilling. They would have faced a breakeven price above $100 at the initial investment stage, which would have been a strong deterrent. In contrast, average productivity sites would have represented a much better gamble, with breakeven prices in many plays in the $65/barrel range at the initial investment stage. We strongly suspect, therefore, that Figure 21 paints a current picture of the inventory of DUCs that presently exist. However, this estimate of the number of DUCs could be substantially different from other existing sources because of differences in methodology and operational assumptions as pointed by EIA (EIA 2016).
$0
$20
$40
$60
$80
$100
$120
Figure 21: Breakeven Price, Full Cycle vs. DUC (2014 Cost)
DUC Full Cycle
Shale Oil Plays: Average Wells
$0$25$50$75
$100$125$150$175
Figure 22: Breakeven Price, Full Cycle vs. DUC (2014 Cost)
DUC Full Cycle
Shale Oil Plays: Median Wells
Page 38
July 2017
34 Smith and Lee | U.S. Energy Information Administration | This paper is released to encourage discussion and critical comment. The analysis and conclusions expressed here are those of the authors and not necessarily those of the U.S. Energy Information Administration.
Fortunately, from September 2016, EIA started to provide estimates of the number of DUCs in different regions using a consistent methodology and uniform assumptions.14 Going forward, one may use this information as a benchmark when estimating of the number of DUCs.
Nonetheless, we make no presumption, regarding either DUCs or new wells, that operators will invest as soon as the market price attains the breakeven level. There are several reasons why they might not, including insufficient funding, physical bottlenecks, etc. Even in the absence of such constraints, however, operators may delay investment hoping for even better prices in the future. The timing of irreversible investments like the drilling of an oil well should, in theory, be guided by the principle of real options.15 And, in practice, there is considerable evidence that drilling decisions in Texas have been in accord with the tenets of real option theory.16
Consequently, the breakeven prices shown in Figures 21 and 22 should not be viewed as trigger prices that will automatically release investment once the threshold is attained. What really matters is that, consistent with real option theory, the threshold prices that would trigger investments in DUCs must be proportionately lower than the threshold price to drill a new well.
5.6 The Impact of Low Prices on Mature Shale Oil Wells
Mature producing wells shut down once production has declined to the point where sales revenue fails to cover variable expense. Low prices reduce sales revenue, of course, and therefore advance the date of abandonment, which causes some recoverable oil to be left behind. We have used the individual well economic model to measure the potential size of this effect as it applies to the shale oil plays included in our study. The results show that although
low prices may shorten the life of some shale oil wells by several years, this has a negligible impact on remaining reserves.
Table 4 provides some indicative results for the Delaware Bone Spring play in the Permian Basin. The table shows, for wells of varying productivity and different prices, time at which net cash flow becomes negative. The months of “lost production” reported in the table are measured relative to a natural life of 30 years. Thus, with an oil price of $40, a 250,000 EUR well in the Bone Spring would be shut in after 257 months of production—103 months early. It requires a combination of very lowest well productivity and very lowest price level to generate this type of effect. After capital costs have been sunk, and because variable operating costs are low, maintaining positive net operating cash flow is not a high bar. Many of these wells can
produce profitably for thirty years even at very low prices. A Bone Spring well with 1,000,000 EUR, for example, would remain in production the full 30 years, even at $40.
14 For more its methodological details, see https://www.eia.gov/petroleum/drilling/pdf/duc_supplement.pdf. 15 James L. Paddock, Daniel R. Siegel, and James L. Smith, “Option Valuation of Claims on Real Assets: The Case of Offshore
Petroleum Leases,” Quarterly Journal of Economics, August, 1988. 16 Ryan Kellogg, “The Effect of Uncertainty on Investment: Evidence from Texas Oil Drilling,” American Economic Review, June,
2014.
Page 39
July 2017
35 Smith and Lee | U.S. Energy Information Administration | This paper is released to encourage discussion and critical comment. The analysis and conclusions expressed here are those of the authors and not necessarily those of the U.S. Energy Information Administration.
The loss of 103 months of production may seem significant, but it is not. Given the decline rate of shale oil wells, production that occurs at the tail end does not amount to much. As a percentage of the total reserves of the well, the loss is negligible. Table 4 illustrates this for the Bone Spring play. The cumulative production lost due to abandoning 103 months early amounts to only 4% of the potential remaining reserves. In making this calculation, we assume the well has already produced for three years (it is mature), and the 4% loss is relative to the remaining volume of future production (i.e., remaining reserves). That volume of lost production would constitute an even smaller portion of the well’s initial reserves.
Similar tables showing months of lost production and tail-end recovery factors for all shale oil and combo plays are provided in Appendix F.
5.7 Sensitivity of Results to the Coefficient of Variation in Well Productivity
All results presented thus far were based on a common coefficient of variation (𝜂 = 1.50), assumed to be the same in each play. This particular value was derived as the overall average
19 $20 $30 $40 $50 $60 $70 $80 $90 $100
100 216 192 173 158 146 135 126 117 110
250 146 122 103 88 76 65 56 47 40
500 93 69 50 35 23 12 3 0 0
750 62 38 19 4 0 0 0 0 0
1,000 40 16 0 0 0 0 0 0 0
1,250 23 0 0 0 0 0 0 0 0
1,500 9 0 0 0 0 0 0 0 0
1,750 0 0 0 0 0 0 0 0 0
2,000 0 0 0 0 0 0 0 0 0
Oil Price ($/barrel)
EUR
(1
00
0 b
arre
ls/w
ell)
Northern Delaware Basin: Bone Spring
Table 4: Months of Lost Production, Dynamic Cost Scenario
100% $20 $30 $40 $50 $60 $70 $80 $90 $100
100 76% 83% 87% 89% 91% 93% 94% 94% 95%
250 91% 94% 96% 97% 97% 98% 98% 99% 99%
500 96% 98% 99% 99% 99% 100% 100% 100% 100%
750 98% 99% 100% 100% 100% 100% 100% 100% 100%
1,000 99% 100% 100% 100% 100% 100% 100% 100% 100%
1,250 99% 100% 100% 100% 100% 100% 100% 100% 100%
1,500 100% 100% 100% 100% 100% 100% 100% 100% 100%
1,750 100% 100% 100% 100% 100% 100% 100% 100% 100%
2,000 100% 100% 100% 100% 100% 100% 100% 100% 100%
Northern Delaware Basin: Bone Spring
Table 5: Tail End Recovery Factor, Dynamic Cost Scenario
Oil Price ($/barrel)
EUR
(1
00
0 b
arre
ls/w
ell)
Page 40
July 2017
36 Smith and Lee | U.S. Energy Information Administration | This paper is released to encourage discussion and critical comment. The analysis and conclusions expressed here are those of the authors and not necessarily those of the U.S. Energy Information Administration.
of the twenty plays assessed by USGS.17 As discussed in Section 3.2, we have tested the robustness of our conclusions by introducing variation in the assumed value of 𝜂 across plays. Specifically, where our plays and the USGS assessment units overlap in the same petroleum basin, we apply to our plays the average coefficient of variation derived just from those USGS assessments taken from the relevant basin.
Table 6 compares the overall average with the basin-specific coefficients of variation constructed in this way. There is considerable variation across basins. The greatest disparity is seen in the Permian Basin, where the coefficient of variation is well below average. At the other extreme are the Anadarko/MidContinent and Williston (Bakken) Basins, where the coefficients of variation are well above average. The Eagle Ford Basin falls close to the overall
average. In some of the basins, there is little or no overlap between our plays and the USGS. For example, the Anadarko/MidContinent Basin, which encompasses eleven plays in our study, is represented by a single assessment unit (Woodford Shale Oil) in the USGS analysis. The Permian Basin, which encompasses six plays in our study, is also represented by a single assessment unit (Spraberry). Therefore, the most we can hope to learn from this sensitivity analysis is whether variations in 𝜂 of the magnitude suggested by the USGS assessments really matter, and if so, how our conclusions might be affected.
We begin by reviewing sensitivity results for the Springer shale oil play in the Anadarko Basin, where the basin-specific coefficient of variation (1.991) most exceeds the overall average
(1.50). After updating the analysis of Springer accordingly, we find that the supply curves of reserves and drill sites are affected by this change, but only to a limited degree. The impact of higher variation in well productivity on the supply curve of reserves is shown in Figure 23. Above $70/barrel, the volume of reserves is hardly affected. But at $30/barrel, the estimated volume of reserves is about 8% higher than our earlier result.
17 A detailed explanation of the process used by USGS to fitting the lognormal distribution to their data, along with some
alternatives, is presented in Appendix G.
Petroleum Basin
Basin Average
Coefficient of
Variation
Anadarko/MidContinent 1.991
Bakken 1.970
Denver/Julesburg 1.082
Eagle Ford 1.620
Permian 0.805
Overall Average 1.500
Table 6: Regional Coefficients of Variation
Page 41
July 2017
37 Smith and Lee | U.S. Energy Information Administration | This paper is released to encourage discussion and critical comment. The analysis and conclusions expressed here are those of the authors and not necessarily those of the U.S. Energy Information Administration.
Source: Authors calculation.
The supply curve of drill sites is more sensitive to variations in 𝜂 and follows a different pattern, as shown in Figure 24. At $30/barrel, the estimated number of viable wells is hardly affected by the change in coefficient of variation, but at $70, it is about 15% higher than our earlier result.
One may ask, if the number of wells viable at $70 has risen, why does the volume of reserves not also increase relative to our earlier result? This might look like a contradiction or error, but it is neither. Although the number of wells is greater, they belong to a different distribution (one with greater variability, same mean, but lower median) and do not therefore automatically boost the volume of reserves.
$0
$10
$20
$30
$40
$50
$60
$70
$80
$90
$100
0% 10% 20% 30% 40% 50% 60% 70% 80% 90% 100%
$/b
arre
l, W
TI
Figure 23: Percent of Recoverable Resources that are Economic(Dynamic Cost scenario)
Average EUR Variability Play Specific EUR Variability
Springer
Page 42
July 2017
38 Smith and Lee | U.S. Energy Information Administration | This paper is released to encourage discussion and critical comment. The analysis and conclusions expressed here are those of the authors and not necessarily those of the U.S. Energy Information Administration.
Source: Authors calculation.
We move to the Bakken shale, which like the Anadarko Basin deviates from the mean at the high end of the range. The results mirror what we have seen already, as shown in Figures 25 and 26. The estimated supply of reserves is affected by the change in 𝜂 only at low prices; it
increases by 11% at the $30 level, for example, relative to our previous result. The estimated supply of viable drill sites also reacts as in the Anadarko: it is unaffected in the low-price range, but falls by 11% at the $70 level, relative to our earlier result.
$0
$10
$20
$30
$40
$50
$60
$70
$80
$90
$100
0% 10% 20% 30% 40% 50% 60% 70% 80% 90% 100%
$/b
arre
l, W
TI
Figure 24: Viable Drill Sites as Percent of Total(Dynamic Cost scenario)
Average EUR Variability Play Specific EUR Variability
Springer
$0
$10
$20
$30
$40
$50
$60
$70
$80
$90
$100
0% 10% 20% 30% 40% 50% 60% 70% 80% 90% 100%
$/b
arre
l, W
TI
Figure 25: Percent of Recoverable Resources that are Economic(Dynamic Cost scenario)
Average EUR Variability Play Specific EUR Variability
Bakken Core
Page 43
July 2017
39 Smith and Lee | U.S. Energy Information Administration | This paper is released to encourage discussion and critical comment. The analysis and conclusions expressed here are those of the authors and not necessarily those of the U.S. Energy Information Administration.
Source: Authors calculation.
Source: Authors calculation.
For the record, we present the sensitivity analysis also for the Eagle Ford shale, but since the play-specific coefficient of variation there (1.620) is close to the overall average, the estimated
supply curves of reserves and drill sites are hardly affected, as shown in Figures 27 and 28.
Source: Authors calculation.
$0
$10
$20
$30
$40
$50
$60
$70
$80
$90
$100
0% 10% 20% 30% 40% 50% 60% 70% 80% 90% 100%
$/b
arre
l, W
TI
Figure 26: Viable Drill Sites as Percent of Total(Dynamic Cost scenario)
Average EUR Variability Play Specific EUR Variability
Bakken Core
$0
$10
$20
$30
$40
$50
$60
$70
$80
$90
$100
0% 10% 20% 30% 40% 50% 60% 70% 80% 90% 100%
$/b
arre
l, W
TI
Figure 27: Percent of Recoverable Resources that are Economic(Dynamic Cost scenario)
Average EUR Variability Play Specific EUR Variability
Eagle Ford Oil Region
Page 44
July 2017
40 Smith and Lee | U.S. Energy Information Administration | This paper is released to encourage discussion and critical comment. The analysis and conclusions expressed here are those of the authors and not necessarily those of the U.S. Energy Information Administration.
Source: Authors calculation.
Whereas the Anadarko-specific coefficient of variation was one-third higher than the overall average, in the Denver-Julesburg Basin it is one-third lower. This difference produces a less skewed distribution with higher median. The impact on the estimated supply curves, not
surprisingly, runs in the opposite direction to the Anadarko, as shown in Figures 29 and 30 for the Northern Wattenberg play. At $70, the estimated volume of reserves falls by 4% relative to our previous result; at $30 it falls by 13%. The estimated number of viable drill sites is unaffected at $30, but at $70 it falls by 15% relative to our earlier results.
$0
$10
$20
$30
$40
$50
$60
$70
$80
$90
$100
0% 10% 20% 30% 40% 50% 60% 70% 80% 90% 100%
$/b
arre
l, W
TI
Figure 28: Viable Drill Sites as Percent of Total(Dynamic Cost scenario)
Average EUR Variability Play Specific EUR Variability
Eagle Ford Oil Region
Page 45
July 2017
41 Smith and Lee | U.S. Energy Information Administration | This paper is released to encourage discussion and critical comment. The analysis and conclusions expressed here are those of the authors and not necessarily those of the U.S. Energy Information Administration.
Sources: Authors calculation.
Source: Authors calculation
Last, we turn to the Permian Basin, where the play-specific coefficient of variation (0.805) is only about half the overall average (1.500). Here we find the largest impact relative to our earlier results. Inserting the lower coefficient of variation into the Midland Spraberry analysis leaves the estimated volume of reserves unchanged for an oil price of $70, but causes it to fall by 13% relative to our earlier results at the $30 level. The estimated number of viable well sites
$0
$10
$20
$30
$40
$50
$60
$70
$80
$90
$100
0% 10% 20% 30% 40% 50% 60% 70% 80% 90% 100%
$/b
arre
l, W
TI
Figure 29: Percent of Recoverable Resources that are Economic(Dynamic Cost scenario)
Average EUR Variability Play Specific EUR Variability
Northern Wattenberg
$0
$10
$20
$30
$40
$50
$60
$70
$80
$90
$100
0% 10% 20% 30% 40% 50% 60% 70% 80% 90% 100%
$/b
arre
l, W
TI
Figure 30: Viable Drill Sites as Percent of Total(Dynamic Cost scenario)
Average EUR Variability Play Specific EUR Variability
Northern Wattenberg
Page 46
July 2017
42 Smith and Lee | U.S. Energy Information Administration | This paper is released to encourage discussion and critical comment. The analysis and conclusions expressed here are those of the authors and not necessarily those of the U.S. Energy Information Administration.
is quite affected at all price levels: rising by 22% at the $30 level, and by 35% at the $70 level. The impact on estimated supply curves are illustrated in Figures 31 and 32.
Source: Authors calculation.
Source: Authors calculation.
$0
$10
$20
$30
$40
$50
$60
$70
$80
$90
$100
0% 10% 20% 30% 40% 50% 60% 70% 80% 90% 100%
$/b
arre
l, W
TI
Figure 31: Percent of Recoverable Resources that are Economic(Dynamic Cost scenario)
Average EUR Variability Play Specific EUR Variability
Midland Basin: Spraberry
$0
$10
$20
$30
$40
$50
$60
$70
$80
$90
$100
0% 10% 20% 30% 40% 50% 60% 70% 80% 90% 100%
$/b
arre
l, W
TI
Figure 32: Viable Drill Sites as Percent of Total(Dynamic Cost scenario)
Average EUR Variability Play Specific EUR Variability
Midland Basin: Spraberry
Page 47
July 2017
43 Smith and Lee | U.S. Energy Information Administration | This paper is released to encourage discussion and critical comment. The analysis and conclusions expressed here are those of the authors and not necessarily those of the U.S. Energy Information Administration.
6. Limitations of the Study and Suggestions for Further Research
Technology in the shale oil industry will continue to evolve. The industry is young and still discovering numerous innovations that may increase the productivity of individual wells. For example, recent experiments with extended reach laterals (see the “XL” designation appended to some of our play names) have increased the EUR of individual wells directly, by exposing the well bore to more of the resource. Although this innovation does not increase the total volume of technically recoverable resources within the play, it does reduce the density of wells and increases their average productivity.
If we may assume that such technical innovations increase the productivity of all potential drill
sites in the play by the same proportion, then the standard deviation of EUR within the play would increase by the same percentage as the mean, but the coefficient of variation would remain constant. Our model is well able to incorporate the impact of this type of “neutral”
technical change. One need only estimate the extent to which technological change has increased average productivity, update the parameters of the lognormal distribution to reflect this change, and repeat the analysis that has been outlined in this report.
Technical change may also change the cost of individual wells. Cost may rise (as in the case of extended laterals) or fall (due to enhanced efficiencies). In either case, the individual well economic model can accommodate these changes directly via a corresponding revision to the cost inputs.
Our knowledge of the variability of well productivity within a play is also likely to increase as the USGS continues with its series of geological assessments. Although we have indicated that moderate deviations from the “typical” coefficient of variation have relatively small impacts on our results, large deviations do appear to have a material impact, especially in a low-price environment. If more precise play-specific estimates of the coefficient of variation become available through the ongoing research of USGS, our analysis should be updated to incorporate them. Again, this type of updating can be accomplished directly, simply by substituting the new coefficients of variation in place of the old. The most recent USGS assessments may also shed further light on differences in average well productivity across plays, and that information could also be incorporated directly—although the rapid pace of technical change in this industry may cause the USGS estimates always to lag somewhat behind.
Apart from the USGS research program, it may also be possible to learn more about the variation in productivity across the population of potential drill sites within a given play applying particular statistical techniques to the subpopulation of existing wells. Estimates of the size distribution of conventional oil reservoirs have been developed based on the principle of “sampling without replacement and proportional to size.”18 Similar techniques could
18 See, for example, James L. Smith, “A Probabilistic Model of Oil Discovery,” Review of Economics and Statistics, November,
1980; and G. Andreatta and G. M. Kaufman, “Estimation of Finite Population Properties When Sampling is Without
Replacement and Proportional to Magnitude,” Journal of the American Statistical Association, September 1986.
Page 48
July 2017
44 Smith and Lee | U.S. Energy Information Administration | This paper is released to encourage discussion and critical comment. The analysis and conclusions expressed here are those of the authors and not necessarily those of the U.S. Energy Information Administration.
perhaps be applied to estimate the distribution of EUR from which existing shale oil wells were sampled—but this goes well beyond the scope of the present model.
Page 49
July 2017
45 Smith and Lee | U.S. Energy Information Administration | This paper is released to encourage discussion and critical comment. The analysis and conclusions expressed here are those of the authors and not necessarily those of the U.S. Energy Information Administration.
References
Addison, Velda (2016). “U.S. Tight Oil Wins on Lower Global Cost Curve,” E&P Magazine, Harts Energy, July 13 (http://www.epmag.com/report-us-tight-oil-wins-lower-global-cost-curve-1019126#p=full).
Agerton, Mark, Peter Hartley, Kenneth B. Medlock III, and Ted Temzelides (2015). “Employment Impacts of Upstream Oil and Gas Investment in the United States,” working paper no. 15/28. Washington: International Monetary Fund.
Aitchison, J. and A. C. Brown (1966). The Lognormal Distribution, Cambridge University Press.
Allais, Maurice (1957). “Method of Appraising Economic Prospects of Mining Exploration over Large Territories: Algerian Sahara Case Study,” Management Science, 3(4): 285-347.
Anderson, Soren T., Ryan Kellogg, and Stephen W. Salant (2016). “Hotelling Under Pressure,” Journal of Political Economy, forthcoming.
Browning, John, et al. (2013a). “Study Develops Decline Analysis, Geologic Parameters for Reserves, Production Forecast,” Oil and Gas Journal, August 5, pp. 62-73.
Browning, John, et al. (2013b). “Barnett Study Determines Full-Field Reserves, Production Forecast,” Oil and Gas Journal, September 2, pp. 88-95.
Browning, John, et al. (2014). “Study Develops Fayetteville Shale Reserves, Production Forecast,” Oil and Gas Journal, January 6, pp. 64-73.
Browning, John, et al. (2015). “Study Forecasts Gradual Haynesville Production Recovery Before Final Decline,” Oil and Gas Journal, December 7, pp. 64-71.
Congressional Budget Office (2014). “The Economic and Budgetary Effects of Producing Oil and Natural Gas from Shale,” Washington.
Cook, Troy (2015). “The Resource Hierarchy Relationship,” U.S. Energy Information Administration Working Paper Series, September 27.
Covert, Thomas (2015). “Experiential and Social Learning in Firms: The Case of Hydraulic Fracturing in the Bakken Shale,” Working Paper, Energy Policy Institute and Department of Economics, University of Chicago.
Fitzgerald, Timothy (2015). “Experiential Gains with a New Technology: An Empirical Investigation of Hydraulic Fracturing," Agricultural and Resource Economics Review, 44(2): 83-105.
Gaswirth, Stephanie, et al. (2016). “Assessment of undiscovered continuous oil resources in the Wolfcamp shale of the Midland Basin, Permian Basin Province, Texas, 2016,” U.S.
Page 50
July 2017
46 Smith and Lee | U.S. Energy Information Administration | This paper is released to encourage discussion and critical comment. The analysis and conclusions expressed here are those of the authors and not necessarily those of the U.S. Energy Information Administration.
Geological Survey Fact Sheet 2016–3092 (https://pubs.er.usgs.gov/publication/fs20163092).
Hausman, Catherine and Ryan Kellogg (2015). “Welfare and Distributional Implications of Shale Gas,” Brookings Papers on Economic Activity, Spring.
Ikonnikova, Svetlana, and Gürcan Gülen (2015). “Impact of Low Prices on Shale Gas Production Strategies,” The Energy Journal, vol. 36, Special Issue 1.
Ikonnikova, Svetlana, et al. (2015). “Factors Influencing Shale Gas Production Forecasting: Empirical Studies of Barnett, Fayetteville, Haynesville, and Marcellus Shale Plays,” Economics of Energy & Environmental Policy, 4(1): 19-35.
Kaufman, Gordon M., Y. Balcer, and D. Kruyt (1975). “A Probabilistic Model of Oil and Gas Discovery,” in (J.D. Haun, ed.), Methods of Estimating the volume of Undiscovered Oil and Gas Resources, (Studies in Geology No. 1), American Association of Petroleum Geologists, Tulsa, OK, pp. 113-142.
Kellogg, Ryan (2011) “Learning by Drilling: Inter-Firm Learning and Relationship Persistence in the Texas Oilpatch,” Quarterly Journal of Economics, 26, pp. 1961-2004.
Kilian, Lutz (2014a). “The Impact of the Shale Oil Revolution on U.S. Oil and Gasoline Prices,” working paper no. 499, Frankfurt, Germany: Center for Financial Studies.
Kilian, Lutz (2014b). “Oil Price Shocks: Causes and Consequences,” Annual Review of Resource Economics, 6, pp. 133-154.
Kleinberg, Robert L., Sergey Paltsev, Charles K. Ebinger, and David Hobbs (2016). “Tight Oil Development Economics: Benchmarks, Breakeven Points, and Inelasticities,” CEEPR WP 2016-012, Massachusetts Institute of Technology.
Mason, Charles, Lucija Muehlenbachs, and Sheila Olmstead (2014). “The Economics of Shale Gas Development,” RFF Discussion Paper no. 14-42-REV. Washington: Resources for the Future.
Newell, Richard G., and Daniel Raimi (2014). “Implications of Shale Gas Development for Climate Change,” Environmental Science and Technology, 48:15, pp. 8306-8308.
Newell, Richard G., Brian C. Prest, and Ashley Vissing (2016). “Trophy Hunting vs. Manufacturing Energy: The Price Responsiveness of Shale Gas,” NBER Working Paper 22532, August, National Bureau of Economic Research.
Oil & Gas 360 (2016). “Median Breakeven Price for Oil is $55 per Barrel,” May 23 (http://www.oilandgas360.com/median-breakeven-price-oil-55-per-barrel-gas-3-50-per-mcfe-klr/).
Page 51
July 2017
47 Smith and Lee | U.S. Energy Information Administration | This paper is released to encourage discussion and critical comment. The analysis and conclusions expressed here are those of the authors and not necessarily those of the U.S. Energy Information Administration.
Osmundsen, Petter, Knut Einar Rosendahl, and Terje Skjerpen (2015). “Understanding Rig Rate Formation in the Gulf of Mexico,” Energy Economics, 49, pp. 430-439.
Petroleum Intelligence Weekly (2015a). “Shale Producers Eye Risky Ramp-Up,” April 27.
Petroleum Intelligence Weekly (2015b). “Pundits Skeptical Over Fresh Fall in Oil Prices,” October 12.
Petroleum Intelligence Weekly (2016a). “Bankruptcies May Spell End for Some Shale Plays,” February 1.
Petroleum Intelligence Weekly (2016b). “Have Operators Made Sustainable Cost Savings?” Sept.
12.
Robinson, Joan (1941). “Rising Supply Price,” Economica, 8(29): 1-8.
Rystad Energy (2016). “Average Shale Wellhead Breakeven Prices are Below $40/bbl.,” Press Release, July 28 (http://www.rystadenergy.com/NewsEvents/PressReleases/shale-well-breakeven).
Sheehan, Chris (2016). “Proppant: Secure or Scare?” Oil and Gas Investor, 36(9): 60-61.
Simmons & Company International (2015). “U.S. Well Economics,” Houston, TX, August.
Smith, James L. and Geoffrey L. Ward (1981). “Maximum Likelihood Estimates of the Size
Distribution of North Sea Oil Fields,” Mathematical Geology, 13(5); 399-413.
Toews, Gerhard, and Alexander Naumov (2015). “The Relationship Between Oil Price and Costs in the Oil Industry,” The Energy Journal, 36(Special Issue 1): 237-254.
U.S. Energy Information Administration (2015). “Assumptions to the Annual Energy Outlook 2015,” September.
U.S. Energy Information Administration (2016). “EIA Estimates of Drilled but Uncompleted Wells (DUCs),” September.
U.S. Geological Survey (2012). “Variability of Distributions of Well-Scale Estimated Ultimate Recovery for Continuous (Unconventional) Oil and Gas Resources in the United States,”
Open-File Report 2012-1118, U.S. Department of the Interior.
U.S. Geological Survey (2013). “Assessment of Undiscovered Oil Resources in the Bakken and Three Forks Formations, Williston Basin Province, Montana, North Dakota, and South Dakota, 2013,” Fact Sheet 2013-3013, April.
Page 52
Appendix A: Minimum EUR as function of price, 2014 and 2016 Cost scenarios.
A-1
Midland Basin Spraberry
100% oilfield service & supply factor price scalar
$6.50 cost/well ($mm) IP EUR 30 days/month
529 EUR/well (mboe) 825 753 -1.03% exponential decline rate after year 3 (monthly)
-65% 1st yr decline -8.4% 286 $50.00 oil price WTI ($/bbl)
-37% 2nd yr decline -3.8% 179 0% oil price appreciation (per month) Price EUR IP EUR IP Price EUR IP EUR IP
-24% 3rd yr decline -2.3% 156 $3.50 gas price Henry Hub ($/mcf) $20 1,981 2,170 983 1,077 $20 4,161 4,559 2065 2,262
580 IP rate (boe/d) 0% gas price appreciation $25 1,359 1,489 675 740 $25 2,416 2,647 1199 1,314
$7.00 opex-LOE ($/boe) 30% NGL price/oil price (fixed ratio) $30 1,034 1,133 514 563 $30 1,702 1,865 845 926
76% % oil 0.68% discount rate (compound monthly) $35 835 915 415 455 $35 1,314 1,440 652 714
12% % gas 8.5% discount rate (annual) $40 700 767 349 382 $40 1,070 1,172 531 582
12% % NGL 80% intangible drilling cost / total capex $45 603 661 300 329 $45 902 988 448 491
20.0% royalty rate 1.096 IP/EUR ratio, (B8/B4 = fixed ratio) $50 529 580 264 289 $50 780 855 388 425
4.6% oil prod tax $60 426 467 212 232 $60 614 673 305 334
7.5% gas prod tax $70 356 390 178 195 $70 506 554 252 276
7.5% NGL prod tax -$0.004 = NPV/well ($ million) $80 306 335 153 168 $80 430 471 214 234
35.0% income tax rate 0 = EUR check (mboe) $90 268 294 134 147 $90 375 411 187 205
-5% oil differential 0.68% = ATIRR (monthly) $100 239 262 120 131 $100 332 364 165 181
-5% gas differential 8.48% = ATIRR (annual)
0 1 = DUC 529 = total production (mboe)
25% auxillary cost/well cost $3.081 = "tail end" NPV/well ($ million)
50% completion cost/well cost 100% = "tail end" recovery factor
$2,000 min opex ($/month) 0 = months of lost production
Per Well Net Cash Flow Analysis
mcf/d AT NPV Active
Month Well Cost Aux. Cost Total Oil NGL Gas Gas Prod Oil/bbl NGL/bbl Gas/mcf Oil Rev Gas Rev NGL Rev Royalty Oil Tax Gas Tax NGL Tax Opex Depeciation Tax. Inc. Income Tax NCF PV Factor -$4 1/0
1 $1,625 $406 $47.50 $14.25 $3.33 $1,625.000 -$1,625.00 -$568.750 -1,463 1.000 -$1,462.50
2 $1,625 $406 $47.50 $14.25 $3.33 $1,625.000 -$1,625.00 -$568.750 -1,463 0.993 -$1,452.59
3 $1,625 $406 $47.50 $14.25 $3.33 $1,625.000 -$1,625.00 -$568.750 -1,463 0.986 -$1,442.75
4 $1,625 $406 $47.50 $14.25 $3.33 $1,625.000 -$1,625.00 -$568.750 -1,463 0.980 -$1,432.97
5 580 440 70 70 417 $47.50 $14.25 $3.33 $627.687 $41.626 $29.733 $139.81 $23.10 $2.50 $1.78 $121.712 $13.542 $396.602 $138.811 $271.333 0.973 $264.054 1
6 531 403 64 64 382 $47.50 $14.25 $3.33 $574.649 $38.108 $27.220 $127.995 $21.147 $2.286 $1.633 $111.428 $13.542 $361.946 $126.681 $248.806 0.967 $240.491 1
7 486 369 58 58 350 $47.50 $14.25 $3.33 $526.092 $34.888 $24.920 $117.180 $19.360 $2.093 $1.495 $102.012 $13.542 $330.218 $115.576 $228.183 0.960 $219.063 1
8 445 338 53 53 320 $47.50 $14.25 $3.33 $481.638 $31.940 $22.814 $107.279 $17.724 $1.916 $1.369 $93.392 $13.542 $301.171 $105.410 $209.303 0.954 $199.576 1
9 407 309 49 49 293 $47.50 $14.25 $3.33 $440.941 $29.241 $20.887 $98.214 $16.227 $1.754 $1.253 $85.501 $13.542 $274.578 $96.102 $192.018 0.947 $181.853 1
10 373 283 45 45 268 $47.50 $14.25 $3.33 $403.682 $26.771 $19.122 $89.915 $14.856 $1.606 $1.147 $78.276 $13.542 $250.233 $87.581 $176.193 0.941 $165.736 1
11 341 259 41 41 246 $47.50 $14.25 $3.33 $369.572 $24.508 $17.506 $82.317 $13.600 $1.471 $1.050 $71.662 $13.542 $227.944 $79.781 $161.705 0.934 $151.078 1
12 312 237 37 37 225 $47.50 $14.25 $3.33 $338.344 $22.438 $16.027 $75.362 $12.451 $1.346 $0.962 $65.607 $13.542 $207.539 $72.639 $148.442 0.928 $137.746 1
13 286 217 34 34 206 $47.50 $14.25 $3.33 $309.755 $20.542 $14.673 $68.994 $11.399 $1.232 $0.880 $60.063 $13.542 $188.858 $66.100 $136.300 0.922 $125.622 1
14 262 199 31 31 189 $47.50 $14.25 $3.33 $283.581 $18.806 $13.433 $63.164 $10.436 $1.128 $0.806 $54.988 $13.542 $171.756 $60.115 $125.183 0.915 $114.594 1
15 240 182 29 29 173 $47.50 $14.25 $3.33 $259.619 $17.217 $12.298 $57.827 $9.554 $1.033 $0.738 $50.342 $13.542 $156.099 $54.635 $115.006 0.909 $104.565 1
16 219 167 26 26 158 $47.50 $14.25 $3.33 $237.682 $15.762 $11.259 $52.940 $8.747 $0.946 $0.676 $46.088 $13.542 $141.764 $49.618 $105.689 0.903 $95.442 1
17 211 160 25 25 152 $47.50 $14.25 $3.33 $228.579 $15.158 $10.827 $50.913 $8.412 $0.910 $0.650 $44.323 $13.542 $135.817 $47.536 $101.822 0.897 $91.328 1
18 203 154 24 24 146 $47.50 $14.25 $3.33 $219.825 $14.578 $10.413 $48.963 $8.090 $0.875 $0.625 $42.625 $13.542 $130.096 $45.534 $98.104 0.891 $87.397 1
19 195 148 23 23 141 $47.50 $14.25 $3.33 $211.406 $14.020 $10.014 $47.088 $7.780 $0.841 $0.601 $40.993 $13.542 $124.595 $43.608 $94.529 0.885 $83.641 1
20 188 143 23 23 135 $47.50 $14.25 $3.33 $203.310 $13.483 $9.630 $45.285 $7.482 $0.809 $0.578 $39.423 $13.542 $119.305 $41.757 $91.090 0.879 $80.052 1
21 181 137 22 22 130 $47.50 $14.25 $3.33 $195.523 $12.966 $9.262 $43.550 $7.195 $0.778 $0.556 $37.913 $13.542 $114.217 $39.976 $87.783 0.873 $76.623 1
22 174 132 21 21 125 $47.50 $14.25 $3.33 $188.035 $12.470 $8.907 $41.882 $6.920 $0.748 $0.534 $36.461 $13.542 $109.324 $38.264 $84.603 0.867 $73.347 1
23 167 127 20 20 120 $47.50 $14.25 $3.33 $180.834 $11.992 $8.566 $40.278 $6.655 $0.720 $0.514 $35.065 $13.542 $104.619 $36.617 $81.544 0.861 $70.216 1
24 161 122 19 19 116 $47.50 $14.25 $3.33 $173.908 $11.533 $8.238 $38.736 $6.400 $0.692 $0.494 $33.722 $13.542 $100.094 $35.033 $78.603 0.855 $67.225 1
25 154 117 19 19 111 $47.50 $14.25 $3.33 $167.248 $11.091 $7.922 $37.252 $6.155 $0.665 $0.475 $32.430 $13.542 $95.742 $33.510 $75.774 0.849 $64.366 1
26 149 113 18 18 107 $47.50 $14.25 $3.33 $160.843 $10.666 $7.619 $35.826 $5.919 $0.640 $0.457 $31.188 $13.542 $91.556 $32.045 $73.053 0.844 $61.635 1
27 143 109 17 17 103 $47.50 $14.25 $3.33 $154.683 $10.258 $7.327 $34.454 $5.692 $0.615 $0.440 $29.994 $13.542 $87.531 $30.636 $70.437 0.838 $59.025 1
28 137 104 16 16 99 $47.50 $14.25 $3.33 $148.759 $9.865 $7.046 $33.134 $5.474 $0.592 $0.423 $28.845 $13.542 $83.660 $29.281 $67.921 0.832 $56.531 1
29 134 102 16 16 97 $47.50 $14.25 $3.33 $145.388 $9.642 $6.887 $32.383 $5.350 $0.578 $0.413 $28.192 $13.542 $81.458 $28.510 $66.489 0.827 $54.964 1
30 131 100 16 16 94 $47.50 $14.25 $3.33 $142.093 $9.423 $6.731 $31.649 $5.229 $0.565 $0.404 $27.553 $13.542 $79.305 $27.757 $65.090 0.821 $53.443 1
31 128 97 15 15 92 $47.50 $14.25 $3.33 $138.873 $9.209 $6.578 $30.932 $5.111 $0.553 $0.395 $26.928 $13.542 $77.201 $27.020 $63.722 0.816 $51.966 1
32 125 95 15 15 90 $47.50 $14.25 $3.33 $135.726 $9.001 $6.429 $30.231 $4.995 $0.540 $0.386 $26.318 $13.542 $75.145 $26.301 $62.386 0.810 $50.531 1
33 122 93 15 15 88 $47.50 $14.25 $3.33 $132.651 $8.797 $6.283 $29.546 $4.882 $0.528 $0.377 $25.722 $13.542 $73.135 $25.597 $61.079 0.804 $49.138 1
34 120 91 14 14 86 $47.50 $14.25 $3.33 $129.645 $8.597 $6.141 $28.877 $4.771 $0.516 $0.368 $25.139 $13.542 $71.171 $24.910 $59.803 0.799 $47.785 1
35 117 89 14 14 84 $47.50 $14.25 $3.33 $126.707 $8.403 $6.002 $28.222 $4.663 $0.504 $0.360 $24.569 $13.542 $69.251 $24.238 $58.555 0.794 $46.471 1
36 114 87 14 14 82 $47.50 $14.25 $3.33 $123.835 $8.212 $5.866 $27.583 $4.557 $0.493 $0.352 $24.012 $13.542 $67.375 $23.581 $57.335 0.788 $45.195 1
37 112 85 13 13 80 $47.50 $14.25 $3.33 $121.029 $8.026 $5.733 $26.958 $4.454 $0.482 $0.344 $23.468 $13.542 $65.541 $22.939 $56.144 0.783 $43.955 1
38 109 83 13 13 79 $47.50 $14.25 $3.33 $118.287 $7.844 $5.603 $26.347 $4.353 $0.471 $0.336 $22.936 $13.542 $63.749 $22.312 $54.979 0.778 $42.752 1
39 107 81 13 13 77 $47.50 $14.25 $3.33 $115.606 $7.667 $5.476 $25.750 $4.254 $0.460 $0.329 $22.417 $13.542 $61.998 $21.699 $53.840 0.772 $41.583 1
40 104 79 13 13 75 $47.50 $14.25 $3.33 $112.986 $7.493 $5.352 $25.166 $4.158 $0.450 $0.321 $21.909 $13.542 $60.286 $21.100 $52.728 0.767 $40.447 1
Midland Basin: Spraberry
Basin Characteristics
My Assumptions:
Average Well
Cash Flows ($1,000)Prices
Full Cycle DUC
Baseline Results (2016 factor prices)
minimum (breakeven) EUR and IP (flow) for the given price:
Sensitivity Results (2014 factor prices, G2=133%)
minimum (breakeven) EUR and IP (flow) for the given price:
Full Cycle DUC
Midland Basin: Spraberry Midland Basin: Spraberry
Capex ($1,000s) Production (boe/d)
Results
Page 53
Appendix A: Minimum EUR as function of price, 2014 and 2016 Cost scenarios.
A-2
Northern Delaware Bone Spring
100% oilfield service & supply factor price scalar
$6.50 cost/well ($mm) IP EUR 30 days/month
100 EUR/well (mboe) 1,000 676 -1.30% exponential decline rate after year 3 (monthly)
-70% 1st yr decline -9.5% 300 $20.00 oil price WTI ($/bbl)
-47% 2nd yr decline -5.2% 158 0% oil price appreciation (per month) Price EUR IP EUR IP Price EUR IP EUR IP
-20% 3rd yr decline -1.8% 142 $3.50 gas price Henry Hub ($/mcf) $20 2,067 3,058 1,027 1,519 $20 4,686 6,932 2326 3,441
148 IP rate (boe/d) 0% gas price appreciation $25 1,448 2,142 720 1,065 $25 2,711 4,010 1346 1,991
$7.00 opex-LOE ($/boe) 30% NGL price/oil price (fixed ratio) $30 1,115 1,649 555 821 $30 1,907 2,821 947 1,401
60% % oil 0.68% discount rate (compound monthly) $35 907 1,342 451 667 $35 1,471 2,176 731 1,081
20% % gas 8.5% discount rate (annual) $40 764 1,130 380 562 $40 1,198 1,772 595 880
20% % NGL 80% intangible drilling cost / total capex $45 660 976 329 487 $45 1,010 1,494 502 743
20.0% royalty rate 1.479 IP/EUR ratio, (B8/B4 = fixed ratio) $50 581 859 290 429 $50 873 1,291 434 642
3.8% oil prod tax $60 469 694 234 346 $60 687 1,016 342 506
3.8% gas prod tax $70 393 581 196 290 $70 566 837 282 417
3.8% NGL prod tax -$5.166 = NPV/well ($ million) $80 338 500 169 250 $80 482 713 240 355
35.0% income tax rate 0 = EUR check (mboe) $90 297 439 149 220 $90 419 620 209 309
-6% oil differential -2.66% = ATIRR (monthly) $100 265 392 133 197 $100 371 549 185 274
-6% gas differential -27.68% = ATIRR (annual)
0 1 = DUC 100 = total production (mboe)
25% auxillary cost/well cost $0.395 = "tail end" NPV/well ($ million)
50% completion cost/well cost 76% = "tail end" recovery factor
$2,000 min opex ($/month) 216 = months of lost production
Per Well Net Cash Flow Analysis
mcf/d AT NPV Active
Month Well Cost Aux. Cost Total Oil NGL Gas Gas Prod Oil/bbl NGL/bbl Gas/mcf Oil Rev Gas Rev NGL Rev Royalty Oil Tax Gas Tax NGL Tax Opex Depeciation Tax. Inc. Income Tax NCF PV Factor -$5,166 1/0
1 $1,625 $406 $18.80 $5.64 $3.29 $1,625.000 -$1,625.00 -$568.750 -1,463 1.000 -$1,462.50
2 $1,625 $406 $18.80 $5.64 $3.29 $1,625.000 -$1,625.00 -$568.750 -1,463 0.993 -$1,452.59
3 $1,625 $406 $18.80 $5.64 $3.29 $1,625.000 -$1,625.00 -$568.750 -1,463 0.986 -$1,442.75
4 $1,625 $406 $18.80 $5.64 $3.29 $1,625.000 -$1,625.00 -$568.750 -1,463 0.980 -$1,432.97
5 148 89 30 30 178 $18.80 $5.64 $3.29 $50.059 $17.521 $5.006 $14.52 $1.52 $0.53 $0.15 $31.065 $13.542 $11.255 $3.939 $20.858 0.973 $20.298 1
6 134 80 27 27 161 $18.80 $5.64 $3.29 $45.280 $15.848 $4.528 $13.131 $1.377 $0.482 $0.138 $28.100 $13.542 $8.888 $3.111 $19.319 0.967 $18.673 1
7 121 73 24 24 145 $18.80 $5.64 $3.29 $40.958 $14.335 $4.096 $11.878 $1.245 $0.436 $0.125 $25.417 $13.542 $6.747 $2.361 $17.927 0.960 $17.211 1
8 109 66 22 22 131 $18.80 $5.64 $3.29 $37.048 $12.967 $3.705 $10.744 $1.126 $0.394 $0.113 $22.991 $13.542 $4.810 $1.684 $16.668 0.954 $15.894 1
9 99 59 20 20 119 $18.80 $5.64 $3.29 $33.511 $11.729 $3.351 $9.718 $1.019 $0.357 $0.102 $20.796 $13.542 $3.058 $1.070 $15.530 0.947 $14.707 1
10 90 54 18 18 107 $18.80 $5.64 $3.29 $30.312 $10.609 $3.031 $8.791 $0.921 $0.323 $0.092 $18.811 $13.542 $1.474 $0.516 $14.499 0.941 $13.639 1
11 81 49 16 16 97 $18.80 $5.64 $3.29 $27.419 $9.596 $2.742 $7.951 $0.834 $0.292 $0.083 $17.015 $13.542 $0.040 $0.014 $13.568 0.934 $12.676 1
12 73 44 15 15 88 $18.80 $5.64 $3.29 $24.801 $8.680 $2.480 $7.192 $0.754 $0.264 $0.075 $15.391 $13.542 -$1.256 -$0.440 $12.725 0.928 $11.808 1
13 66 40 13 13 80 $18.80 $5.64 $3.29 $22.434 $7.852 $2.243 $6.506 $0.682 $0.239 $0.068 $13.922 $13.542 -$2.429 -$0.850 $11.963 0.922 $11.026 1
14 60 36 12 12 72 $18.80 $5.64 $3.29 $20.292 $7.102 $2.029 $5.885 $0.617 $0.216 $0.062 $12.593 $13.542 -$3.490 -$1.221 $11.273 0.915 $10.320 1
15 54 33 11 11 65 $18.80 $5.64 $3.29 $18.355 $6.424 $1.835 $5.323 $0.558 $0.195 $0.056 $11.390 $13.542 -$4.450 -$1.557 $10.649 0.909 $9.683 1
16 49 29 10 10 59 $18.80 $5.64 $3.29 $16.603 $5.811 $1.660 $4.815 $0.505 $0.177 $0.050 $10.303 $13.542 -$5.317 -$1.861 $10.085 0.903 $9.108 1
17 47 28 9 9 56 $18.80 $5.64 $3.29 $15.742 $5.510 $1.574 $4.565 $0.479 $0.167 $0.048 $9.769 $13.542 -$5.744 -$2.010 $9.808 0.897 $8.797 1
18 44 26 9 9 53 $18.80 $5.64 $3.29 $14.925 $5.224 $1.493 $4.328 $0.454 $0.159 $0.045 $9.262 $13.542 -$6.148 -$2.152 $9.545 0.891 $8.503 1
19 42 25 8 8 50 $18.80 $5.64 $3.29 $14.151 $4.953 $1.415 $4.104 $0.430 $0.151 $0.043 $8.782 $13.542 -$6.532 -$2.286 $9.296 0.885 $8.225 1
20 40 24 8 8 48 $18.80 $5.64 $3.29 $13.417 $4.696 $1.342 $3.891 $0.408 $0.143 $0.041 $8.326 $13.542 -$6.895 -$2.413 $9.060 0.879 $7.962 1
21 38 23 8 8 45 $18.80 $5.64 $3.29 $12.721 $4.452 $1.272 $3.689 $0.387 $0.135 $0.039 $7.894 $13.542 -$7.240 -$2.534 $8.836 0.873 $7.712 1
22 36 21 7 7 43 $18.80 $5.64 $3.29 $12.061 $4.222 $1.206 $3.498 $0.367 $0.128 $0.037 $7.485 $13.542 -$7.567 -$2.648 $8.623 0.867 $7.476 1
23 34 20 7 7 41 $18.80 $5.64 $3.29 $11.436 $4.003 $1.144 $3.316 $0.348 $0.122 $0.035 $7.097 $13.542 -$7.877 -$2.757 $8.422 0.861 $7.252 1
24 32 19 6 6 38 $18.80 $5.64 $3.29 $10.843 $3.795 $1.084 $3.144 $0.330 $0.115 $0.033 $6.729 $13.542 -$8.171 -$2.860 $8.231 0.855 $7.039 1
25 30 18 6 6 36 $18.80 $5.64 $3.29 $10.280 $3.598 $1.028 $2.981 $0.313 $0.109 $0.031 $6.380 $13.542 -$8.449 -$2.957 $8.050 0.849 $6.838 1
26 29 17 6 6 35 $18.80 $5.64 $3.29 $9.747 $3.412 $0.975 $2.827 $0.296 $0.104 $0.030 $6.049 $13.542 -$8.713 -$3.050 $7.878 0.844 $6.647 1
27 27 16 5 5 33 $18.80 $5.64 $3.29 $9.242 $3.235 $0.924 $2.680 $0.281 $0.098 $0.028 $5.735 $13.542 -$8.964 -$3.137 $7.715 0.838 $6.465 1
28 26 16 5 5 31 $18.80 $5.64 $3.29 $8.762 $3.067 $0.876 $2.541 $0.266 $0.093 $0.027 $5.438 $13.542 -$9.201 -$3.220 $7.561 0.832 $6.293 1
29 25 15 5 5 31 $18.80 $5.64 $3.29 $8.601 $3.011 $0.860 $2.494 $0.261 $0.092 $0.026 $5.338 $13.542 -$9.281 -$3.248 $7.509 0.827 $6.208 1
30 25 15 5 5 30 $18.80 $5.64 $3.29 $8.444 $2.955 $0.844 $2.449 $0.257 $0.090 $0.026 $5.240 $13.542 -$9.359 -$3.276 $7.458 0.821 $6.124 1
31 24 15 5 5 29 $18.80 $5.64 $3.29 $8.289 $2.901 $0.829 $2.404 $0.252 $0.088 $0.025 $5.144 $13.542 -$9.436 -$3.303 $7.408 0.816 $6.042 1
32 24 14 5 5 29 $18.80 $5.64 $3.29 $8.136 $2.848 $0.814 $2.360 $0.247 $0.087 $0.025 $5.049 $13.542 -$9.511 -$3.329 $7.359 0.810 $5.961 1
33 24 14 5 5 28 $18.80 $5.64 $3.29 $7.987 $2.795 $0.799 $2.316 $0.243 $0.085 $0.024 $4.956 $13.542 -$9.585 -$3.355 $7.311 0.804 $5.882 1
34 23 14 5 5 28 $18.80 $5.64 $3.29 $7.840 $2.744 $0.784 $2.274 $0.238 $0.083 $0.024 $4.865 $13.542 -$9.658 -$3.380 $7.264 0.799 $5.804 1
35 23 14 5 5 27 $18.80 $5.64 $3.29 $7.696 $2.694 $0.770 $2.232 $0.234 $0.082 $0.023 $4.776 $13.542 -$9.729 -$3.405 $7.218 0.794 $5.728 1
36 22 13 4 4 27 $18.80 $5.64 $3.29 $7.555 $2.644 $0.756 $2.191 $0.230 $0.080 $0.023 $4.688 $13.542 -$9.799 -$3.430 $7.172 0.788 $5.653 1
37 22 13 4 4 26 $18.80 $5.64 $3.29 $7.416 $2.596 $0.742 $2.151 $0.225 $0.079 $0.023 $4.602 $13.542 -$9.868 -$3.454 $7.128 0.783 $5.580 1
38 22 13 4 4 26 $18.80 $5.64 $3.29 $7.280 $2.548 $0.728 $2.111 $0.221 $0.077 $0.022 $4.518 $13.542 -$9.935 -$3.477 $7.084 0.778 $5.508 1
39 21 13 4 4 25 $18.80 $5.64 $3.29 $7.147 $2.501 $0.715 $2.073 $0.217 $0.076 $0.022 $4.435 $13.542 -$10.002 -$3.501 $7.041 0.772 $5.438 1
40 21 12 4 4 25 $18.80 $5.64 $3.29 $7.015 $2.455 $0.702 $2.034 $0.213 $0.075 $0.021 $4.353 $13.542 -$10.067 -$3.523 $6.998 0.767 $5.368 1
Capex ($1,000s) Production (boe/d) Prices Cash Flows ($1,000)
Full Cycle DUC
Baseline Results (2016 factor prices) Sensitivity Results (2014 factor prices, G2=133%)
Northern Delaware Basin: Bone Springs My Assumptions:
Basin Characteristics Average Well Northern Delaware Basin: Bone Springs Northern Delaware Basin: Bone Springs
Results
minimum (breakeven) EUR and IP (flow) for the given price: minimum (breakeven) EUR and IP (flow) for the given price:
Full Cycle DUC
jsmith:
Constant exponential
decline begins at year 4
Page 54
Appendix A: Minimum EUR as function of price, 2014 and 2016 Cost scenarios.
A-3
Southern Delaware Wolfcamp
100% oilfield service & supply factor price scalar
$7.80 cost/well ($mm) IP EUR 30 days/month
251 EUR/well (mboe) 1,100 883 -0.98% exponential decline rate after year 3 (monthly)
-67% 1st yr decline -8.8% 364 $100.00 oil price WTI ($/bbl)
-35% 2nd yr decline -3.5% 236 0% oil price appreciation (per month) Price EUR IP EUR IP Price EUR IP EUR IP
-41% 3rd yr decline -4.2% 182 $3.50 gas price Henry Hub ($/mcf) $20 2,601 3,240 1,291 1,608 $20 5,872 7,315 2914 3,630
312 IP rate (boe/d) 0% gas price appreciation $25 1,868 2,327 927 1,155 $25 3,525 4,391 1750 2,180
$7.00 opex-LOE ($/boe) 30% NGL price/oil price (fixed ratio) $30 1,458 1,816 724 902 $30 2,518 3,137 1250 1,557
55% % oil 0.68% discount rate (compound monthly) $35 1,195 1,489 594 740 $35 1,959 2,440 972 1,211
25% % gas 8.5% discount rate (annual) $40 1,012 1,261 503 627 $40 1,603 1,997 796 992
20% % NGL 80% intangible drilling cost / total capex $45 878 1,094 437 544 $45 1,356 1,689 673 838
20.0% royalty rate 1.246 IP/EUR ratio, (B8/B4 = fixed ratio) $50 776 967 386 481 $50 1,175 1,464 584 728
3.8% oil prod tax $60 629 784 313 390 $60 928 1,156 461 574
3.8% gas prod tax $70 529 659 263 328 $70 767 955 381 475
3.8% NGL prod tax -$1.955 = NPV/well ($ million) $80 456 568 227 283 $80 653 813 325 405
35.0% income tax rate 0 = EUR check (mboe) $90 401 500 200 249 $90 569 709 283 353
-6% oil differential 0.05% = ATIRR (monthly) $100 358 446 179 223 $100 504 628 251 313
-6% gas differential 0.58% = ATIRR (annual)
0 1 = DUC 251 = total production (mboe)
25% auxillary cost/well cost $2.427 = "tail end" NPV/well ($ million)
50% completion cost/well cost 100% = "tail end" recovery factor
$2,000 min opex ($/month) 0 = months of lost production
Per Well Net Cash Flow Analysis
mcf/d AT NPV Active
Month Well Cost Aux. Cost Total Oil NGL Gas Gas Prod Oil/bbl NGL/bbl Gas/mcf Oil Rev Gas Rev NGL Rev Royalty Oil Tax Gas Tax NGL Tax Opex Depeciation Tax. Inc. Income Tax NCF PV Factor -$1,955 1/0
1 $1,950 $488 $94.00 $28.20 $3.29 $1,950.000 -$1,950.00 -$682.500 -1,755 1.000 -$1,755.00
2 $1,950 $488 $94.00 $28.20 $3.29 $1,950.000 -$1,950.00 -$682.500 -1,755 0.993 -$1,743.11
3 $1,950 $488 $94.00 $28.20 $3.29 $1,950.000 -$1,950.00 -$682.500 -1,755 0.986 -$1,731.30
4 $1,950 $488 $94.00 $28.20 $3.29 $1,950.000 -$1,950.00 -$682.500 -1,755 0.980 -$1,719.57
5 312 172 62 78 468 $94.00 $28.20 $3.29 $484.347 $46.233 $52.838 $116.68 $14.72 $1.41 $1.61 $65.579 $16.250 $367.170 $128.509 $254.910 0.973 $248.072 1
6 285 157 57 71 427 $94.00 $28.20 $3.29 $441.705 $42.163 $48.186 $106.411 $13.428 $1.282 $1.465 $59.805 $16.250 $333.413 $116.695 $232.969 0.967 $225.183 1
7 260 143 52 65 390 $94.00 $28.20 $3.29 $402.817 $38.451 $43.944 $97.042 $12.246 $1.169 $1.336 $54.540 $16.250 $302.629 $105.920 $212.959 0.960 $204.447 1
8 237 130 47 59 355 $94.00 $28.20 $3.29 $367.353 $35.066 $40.075 $88.499 $11.168 $1.066 $1.218 $49.738 $16.250 $274.555 $96.094 $194.711 0.954 $185.662 1
9 216 119 43 54 324 $94.00 $28.20 $3.29 $335.011 $31.978 $36.547 $80.707 $10.184 $0.972 $1.111 $45.359 $16.250 $248.952 $87.133 $178.069 0.947 $168.643 1
10 197 108 39 49 295 $94.00 $28.20 $3.29 $305.517 $29.163 $33.329 $73.602 $9.288 $0.887 $1.013 $41.366 $16.250 $225.604 $78.961 $162.892 0.941 $153.225 1
11 180 99 36 45 269 $94.00 $28.20 $3.29 $278.619 $26.595 $30.395 $67.122 $8.470 $0.809 $0.924 $37.724 $16.250 $204.311 $71.509 $149.052 0.934 $139.256 1
12 164 90 33 41 246 $94.00 $28.20 $3.29 $254.090 $24.254 $27.719 $61.212 $7.724 $0.737 $0.843 $34.403 $16.250 $184.893 $64.712 $136.430 0.928 $126.600 1
13 149 82 30 37 224 $94.00 $28.20 $3.29 $231.719 $22.119 $25.278 $55.823 $7.044 $0.672 $0.768 $31.374 $16.250 $167.184 $58.514 $124.920 0.922 $115.133 1
14 136 75 27 34 204 $94.00 $28.20 $3.29 $211.319 $20.171 $23.053 $50.909 $6.424 $0.613 $0.701 $28.612 $16.250 $151.035 $52.862 $114.422 0.915 $104.744 1
15 124 68 25 31 186 $94.00 $28.20 $3.29 $192.714 $18.395 $21.023 $46.427 $5.859 $0.559 $0.639 $26.093 $16.250 $136.307 $47.707 $104.849 0.909 $95.330 1
16 113 62 23 28 170 $94.00 $28.20 $3.29 $175.748 $16.776 $19.172 $42.339 $5.343 $0.510 $0.583 $23.796 $16.250 $122.876 $43.006 $96.119 0.903 $86.801 1
17 109 60 22 27 164 $94.00 $28.20 $3.29 $169.515 $16.181 $18.493 $40.838 $5.153 $0.492 $0.562 $22.952 $16.250 $117.941 $41.280 $92.912 0.897 $83.336 1
18 105 58 21 26 158 $94.00 $28.20 $3.29 $163.503 $15.607 $17.837 $39.389 $4.970 $0.474 $0.542 $22.138 $16.250 $113.182 $39.614 $89.818 0.891 $80.015 1
19 102 56 20 25 153 $94.00 $28.20 $3.29 $157.704 $15.054 $17.204 $37.992 $4.794 $0.458 $0.523 $21.353 $16.250 $108.592 $38.007 $86.835 0.885 $76.833 1
20 98 54 20 25 147 $94.00 $28.20 $3.29 $152.111 $14.520 $16.594 $36.645 $4.624 $0.441 $0.504 $20.595 $16.250 $104.164 $36.457 $83.957 0.879 $73.783 1
21 95 52 19 24 142 $94.00 $28.20 $3.29 $146.716 $14.005 $16.005 $35.345 $4.460 $0.426 $0.487 $19.865 $16.250 $99.894 $34.963 $81.181 0.873 $70.860 1
22 91 50 18 23 137 $94.00 $28.20 $3.29 $141.513 $13.508 $15.438 $34.092 $4.302 $0.411 $0.469 $19.160 $16.250 $95.774 $33.521 $78.503 0.867 $68.059 1
23 88 48 18 22 132 $94.00 $28.20 $3.29 $136.494 $13.029 $14.890 $32.883 $4.149 $0.396 $0.453 $18.481 $16.250 $91.801 $32.130 $75.921 0.861 $65.374 1
24 85 47 17 21 127 $94.00 $28.20 $3.29 $131.653 $12.567 $14.362 $31.716 $4.002 $0.382 $0.437 $17.825 $16.250 $87.969 $30.789 $73.430 0.855 $62.801 1
25 82 45 16 20 123 $94.00 $28.20 $3.29 $126.984 $12.121 $13.853 $30.592 $3.860 $0.368 $0.421 $17.193 $16.250 $84.273 $29.496 $71.027 0.849 $60.335 1
26 79 43 16 20 118 $94.00 $28.20 $3.29 $122.480 $11.691 $13.361 $29.507 $3.723 $0.355 $0.406 $16.583 $16.250 $80.708 $28.248 $68.710 0.844 $57.971 1
27 76 42 15 19 114 $94.00 $28.20 $3.29 $118.136 $11.277 $12.888 $28.460 $3.591 $0.343 $0.392 $15.995 $16.250 $77.269 $27.044 $66.475 0.838 $55.705 1
28 73 40 15 18 110 $94.00 $28.20 $3.29 $113.946 $10.877 $12.431 $27.451 $3.464 $0.331 $0.378 $15.428 $16.250 $73.952 $25.883 $64.319 0.832 $53.533 1
29 70 39 14 18 106 $94.00 $28.20 $3.29 $109.117 $10.416 $11.904 $26.287 $3.317 $0.317 $0.362 $14.774 $16.250 $70.130 $24.545 $61.834 0.827 $51.116 1
30 67 37 13 17 101 $94.00 $28.20 $3.29 $104.493 $9.974 $11.399 $25.173 $3.177 $0.303 $0.347 $14.148 $16.250 $66.469 $23.264 $59.455 0.821 $48.816 1
31 65 35 13 16 97 $94.00 $28.20 $3.29 $100.064 $9.552 $10.916 $24.106 $3.042 $0.290 $0.332 $13.548 $16.250 $62.963 $22.037 $57.176 0.816 $46.627 1
32 62 34 12 15 93 $94.00 $28.20 $3.29 $95.824 $9.147 $10.454 $23.085 $2.913 $0.278 $0.318 $12.974 $16.250 $59.606 $20.862 $54.994 0.810 $44.544 1
33 59 33 12 15 89 $94.00 $28.20 $3.29 $91.763 $8.759 $10.010 $22.106 $2.790 $0.266 $0.304 $12.424 $16.250 $56.391 $19.737 $52.904 0.804 $42.561 1
34 57 31 11 14 85 $94.00 $28.20 $3.29 $87.874 $8.388 $9.586 $21.170 $2.671 $0.255 $0.291 $11.898 $16.250 $53.313 $18.659 $50.903 0.799 $40.674 1
35 54 30 11 14 81 $94.00 $28.20 $3.29 $84.150 $8.032 $9.180 $20.272 $2.558 $0.244 $0.279 $11.394 $16.250 $50.365 $17.628 $48.987 0.794 $38.877 1
36 52 29 10 13 78 $94.00 $28.20 $3.29 $80.583 $7.692 $8.791 $19.413 $2.450 $0.234 $0.267 $10.911 $16.250 $47.542 $16.640 $47.152 0.788 $37.168 1
37 50 27 10 12 75 $94.00 $28.20 $3.29 $77.168 $7.366 $8.418 $18.591 $2.346 $0.224 $0.256 $10.448 $16.250 $44.838 $15.693 $45.395 0.783 $35.540 1
38 48 26 10 12 71 $94.00 $28.20 $3.29 $73.898 $7.054 $8.062 $17.803 $2.246 $0.214 $0.245 $10.006 $16.250 $42.249 $14.787 $43.712 0.778 $33.991 1
39 46 25 9 11 68 $94.00 $28.20 $3.29 $70.766 $6.755 $7.720 $17.048 $2.151 $0.205 $0.235 $9.581 $16.250 $39.770 $13.920 $42.101 0.772 $32.516 1
40 44 24 9 11 66 $94.00 $28.20 $3.29 $67.767 $6.469 $7.393 $16.326 $2.060 $0.197 $0.225 $9.175 $16.250 $37.396 $13.089 $40.557 0.767 $31.112 1
Capex ($1,000s) Production (boe/d) Prices Cash Flows ($1,000)
Full Cycle DUC
Baseline Results (2016 factor prices) Sensitivity Results (2014 factor prices, G2=133%)
Southern Delaware Basin: Wolfcamp My Assumptions:
Basin Characteristics Average Well Southern Delaware Basin: Wolfcamp Southern Delaware Basin: Wolfcamp
Results
minimum (breakeven) EUR and IP (flow) for the given price: minimum (breakeven) EUR and IP (flow) for the given price:
Full Cycle DUC
jsmith:
Constant exponential
decline begins at year 4
Page 55
Appendix A: Minimum EUR as function of price, 2014 and 2016 Cost scenarios.
A-4
Culberson LL Wolfcamp
100% oilfield service & supply factor price scalar
$11.90 cost/well ($mm) IP EUR 30 days/month
919 EUR/well (mboe) 2,450 1,955 -0.36% exponential decline rate after year 3 (monthly)
-78% 1st yr decline -11.7% 547 $100.00 oil price WTI ($/bbl)
-43% 2nd yr decline -4.5% 314 0% oil price appreciation (per month) Price EUR IP EUR IP Price EUR IP EUR IP
-41% 3rd yr decline -4.2% 242 $3.50 gas price Henry Hub ($/mcf) $20 5,787 7,252 2,872 3,599 $20 15,643 19,604 7765 9,731
1,152 IP rate (boe/d) 0% gas price appreciation $25 4,708 5,900 2,337 2,929 $25 10,647 13,343 5298 6,639
$7.00 opex-LOE ($/boe) 30% NGL price/oil price (fixed ratio) $30 3,969 4,974 1,970 2,469 $30 8,101 10,152 4021 5,039
20% % oil 0.68% discount rate (compound monthly) $35 3,430 4,298 1,703 2,134 $35 6,527 8,180 3240 4,060
50% % gas 8.5% discount rate (annual) $40 3,020 3,785 1,499 1,879 $40 5,466 6,850 2713 3,400
30% % NGL 80% intangible drilling cost / total capex $45 2,698 3,381 1,339 1,678 $45 4,701 5,891 2333 2,924
20.0% royalty rate 1.253 IP/EUR ratio, (B8/B4 = fixed ratio) $50 2,437 3,054 1,210 1,516 $50 4,124 5,168 2047 2,565
4.6% oil prod tax $60 2,043 2,560 1,014 1,271 $60 3,311 4,149 1644 2,060
7.5% gas prod tax $70 1,759 2,204 873 1,094 $70 2,766 3,466 1373 1,721
7.5% NGL prod tax -$2.567 = NPV/well ($ million) $80 1,544 1,935 766 960 $80 2,375 2,976 1179 1,478
35.0% income tax rate 0 = EUR check (mboe) $90 1,376 1,724 683 856 $90 2,081 2,608 1033 1,295
-5% oil differential 0.27% = ATIRR (monthly) $100 1,241 1,555 616 772 $100 1,852 2,321 919 1,152
-5% gas differential 3.26% = ATIRR (annual)
0 1 = DUC 919 = total production (mboe)
25% auxillary cost/well cost $4.376 = "tail end" NPV/well ($ million)
50% completion cost/well cost 100% = "tail end" recovery factor
$2,000 min opex ($/month) 0 = months of lost production
Per Well Net Cash Flow Analysis
mcf/d AT NPV Active
Month Well Cost Aux. Cost Total Oil NGL Gas Gas Prod Oil/bbl NGL/bbl Gas/mcf Oil Rev Gas Rev NGL Rev Royalty Oil Tax Gas Tax NGL Tax Opex Depeciation Tax. Inc. Income Tax NCF PV Factor -$2,567 1/0
1 $2,975 $744 $95.00 $28.50 $3.33 $2,975.000 -$2,975.00 -$1,041.250 -2,678 1.000 -$2,677.50
2 $2,975 $744 $95.00 $28.50 $3.33 $2,975.000 -$2,975.00 -$1,041.250 -2,678 0.993 -$2,659.36
3 $2,975 $744 $95.00 $28.50 $3.33 $2,975.000 -$2,975.00 -$1,041.250 -2,678 0.986 -$2,641.34
4 $2,975 $744 $95.00 $28.50 $3.33 $2,975.000 -$2,975.00 -$1,041.250 -2,678 0.980 -$2,623.45
5 1152 230 346 576 3,455 $95.00 $28.50 $3.33 $656.528 $344.677 $295.438 $259.33 $24.16 $20.68 $17.73 $241.879 $24.792 $708.077 $247.827 $485.042 0.973 $472.030 1
6 1017 203 305 508 3,050 $95.00 $28.50 $3.33 $579.413 $304.192 $260.736 $228.868 $21.322 $18.252 $15.644 $213.468 $24.792 $621.995 $217.698 $429.089 0.967 $414.748 1
7 897 179 269 449 2,691 $95.00 $28.50 $3.33 $511.356 $268.462 $230.110 $201.986 $18.818 $16.108 $13.807 $188.394 $24.792 $546.025 $191.109 $379.708 0.960 $364.531 1
8 792 158 238 396 2,375 $95.00 $28.50 $3.33 $451.293 $236.929 $203.082 $178.261 $16.608 $14.216 $12.185 $166.266 $24.792 $478.977 $167.642 $336.127 0.954 $320.506 1
9 699 140 210 349 2,096 $95.00 $28.50 $3.33 $398.285 $209.100 $179.228 $157.323 $14.657 $12.546 $10.754 $146.737 $24.792 $419.805 $146.932 $297.665 0.947 $281.909 1
10 617 123 185 308 1,850 $95.00 $28.50 $3.33 $351.503 $184.539 $158.176 $138.844 $12.935 $11.072 $9.491 $129.501 $24.792 $367.584 $128.654 $263.721 0.941 $248.069 1
11 544 109 163 272 1,633 $95.00 $28.50 $3.33 $310.216 $162.863 $139.597 $122.535 $11.416 $9.772 $8.376 $114.290 $24.792 $321.496 $112.524 $233.764 0.934 $218.400 1
12 480 96 144 240 1,441 $95.00 $28.50 $3.33 $273.778 $143.734 $123.200 $108.142 $10.075 $8.624 $7.392 $100.866 $24.792 $280.821 $98.287 $207.326 0.928 $192.387 1
13 424 85 127 212 1,272 $95.00 $28.50 $3.33 $241.621 $126.851 $108.729 $95.440 $8.892 $7.611 $6.524 $89.018 $24.792 $244.925 $85.724 $183.993 0.922 $169.578 1
14 374 75 112 187 1,122 $95.00 $28.50 $3.33 $213.240 $111.951 $95.958 $84.230 $7.847 $6.717 $5.757 $78.562 $24.792 $213.244 $74.635 $163.400 0.915 $149.579 1
15 330 66 99 165 990 $95.00 $28.50 $3.33 $188.193 $98.802 $84.687 $74.336 $6.926 $5.928 $5.081 $69.334 $24.792 $185.285 $64.850 $145.227 0.909 $132.042 1
16 291 58 87 146 874 $95.00 $28.50 $3.33 $166.089 $87.196 $74.740 $65.605 $6.112 $5.232 $4.484 $61.191 $24.792 $160.609 $56.213 $129.188 0.903 $116.663 1
17 278 56 83 139 835 $95.00 $28.50 $3.33 $158.581 $83.255 $71.361 $62.640 $5.836 $4.995 $4.282 $58.425 $24.792 $152.229 $53.280 $123.741 0.897 $110.987 1
18 266 53 80 133 797 $95.00 $28.50 $3.33 $151.413 $79.492 $68.136 $59.808 $5.572 $4.770 $4.088 $55.784 $24.792 $144.228 $50.480 $118.540 0.891 $105.602 1
19 254 51 76 127 761 $95.00 $28.50 $3.33 $144.569 $75.899 $65.056 $57.105 $5.320 $4.554 $3.903 $53.262 $24.792 $136.588 $47.806 $113.574 0.885 $100.492 1
20 242 48 73 121 726 $95.00 $28.50 $3.33 $138.034 $72.468 $62.115 $54.524 $5.080 $4.348 $3.727 $50.855 $24.792 $129.293 $45.253 $108.832 0.879 $95.645 1
21 231 46 69 116 694 $95.00 $28.50 $3.33 $131.795 $69.192 $59.308 $52.059 $4.850 $4.152 $3.558 $48.556 $24.792 $122.328 $42.815 $104.305 0.873 $91.045 1
22 221 44 66 110 662 $95.00 $28.50 $3.33 $125.838 $66.065 $56.627 $49.706 $4.631 $3.964 $3.398 $46.361 $24.792 $115.678 $40.487 $99.983 0.867 $86.681 1
23 211 42 63 105 632 $95.00 $28.50 $3.33 $120.150 $63.079 $54.067 $47.459 $4.422 $3.785 $3.244 $44.266 $24.792 $109.329 $38.265 $95.855 0.861 $82.540 1
24 201 40 60 101 604 $95.00 $28.50 $3.33 $114.719 $60.227 $51.623 $45.314 $4.222 $3.614 $3.097 $42.265 $24.792 $103.266 $36.143 $91.915 0.855 $78.610 1
25 192 38 58 96 576 $95.00 $28.50 $3.33 $109.533 $57.505 $49.290 $43.266 $4.031 $3.450 $2.957 $40.354 $24.792 $97.478 $34.117 $88.152 0.849 $74.882 1
26 183 37 55 92 550 $95.00 $28.50 $3.33 $104.582 $54.906 $47.062 $41.310 $3.849 $3.294 $2.824 $38.530 $24.792 $91.951 $32.183 $84.560 0.844 $71.343 1
27 175 35 53 88 526 $95.00 $28.50 $3.33 $99.855 $52.424 $44.935 $39.443 $3.675 $3.145 $2.696 $36.789 $24.792 $86.674 $30.336 $81.130 0.838 $67.986 1
28 167 33 50 84 502 $95.00 $28.50 $3.33 $95.341 $50.054 $42.904 $37.660 $3.509 $3.003 $2.574 $35.126 $24.792 $81.636 $28.573 $77.855 0.832 $64.799 1
29 160 32 48 80 480 $95.00 $28.50 $3.33 $91.291 $47.928 $41.081 $36.060 $3.360 $2.876 $2.465 $33.634 $24.792 $77.115 $26.990 $74.916 0.827 $61.931 1
30 153 31 46 77 460 $95.00 $28.50 $3.33 $87.413 $45.892 $39.336 $34.528 $3.217 $2.754 $2.360 $32.205 $24.792 $72.786 $25.475 $72.102 0.821 $59.201 1
31 147 29 44 73 441 $95.00 $28.50 $3.33 $83.700 $43.942 $37.665 $33.061 $3.080 $2.637 $2.260 $30.837 $24.792 $68.641 $24.024 $69.408 0.816 $56.603 1
32 141 28 42 70 422 $95.00 $28.50 $3.33 $80.144 $42.076 $36.065 $31.657 $2.949 $2.525 $2.164 $29.527 $24.792 $64.672 $22.635 $66.828 0.810 $54.129 1
33 135 27 40 67 404 $95.00 $28.50 $3.33 $76.740 $40.288 $34.533 $30.312 $2.824 $2.417 $2.072 $28.273 $24.792 $60.871 $21.305 $64.358 0.804 $51.775 1
34 129 26 39 64 387 $95.00 $28.50 $3.33 $73.480 $38.577 $33.066 $29.024 $2.704 $2.315 $1.984 $27.071 $24.792 $57.232 $20.031 $61.993 0.799 $49.535 1
35 123 25 37 62 370 $95.00 $28.50 $3.33 $70.358 $36.938 $31.661 $27.792 $2.589 $2.216 $1.900 $25.921 $24.792 $53.748 $18.812 $59.728 0.794 $47.401 1
36 118 24 35 59 355 $95.00 $28.50 $3.33 $67.369 $35.369 $30.316 $26.611 $2.479 $2.122 $1.819 $24.820 $24.792 $50.411 $17.644 $57.559 0.788 $45.371 1
37 113 23 34 57 340 $95.00 $28.50 $3.33 $64.508 $33.866 $29.028 $25.480 $2.374 $2.032 $1.742 $23.766 $24.792 $47.217 $16.526 $55.483 0.783 $43.438 1
38 108 22 33 54 325 $95.00 $28.50 $3.33 $61.767 $32.428 $27.795 $24.398 $2.273 $1.946 $1.668 $22.756 $24.792 $44.158 $15.455 $53.494 0.778 $41.597 1
39 104 21 31 52 311 $95.00 $28.50 $3.33 $59.143 $31.050 $26.614 $23.362 $2.176 $1.863 $1.597 $21.790 $24.792 $41.229 $14.430 $51.590 0.772 $39.845 1
40 99 20 30 50 298 $95.00 $28.50 $3.33 $56.631 $29.731 $25.484 $22.369 $2.084 $1.784 $1.529 $20.864 $24.792 $38.424 $13.448 $49.767 0.767 $38.177 1
Capex ($1,000s) Production (boe/d) Prices Cash Flows ($1,000)
Full Cycle DUC
Baseline Results (2016 factor prices) Sensitivity Results (2014 factor prices, G2=133%)
Culberson LL: Wolfcamp My Assumptions:
Basin Characteristics Average Well Culberson LL: Wolfcamp Culberson LL: Wolfcamp
Results
minimum (breakeven) EUR and IP (flow) for the given price: minimum (breakeven) EUR and IP (flow) for the given price:
Full Cycle DUC
jsmith:
Constant exponential
decline begins at year 4
Page 56
Appendix A: Minimum EUR as function of price, 2014 and 2016 Cost scenarios.
A-5
Midland Basin Wolfcamp
100% oilfield service & supply factor price scalar
$6.50 cost/well ($mm) IP EUR 30 days/month
204 EUR/well (mboe) 745 746 -0.97% exponential decline rate after year 3 (monthly)
-63% 1st yr decline -8.0% 273 $100.00 oil price WTI ($/bbl)
-34% 2nd yr decline -3.4% 180 0% oil price appreciation (per month) Price EUR IP EUR IP Price EUR IP EUR IP
-26% 3rd yr decline -2.5% 155 $3.50 gas price Henry Hub ($/mcf) $20 2,362 2,359 1,172 1,170 $20 5,496 5,489 2728 2,724
203 IP rate (boe/d) 0% gas price appreciation $25 1,635 1,633 812 811 $25 3,091 3,087 1534 1,532
$7.00 opex-LOE ($/boe) 30% NGL price/oil price (fixed ratio) $30 1,250 1,248 621 620 $30 2,151 2,148 1067 1,066
60% % oil 0.68% discount rate (compound monthly) $35 1,012 1,011 503 502 $35 1,649 1,647 818 817
19% % gas 8.5% discount rate (annual) $40 850 849 423 422 $40 1,337 1,335 664 663
21% % NGL 80% intangible drilling cost / total capex $45 733 732 365 365 $45 1,124 1,122 558 557
20.0% royalty rate 0.999 IP/EUR ratio, (B8/B4 = fixed ratio) $50 644 643 321 321 $50 970 969 482 481
4.6% oil prod tax $60 519 518 258 258 $60 761 760 378 377
7.5% gas prod tax $70 434 433 217 217 $70 626 625 311 311
7.5% NGL prod tax -$1.644 = NPV/well ($ million) $80 373 373 186 186 $80 532 531 265 265
35.0% income tax rate 0 = EUR check (mboe) $90 327 327 164 164 $90 462 461 230 230
-5% oil differential 0.09% = ATIRR (monthly) $100 292 292 146 146 $100 409 408 204 204
-5% gas differential 1.10% = ATIRR (annual)
0 1 = DUC 204 = total production (mboe)
25% auxillary cost/well cost $2.306 = "tail end" NPV/well ($ million)
50% completion cost/well cost 100% = "tail end" recovery factor
$2,000 min opex ($/month) 0 = months of lost production
Per Well Net Cash Flow Analysis
mcf/d AT NPV Active
Month Well Cost Aux. Cost Total Oil NGL Gas Gas Prod Oil/bbl NGL/bbl Gas/mcf Oil Rev Gas Rev NGL Rev Royalty Oil Tax Gas Tax NGL Tax Opex Depeciation Tax. Inc. Income Tax NCF PV Factor -$1,644 1/0
1 $1,625 $406 $95.00 $28.50 $3.33 $1,625.000 -$1,625.00 -$568.750 -1,463 1.000 -$1,462.50
2 $1,625 $406 $95.00 $28.50 $3.33 $1,625.000 -$1,625.00 -$568.750 -1,463 0.993 -$1,452.59
3 $1,625 $406 $95.00 $28.50 $3.33 $1,625.000 -$1,625.00 -$568.750 -1,463 0.986 -$1,442.75
4 $1,625 $406 $95.00 $28.50 $3.33 $1,625.000 -$1,625.00 -$568.750 -1,463 0.980 -$1,432.97
5 203 122 43 39 232 $95.00 $28.50 $3.33 $347.602 $23.116 $36.498 $81.44 $12.79 $1.39 $2.19 $42.688 $13.542 $253.175 $88.611 $178.105 0.973 $173.327 1
6 187 112 39 36 213 $95.00 $28.50 $3.33 $319.705 $21.260 $33.569 $74.907 $11.765 $1.276 $2.014 $39.262 $13.542 $231.769 $81.119 $164.192 0.967 $158.704 1
7 172 103 36 33 196 $95.00 $28.50 $3.33 $294.047 $19.554 $30.875 $68.895 $10.821 $1.173 $1.852 $36.111 $13.542 $212.082 $74.229 $151.395 0.960 $145.344 1
8 158 95 33 30 180 $95.00 $28.50 $3.33 $270.448 $17.985 $28.397 $63.366 $9.953 $1.079 $1.704 $33.213 $13.542 $193.974 $67.891 $139.625 0.954 $133.136 1
9 145 87 31 28 166 $95.00 $28.50 $3.33 $248.743 $16.541 $26.118 $58.281 $9.154 $0.992 $1.567 $30.547 $13.542 $177.320 $62.062 $128.800 0.947 $121.982 1
10 134 80 28 25 153 $95.00 $28.50 $3.33 $228.780 $15.214 $24.022 $53.603 $8.419 $0.913 $1.441 $28.096 $13.542 $162.002 $56.701 $118.843 0.941 $111.790 1
11 123 74 26 23 140 $95.00 $28.50 $3.33 $210.420 $13.993 $22.094 $49.301 $7.743 $0.840 $1.326 $25.841 $13.542 $147.914 $51.770 $109.686 0.934 $102.477 1
12 113 68 24 22 129 $95.00 $28.50 $3.33 $193.532 $12.870 $20.321 $45.345 $7.122 $0.772 $1.219 $23.767 $13.542 $134.956 $47.235 $101.263 0.928 $93.967 1
13 104 62 22 20 119 $95.00 $28.50 $3.33 $178.000 $11.837 $18.690 $41.705 $6.550 $0.710 $1.121 $21.860 $13.542 $123.038 $43.063 $93.517 0.922 $86.190 1
14 96 57 20 18 109 $95.00 $28.50 $3.33 $163.715 $10.887 $17.190 $38.358 $6.025 $0.653 $1.031 $20.105 $13.542 $112.077 $39.227 $86.392 0.915 $79.084 1
15 88 53 18 17 100 $95.00 $28.50 $3.33 $150.576 $10.013 $15.810 $35.280 $5.541 $0.601 $0.949 $18.492 $13.542 $101.995 $35.698 $79.839 0.909 $72.590 1
16 81 49 17 15 92 $95.00 $28.50 $3.33 $138.491 $9.210 $14.542 $32.448 $5.096 $0.553 $0.872 $17.008 $13.542 $92.723 $32.453 $73.812 0.903 $66.656 1
17 78 47 16 15 89 $95.00 $28.50 $3.33 $133.767 $8.895 $14.045 $31.342 $4.923 $0.534 $0.843 $16.427 $13.542 $89.098 $31.184 $71.455 0.897 $64.091 1
18 76 45 16 14 86 $95.00 $28.50 $3.33 $129.203 $8.592 $13.566 $30.272 $4.755 $0.516 $0.814 $15.867 $13.542 $85.596 $29.959 $69.179 0.891 $61.629 1
19 73 44 15 14 83 $95.00 $28.50 $3.33 $124.796 $8.299 $13.104 $29.240 $4.592 $0.498 $0.786 $15.326 $13.542 $82.214 $28.775 $66.981 0.885 $59.266 1
20 70 42 15 13 80 $95.00 $28.50 $3.33 $120.538 $8.016 $12.657 $28.242 $4.436 $0.481 $0.759 $14.803 $13.542 $78.948 $27.632 $64.858 0.879 $56.999 1
21 68 41 14 13 78 $95.00 $28.50 $3.33 $116.426 $7.742 $12.225 $27.279 $4.284 $0.465 $0.733 $14.298 $13.542 $75.793 $26.527 $62.807 0.873 $54.822 1
22 66 39 14 12 75 $95.00 $28.50 $3.33 $112.455 $7.478 $11.808 $26.348 $4.138 $0.449 $0.708 $13.810 $13.542 $72.745 $25.461 $60.826 0.867 $52.734 1
23 64 38 13 12 72 $95.00 $28.50 $3.33 $108.618 $7.223 $11.405 $25.449 $3.997 $0.433 $0.684 $13.339 $13.542 $69.801 $24.431 $58.913 0.861 $50.729 1
24 61 37 13 12 70 $95.00 $28.50 $3.33 $104.913 $6.977 $11.016 $24.581 $3.861 $0.419 $0.661 $12.884 $13.542 $66.958 $23.435 $57.065 0.855 $48.804 1
25 59 36 12 11 68 $95.00 $28.50 $3.33 $101.334 $6.739 $10.640 $23.743 $3.729 $0.404 $0.638 $12.445 $13.542 $64.212 $22.474 $55.280 0.849 $46.957 1
26 57 34 12 11 65 $95.00 $28.50 $3.33 $97.877 $6.509 $10.277 $22.933 $3.602 $0.391 $0.617 $12.020 $13.542 $61.560 $21.546 $53.555 0.844 $45.185 1
27 55 33 12 11 63 $95.00 $28.50 $3.33 $94.538 $6.287 $9.926 $22.150 $3.479 $0.377 $0.596 $11.610 $13.542 $58.998 $20.649 $51.890 0.838 $43.483 1
28 53 32 11 10 61 $95.00 $28.50 $3.33 $91.313 $6.072 $9.588 $21.395 $3.360 $0.364 $0.575 $11.214 $13.542 $56.523 $19.783 $50.282 0.832 $41.850 1
29 52 31 11 10 59 $95.00 $28.50 $3.33 $89.065 $5.923 $9.352 $20.868 $3.278 $0.355 $0.561 $10.938 $13.542 $54.798 $19.179 $49.161 0.827 $40.639 1
30 51 30 11 10 58 $95.00 $28.50 $3.33 $86.873 $5.777 $9.122 $20.354 $3.197 $0.347 $0.547 $10.669 $13.542 $53.116 $18.591 $48.067 0.821 $39.466 1
31 50 30 10 9 56 $95.00 $28.50 $3.33 $84.735 $5.635 $8.897 $19.853 $3.118 $0.338 $0.534 $10.406 $13.542 $51.476 $18.016 $47.001 0.816 $38.329 1
32 48 29 10 9 55 $95.00 $28.50 $3.33 $82.649 $5.496 $8.678 $19.365 $3.041 $0.330 $0.521 $10.150 $13.542 $49.875 $17.456 $45.961 0.810 $37.227 1
33 47 28 10 9 54 $95.00 $28.50 $3.33 $80.615 $5.361 $8.465 $18.888 $2.967 $0.322 $0.508 $9.900 $13.542 $48.314 $16.910 $44.946 0.804 $36.159 1
34 46 28 10 9 52 $95.00 $28.50 $3.33 $78.631 $5.229 $8.256 $18.423 $2.894 $0.314 $0.495 $9.656 $13.542 $46.792 $16.377 $43.956 0.799 $35.123 1
35 45 27 9 9 51 $95.00 $28.50 $3.33 $76.695 $5.100 $8.053 $17.970 $2.822 $0.306 $0.483 $9.419 $13.542 $45.307 $15.857 $42.991 0.794 $34.119 1
36 44 26 9 8 50 $95.00 $28.50 $3.33 $74.807 $4.975 $7.855 $17.527 $2.753 $0.298 $0.471 $9.187 $13.542 $43.858 $15.350 $42.050 0.788 $33.145 1
37 43 26 9 8 49 $95.00 $28.50 $3.33 $72.966 $4.852 $7.661 $17.096 $2.685 $0.291 $0.460 $8.961 $13.542 $42.445 $14.856 $41.131 0.783 $32.202 1
38 42 25 9 8 47 $95.00 $28.50 $3.33 $71.170 $4.733 $7.473 $16.675 $2.619 $0.284 $0.448 $8.740 $13.542 $41.067 $14.374 $40.235 0.778 $31.287 1
39 41 24 9 8 46 $95.00 $28.50 $3.33 $69.418 $4.616 $7.289 $16.265 $2.555 $0.277 $0.437 $8.525 $13.542 $39.723 $13.903 $39.362 0.772 $30.400 1
40 40 24 8 8 45 $95.00 $28.50 $3.33 $67.710 $4.503 $7.110 $15.864 $2.492 $0.270 $0.427 $8.315 $13.542 $38.412 $13.444 $38.510 0.767 $29.541 1
Midland Basin: Wolfcamp My Assumptions:
Basin Characteristics Average Well
minimum (breakeven) EUR and IP (flow) for the given price: minimum (breakeven) EUR and IP (flow) for the given price:
Full Cycle DUC
Midland Basin: Wolfcamp Midland Basin: Wolfcamp
Capex ($1,000s) Production (boe/d) Prices Cash Flows ($1,000)
Baseline Results (2016 factor prices) Sensitivity Results (2014 factor prices, G2=133%)
Results
Full Cycle DUC
jsmith:
Constant exponential
decline begins at year 4
Page 57
Appendix A: Minimum EUR as function of price, 2014 and 2016 Cost scenarios.
A-6
Southern Midland Basin Wolfcamp
100% oilfield service & supply factor price scalar
$4.80 cost/well ($mm) IP EUR 30 days/month
180 EUR/well (mboe) 525 500 -0.93% exponential decline rate after year 3 (monthly)
-66% 1st yr decline -8.6% 178 $100.00 oil price WTI ($/bbl)
-34% 2nd yr decline -3.4% 117 0% oil price appreciation (per month) Price EUR IP EUR IP Price EUR IP EUR IP
-27% 3rd yr decline -2.6% 100 $3.50 gas price Henry Hub ($/mcf) $20 1,888 1,982 937 984 $20 4,667 4,900 2317 2,433
189 IP rate (boe/d) 0% gas price appreciation $25 1,348 1,415 669 702 $25 2,675 2,809 1328 1,394
$7.00 opex-LOE ($/boe) 30% NGL price/oil price (fixed ratio) $30 1,048 1,100 521 547 $30 1,875 1,969 931 978
48% % oil 0.68% discount rate (compound monthly) $35 857 900 427 448 $35 1,443 1,515 716 752
27% % gas 8.5% discount rate (annual) $40 726 762 361 379 $40 1,173 1,232 582 611
25% % NGL 80% intangible drilling cost / total capex $45 629 660 313 329 $45 988 1,037 491 516
20.0% royalty rate 1.050 IP/EUR ratio, (B8/B4 = fixed ratio) $50 555 583 277 291 $50 854 897 424 445
4.6% oil prod tax $60 449 471 224 235 $60 671 705 333 350
7.5% gas prod tax $70 378 397 189 198 $70 553 581 275 289
7.5% NGL prod tax -$1.188 = NPV/well ($ million) $80 326 342 163 171 $80 470 494 234 246
35.0% income tax rate 0 = EUR check (mboe) $90 286 300 144 151 $90 409 429 204 214
-5% oil differential 0.10% = ATIRR (monthly) $100 255 268 128 134 $100 362 380 180 189
-5% gas differential 1.23% = ATIRR (annual)
0 1 = DUC 180 = total production (mboe)
25% auxillary cost/well cost $1.699 = "tail end" NPV/well ($ million)
50% completion cost/well cost 100% = "tail end" recovery factor
$2,000 min opex ($/month) 0 = months of lost production
Per Well Net Cash Flow Analysis
mcf/d AT NPV Active
Month Well Cost Aux. Cost Total Oil NGL Gas Gas Prod Oil/bbl NGL/bbl Gas/mcf Oil Rev Gas Rev NGL Rev Royalty Oil Tax Gas Tax NGL Tax Opex Depeciation Tax. Inc. Income Tax NCF PV Factor -$1,188 1/0
1 $1,200 $300 $95.00 $28.50 $3.33 $1,200.000 -$1,200.00 -$420.000 -1,080 1.000 -$1,080.00
2 $1,200 $300 $95.00 $28.50 $3.33 $1,200.000 -$1,200.00 -$420.000 -1,080 0.993 -$1,072.68
3 $1,200 $300 $95.00 $28.50 $3.33 $1,200.000 -$1,200.00 -$420.000 -1,080 0.986 -$1,065.41
4 $1,200 $300 $95.00 $28.50 $3.33 $1,200.000 -$1,200.00 -$420.000 -1,080 0.980 -$1,058.20
5 189 91 47 51 307 $95.00 $28.50 $3.33 $258.884 $30.581 $40.451 $65.98 $9.53 $1.83 $2.43 $39.741 $10.000 $200.402 $70.141 $140.262 0.973 $136.499 1
6 173 83 43 47 280 $95.00 $28.50 $3.33 $236.570 $27.945 $36.964 $60.296 $8.706 $1.677 $2.218 $36.316 $10.000 $182.267 $63.794 $128.474 0.967 $124.180 1
7 158 76 40 43 256 $95.00 $28.50 $3.33 $216.180 $25.536 $33.778 $55.099 $7.955 $1.532 $2.027 $33.185 $10.000 $165.695 $57.993 $117.702 0.960 $112.998 1
8 144 69 36 39 234 $95.00 $28.50 $3.33 $197.547 $23.335 $30.867 $50.350 $7.270 $1.400 $1.852 $30.325 $10.000 $150.552 $52.693 $107.859 0.954 $102.846 1
9 132 63 33 36 214 $95.00 $28.50 $3.33 $180.520 $21.324 $28.206 $46.010 $6.643 $1.279 $1.692 $27.711 $10.000 $136.714 $47.850 $98.864 0.947 $93.631 1
10 121 58 30 33 195 $95.00 $28.50 $3.33 $164.961 $19.486 $25.775 $42.044 $6.071 $1.169 $1.547 $25.323 $10.000 $124.068 $43.424 $90.644 0.941 $85.265 1
11 110 53 28 30 179 $95.00 $28.50 $3.33 $150.742 $17.806 $23.553 $38.420 $5.547 $1.068 $1.413 $23.140 $10.000 $112.513 $39.379 $83.133 0.934 $77.669 1
12 101 48 25 27 163 $95.00 $28.50 $3.33 $137.750 $16.272 $21.523 $35.109 $5.069 $0.976 $1.291 $21.146 $10.000 $101.953 $35.684 $76.269 0.928 $70.774 1
13 92 44 23 25 149 $95.00 $28.50 $3.33 $125.877 $14.869 $19.668 $32.083 $4.632 $0.892 $1.180 $19.323 $10.000 $92.304 $32.306 $69.997 0.922 $64.514 1
14 84 40 21 23 136 $95.00 $28.50 $3.33 $115.027 $13.588 $17.973 $29.318 $4.233 $0.815 $1.078 $17.658 $10.000 $83.486 $29.220 $64.266 0.915 $58.830 1
15 77 37 19 21 124 $95.00 $28.50 $3.33 $105.113 $12.416 $16.424 $26.791 $3.868 $0.745 $0.985 $16.136 $10.000 $75.428 $26.400 $59.028 0.909 $53.669 1
16 70 34 18 19 114 $95.00 $28.50 $3.33 $96.053 $11.346 $15.008 $24.481 $3.535 $0.681 $0.900 $14.745 $10.000 $68.065 $23.823 $54.242 0.903 $48.984 1
17 68 33 17 18 110 $95.00 $28.50 $3.33 $92.752 $10.956 $14.493 $23.640 $3.413 $0.657 $0.870 $14.238 $10.000 $65.382 $22.884 $52.499 0.897 $47.088 1
18 65 31 16 18 106 $95.00 $28.50 $3.33 $89.565 $10.580 $13.995 $22.828 $3.296 $0.635 $0.840 $13.749 $10.000 $62.792 $21.977 $50.815 0.891 $45.269 1
19 63 30 16 17 102 $95.00 $28.50 $3.33 $86.487 $10.216 $13.514 $22.043 $3.183 $0.613 $0.811 $13.277 $10.000 $60.291 $21.102 $49.189 0.885 $43.523 1
20 61 29 15 16 99 $95.00 $28.50 $3.33 $83.515 $9.865 $13.049 $21.286 $3.073 $0.592 $0.783 $12.820 $10.000 $57.875 $20.256 $47.619 0.879 $41.849 1
21 59 28 15 16 96 $95.00 $28.50 $3.33 $80.645 $9.526 $12.601 $20.554 $2.968 $0.572 $0.756 $12.380 $10.000 $55.543 $19.440 $46.103 0.873 $40.242 1
22 57 27 14 15 92 $95.00 $28.50 $3.33 $77.874 $9.199 $12.168 $19.848 $2.866 $0.552 $0.730 $11.954 $10.000 $53.291 $18.652 $44.639 0.867 $38.700 1
23 55 26 14 15 89 $95.00 $28.50 $3.33 $75.198 $8.883 $11.750 $19.166 $2.767 $0.533 $0.705 $11.544 $10.000 $51.116 $17.891 $43.225 0.861 $37.221 1
24 53 25 13 14 86 $95.00 $28.50 $3.33 $72.614 $8.578 $11.346 $18.508 $2.672 $0.515 $0.681 $11.147 $10.000 $49.016 $17.155 $41.860 0.855 $35.801 1
25 51 25 13 14 83 $95.00 $28.50 $3.33 $70.119 $8.283 $10.956 $17.872 $2.580 $0.497 $0.657 $10.764 $10.000 $46.988 $16.446 $40.542 0.849 $34.439 1
26 49 24 12 13 80 $95.00 $28.50 $3.33 $67.709 $7.998 $10.580 $17.257 $2.492 $0.480 $0.635 $10.394 $10.000 $45.029 $15.760 $39.269 0.844 $33.131 1
27 48 23 12 13 77 $95.00 $28.50 $3.33 $65.383 $7.723 $10.216 $16.664 $2.406 $0.463 $0.613 $10.037 $10.000 $43.138 $15.098 $38.040 0.838 $31.877 1
28 46 22 12 12 75 $95.00 $28.50 $3.33 $63.136 $7.458 $9.865 $16.092 $2.323 $0.447 $0.592 $9.692 $10.000 $41.312 $14.459 $36.853 0.832 $30.673 1
29 45 22 11 12 73 $95.00 $28.50 $3.33 $61.505 $7.265 $9.610 $15.676 $2.263 $0.436 $0.577 $9.442 $10.000 $39.987 $13.995 $35.992 0.827 $29.753 1
30 44 21 11 12 71 $95.00 $28.50 $3.33 $59.917 $7.078 $9.362 $15.271 $2.205 $0.425 $0.562 $9.198 $10.000 $38.696 $13.544 $35.152 0.821 $28.862 1
31 43 20 11 12 69 $95.00 $28.50 $3.33 $58.369 $6.895 $9.120 $14.877 $2.148 $0.414 $0.547 $8.960 $10.000 $37.438 $13.103 $34.335 0.816 $28.000 1
32 42 20 10 11 67 $95.00 $28.50 $3.33 $56.862 $6.717 $8.885 $14.493 $2.093 $0.403 $0.533 $8.729 $10.000 $36.213 $12.675 $33.538 0.810 $27.165 1
33 40 19 10 11 66 $95.00 $28.50 $3.33 $55.393 $6.543 $8.655 $14.118 $2.038 $0.393 $0.519 $8.503 $10.000 $35.019 $12.257 $32.763 0.804 $26.357 1
34 39 19 10 11 64 $95.00 $28.50 $3.33 $53.962 $6.374 $8.432 $13.754 $1.986 $0.382 $0.506 $8.284 $10.000 $33.857 $11.850 $32.007 0.799 $25.575 1
35 38 18 10 10 62 $95.00 $28.50 $3.33 $52.569 $6.210 $8.214 $13.398 $1.935 $0.373 $0.493 $8.070 $10.000 $32.724 $11.453 $31.271 0.794 $24.817 1
36 37 18 9 10 61 $95.00 $28.50 $3.33 $51.211 $6.049 $8.002 $13.052 $1.885 $0.363 $0.480 $7.861 $10.000 $31.621 $11.067 $30.553 0.788 $24.084 1
37 36 18 9 10 59 $95.00 $28.50 $3.33 $49.888 $5.893 $7.795 $12.715 $1.836 $0.354 $0.468 $7.658 $10.000 $30.546 $10.691 $29.855 0.783 $23.373 1
38 36 17 9 10 58 $95.00 $28.50 $3.33 $48.600 $5.741 $7.594 $12.387 $1.788 $0.344 $0.456 $7.460 $10.000 $29.498 $10.324 $29.174 0.778 $22.686 1
39 35 17 9 9 56 $95.00 $28.50 $3.33 $47.344 $5.593 $7.398 $12.067 $1.742 $0.336 $0.444 $7.268 $10.000 $28.478 $9.967 $28.511 0.772 $22.020 1
40 34 16 8 9 55 $95.00 $28.50 $3.33 $46.122 $5.448 $7.207 $11.755 $1.697 $0.327 $0.432 $7.080 $10.000 $27.484 $9.620 $27.865 0.767 $21.375 1
Capex ($1,000s) Production (boe/d) Prices Cash Flows ($1,000)
Results
minimum (breakeven) EUR and IP (flow) for the given price: minimum (breakeven) EUR and IP (flow) for the given price:
Full Cycle DUC Full Cycle DUC
Baseline Results (2016 factor prices) Sensitivity Results (2014 factor prices, G2=133%)
Southern Midland Basin: Wolfcamp My Assumptions:
Basin Characteristics Average Well Southern Midland Basin: Wolfcamp Southern Midland Basin: Wolfcamp
jsmith:
Constant exponential
decline begins at year 4
Page 58
Appendix A: Minimum EUR as function of price, 2014 and 2016 Cost scenarios.
A-7
Eagle Ford Condensate
100% oilfield service & supply factor price scalar
$8.00 cost/well ($mm) IP EUR 30 days/month
229 EUR/well (mboe) 1,367 801 -1.08% exponential decline rate after year 3 (monthly)
-74% 1st yr decline -10.7% 353 $100.00 oil price WTI ($/bbl)
-43% 2nd yr decline -4.6% 200 0% oil price appreciation (per month) Price EUR IP EUR IP Price EUR IP EUR IP
-41% 3rd yr decline -4.4% 153 $3.50 gas price Henry Hub ($/mcf) $20 3,014 5,144 1,496 2,553 $20 9,143 15,604 4538 7,745
390 IP rate (boe/d) 0% gas price appreciation $25 1,985 3,388 986 1,683 $25 4,190 7,151 2080 3,550
$8.00 opex-LOE ($/boe) 30% NGL price/oil price (fixed ratio) $30 1,480 2,526 735 1,254 $30 2,717 4,637 1349 2,302
63% % oil 0.68% discount rate (compound monthly) $35 1,180 2,014 586 1,000 $35 2,011 3,432 998 1,703
20% % gas 8.5% discount rate (annual) $40 981 1,674 488 833 $40 1,596 2,724 792 1,352
17% % NGL 80% intangible drilling cost / total capex $45 839 1,432 418 713 $45 1,323 2,258 657 1,121
20.0% royalty rate 1.707 IP/EUR ratio, (B8/B4 = fixed ratio) $50 734 1,253 365 623 $50 1,130 1,928 561 957
4.6% oil prod tax $60 586 1,000 292 498 $60 874 1,492 434 741
7.5% gas prod tax $70 488 833 243 415 $70 713 1,217 355 606
7.5% NGL prod tax -$1.985 = NPV/well ($ million) $80 418 713 208 355 $80 602 1,027 299 510
35.0% income tax rate 0 = EUR check (mboe) $90 366 625 182 311 $90 521 889 259 442
-6% oil differential -0.04% = ATIRR (monthly) $100 325 555 162 276 $100 459 783 229 391
-5% gas differential -0.42% = ATIRR (annual)
0 1 = DUC 229 = total production (mboe)
25% auxillary cost/well cost $2.144 = "tail end" NPV/well ($ million)
50% completion cost/well cost 100% = "tail end" recovery factor
$2,000 min opex ($/month) 10 = months of lost production
Per Well Net Cash Flow Analysis
mcf/d AT NPV Active
Month Well Cost Aux. Cost Total Oil NGL Gas Gas Prod Oil/bbl NGL/bbl Gas/mcf Oil Rev Gas Rev NGL Rev Royalty Oil Tax Gas Tax NGL Tax Opex Depeciation Tax. Inc. Income Tax NCF PV Factor -$1,985 1/0
1 $2,000 $500 $94.00 $28.20 $3.33 $2,000.000 -$2,000.00 -$700.000 -1,800 1.000 -$1,800.00
2 $2,000 $500 $94.00 $28.20 $3.33 $2,000.000 -$2,000.00 -$700.000 -1,800 0.993 -$1,787.80
3 $2,000 $500 $94.00 $28.20 $3.33 $2,000.000 -$2,000.00 -$700.000 -1,800 0.986 -$1,775.69
4 $2,000 $500 $94.00 $28.20 $3.33 $2,000.000 -$2,000.00 -$700.000 -1,800 0.980 -$1,763.66
5 390 246 66 78 468 $94.00 $28.20 $3.33 $693.075 $46.697 $56.106 $159.18 $25.51 $2.80 $3.37 $93.627 $16.667 $494.735 $173.157 $338.245 0.973 $329.170 1
6 348 220 59 70 418 $94.00 $28.20 $3.33 $619.129 $41.714 $50.120 $142.193 $22.784 $2.503 $3.007 $83.638 $16.667 $440.172 $154.060 $302.778 0.967 $292.659 1
7 311 196 53 62 374 $94.00 $28.20 $3.33 $553.072 $37.264 $44.772 $127.022 $20.353 $2.236 $2.686 $74.714 $16.667 $391.430 $137.001 $271.096 0.960 $260.261 1
8 278 175 47 56 334 $94.00 $28.20 $3.33 $494.063 $33.288 $39.996 $113.469 $18.182 $1.997 $2.400 $66.743 $16.667 $347.889 $121.761 $242.795 0.954 $231.511 1
9 248 157 42 50 298 $94.00 $28.20 $3.33 $441.349 $29.736 $35.728 $101.363 $16.242 $1.784 $2.144 $59.622 $16.667 $308.993 $108.148 $217.512 0.947 $205.998 1
10 222 140 38 44 266 $94.00 $28.20 $3.33 $394.260 $26.564 $31.916 $90.548 $14.509 $1.594 $1.915 $53.260 $16.667 $274.248 $95.987 $194.928 0.941 $183.358 1
11 198 125 34 40 238 $94.00 $28.20 $3.33 $352.195 $23.729 $28.511 $80.887 $12.961 $1.424 $1.711 $47.578 $16.667 $243.209 $85.123 $174.752 0.934 $163.267 1
12 177 112 30 35 213 $94.00 $28.20 $3.33 $314.618 $21.198 $25.469 $72.257 $11.578 $1.272 $1.528 $42.502 $16.667 $215.482 $75.419 $156.730 0.928 $145.437 1
13 158 100 27 32 190 $94.00 $28.20 $3.33 $281.051 $18.936 $22.752 $64.548 $10.343 $1.136 $1.365 $37.967 $16.667 $190.713 $66.750 $140.630 0.922 $129.613 1
14 141 89 24 28 170 $94.00 $28.20 $3.33 $251.064 $16.916 $20.324 $57.661 $9.239 $1.015 $1.219 $33.916 $16.667 $168.587 $59.005 $126.248 0.915 $115.569 1
15 126 80 21 25 151 $94.00 $28.20 $3.33 $224.277 $15.111 $18.156 $51.509 $8.253 $0.907 $1.089 $30.298 $16.667 $148.822 $52.088 $113.401 0.909 $103.105 1
16 113 71 19 23 135 $94.00 $28.20 $3.33 $200.349 $13.499 $16.219 $46.013 $7.373 $0.810 $0.973 $27.065 $16.667 $131.165 $45.908 $101.924 0.903 $92.043 1
17 108 68 18 22 129 $94.00 $28.20 $3.33 $191.084 $12.874 $15.469 $43.885 $7.032 $0.772 $0.928 $25.813 $16.667 $124.329 $43.515 $97.481 0.897 $87.434 1
18 103 65 17 21 123 $94.00 $28.20 $3.33 $182.248 $12.279 $14.753 $41.856 $6.707 $0.737 $0.885 $24.620 $16.667 $117.809 $41.233 $93.243 0.891 $83.066 1
19 98 62 17 20 117 $94.00 $28.20 $3.33 $173.820 $11.711 $14.071 $39.921 $6.397 $0.703 $0.844 $23.481 $16.667 $111.591 $39.057 $89.201 0.885 $78.926 1
20 93 59 16 19 112 $94.00 $28.20 $3.33 $165.782 $11.170 $13.420 $38.074 $6.101 $0.670 $0.805 $22.395 $16.667 $105.660 $36.981 $85.345 0.879 $75.004 1
21 89 56 15 18 107 $94.00 $28.20 $3.33 $158.116 $10.653 $12.800 $36.314 $5.819 $0.639 $0.768 $21.360 $16.667 $100.003 $35.001 $81.669 0.873 $71.286 1
22 85 53 14 17 102 $94.00 $28.20 $3.33 $150.804 $10.161 $12.208 $34.635 $5.550 $0.610 $0.732 $20.372 $16.667 $94.608 $33.113 $78.162 0.867 $67.763 1
23 81 51 14 16 97 $94.00 $28.20 $3.33 $143.831 $9.691 $11.643 $33.033 $5.293 $0.581 $0.699 $19.430 $16.667 $89.462 $31.312 $74.817 0.861 $64.424 1
24 77 49 13 15 93 $94.00 $28.20 $3.33 $137.180 $9.243 $11.105 $31.505 $5.048 $0.555 $0.666 $18.532 $16.667 $84.555 $29.594 $71.627 0.855 $61.259 1
25 74 46 13 15 88 $94.00 $28.20 $3.33 $130.836 $8.815 $10.591 $30.049 $4.815 $0.529 $0.635 $17.675 $16.667 $79.874 $27.956 $68.585 0.849 $58.260 1
26 70 44 12 14 84 $94.00 $28.20 $3.33 $124.786 $8.408 $10.102 $28.659 $4.592 $0.504 $0.606 $16.857 $16.667 $75.410 $26.393 $65.683 0.844 $55.417 1
27 67 42 11 13 80 $94.00 $28.20 $3.33 $119.015 $8.019 $9.635 $27.334 $4.380 $0.481 $0.578 $16.078 $16.667 $71.152 $24.903 $62.915 0.838 $52.722 1
28 64 40 11 13 77 $94.00 $28.20 $3.33 $113.512 $7.648 $9.189 $26.070 $4.177 $0.459 $0.551 $15.334 $16.667 $67.091 $23.482 $60.276 0.832 $50.168 1
29 61 38 10 12 73 $94.00 $28.20 $3.33 $108.555 $7.314 $8.788 $24.931 $3.995 $0.439 $0.527 $14.665 $16.667 $63.434 $22.202 $57.898 0.827 $47.863 1
30 58 37 10 12 70 $94.00 $28.20 $3.33 $103.815 $6.995 $8.404 $23.843 $3.820 $0.420 $0.504 $14.024 $16.667 $59.936 $20.978 $55.625 0.821 $45.672 1
31 56 35 10 11 67 $94.00 $28.20 $3.33 $99.282 $6.689 $8.037 $22.802 $3.654 $0.401 $0.482 $13.412 $16.667 $56.591 $19.807 $53.451 0.816 $43.589 1
32 53 34 9 11 64 $94.00 $28.20 $3.33 $94.947 $6.397 $7.686 $21.806 $3.494 $0.384 $0.461 $12.826 $16.667 $53.392 $18.687 $51.372 0.810 $41.610 1
33 51 32 9 10 61 $94.00 $28.20 $3.33 $90.801 $6.118 $7.351 $20.854 $3.341 $0.367 $0.441 $12.266 $16.667 $50.333 $17.617 $49.383 0.804 $39.728 1
34 49 31 8 10 59 $94.00 $28.20 $3.33 $86.837 $5.851 $7.030 $19.943 $3.196 $0.351 $0.422 $11.731 $16.667 $47.408 $16.593 $47.482 0.799 $37.940 1
35 47 29 8 9 56 $94.00 $28.20 $3.33 $83.045 $5.595 $6.723 $19.073 $3.056 $0.336 $0.403 $11.218 $16.667 $44.610 $15.613 $45.663 0.794 $36.239 1
36 45 28 8 9 54 $94.00 $28.20 $3.33 $79.419 $5.351 $6.429 $18.240 $2.923 $0.321 $0.386 $10.729 $16.667 $41.934 $14.677 $43.924 0.788 $34.623 1
37 43 27 7 9 51 $94.00 $28.20 $3.33 $75.951 $5.117 $6.148 $17.443 $2.795 $0.307 $0.369 $10.260 $16.667 $39.376 $13.781 $42.261 0.783 $33.086 1
38 41 26 7 8 49 $94.00 $28.20 $3.33 $72.635 $4.894 $5.880 $16.682 $2.673 $0.294 $0.353 $9.812 $16.667 $36.929 $12.925 $40.670 0.778 $31.625 1
39 39 25 7 8 47 $94.00 $28.20 $3.33 $69.463 $4.680 $5.623 $15.953 $2.556 $0.281 $0.337 $9.384 $16.667 $34.588 $12.106 $39.149 0.772 $30.236 1
40 37 24 6 7 45 $94.00 $28.20 $3.33 $66.430 $4.476 $5.378 $15.257 $2.445 $0.269 $0.323 $8.974 $16.667 $32.350 $11.323 $37.694 0.767 $28.915 1
Capex ($1,000s) Production (boe/d) Prices Cash Flows ($1,000)
Results
minimum (breakeven) EUR and IP (flow) for the given price: minimum (breakeven) EUR and IP (flow) for the given price:
Full Cycle DUC Full Cycle DUC
Baseline Results (2016 factor prices) Sensitivity Results (2014 factor prices, G2=133%)
Eagle Ford: Condensate Region My Assumptions:
Basin Characteristics Average Well Eagle Ford: Condensate Region Eagle Ford: Condensate Region
jsmith:
Constant exponential
decline begins at year 4
Page 59
Appendix A: Minimum EUR as function of price, 2014 and 2016 Cost scenarios.
A-8
Eagle Ford Oil
133% oilfield service & supply factor price scalar
$6.00 cost/well ($mm) IP EUR 30 days/month
368 EUR/well (mboe) 915 515 -1.25% exponential decline rate after year 3 (monthly)
-75% 1st yr decline -11.0% 227 $100.00 oil price WTI ($/bbl)
-47% 2nd yr decline -5.1% 121 0% oil price appreciation (per month) Price EUR IP EUR IP Price EUR IP EUR IP
-31% 3rd yr decline -3.0% 101 $3.50 gas price Henry Hub ($/mcf) $20 2,048 3,639 1,017 1,807 $20 5,645 10,029 2802 4,978
654 IP rate (boe/d) 0% gas price appreciation $25 1,336 2,374 664 1,180 $25 2,681 4,763 1331 2,365
$8.00 opex-LOE ($/boe) 30% NGL price/oil price (fixed ratio) $30 991 1,761 493 876 $30 1,758 3,123 873 1,551
71% % oil 0.68% discount rate (compound monthly) $35 788 1,400 392 696 $35 1,307 2,322 650 1,155
15% % gas 8.5% discount rate (annual) $40 654 1,162 326 579 $40 1,041 1,850 517 919
14% % NGL 80% intangible drilling cost / total capex $45 559 993 279 496 $45 865 1,537 430 764
20.0% royalty rate 1.777 IP/EUR ratio, (B8/B4 = fixed ratio) $50 488 867 244 434 $50 740 1,315 368 654
4.6% oil prod tax $60 390 693 195 346 $60 574 1,020 286 508
7.5% gas prod tax $70 324 576 162 288 $70 469 833 233 414
7.5% NGL prod tax $1.442 = NPV/well ($ million) $80 278 494 139 247 $80 396 704 197 350
35.0% income tax rate 0 = EUR check (mboe) $90 243 432 122 217 $90 343 609 171 304
-5% oil differential 1.29% = ATIRR (monthly) $100 216 384 108 192 $100 303 538 151 268
-5% gas differential 16.61% = ATIRR (annual)
0 1 = DUC 368 = total production (mboe)
25% auxillary cost/well cost $3.468 = "tail end" NPV/well ($ million)
50% completion cost/well cost 100% = "tail end" recovery factor
$2,000 min opex ($/month) 0 = months of lost production
Per Well Net Cash Flow Analysis
mcf/d AT NPV Active
Month Well Cost Aux. Cost Total Oil NGL Gas Gas Prod Oil/bbl NGL/bbl Gas/mcf Oil Rev Gas Rev NGL Rev Royalty Oil Tax Gas Tax NGL Tax Opex Depeciation Tax. Inc. Income Tax NCF PV Factor $1,442 1/0
1 $1,995 $499 $95.00 $28.50 $3.33 $1,995.000 -$1,995.00 -$698.250 -1,796 1.000 -$1,795.50
2 $1,995 $499 $95.00 $28.50 $3.33 $1,995.000 -$1,995.00 -$698.250 -1,796 0.993 -$1,783.33
3 $1,995 $499 $95.00 $28.50 $3.33 $1,995.000 -$1,995.00 -$698.250 -1,796 0.986 -$1,771.25
4 $1,995 $499 $95.00 $28.50 $3.33 $1,995.000 -$1,995.00 -$698.250 -1,796 0.980 -$1,759.25
5 654 464 92 98 588 $95.00 $28.50 $3.33 $1,322.902 $58.692 $78.256 $291.97 $48.68 $3.52 $4.70 $208.683 $16.625 $885.673 $309.985 $592.312 0.973 $576.422 1
6 582 413 81 87 524 $95.00 $28.50 $3.33 $1,177.818 $52.255 $69.674 $259.949 $43.344 $3.135 $4.180 $185.797 $16.625 $786.717 $275.351 $527.991 0.967 $510.345 1
7 518 368 73 78 466 $95.00 $28.50 $3.33 $1,048.645 $46.524 $62.033 $231.440 $38.590 $2.791 $3.722 $165.420 $16.625 $698.613 $244.515 $470.724 0.960 $451.909 1
8 461 328 65 69 415 $95.00 $28.50 $3.33 $933.639 $41.422 $55.229 $206.058 $34.358 $2.485 $3.314 $147.278 $16.625 $620.172 $217.060 $419.737 0.954 $400.230 1
9 411 292 58 62 370 $95.00 $28.50 $3.33 $831.246 $36.879 $49.172 $183.459 $30.590 $2.213 $2.950 $131.126 $16.625 $550.334 $192.617 $374.342 0.947 $354.526 1
10 366 260 51 55 329 $95.00 $28.50 $3.33 $740.082 $32.835 $43.779 $163.339 $27.235 $1.970 $2.627 $116.745 $16.625 $488.155 $170.854 $333.926 0.941 $314.107 1
11 326 231 46 49 293 $95.00 $28.50 $3.33 $658.916 $29.234 $38.978 $145.426 $24.248 $1.754 $2.339 $103.942 $16.625 $432.795 $151.478 $297.942 0.934 $278.360 1
12 290 206 41 43 261 $95.00 $28.50 $3.33 $586.652 $26.028 $34.703 $129.477 $21.589 $1.562 $2.082 $92.542 $16.625 $383.506 $134.227 $265.904 0.928 $246.745 1
13 258 183 36 39 232 $95.00 $28.50 $3.33 $522.313 $23.173 $30.897 $115.277 $19.221 $1.390 $1.854 $82.393 $16.625 $339.623 $118.868 $237.380 0.922 $218.784 1
14 230 163 32 34 207 $95.00 $28.50 $3.33 $465.030 $20.632 $27.509 $102.634 $17.113 $1.238 $1.651 $73.357 $16.625 $300.553 $105.194 $211.985 0.915 $194.054 1
15 205 145 29 31 184 $95.00 $28.50 $3.33 $414.030 $18.369 $24.492 $91.378 $15.236 $1.102 $1.470 $65.312 $16.625 $265.768 $93.019 $189.374 0.909 $172.181 1
16 182 129 26 27 164 $95.00 $28.50 $3.33 $368.623 $16.354 $21.806 $81.357 $13.565 $0.981 $1.308 $58.149 $16.625 $234.798 $82.179 $169.243 0.903 $152.836 1
17 173 123 24 26 156 $95.00 $28.50 $3.33 $349.890 $15.523 $20.698 $77.222 $12.876 $0.931 $1.242 $55.194 $16.625 $222.021 $77.707 $160.938 0.897 $144.351 1
18 164 117 23 25 148 $95.00 $28.50 $3.33 $332.109 $14.734 $19.646 $73.298 $12.222 $0.884 $1.179 $52.389 $16.625 $209.893 $73.463 $153.056 0.891 $136.351 1
19 156 111 22 23 140 $95.00 $28.50 $3.33 $315.232 $13.986 $18.648 $69.573 $11.601 $0.839 $1.119 $49.727 $16.625 $198.382 $69.434 $145.573 0.885 $128.806 1
20 148 105 21 22 133 $95.00 $28.50 $3.33 $299.213 $13.275 $17.700 $66.037 $11.011 $0.796 $1.062 $47.200 $16.625 $187.456 $65.609 $138.471 0.879 $121.692 1
21 140 100 20 21 126 $95.00 $28.50 $3.33 $284.007 $12.600 $16.800 $62.682 $10.451 $0.756 $1.008 $44.801 $16.625 $177.085 $61.980 $131.730 0.873 $114.983 1
22 133 95 19 20 120 $95.00 $28.50 $3.33 $269.574 $11.960 $15.947 $59.496 $9.920 $0.718 $0.957 $42.524 $16.625 $167.241 $58.534 $125.331 0.867 $108.657 1
23 126 90 18 19 114 $95.00 $28.50 $3.33 $255.875 $11.352 $15.136 $56.473 $9.416 $0.681 $0.908 $40.363 $16.625 $157.897 $55.264 $119.258 0.861 $102.691 1
24 120 85 17 18 108 $95.00 $28.50 $3.33 $242.872 $10.775 $14.367 $53.603 $8.938 $0.647 $0.862 $38.312 $16.625 $149.028 $52.160 $113.493 0.855 $97.065 1
25 114 81 16 17 103 $95.00 $28.50 $3.33 $230.530 $10.228 $13.637 $50.879 $8.483 $0.614 $0.818 $36.365 $16.625 $140.610 $49.213 $108.021 0.849 $91.759 1
26 108 77 15 16 97 $95.00 $28.50 $3.33 $218.815 $9.708 $12.944 $48.293 $8.052 $0.582 $0.777 $34.517 $16.625 $132.619 $46.417 $102.828 0.844 $86.756 1
27 103 73 14 15 92 $95.00 $28.50 $3.33 $207.695 $9.215 $12.286 $45.839 $7.643 $0.553 $0.737 $32.763 $16.625 $125.035 $43.762 $97.898 0.838 $82.037 1
28 97 69 14 15 88 $95.00 $28.50 $3.33 $197.140 $8.746 $11.662 $43.510 $7.255 $0.525 $0.700 $31.098 $16.625 $117.836 $41.243 $93.219 0.832 $77.586 1
29 94 67 13 14 85 $95.00 $28.50 $3.33 $191.187 $8.482 $11.310 $42.196 $7.036 $0.509 $0.679 $30.159 $16.625 $113.776 $39.822 $90.579 0.827 $74.879 1
30 92 65 13 14 82 $95.00 $28.50 $3.33 $185.414 $8.226 $10.968 $40.922 $6.823 $0.494 $0.658 $29.248 $16.625 $109.838 $38.443 $88.020 0.821 $72.270 1
31 89 63 12 13 80 $95.00 $28.50 $3.33 $179.815 $7.978 $10.637 $39.686 $6.617 $0.479 $0.638 $28.365 $16.625 $106.020 $37.107 $85.538 0.816 $69.756 1
32 86 61 12 13 78 $95.00 $28.50 $3.33 $174.385 $7.737 $10.316 $38.488 $6.417 $0.464 $0.619 $27.509 $16.625 $102.316 $35.811 $83.131 0.810 $67.334 1
33 84 59 12 13 75 $95.00 $28.50 $3.33 $169.120 $7.503 $10.004 $37.325 $6.224 $0.450 $0.600 $26.678 $16.625 $98.725 $34.554 $80.796 0.804 $65.000 1
34 81 58 11 12 73 $95.00 $28.50 $3.33 $164.013 $7.277 $9.702 $36.198 $6.036 $0.437 $0.582 $25.872 $16.625 $95.241 $33.334 $78.532 0.799 $62.750 1
35 79 56 11 12 71 $95.00 $28.50 $3.33 $159.060 $7.057 $9.409 $35.105 $5.853 $0.423 $0.565 $25.091 $16.625 $91.863 $32.152 $76.336 0.794 $60.582 1
36 76 54 11 11 69 $95.00 $28.50 $3.33 $154.257 $6.844 $9.125 $34.045 $5.677 $0.411 $0.548 $24.334 $16.625 $88.587 $31.006 $74.207 0.788 $58.493 1
37 74 52 10 11 67 $95.00 $28.50 $3.33 $149.599 $6.637 $8.850 $33.017 $5.505 $0.398 $0.531 $23.599 $16.625 $85.410 $29.894 $72.142 0.783 $56.480 1
38 72 51 10 11 65 $95.00 $28.50 $3.33 $145.082 $6.437 $8.582 $32.020 $5.339 $0.386 $0.515 $22.886 $16.625 $82.329 $28.815 $70.139 0.778 $54.540 1
39 70 49 10 10 63 $95.00 $28.50 $3.33 $140.701 $6.242 $8.323 $31.053 $5.178 $0.375 $0.499 $22.195 $16.625 $79.341 $27.769 $68.197 0.772 $52.671 1
40 67 48 9 10 61 $95.00 $28.50 $3.33 $136.452 $6.054 $8.072 $30.116 $5.021 $0.363 $0.484 $21.525 $16.625 $76.443 $26.755 $66.313 0.767 $50.869 1
Capex ($1,000s) Production (boe/d) Prices Cash Flows ($1,000)
Results
minimum (breakeven) EUR and IP (flow) for the given price: minimum (breakeven) EUR and IP (flow) for the given price:
Full Cycle DUC Full Cycle DUC
Baseline Results (2016 factor prices) Sensitivity Results (2014 factor prices, G2=133%)
Eagle Ford: Oil Region My Assumptions:
Basin Characteristics Average Well Eagle Ford: Oil Region Eagle Ford: Oil Region
jsmith:
Constant exponential
decline begins at year 4
Page 60
Appendix A: Minimum EUR as function of price, 2014 and 2016 Cost scenarios.
A-9
Eagle Ford Combo
133% oilfield service & supply factor price scalar
$5.50 cost/well ($mm) IP EUR 30 days/month
2,082 EUR/well (mboe) 1,085 898 -1.33% exponential decline rate after year 3 (monthly)
-58% 1st yr decline -7.0% 452 $20.00 oil price WTI ($/bbl)
-40% 2nd yr decline -4.2% 270 0% oil price appreciation (per month) Price EUR IP EUR IP Price EUR IP EUR IP
-35% 3rd yr decline -3.6% 217 $3.50 gas price Henry Hub ($/mcf) $20 1,923 2,323 956 1,155 $20 4,193 5,066 2,082 2,516
2,515 IP rate (boe/d) 0% gas price appreciation $25 1,579 1,908 786 950 $25 3,088 3,731 1,533 1,852
$6.00 opex-LOE ($/boe) 30% NGL price/oil price (fixed ratio) $30 1,340 1,619 667 806 $30 2,444 2,953 1,214 1,467
21% % oil 0.68% discount rate (compound monthly) $35 1,163 1,405 579 700 $35 2,022 2,443 1,005 1,214
45% % gas 8.5% discount rate (annual) $40 1,028 1,242 512 619 $40 1,724 2,083 857 1,035
34% % NGL 80% intangible drilling cost / total capex $45 921 1,113 459 555 $45 1,503 1,816 747 903
20.0% royalty rate 1.208 IP/EUR ratio, (B8/B4 = fixed ratio) $50 834 1,008 416 503 $50 1,333 1,611 663 801
4.6% oil prod tax $60 702 848 350 423 $60 1,086 1,312 540 652
7.5% gas prod tax $70 606 732 302 365 $70 916 1,107 456 551
7.5% NGL prod tax $0.000 = NPV/well ($ million) $80 533 644 266 321 $80 793 958 395 477
35.0% income tax rate 0 = EUR check (mboe) $90 476 575 238 288 $90 698 843 348 420
-6% oil differential 0.68% = ATIRR (monthly) $100 429 518 215 260 $100 624 754 311 376
-5% gas differential 8.50% = ATIRR (annual)
1 1 = DUC 2,082 = total production (mboe)
25% auxillary cost/well cost $1.463 = "tail end" NPV/well ($ million)
50% completion cost/well cost 100% = "tail end" recovery factor
$2,000 min opex ($/month) 1 = months of lost production
Per Well Net Cash Flow Analysis
mcf/d AT NPV Active
Month Well Cost Aux. Cost Total Oil NGL Gas Gas Prod Oil/bbl NGL/bbl Gas/mcf Oil Rev Gas Rev NGL Rev Royalty Oil Tax Gas Tax NGL Tax Opex Depeciation Tax. Inc. Income Tax NCF PV Factor $0 1/0
1 $0 $0 $18.80 $5.64 $3.33 $0.000 $0.00 $0.000 0 1.000 $0.00
2 $0 $0 $18.80 $5.64 $3.33 $0.000 $0.00 $0.000 0 0.993 $0.00
3 $1,829 $457 $18.80 $5.64 $3.33 $1,828.750 -$1,828.75 -$640.063 -1,646 0.986 -$1,623.65
4 $1,829 $457 $18.80 $5.64 $3.33 $1,828.750 -$1,828.75 -$640.063 -1,646 0.980 -$1,612.65
5 2515 528 855 1132 6,790 $18.80 $5.64 $3.33 $297.875 $677.348 $144.682 $223.98 $10.96 $40.64 $8.68 $602.087 $7.620 $225.933 $79.077 $154.476 0.973 $150.332 1
6 2338 491 795 1052 6,313 $18.80 $5.64 $3.33 $276.913 $629.682 $134.500 $208.219 $10.190 $37.781 $8.070 $559.717 $7.620 $209.498 $73.324 $143.793 0.967 $138.988 1
7 2173 456 739 978 5,868 $18.80 $5.64 $3.33 $257.426 $585.369 $125.035 $193.566 $9.473 $35.122 $7.502 $520.328 $7.620 $194.219 $67.976 $133.862 0.960 $128.511 1
8 2021 424 687 909 5,455 $18.80 $5.64 $3.33 $239.310 $544.176 $116.236 $179.944 $8.807 $32.651 $6.974 $483.712 $7.620 $180.015 $63.005 $124.629 0.954 $118.837 1
9 1878 394 639 845 5,071 $18.80 $5.64 $3.33 $222.469 $505.881 $108.056 $167.281 $8.187 $30.353 $6.483 $449.672 $7.620 $166.810 $58.384 $116.047 0.947 $109.904 1
10 1746 367 594 786 4,715 $18.80 $5.64 $3.33 $206.814 $470.281 $100.452 $155.509 $7.611 $28.217 $6.027 $418.027 $7.620 $154.535 $54.087 $108.068 0.941 $101.654 1
11 1623 341 552 730 4,383 $18.80 $5.64 $3.33 $192.260 $437.186 $93.383 $144.566 $7.075 $26.231 $5.603 $388.610 $7.620 $143.124 $50.093 $100.650 0.934 $94.035 1
12 1509 317 513 679 4,074 $18.80 $5.64 $3.33 $178.730 $406.420 $86.812 $134.392 $6.577 $24.385 $5.209 $361.262 $7.620 $132.516 $46.381 $93.755 0.928 $87.000 1
13 1403 295 477 631 3,788 $18.80 $5.64 $3.33 $166.152 $377.819 $80.702 $124.935 $6.114 $22.669 $4.842 $335.840 $7.620 $122.654 $42.929 $87.345 0.922 $80.502 1
14 1304 274 443 587 3,521 $18.80 $5.64 $3.33 $154.460 $351.231 $75.023 $116.143 $5.684 $21.074 $4.501 $312.206 $7.620 $113.487 $39.720 $81.386 0.915 $74.502 1
15 1212 255 412 546 3,273 $18.80 $5.64 $3.33 $143.590 $326.514 $69.744 $107.970 $5.284 $19.591 $4.185 $290.235 $7.620 $104.964 $36.737 $75.846 0.909 $68.961 1
16 1127 237 383 507 3,043 $18.80 $5.64 $3.33 $133.485 $303.537 $64.836 $100.372 $4.912 $18.212 $3.890 $269.811 $7.620 $97.041 $33.964 $70.697 0.903 $63.843 1
17 1080 227 367 486 2,915 $18.80 $5.64 $3.33 $127.875 $290.779 $62.111 $96.153 $4.706 $17.447 $3.727 $258.471 $7.620 $92.642 $32.425 $67.837 0.897 $60.846 1
18 1034 217 352 465 2,793 $18.80 $5.64 $3.33 $122.500 $278.558 $59.500 $92.112 $4.508 $16.713 $3.570 $247.607 $7.620 $88.428 $30.950 $65.098 0.891 $57.993 1
19 991 208 337 446 2,675 $18.80 $5.64 $3.33 $117.352 $266.850 $56.999 $88.240 $4.319 $16.011 $3.420 $237.200 $7.620 $84.392 $29.537 $62.474 0.885 $55.279 1
20 949 199 323 427 2,563 $18.80 $5.64 $3.33 $112.420 $255.635 $54.604 $84.532 $4.137 $15.338 $3.276 $227.231 $7.620 $80.524 $28.184 $59.961 0.879 $52.695 1
21 909 191 309 409 2,455 $18.80 $5.64 $3.33 $107.695 $244.891 $52.309 $80.979 $3.963 $14.693 $3.139 $217.681 $7.620 $76.820 $26.887 $57.553 0.873 $50.236 1
22 871 183 296 392 2,352 $18.80 $5.64 $3.33 $103.168 $234.598 $50.110 $77.575 $3.797 $14.076 $3.007 $208.532 $7.620 $73.271 $25.645 $55.246 0.867 $47.896 1
23 834 175 284 376 2,253 $18.80 $5.64 $3.33 $98.832 $224.738 $48.004 $74.315 $3.637 $13.484 $2.880 $199.767 $7.620 $69.871 $24.455 $53.036 0.861 $45.668 1
24 799 168 272 360 2,158 $18.80 $5.64 $3.33 $94.678 $215.292 $45.987 $71.191 $3.484 $12.918 $2.759 $191.371 $7.620 $66.614 $23.315 $50.919 0.855 $43.548 1
25 766 161 260 345 2,068 $18.80 $5.64 $3.33 $90.699 $206.244 $44.054 $68.199 $3.338 $12.375 $2.643 $183.328 $7.620 $63.494 $22.223 $48.891 0.849 $41.531 1
26 734 154 249 330 1,981 $18.80 $5.64 $3.33 $86.887 $197.575 $42.202 $65.333 $3.197 $11.855 $2.532 $175.622 $7.620 $60.505 $21.177 $46.948 0.844 $39.610 1
27 703 148 239 316 1,897 $18.80 $5.64 $3.33 $83.235 $189.271 $40.428 $62.587 $3.063 $11.356 $2.426 $168.241 $7.620 $57.642 $20.175 $45.087 0.838 $37.782 1
28 673 141 229 303 1,818 $18.80 $5.64 $3.33 $79.737 $181.316 $38.729 $59.956 $2.934 $10.879 $2.324 $161.170 $7.620 $54.899 $19.215 $43.304 0.832 $36.042 1
29 649 136 221 292 1,753 $18.80 $5.64 $3.33 $76.885 $174.831 $37.344 $57.812 $2.829 $10.490 $2.241 $155.406 $7.620 $52.663 $18.432 $41.851 0.827 $34.597 1
30 626 131 213 282 1,690 $18.80 $5.64 $3.33 $74.135 $168.578 $36.008 $55.744 $2.728 $10.115 $2.161 $149.848 $7.620 $50.507 $17.677 $40.449 0.821 $33.212 1
31 604 127 205 272 1,630 $18.80 $5.64 $3.33 $71.484 $162.549 $34.721 $53.751 $2.631 $9.753 $2.083 $144.488 $7.620 $48.428 $16.950 $39.098 0.816 $31.885 1
32 582 122 198 262 1,571 $18.80 $5.64 $3.33 $68.927 $156.736 $33.479 $51.828 $2.537 $9.404 $2.009 $139.320 $7.620 $46.423 $16.248 $37.795 0.810 $30.613 1
33 561 118 191 253 1,515 $18.80 $5.64 $3.33 $66.462 $151.130 $32.281 $49.975 $2.446 $9.068 $1.937 $134.338 $7.620 $44.491 $15.572 $36.539 0.804 $29.395 1
34 541 114 184 243 1,461 $18.80 $5.64 $3.33 $64.085 $145.725 $31.127 $48.187 $2.358 $8.743 $1.868 $129.533 $7.620 $42.627 $14.919 $35.327 0.799 $28.228 1
35 522 110 177 235 1,409 $18.80 $5.64 $3.33 $61.793 $140.513 $30.014 $46.464 $2.274 $8.431 $1.801 $124.900 $7.620 $40.830 $14.290 $34.159 0.794 $27.110 1
36 503 106 171 226 1,358 $18.80 $5.64 $3.33 $59.583 $135.487 $28.940 $44.802 $2.193 $8.129 $1.736 $120.433 $7.620 $39.097 $13.684 $33.033 0.788 $26.038 1
37 485 102 165 218 1,310 $18.80 $5.64 $3.33 $57.452 $130.641 $27.905 $43.200 $2.114 $7.838 $1.674 $116.126 $7.620 $37.426 $13.099 $31.947 0.783 $25.011 1
38 468 98 159 210 1,263 $18.80 $5.64 $3.33 $55.397 $125.969 $26.907 $41.655 $2.039 $7.558 $1.614 $111.972 $7.620 $35.815 $12.535 $30.900 0.778 $24.028 1
39 451 95 153 203 1,218 $18.80 $5.64 $3.33 $53.416 $121.464 $25.945 $40.165 $1.966 $7.288 $1.557 $107.968 $7.620 $34.261 $11.992 $29.890 0.772 $23.085 1
40 435 91 148 196 1,174 $18.80 $5.64 $3.33 $51.505 $117.119 $25.017 $38.728 $1.895 $7.027 $1.501 $104.106 $7.620 $32.764 $11.467 $28.916 0.767 $22.182 1
Capex ($1,000s) Production (boe/d) Prices Cash Flows ($1,000)
Results
minimum (breakeven) EUR and IP (flow) for the given price: minimum (breakeven) EUR and IP (flow) for the given price:
Full Cycle DUR Full Cycle DUC
Baseline Results (2016 factor prices) Sensitivity Results (2014 factor prices, G2=133%)
Eagle Ford: Combo Region My Assumptions:
Basin Characteristics Average Well Eagle Ford: Combo Region Eagle Ford: Combo Region
jsmith:
Constant exponential
decline begins at year 4
Page 61
Appendix A: Minimum EUR as function of price, 2014 and 2016 Cost scenarios.
A-10
Bakken Core
100% oilfield service & supply factor price scalar
$7.50 cost/well ($mm) IP EUR 30 days/month
100 EUR/well (mboe) 851 725 -0.73% exponential decline rate after year 3 (monthly)
-71% 1st yr decline -9.7% 250 $20.00 oil price WTI ($/bbl)
-38% 2nd yr decline -4.0% 154 0% oil price appreciation (per month) Price EUR IP EUR IP Price EUR IP EUR IP
-34% 3rd yr decline -3.4% 125 $3.50 gas price Henry Hub ($/mcf) $20 2,970 3,486 1,474 1,730 $20 7,767 9,117 3855 4,525
117 IP rate (boe/d) 0% gas price appreciation $25 1,946 2,284 966 1,134 $25 3,819 4,483 1896 2,226
$7.57 opex-LOE ($/boe) 30% NGL price/oil price (fixed ratio) $30 1,448 1,700 719 844 $30 2,532 2,972 1257 1,475
85% % oil 0.68% discount rate (compound monthly) $35 1,152 1,352 572 671 $35 1,894 2,223 940 1,103
13% % gas 8.5% discount rate (annual) $40 957 1,123 475 558 $40 1,513 1,776 751 882
2% % NGL 80% intangible drilling cost / total capex $45 818 960 406 477 $45 1,259 1,478 625 734
20.0% royalty rate 1.174 IP/EUR ratio, (B8/B4 = fixed ratio) $50 715 839 355 417 $50 1,078 1,265 535 628
10.0% oil prod tax $60 571 670 284 333 $60 838 984 416 488
10.0% gas prod tax $70 475 558 236 277 $70 685 804 340 399
10.0% NGL prod tax -$6.050 = NPV/well ($ million) $80 406 477 202 237 $80 579 680 288 338
35.0% income tax rate 0 = EUR check (mboe) $90 355 417 177 208 $90 502 589 249 292
-13.3% oil differential -2.57% = ATIRR (monthly) $100 316 371 157 184 $100 443 520 220 258
0% gas differential -26.80% = ATIRR (annual)
0 1 = DUC 100 = total production (mboe)
25% auxillary cost/well cost $0.437 = "tail end" NPV/well ($ million)
50% completion cost/well cost 73% = "tail end" recovery factor
$2,000 min opex ($/month) 174 = months of lost production
Per Well Net Cash Flow Analysis
mcf/d AT NPV Active
Month Well Cost Aux. Cost Total Oil NGL Gas Gas Prod Oil/bbl NGL/bbl Gas/mcf Oil Rev Gas Rev NGL Rev Royalty Oil Tax Gas Tax NGL Tax Opex Depeciation Tax. Inc. Income Tax NCF PV Factor -$6,050 1/0
1 $1,875 $469 $17.34 $5.20 $3.50 $1,875.000 -$1,875.00 -$656.250 -1,688 1.000 -$1,687.50
2 $1,875 $469 $17.34 $5.20 $3.50 $1,875.000 -$1,875.00 -$656.250 -1,688 0.993 -$1,676.07
3 $1,875 $469 $17.34 $5.20 $3.50 $1,875.000 -$1,875.00 -$656.250 -1,688 0.986 -$1,664.71
4 $1,875 $469 $17.34 $5.20 $3.50 $1,875.000 -$1,875.00 -$656.250 -1,688 0.980 -$1,653.43
5 117 100 2 15 92 $17.34 $5.20 $3.50 $51.902 $9.613 $0.366 $12.38 $4.15 $0.77 $0.03 $26.657 $15.625 $2.273 $0.795 $17.102 0.973 $16.643 1
6 106 90 2 14 83 $17.34 $5.20 $3.50 $46.865 $8.680 $0.331 $11.175 $3.749 $0.694 $0.026 $24.070 $15.625 $0.536 $0.188 $15.973 0.967 $15.439 1
7 96 81 2 12 75 $17.34 $5.20 $3.50 $42.317 $7.838 $0.299 $10.091 $3.385 $0.627 $0.024 $21.734 $15.625 -$1.032 -$0.361 $14.954 0.960 $14.356 1
8 86 73 2 11 67 $17.34 $5.20 $3.50 $38.211 $7.077 $0.270 $9.112 $3.057 $0.566 $0.022 $19.625 $15.625 -$2.448 -$0.857 $14.033 0.954 $13.381 1
9 78 66 2 10 61 $17.34 $5.20 $3.50 $34.503 $6.391 $0.244 $8.227 $2.760 $0.511 $0.019 $17.721 $15.625 -$3.727 -$1.305 $13.202 0.947 $12.503 1
10 70 60 1 9 55 $17.34 $5.20 $3.50 $31.154 $5.770 $0.220 $7.429 $2.492 $0.462 $0.018 $16.001 $15.625 -$4.882 -$1.709 $12.452 0.941 $11.713 1
11 64 54 1 8 50 $17.34 $5.20 $3.50 $28.131 $5.211 $0.199 $6.708 $2.250 $0.417 $0.016 $14.448 $15.625 -$5.924 -$2.074 $11.774 0.934 $11.000 1
12 57 49 1 7 45 $17.34 $5.20 $3.50 $25.401 $4.705 $0.179 $6.057 $2.032 $0.376 $0.014 $13.046 $15.625 -$6.866 -$2.403 $11.162 0.928 $10.358 1
13 52 44 1 7 40 $17.34 $5.20 $3.50 $22.936 $4.248 $0.162 $5.469 $1.835 $0.340 $0.013 $11.780 $15.625 -$7.716 -$2.700 $10.610 0.922 $9.779 1
14 47 40 1 6 37 $17.34 $5.20 $3.50 $20.710 $3.836 $0.146 $4.939 $1.657 $0.307 $0.012 $10.637 $15.625 -$8.483 -$2.969 $10.111 0.915 $9.256 1
15 42 36 1 5 33 $17.34 $5.20 $3.50 $18.701 $3.464 $0.132 $4.459 $1.496 $0.277 $0.011 $9.605 $15.625 -$9.176 -$3.212 $9.660 0.909 $8.783 1
16 38 32 1 5 30 $17.34 $5.20 $3.50 $16.886 $3.128 $0.119 $4.027 $1.351 $0.250 $0.010 $8.673 $15.625 -$9.802 -$3.431 $9.254 0.903 $8.357 1
17 37 31 1 5 29 $17.34 $5.20 $3.50 $16.218 $3.004 $0.114 $3.867 $1.297 $0.240 $0.009 $8.329 $15.625 -$10.033 -$3.511 $9.104 0.897 $8.166 1
18 35 30 1 5 27 $17.34 $5.20 $3.50 $15.576 $2.885 $0.110 $3.714 $1.246 $0.231 $0.009 $8.000 $15.625 -$10.254 -$3.589 $8.960 0.891 $7.982 1
19 34 29 1 4 26 $17.34 $5.20 $3.50 $14.960 $2.771 $0.106 $3.567 $1.197 $0.222 $0.008 $7.683 $15.625 -$10.466 -$3.663 $8.822 0.885 $7.806 1
20 32 28 1 4 25 $17.34 $5.20 $3.50 $14.368 $2.661 $0.101 $3.426 $1.149 $0.213 $0.008 $7.379 $15.625 -$10.670 -$3.735 $8.689 0.879 $7.636 1
21 31 27 1 4 24 $17.34 $5.20 $3.50 $13.799 $2.556 $0.097 $3.290 $1.104 $0.204 $0.008 $7.087 $15.625 -$10.867 -$3.803 $8.562 0.873 $7.473 1
22 30 25 1 4 23 $17.34 $5.20 $3.50 $13.253 $2.455 $0.094 $3.160 $1.060 $0.196 $0.007 $6.807 $15.625 -$11.055 -$3.869 $8.439 0.867 $7.317 1
23 29 24 1 4 22 $17.34 $5.20 $3.50 $12.729 $2.358 $0.090 $3.035 $1.018 $0.189 $0.007 $6.537 $15.625 -$11.236 -$3.932 $8.322 0.861 $7.166 1
24 28 24 1 4 22 $17.34 $5.20 $3.50 $12.225 $2.264 $0.086 $2.915 $0.978 $0.181 $0.007 $6.279 $15.625 -$11.409 -$3.993 $8.209 0.855 $7.021 1
25 27 23 1 3 21 $17.34 $5.20 $3.50 $11.741 $2.175 $0.083 $2.800 $0.939 $0.174 $0.007 $6.030 $15.625 -$11.576 -$4.052 $8.100 0.849 $6.881 1
26 26 22 1 3 20 $17.34 $5.20 $3.50 $11.277 $2.089 $0.080 $2.689 $0.902 $0.167 $0.006 $5.792 $15.625 -$11.736 -$4.108 $7.996 0.844 $6.747 1
27 24 21 0 3 19 $17.34 $5.20 $3.50 $10.830 $2.006 $0.076 $2.583 $0.866 $0.160 $0.006 $5.562 $15.625 -$11.890 -$4.162 $7.896 0.838 $6.617 1
28 24 20 0 3 18 $17.34 $5.20 $3.50 $10.402 $1.927 $0.073 $2.480 $0.832 $0.154 $0.006 $5.342 $15.625 -$12.038 -$4.213 $7.800 0.832 $6.492 1
29 23 19 0 3 18 $17.34 $5.20 $3.50 $10.046 $1.861 $0.071 $2.396 $0.804 $0.149 $0.006 $5.160 $15.625 -$12.161 -$4.256 $7.721 0.827 $6.382 1
30 22 19 0 3 17 $17.34 $5.20 $3.50 $9.703 $1.797 $0.068 $2.314 $0.776 $0.144 $0.005 $4.983 $15.625 -$12.279 -$4.298 $7.644 0.821 $6.276 1
31 21 18 0 3 17 $17.34 $5.20 $3.50 $9.371 $1.736 $0.066 $2.235 $0.750 $0.139 $0.005 $4.813 $15.625 -$12.393 -$4.338 $7.569 0.816 $6.173 1
32 20 17 0 3 16 $17.34 $5.20 $3.50 $9.051 $1.676 $0.064 $2.158 $0.724 $0.134 $0.005 $4.649 $15.625 -$12.504 -$4.376 $7.497 0.810 $6.073 1
33 20 17 0 3 15 $17.34 $5.20 $3.50 $8.742 $1.619 $0.062 $2.085 $0.699 $0.130 $0.005 $4.490 $15.625 -$12.611 -$4.414 $7.428 0.804 $5.976 1
34 19 16 0 2 15 $17.34 $5.20 $3.50 $8.443 $1.564 $0.060 $2.013 $0.675 $0.125 $0.005 $4.336 $15.625 -$12.714 -$4.450 $7.361 0.799 $5.882 1
35 18 16 0 2 14 $17.34 $5.20 $3.50 $8.154 $1.510 $0.058 $1.944 $0.652 $0.121 $0.005 $4.188 $15.625 -$12.813 -$4.485 $7.297 0.794 $5.791 1
36 18 15 0 2 14 $17.34 $5.20 $3.50 $7.876 $1.459 $0.056 $1.878 $0.630 $0.117 $0.004 $4.045 $15.625 -$12.909 -$4.518 $7.234 0.788 $5.702 1
37 17 15 0 2 13 $17.34 $5.20 $3.50 $7.607 $1.409 $0.054 $1.814 $0.609 $0.113 $0.004 $3.907 $15.625 -$13.002 -$4.551 $7.174 0.783 $5.616 1
38 17 14 0 2 13 $17.34 $5.20 $3.50 $7.347 $1.361 $0.052 $1.752 $0.588 $0.109 $0.004 $3.773 $15.625 -$13.092 -$4.582 $7.115 0.778 $5.533 1
39 16 14 0 2 13 $17.34 $5.20 $3.50 $7.096 $1.314 $0.050 $1.692 $0.568 $0.105 $0.004 $3.644 $15.625 -$13.178 -$4.612 $7.059 0.772 $5.452 1
40 15 13 0 2 12 $17.34 $5.20 $3.50 $6.853 $1.269 $0.048 $1.634 $0.548 $0.102 $0.004 $3.520 $15.625 -$13.262 -$4.642 $7.005 0.767 $5.373 1
Bakken: Core My Assumptions:
Basin Characteristics Average Well Bakken: Core Bakken: Core
minimum (breakeven) EUR and IP (flow) for the given price: minimum (breakeven) EUR and IP (flow) for the given price:
Full Cycle DUC Full Cycle DUC
Baseline Results (2016 factor prices) Sensitivity Results (2014 factor prices, G2=133%)
Results
Capex ($1,000s) Production (boe/d) Prices Cash Flows ($1,000)
jsmith:
Constant exponential
decline begins at year 4
Page 62
Appendix A: Minimum EUR as function of price, 2014 and 2016 Cost scenarios.
A-11
Bakken Non-Core
100% oilfield service & supply factor price scalar
$6.50 cost/well ($mm) IP EUR 30 days/month
193 EUR/well (mboe) 655 558 -0.82% exponential decline rate after year 3 (monthly)
-75% 1st yr decline -10.9% 165 $100.00 oil price WTI ($/bbl)
-30% 2nd yr decline -3.0% 115 0% oil price appreciation (per month) Price EUR IP EUR IP Price EUR IP EUR IP
-24% 3rd yr decline -2.3% 100 $3.50 gas price Henry Hub ($/mcf) $20 3,787 4,445 1,880 2,207 $20 35,582 41,767 17661 20,731
227 IP rate (boe/d) 0% gas price appreciation $25 2,101 2,466 1,043 1,224 $25 5,338 6,266 2650 3,111
$9.00 opex-LOE ($/boe) 30% NGL price/oil price (fixed ratio) $30 1,454 1,707 722 848 $30 2,886 3,388 1432 1,681
88% % oil 0.68% discount rate (compound monthly) $35 1,112 1,305 552 648 $35 1,977 2,321 981 1,152
9% % gas 8.5% discount rate (annual) $40 900 1,056 447 525 $40 1,504 1,765 746 876
3% % NGL 80% intangible drilling cost / total capex $45 756 887 375 440 $45 1,213 1,424 602 707
20.0% royalty rate 1.174 IP/EUR ratio, (B8/B4 = fixed ratio) $50 652 765 324 380 $50 1,017 1,194 505 593
10.0% oil prod tax $60 511 600 254 298 $60 768 902 381 447
10.0% gas prod tax $70 420 493 209 245 $70 617 724 306 359
10.0% NGL prod tax -$1.606 = NPV/well ($ million) $80 357 419 178 209 $80 516 606 256 301
35.0% income tax rate 0 = EUR check (mboe) $90 310 364 154 181 $90 443 520 220 258
-13.3% oil differential 0.14% = ATIRR (monthly) $100 274 322 137 161 $100 388 455 193 227
0% gas differential 1.67% = ATIRR (annual)
0 1 = DUC 193 = total production (mboe)
25% auxillary cost/well cost $2.364 = "tail end" NPV/well ($ million)
50% completion cost/well cost 100% = "tail end" recovery factor
$2,000 min opex ($/month) 0 = months of lost production
Per Well Net Cash Flow Analysis
mcf/d AT NPV Active
Month Well Cost Aux. Cost Total Oil NGL Gas Gas Prod Oil/bbl NGL/bbl Gas/mcf Oil Rev Gas Rev NGL Rev Royalty Oil Tax Gas Tax NGL Tax Opex Depeciation Tax. Inc. Income Tax NCF PV Factor -$1,606 1/0
1 $1,625 $406 $86.70 $26.01 $3.50 $1,625.000 -$1,625.00 -$568.750 -1,463 1.000 -$1,462.50
2 $1,625 $406 $86.70 $26.01 $3.50 $1,625.000 -$1,625.00 -$568.750 -1,463 0.993 -$1,452.59
3 $1,625 $406 $86.70 $26.01 $3.50 $1,625.000 -$1,625.00 -$568.750 -1,463 0.986 -$1,442.75
4 $1,625 $406 $86.70 $26.01 $3.50 $1,625.000 -$1,625.00 -$568.750 -1,463 0.980 -$1,432.97
5 227 199 7 20 122 $86.70 $26.01 $3.50 $518.500 $12.844 $5.303 $107.33 $41.48 $1.03 $0.42 $61.163 $13.542 $311.681 $109.088 $216.134 0.973 $210.336 1
6 202 178 6 18 109 $86.70 $26.01 $3.50 $462.224 $11.450 $4.727 $95.680 $36.978 $0.916 $0.378 $54.525 $13.542 $276.383 $96.734 $193.190 0.967 $186.734 1
7 180 158 5 16 97 $86.70 $26.01 $3.50 $412.056 $10.207 $4.214 $85.295 $32.964 $0.817 $0.337 $48.607 $13.542 $244.915 $85.720 $172.737 0.960 $165.832 1
8 160 141 5 14 87 $86.70 $26.01 $3.50 $367.332 $9.100 $3.757 $76.038 $29.387 $0.728 $0.301 $43.331 $13.542 $216.863 $75.902 $154.503 0.954 $147.322 1
9 143 126 4 13 77 $86.70 $26.01 $3.50 $327.463 $8.112 $3.349 $67.785 $26.197 $0.649 $0.268 $38.628 $13.542 $191.856 $67.150 $138.248 0.947 $130.930 1
10 128 112 4 11 69 $86.70 $26.01 $3.50 $291.922 $7.231 $2.986 $60.428 $23.354 $0.579 $0.239 $34.436 $13.542 $169.563 $59.347 $123.757 0.941 $116.412 1
11 114 100 3 10 61 $86.70 $26.01 $3.50 $260.238 $6.447 $2.662 $53.869 $20.819 $0.516 $0.213 $30.698 $13.542 $149.689 $52.391 $110.840 0.934 $103.555 1
12 101 89 3 9 55 $86.70 $26.01 $3.50 $231.992 $5.747 $2.373 $48.022 $18.559 $0.460 $0.190 $27.366 $13.542 $131.973 $46.190 $99.324 0.928 $92.167 1
13 90 80 3 8 49 $86.70 $26.01 $3.50 $206.813 $5.123 $2.115 $42.810 $16.545 $0.410 $0.169 $24.396 $13.542 $116.179 $40.663 $89.058 0.922 $82.081 1
14 81 71 2 7 43 $86.70 $26.01 $3.50 $184.366 $4.567 $1.886 $38.164 $14.749 $0.365 $0.151 $21.748 $13.542 $102.100 $35.735 $79.906 0.915 $73.147 1
15 72 63 2 6 39 $86.70 $26.01 $3.50 $164.355 $4.071 $1.681 $34.022 $13.148 $0.326 $0.134 $19.388 $13.542 $89.548 $31.342 $71.748 0.909 $65.234 1
16 64 56 2 6 35 $86.70 $26.01 $3.50 $146.517 $3.630 $1.498 $30.329 $11.721 $0.290 $0.120 $17.283 $13.542 $78.359 $27.426 $64.475 0.903 $58.224 1
17 62 55 2 6 34 $86.70 $26.01 $3.50 $142.175 $3.522 $1.454 $29.430 $11.374 $0.282 $0.116 $16.771 $13.542 $75.636 $26.472 $62.705 0.897 $56.242 1
18 60 53 2 5 33 $86.70 $26.01 $3.50 $137.961 $3.418 $1.411 $28.558 $11.037 $0.273 $0.113 $16.274 $13.542 $72.993 $25.547 $60.987 0.891 $54.331 1
19 58 51 2 5 32 $86.70 $26.01 $3.50 $133.872 $3.316 $1.369 $27.712 $10.710 $0.265 $0.110 $15.792 $13.542 $70.428 $24.650 $59.320 0.885 $52.488 1
20 57 50 2 5 31 $86.70 $26.01 $3.50 $129.905 $3.218 $1.329 $26.890 $10.392 $0.257 $0.106 $15.324 $13.542 $67.940 $23.779 $57.702 0.879 $50.710 1
21 55 48 2 5 30 $86.70 $26.01 $3.50 $126.055 $3.123 $1.289 $26.093 $10.084 $0.250 $0.103 $14.870 $13.542 $65.525 $22.934 $56.133 0.873 $48.997 1
22 53 47 2 5 29 $86.70 $26.01 $3.50 $122.319 $3.030 $1.251 $25.320 $9.786 $0.242 $0.100 $14.429 $13.542 $63.182 $22.114 $54.610 0.867 $47.344 1
23 52 46 2 5 28 $86.70 $26.01 $3.50 $118.694 $2.940 $1.214 $24.570 $9.496 $0.235 $0.097 $14.001 $13.542 $60.908 $21.318 $53.132 0.861 $45.751 1
24 50 44 2 5 27 $86.70 $26.01 $3.50 $115.176 $2.853 $1.178 $23.842 $9.214 $0.228 $0.094 $13.586 $13.542 $58.701 $20.545 $51.698 0.855 $44.214 1
25 49 43 1 4 26 $86.70 $26.01 $3.50 $111.763 $2.769 $1.143 $23.135 $8.941 $0.221 $0.091 $13.184 $13.542 $56.560 $19.796 $50.306 0.849 $42.733 1
26 47 42 1 4 26 $86.70 $26.01 $3.50 $108.451 $2.687 $1.109 $22.449 $8.676 $0.215 $0.089 $12.793 $13.542 $54.483 $19.069 $48.955 0.844 $41.304 1
27 46 40 1 4 25 $86.70 $26.01 $3.50 $105.237 $2.607 $1.076 $21.784 $8.419 $0.209 $0.086 $12.414 $13.542 $52.467 $18.363 $47.645 0.838 $39.926 1
28 45 39 1 4 24 $86.70 $26.01 $3.50 $102.118 $2.530 $1.044 $21.138 $8.169 $0.202 $0.084 $12.046 $13.542 $50.511 $17.679 $46.373 0.832 $38.597 1
29 44 38 1 4 24 $86.70 $26.01 $3.50 $99.767 $2.471 $1.020 $20.652 $7.981 $0.198 $0.082 $11.769 $13.542 $49.036 $17.163 $45.415 0.827 $37.543 1
30 43 37 1 4 23 $86.70 $26.01 $3.50 $97.470 $2.415 $0.997 $20.176 $7.798 $0.193 $0.080 $11.498 $13.542 $47.595 $16.658 $44.478 0.821 $36.520 1
31 42 37 1 4 22 $86.70 $26.01 $3.50 $95.225 $2.359 $0.974 $19.712 $7.618 $0.189 $0.078 $11.233 $13.542 $46.187 $16.166 $43.563 0.816 $35.526 1
32 41 36 1 4 22 $86.70 $26.01 $3.50 $93.033 $2.305 $0.951 $19.258 $7.443 $0.184 $0.076 $10.974 $13.542 $44.812 $15.684 $42.670 0.810 $34.561 1
33 40 35 1 4 21 $86.70 $26.01 $3.50 $90.891 $2.252 $0.930 $18.814 $7.271 $0.180 $0.074 $10.722 $13.542 $43.469 $15.214 $41.796 0.804 $33.625 1
34 39 34 1 3 21 $86.70 $26.01 $3.50 $88.798 $2.200 $0.908 $18.381 $7.104 $0.176 $0.073 $10.475 $13.542 $42.156 $14.755 $40.943 0.799 $32.715 1
35 38 33 1 3 20 $86.70 $26.01 $3.50 $86.754 $2.149 $0.887 $17.958 $6.940 $0.172 $0.071 $10.234 $13.542 $40.873 $14.306 $40.109 0.794 $31.832 1
36 37 33 1 3 20 $86.70 $26.01 $3.50 $84.756 $2.100 $0.867 $17.545 $6.780 $0.168 $0.069 $9.998 $13.542 $39.621 $13.867 $39.295 0.788 $30.974 1
37 36 32 1 3 20 $86.70 $26.01 $3.50 $82.805 $2.051 $0.847 $17.141 $6.624 $0.164 $0.068 $9.768 $13.542 $38.397 $13.439 $38.499 0.783 $30.142 1
38 35 31 1 3 19 $86.70 $26.01 $3.50 $80.898 $2.004 $0.827 $16.746 $6.472 $0.160 $0.066 $9.543 $13.542 $37.201 $13.020 $37.722 0.778 $29.333 1
39 35 30 1 3 19 $86.70 $26.01 $3.50 $79.036 $1.958 $0.808 $16.360 $6.323 $0.157 $0.065 $9.323 $13.542 $36.032 $12.611 $36.963 0.772 $28.548 1
40 34 30 1 3 18 $86.70 $26.01 $3.50 $77.216 $1.913 $0.790 $15.984 $6.177 $0.153 $0.063 $9.108 $13.542 $34.891 $12.212 $36.221 0.767 $27.785 1
Bakken: Non Core My Assumptions:
Basin Characteristics Average Well Bakken: Non Core Bakken: Non Core
minimum (breakeven) EUR and IP (flow) for the given price: minimum (breakeven) EUR and IP (flow) for the given price:
Full Cycle DUC Full Cycle DUC
Baseline Results (2016 factor prices) Sensitivity Results (2014 factor prices, G2=133%)
Results
Capex ($1,000s) Production (boe/d) Prices Cash Flows ($1,000)
jsmith:
Constant exponential
decline begins at year 4
Page 63
Appendix A: Minimum EUR as function of price, 2014 and 2016 Cost scenarios.
A-12
Springer
100% oilfield service & supply factor price scalar
$9.00 cost/well ($mm) IP EUR 30 days/month
1,318 EUR/well (mboe) 720 904 -1.08% exponential decline rate after year 3 (monthly)
-47% 1st yr decline -5.1% 385 $20.00 oil price WTI ($/bbl)
-36% 2nd yr decline -3.6% 247 0% oil price appreciation (per month) Price EUR IP EUR IP Price EUR IP EUR IP
-26% 3rd yr decline -2.5% 212 $3.50 gas price Henry Hub ($/mcf) $20 2,655 2,115 1,318 1,050 $20 5,052 4,024 2508 1,998
1,050 IP rate (boe/d) 0% gas price appreciation $25 1,911 1,522 949 756 $25 3,246 2,585 1611 1,283
$6.00 opex-LOE ($/boe) 30% NGL price/oil price (fixed ratio) $30 1,493 1,189 742 591 $30 2,391 1,904 1187 945
68% % oil 0.68% discount rate (compound monthly) $35 1,225 976 609 485 $35 1,893 1,508 940 749
16% % gas 8.5% discount rate (annual) $40 1,039 828 517 412 $40 1,566 1,247 778 620
17% % NGL 80% intangible drilling cost / total capex $45 902 718 449 358 $45 1,336 1,064 663 528
20.0% royalty rate 0.796 IP/EUR ratio, (B8/B4 = fixed ratio) $50 797 635 396 315 $50 1,165 928 578 460
7.0% oil prod tax $60 646 515 322 256 $60 927 738 461 367
7.0% gas prod tax $70 544 433 271 216 $70 770 613 383 305
7.0% NGL prod tax -$3.773 = NPV/well ($ million) $80 469 374 234 186 $80 658 524 327 260
35.0% income tax rate 0 = EUR check (mboe) $90 413 329 206 164 $90 575 458 286 228
-6% oil differential -0.29% = ATIRR (monthly) $100 368 293 184 147 $100 510 406 254 202
-6% gas differential -3.40% = ATIRR (annual)
0 1 = DUC 1,318 = total production (mboe)
25% auxillary cost/well cost $2.440 = "tail end" NPV/well ($ million)
50% completion cost/well cost 100% = "tail end" recovery factor
$2,000 min opex ($/month) 0 = months of lost production
Per Well Net Cash Flow Analysis
mcf/d AT NPV Active
Month Well Cost Aux. Cost Total Oil NGL Gas Gas Prod Oil/bbl NGL/bbl Gas/mcf Oil Rev Gas Rev NGL Rev Royalty Oil Tax Gas Tax NGL Tax Opex Depeciation Tax. Inc. Income Tax NCF PV Factor -$3,773 1/0
1 $2,250 $563 $18.80 $5.64 $3.29 $2,250.000 -$2,250.00 -$787.500 -2,025 1.000 -$2,025.00
2 $2,250 $563 $18.80 $5.64 $3.29 $2,250.000 -$2,250.00 -$787.500 -2,025 0.993 -$2,011.28
3 $2,250 $563 $18.80 $5.64 $3.29 $2,250.000 -$2,250.00 -$787.500 -2,025 0.986 -$1,997.65
4 $2,250 $563 $18.80 $5.64 $3.29 $2,250.000 -$2,250.00 -$787.500 -2,025 0.980 -$1,984.12
5 1050 714 178 168 1,008 $18.80 $5.64 $3.29 $402.524 $99.447 $30.189 $106.43 $22.54 $5.57 $1.69 $188.919 $18.750 $188.258 $65.890 $141.118 0.973 $137.332 1
6 996 677 169 159 956 $18.80 $5.64 $3.29 $382.063 $94.392 $28.655 $101.022 $21.396 $5.286 $1.605 $179.316 $18.750 $177.736 $62.207 $134.278 0.967 $129.791 1
7 946 643 161 151 908 $18.80 $5.64 $3.29 $362.643 $89.594 $27.198 $95.887 $20.308 $5.017 $1.523 $170.202 $18.750 $167.748 $58.712 $127.786 0.960 $122.679 1
8 898 610 153 144 862 $18.80 $5.64 $3.29 $344.210 $85.040 $25.816 $91.013 $19.276 $4.762 $1.446 $161.550 $18.750 $158.269 $55.394 $121.625 0.954 $115.972 1
9 852 579 145 136 818 $18.80 $5.64 $3.29 $326.714 $80.718 $24.504 $86.387 $18.296 $4.520 $1.372 $153.339 $18.750 $149.271 $52.245 $115.776 0.947 $109.647 1
10 809 550 137 129 776 $18.80 $5.64 $3.29 $310.107 $76.615 $23.258 $81.996 $17.366 $4.290 $1.302 $145.545 $18.750 $140.730 $49.256 $110.225 0.941 $103.683 1
11 767 522 130 123 737 $18.80 $5.64 $3.29 $294.344 $72.720 $22.076 $77.828 $16.483 $4.072 $1.236 $138.147 $18.750 $132.624 $46.418 $104.956 0.934 $98.057 1
12 728 495 124 117 699 $18.80 $5.64 $3.29 $279.383 $69.024 $20.954 $73.872 $15.645 $3.865 $1.173 $131.125 $18.750 $124.930 $43.725 $99.954 0.928 $92.752 1
13 691 470 118 111 664 $18.80 $5.64 $3.29 $265.182 $65.515 $19.889 $70.117 $14.850 $3.669 $1.114 $124.459 $18.750 $117.626 $41.169 $95.207 0.922 $87.748 1
14 656 446 112 105 630 $18.80 $5.64 $3.29 $251.702 $62.185 $18.878 $66.553 $14.095 $3.482 $1.057 $118.133 $18.750 $110.694 $38.743 $90.701 0.915 $83.029 1
15 623 424 106 100 598 $18.80 $5.64 $3.29 $238.908 $59.024 $17.918 $63.170 $13.379 $3.305 $1.003 $112.128 $18.750 $104.115 $36.440 $86.425 0.909 $78.578 1
16 591 402 101 95 568 $18.80 $5.64 $3.29 $226.765 $56.024 $17.007 $59.959 $12.699 $3.137 $0.952 $106.429 $18.750 $97.869 $34.254 $82.365 0.903 $74.380 1
17 570 387 97 91 547 $18.80 $5.64 $3.29 $218.530 $53.990 $16.390 $57.782 $12.238 $3.023 $0.918 $102.564 $18.750 $93.635 $32.772 $79.613 0.897 $71.407 1
18 549 373 93 88 527 $18.80 $5.64 $3.29 $210.595 $52.029 $15.795 $55.684 $11.793 $2.914 $0.884 $98.840 $18.750 $89.554 $31.344 $76.960 0.891 $68.560 1
19 529 360 90 85 508 $18.80 $5.64 $3.29 $202.948 $50.140 $15.221 $53.662 $11.365 $2.808 $0.852 $95.251 $18.750 $85.621 $29.967 $74.404 0.885 $65.834 1
20 510 347 87 82 490 $18.80 $5.64 $3.29 $195.578 $48.319 $14.668 $51.713 $10.952 $2.706 $0.821 $91.792 $18.750 $81.831 $28.641 $71.940 0.879 $63.223 1
21 491 334 84 79 472 $18.80 $5.64 $3.29 $188.477 $46.565 $14.136 $49.835 $10.555 $2.608 $0.792 $88.459 $18.750 $78.179 $27.363 $69.566 0.873 $60.722 1
22 474 322 81 76 455 $18.80 $5.64 $3.29 $181.633 $44.874 $13.622 $48.026 $10.171 $2.513 $0.763 $85.247 $18.750 $74.659 $26.131 $67.278 0.867 $58.328 1
23 456 310 78 73 438 $18.80 $5.64 $3.29 $175.037 $43.244 $13.128 $46.282 $9.802 $2.422 $0.735 $82.151 $18.750 $71.267 $24.944 $65.074 0.861 $56.034 1
24 440 299 75 70 422 $18.80 $5.64 $3.29 $168.681 $41.674 $12.651 $44.601 $9.446 $2.334 $0.708 $79.168 $18.750 $67.998 $23.799 $62.949 0.855 $53.837 1
25 424 288 72 68 407 $18.80 $5.64 $3.29 $162.556 $40.161 $12.192 $42.982 $9.103 $2.249 $0.683 $76.293 $18.750 $64.848 $22.697 $60.901 0.849 $51.733 1
26 408 278 69 65 392 $18.80 $5.64 $3.29 $156.653 $38.703 $11.749 $41.421 $8.773 $2.167 $0.658 $73.523 $18.750 $61.813 $21.634 $58.928 0.844 $49.718 1
27 394 268 67 63 378 $18.80 $5.64 $3.29 $150.965 $37.297 $11.322 $39.917 $8.454 $2.089 $0.634 $70.853 $18.750 $58.887 $20.611 $57.027 0.838 $47.788 1
28 379 258 64 61 364 $18.80 $5.64 $3.29 $145.483 $35.943 $10.911 $38.467 $8.147 $2.013 $0.611 $68.280 $18.750 $56.068 $19.624 $55.194 0.832 $45.939 1
29 370 251 63 59 355 $18.80 $5.64 $3.29 $141.825 $35.039 $10.637 $37.500 $7.942 $1.962 $0.596 $66.563 $18.750 $54.187 $18.965 $53.971 0.827 $44.616 1
30 360 245 61 58 346 $18.80 $5.64 $3.29 $138.258 $34.158 $10.369 $36.557 $7.742 $1.913 $0.581 $64.890 $18.750 $52.353 $18.323 $52.779 0.821 $43.335 1
31 351 239 60 56 337 $18.80 $5.64 $3.29 $134.782 $33.299 $10.109 $35.638 $7.548 $1.865 $0.566 $63.258 $18.750 $50.565 $17.698 $51.617 0.816 $42.094 1
32 343 233 58 55 329 $18.80 $5.64 $3.29 $131.393 $32.462 $9.854 $34.742 $7.358 $1.818 $0.552 $61.667 $18.750 $48.822 $17.088 $50.484 0.810 $40.891 1
33 334 227 57 53 321 $18.80 $5.64 $3.29 $128.089 $31.645 $9.607 $33.868 $7.173 $1.772 $0.538 $60.117 $18.750 $47.123 $16.493 $49.380 0.804 $39.726 1
34 326 221 55 52 313 $18.80 $5.64 $3.29 $124.868 $30.850 $9.365 $33.017 $6.993 $1.728 $0.524 $58.605 $18.750 $45.466 $15.913 $48.303 0.799 $38.596 1
35 317 216 54 51 305 $18.80 $5.64 $3.29 $121.728 $30.074 $9.130 $32.186 $6.817 $1.684 $0.511 $57.131 $18.750 $43.852 $15.348 $47.254 0.794 $37.502 1
36 309 210 53 50 297 $18.80 $5.64 $3.29 $118.667 $29.318 $8.900 $31.377 $6.645 $1.642 $0.498 $55.695 $18.750 $42.278 $14.797 $46.230 0.788 $36.441 1
37 302 205 51 48 290 $18.80 $5.64 $3.29 $115.683 $28.581 $8.676 $30.588 $6.478 $1.601 $0.486 $54.294 $18.750 $40.743 $14.260 $45.233 0.783 $35.413 1
38 294 200 50 47 282 $18.80 $5.64 $3.29 $112.774 $27.862 $8.458 $29.819 $6.315 $1.560 $0.474 $52.929 $18.750 $39.247 $13.736 $44.261 0.778 $34.417 1
39 287 195 49 46 275 $18.80 $5.64 $3.29 $109.938 $27.161 $8.245 $29.069 $6.157 $1.521 $0.462 $51.598 $18.750 $37.789 $13.226 $43.313 0.772 $33.452 1
40 279 190 48 45 268 $18.80 $5.64 $3.29 $107.174 $26.478 $8.038 $28.338 $6.002 $1.483 $0.450 $50.301 $18.750 $36.367 $12.728 $42.389 0.767 $32.516 1
Springer My Assumptions:
Basin Characteristics Average Well Springer Springer
minimum (breakeven) EUR and IP (flow) for the given price: minimum (breakeven) EUR and IP (flow) for the given price:
Full Cycle DUC Full Cycle DUC
Baseline Results (2016 factor prices) Sensitivity Results (2014 factor prices, G2=133%)
Results
Capex ($1,000s) Production (boe/d) Prices Cash Flows ($1,000)
jsmith:
Constant exponential
decline begins at year 4
Page 64
Appendix A: Minimum EUR as function of price, 2014 and 2016 Cost scenarios.
A-13
STACK
100% oilfield service & supply factor price scalar
$8.50 cost/well ($mm) IP EUR 30 days/month
100 EUR/well (mboe) 826 940 -0.91% exponential decline rate after year 3 (monthly)
-56% 1st yr decline -6.6% 363 $20.00 oil price WTI ($/bbl)
-33% 2nd yr decline -3.3% 244 0% oil price appreciation (per month) Price EUR IP EUR IP Price EUR IP EUR IP
-33% 3rd yr decline -3.3% 200 $3.50 gas price Henry Hub ($/mcf) $20 1,927 1,693 958 842 $20 2,829 2,486 1404 1,234
88 IP rate (boe/d) 0% gas price appreciation $25 1,612 1,417 802 705 $25 2,326 2,044 1155 1,015
$2.50 opex-LOE ($/boe) 30% NGL price/oil price (fixed ratio) $30 1,385 1,217 690 606 $30 1,976 1,736 981 862
40% % oil 0.68% discount rate (compound monthly) $35 1,215 1,068 605 532 $35 1,717 1,509 853 750
30% % gas 8.5% discount rate (annual) $40 1,082 951 539 474 $40 1,518 1,334 754 663
30% % NGL 80% intangible drilling cost / total capex $45 975 857 486 427 $45 1,360 1,195 676 594
20.0% royalty rate 0.879 IP/EUR ratio, (B8/B4 = fixed ratio) $50 887 779 443 389 $50 1,232 1,083 613 539
7.0% oil prod tax $60 752 661 376 330 $60 1,037 911 516 453
7.0% gas prod tax $70 653 574 326 286 $70 896 787 446 392
7.0% NGL prod tax -$6.777 = NPV/well ($ million) $80 577 507 288 253 $80 788 692 392 344
35.0% income tax rate 0 = EUR check (mboe) $90 517 454 259 228 $90 704 619 350 308
-6% oil differential -2.64% = ATIRR (monthly) $100 468 411 234 206 $100 636 559 317 279
-6% gas differential -27.47% = ATIRR (annual)
0 1 = DUC 100 = total production (mboe)
25% auxillary cost/well cost $0.510 = "tail end" NPV/well ($ million)
50% completion cost/well cost 72% = "tail end" recovery factor
$2,000 min opex ($/month) 195 = months of lost production
Per Well Net Cash Flow Analysis
mcf/d AT NPV Active
Month Well Cost Aux. Cost Total Oil NGL Gas Gas Prod Oil/bbl NGL/bbl Gas/mcf Oil Rev Gas Rev NGL Rev Royalty Oil Tax Gas Tax NGL Tax Opex Depeciation Tax. Inc. Income Tax NCF PV Factor -$6,777 1/0
1 $2,125 $531 $18.80 $5.64 $3.29 $2,125.000 -$2,125.00 -$743.750 -1,913 1.000 -$1,912.50
2 $2,125 $531 $18.80 $5.64 $3.29 $2,125.000 -$2,125.00 -$743.750 -1,913 0.993 -$1,899.54
3 $2,125 $531 $18.80 $5.64 $3.29 $2,125.000 -$2,125.00 -$743.750 -1,913 0.986 -$1,886.67
4 $2,125 $531 $18.80 $5.64 $3.29 $2,125.000 -$2,125.00 -$743.750 -1,913 0.980 -$1,873.89
5 88 35 26 26 158 $18.80 $5.64 $3.29 $19.824 $15.611 $4.460 $7.98 $1.11 $0.87 $0.25 $6.590 $17.708 $5.384 $1.884 $21.208 0.973 $20.639 1
6 82 33 25 25 148 $18.80 $5.64 $3.29 $18.511 $14.578 $4.165 $7.451 $1.037 $0.816 $0.233 $6.154 $17.708 $3.855 $1.349 $20.214 0.967 $19.538 1
7 77 31 23 23 138 $18.80 $5.64 $3.29 $17.285 $13.612 $3.889 $6.957 $0.968 $0.762 $0.218 $5.746 $17.708 $2.427 $0.849 $19.286 0.960 $18.515 1
8 72 29 21 21 129 $18.80 $5.64 $3.29 $16.141 $12.711 $3.632 $6.497 $0.904 $0.712 $0.203 $5.366 $17.708 $1.093 $0.383 $18.419 0.954 $17.563 1
9 67 27 20 20 120 $18.80 $5.64 $3.29 $15.072 $11.869 $3.391 $6.066 $0.844 $0.665 $0.190 $5.011 $17.708 -$0.152 -$0.053 $17.610 0.947 $16.677 1
10 62 25 19 19 112 $18.80 $5.64 $3.29 $14.074 $11.083 $3.167 $5.665 $0.788 $0.621 $0.177 $4.679 $17.708 -$1.314 -$0.460 $16.854 0.941 $15.854 1
11 58 23 17 17 105 $18.80 $5.64 $3.29 $13.142 $10.349 $2.957 $5.290 $0.736 $0.580 $0.166 $4.369 $17.708 -$2.400 -$0.840 $16.148 0.934 $15.087 1
12 54 22 16 16 98 $18.80 $5.64 $3.29 $12.272 $9.664 $2.761 $4.939 $0.687 $0.541 $0.155 $4.080 $17.708 -$3.414 -$1.195 $15.489 0.928 $14.373 1
13 51 20 15 15 91 $18.80 $5.64 $3.29 $11.459 $9.024 $2.578 $4.612 $0.642 $0.505 $0.144 $3.809 $17.708 -$4.360 -$1.526 $14.874 0.922 $13.709 1
14 47 19 14 14 85 $18.80 $5.64 $3.29 $10.700 $8.426 $2.408 $4.307 $0.599 $0.472 $0.135 $3.557 $17.708 -$5.244 -$1.836 $14.300 0.915 $13.090 1
15 44 18 13 13 80 $18.80 $5.64 $3.29 $9.991 $7.868 $2.248 $4.022 $0.560 $0.441 $0.126 $3.322 $17.708 -$6.070 -$2.124 $13.763 0.909 $12.514 1
16 41 17 12 12 74 $18.80 $5.64 $3.29 $9.330 $7.347 $2.099 $3.755 $0.522 $0.411 $0.118 $3.102 $17.708 -$6.840 -$2.394 $13.262 0.903 $11.976 1
17 40 16 12 12 72 $18.80 $5.64 $3.29 $9.026 $7.108 $2.031 $3.633 $0.505 $0.398 $0.114 $3.001 $17.708 -$7.194 -$2.518 $13.032 0.897 $11.689 1
18 39 15 12 12 70 $18.80 $5.64 $3.29 $8.732 $6.877 $1.965 $3.515 $0.489 $0.385 $0.110 $2.903 $17.708 -$7.537 -$2.638 $12.810 0.891 $11.411 1
19 37 15 11 11 67 $18.80 $5.64 $3.29 $8.448 $6.653 $1.901 $3.400 $0.473 $0.373 $0.106 $2.808 $17.708 -$7.868 -$2.754 $12.594 0.885 $11.144 1
20 36 14 11 11 65 $18.80 $5.64 $3.29 $8.173 $6.436 $1.839 $3.290 $0.458 $0.360 $0.103 $2.717 $17.708 -$8.188 -$2.866 $12.386 0.879 $10.885 1
21 35 14 11 11 63 $18.80 $5.64 $3.29 $7.907 $6.226 $1.779 $3.182 $0.443 $0.349 $0.100 $2.629 $17.708 -$8.498 -$2.974 $12.184 0.873 $10.635 1
22 34 14 10 10 61 $18.80 $5.64 $3.29 $7.649 $6.024 $1.721 $3.079 $0.428 $0.337 $0.096 $2.543 $17.708 -$8.798 -$3.079 $11.990 0.867 $10.394 1
23 33 13 10 10 59 $18.80 $5.64 $3.29 $7.400 $5.828 $1.665 $2.979 $0.414 $0.326 $0.093 $2.460 $17.708 -$9.088 -$3.181 $11.801 0.861 $10.162 1
24 32 13 10 10 57 $18.80 $5.64 $3.29 $7.159 $5.638 $1.611 $2.882 $0.401 $0.316 $0.090 $2.380 $17.708 -$9.369 -$3.279 $11.619 0.855 $9.937 1
25 31 12 9 9 55 $18.80 $5.64 $3.29 $6.926 $5.454 $1.558 $2.788 $0.388 $0.305 $0.087 $2.303 $17.708 -$9.640 -$3.374 $11.442 0.849 $9.719 1
26 30 12 9 9 53 $18.80 $5.64 $3.29 $6.701 $5.277 $1.508 $2.697 $0.375 $0.295 $0.084 $2.228 $17.708 -$9.903 -$3.466 $11.271 0.844 $9.510 1
27 29 11 9 9 52 $18.80 $5.64 $3.29 $6.482 $5.105 $1.459 $2.609 $0.363 $0.286 $0.082 $2.155 $17.708 -$10.157 -$3.555 $11.106 0.838 $9.307 1
28 28 11 8 8 50 $18.80 $5.64 $3.29 $6.271 $4.939 $1.411 $2.524 $0.351 $0.277 $0.079 $2.085 $17.708 -$10.403 -$3.641 $10.946 0.832 $9.111 1
29 27 11 8 8 48 $18.80 $5.64 $3.29 $6.067 $4.778 $1.365 $2.442 $0.340 $0.268 $0.076 $2.017 $17.708 -$10.641 -$3.724 $10.791 0.827 $8.921 1
30 26 10 8 8 47 $18.80 $5.64 $3.29 $5.869 $4.622 $1.321 $2.362 $0.329 $0.259 $0.074 $2.000 $17.708 -$10.921 -$3.822 $10.610 0.821 $8.711 1
31 25 10 8 8 45 $18.80 $5.64 $3.29 $5.678 $4.471 $1.277 $2.285 $0.318 $0.250 $0.072 $2.000 $17.708 -$11.207 -$3.922 $10.424 0.816 $8.501 1
32 24 10 7 7 44 $18.80 $5.64 $3.29 $5.493 $4.325 $1.236 $2.211 $0.308 $0.242 $0.069 $2.000 $17.708 -$11.484 -$4.019 $10.244 0.810 $8.297 1
33 24 9 7 7 42 $18.80 $5.64 $3.29 $5.314 $4.184 $1.196 $2.139 $0.298 $0.234 $0.067 $2.000 $17.708 -$11.752 -$4.113 $10.069 0.804 $8.101 1
34 23 9 7 7 41 $18.80 $5.64 $3.29 $5.140 $4.048 $1.157 $2.069 $0.288 $0.227 $0.065 $2.000 $17.708 -$12.012 -$4.204 $9.901 0.799 $7.911 1
35 22 9 7 7 40 $18.80 $5.64 $3.29 $4.973 $3.916 $1.119 $2.002 $0.278 $0.219 $0.063 $2.000 $17.708 -$12.263 -$4.292 $9.738 0.794 $7.728 1
36 21 9 6 6 38 $18.80 $5.64 $3.29 $4.811 $3.788 $1.082 $1.936 $0.269 $0.212 $0.061 $2.000 $17.708 -$12.505 -$4.377 $9.580 0.788 $7.551 1
37 21 8 6 6 37 $18.80 $5.64 $3.29 $4.654 $3.665 $1.047 $1.873 $0.261 $0.205 $0.059 $2.000 $17.708 -$12.740 -$4.459 $9.427 0.783 $7.381 1
38 20 8 6 6 36 $18.80 $5.64 $3.29 $4.502 $3.545 $1.013 $1.812 $0.252 $0.199 $0.057 $2.000 $17.708 -$12.967 -$4.539 $9.280 0.778 $7.216 1
39 19 8 6 6 35 $18.80 $5.64 $3.29 $4.355 $3.430 $0.980 $1.753 $0.244 $0.192 $0.055 $2.000 $17.708 -$13.187 -$4.615 $9.137 0.772 $7.057 1
40 19 7 6 6 34 $18.80 $5.64 $3.29 $4.213 $3.318 $0.948 $1.696 $0.236 $0.186 $0.053 $2.000 $17.708 -$13.400 -$4.690 $8.999 0.767 $6.903 1
Capex ($1,000s) Production (boe/d) Prices Cash Flows ($1,000)
Results
minimum (breakeven) EUR and IP (flow) for the given price: minimum (breakeven) EUR and IP (flow) for the given price:
Full Cycle DUC Full Cycle DUC
Baseline Results (2016 factor prices) Sensitivity Results (2014 factor prices, G2=133%)
STACK My Assumptions:
Basin Characteristics Average Well STACK STACK
jsmith:
Constant exponential
decline begins at year 4
Page 65
Appendix A: Minimum EUR as function of price, 2014 and 2016 Cost scenarios.
A-14
SCOOP Condensate
100% oilfield service & supply factor price scalar
$9.60 cost/well ($mm) IP EUR 30 days/month
704 EUR/well (mboe) 1,400 1,952 -0.82% exponential decline rate after year 3 (monthly)
-50% 1st yr decline -5.7% 694 $100.00 oil price WTI ($/bbl)
-32% 2nd yr decline -3.2% 471 0% oil price appreciation (per month) Price EUR IP EUR IP Price EUR IP EUR IP
-28% 3rd yr decline -2.7% 400 $3.50 gas price Henry Hub ($/mcf) $20 2,692 1,931 1,336 958 $20 4,131 2,963 2050 1,470
505 IP rate (boe/d) 0% gas price appreciation $25 2,439 1,749 1,211 869 $25 3,689 2,646 1831 1,313
$3.00 opex-LOE ($/boe) 30% NGL price/oil price (fixed ratio) $30 2,229 1,599 1,107 794 $30 3,333 2,390 1655 1,187
10% % oil 0.68% discount rate (compound monthly) $35 2,053 1,472 1,019 731 $35 3,040 2,180 1509 1,082
50% % gas 8.5% discount rate (annual) $40 1,903 1,365 945 678 $40 2,794 2,004 1387 995
40% % NGL 80% intangible drilling cost / total capex $45 1,773 1,272 881 632 $45 2,585 1,854 1283 920
20.0% royalty rate 0.717 IP/EUR ratio, (B8/B4 = fixed ratio) $50 1,659 1,190 824 591 $50 2,405 1,725 1194 856
7.0% oil prod tax $60 1,471 1,055 731 524 $60 2,111 1,514 1048 752
7.0% gas prod tax $70 1,322 948 657 471 $70 1,881 1,349 934 670
7.0% NGL prod tax -$2.440 = NPV/well ($ million) $80 1,200 861 596 427 $80 1,696 1,216 842 604
35.0% income tax rate 0 = EUR check (mboe) $90 1,098 788 546 392 $90 1,544 1,107 767 550
-6% oil differential 0.16% = ATIRR (monthly) $100 1,013 727 504 361 $100 1,418 1,017 704 505
-6% gas differential 1.91% = ATIRR (annual)
0 1 = DUC 704 = total production (mboe)
25% auxillary cost/well cost $3.735 = "tail end" NPV/well ($ million)
50% completion cost/well cost 100% = "tail end" recovery factor
$2,000 min opex ($/month) 0 = months of lost production
Per Well Net Cash Flow Analysis
mcf/d AT NPV Active
Month Well Cost Aux. Cost Total Oil NGL Gas Gas Prod Oil/bbl NGL/bbl Gas/mcf Oil Rev Gas Rev NGL Rev Royalty Oil Tax Gas Tax NGL Tax Opex Depeciation Tax. Inc. Income Tax NCF PV Factor -$2,440 1/0
1 $2,400 $600 $94.00 $28.20 $3.29 $2,400.000 -$2,400.00 -$840.000 -2,160 1.000 -$2,160.00
2 $2,400 $600 $94.00 $28.20 $3.29 $2,400.000 -$2,400.00 -$840.000 -2,160 0.993 -$2,145.37
3 $2,400 $600 $94.00 $28.20 $3.29 $2,400.000 -$2,400.00 -$840.000 -2,160 0.986 -$2,130.83
4 $2,400 $600 $94.00 $28.20 $3.29 $2,400.000 -$2,400.00 -$840.000 -2,160 0.980 -$2,116.39
5 505 50 202 252 1,515 $94.00 $28.20 $3.29 $142.369 $149.487 $170.843 $92.54 $7.97 $8.37 $9.57 $45.437 $20.000 $278.811 $97.584 $201.227 0.973 $195.829 1
6 476 48 190 238 1,429 $94.00 $28.20 $3.29 $134.282 $140.996 $161.138 $87.283 $7.520 $7.896 $9.024 $42.856 $20.000 $261.838 $91.643 $190.194 0.967 $183.838 1
7 449 45 180 225 1,347 $94.00 $28.20 $3.29 $126.654 $132.987 $151.985 $82.325 $7.093 $7.447 $8.511 $40.422 $20.000 $245.829 $86.040 $179.789 0.960 $172.603 1
8 424 42 169 212 1,271 $94.00 $28.20 $3.29 $119.460 $125.433 $143.352 $77.649 $6.690 $7.024 $8.028 $38.126 $20.000 $230.729 $80.755 $169.974 0.954 $162.074 1
9 400 40 160 200 1,199 $94.00 $28.20 $3.29 $112.674 $118.308 $135.209 $73.238 $6.310 $6.625 $7.572 $35.960 $20.000 $216.487 $75.770 $160.716 0.947 $152.209 1
10 377 38 151 188 1,131 $94.00 $28.20 $3.29 $106.274 $111.588 $127.529 $69.078 $5.951 $6.249 $7.142 $33.917 $20.000 $203.054 $71.069 $151.985 0.941 $142.965 1
11 355 36 142 178 1,066 $94.00 $28.20 $3.29 $100.238 $105.249 $120.285 $65.154 $5.613 $5.894 $6.736 $31.991 $20.000 $190.384 $66.634 $143.749 0.934 $134.302 1
12 335 34 134 168 1,006 $94.00 $28.20 $3.29 $94.544 $99.271 $113.453 $61.453 $5.294 $5.559 $6.353 $30.174 $20.000 $178.433 $62.452 $135.982 0.928 $126.184 1
13 316 32 126 158 949 $94.00 $28.20 $3.29 $89.173 $93.632 $107.008 $57.963 $4.994 $5.243 $5.992 $28.460 $20.000 $167.162 $58.507 $128.655 0.922 $118.576 1
14 298 30 119 149 895 $94.00 $28.20 $3.29 $84.108 $88.314 $100.930 $54.670 $4.710 $4.946 $5.652 $26.843 $20.000 $156.531 $54.786 $121.745 0.915 $111.447 1
15 281 28 113 141 844 $94.00 $28.20 $3.29 $79.331 $83.297 $95.197 $51.565 $4.443 $4.665 $5.331 $25.318 $20.000 $146.503 $51.276 $115.227 0.909 $104.766 1
16 265 27 106 133 796 $94.00 $28.20 $3.29 $74.824 $78.566 $89.789 $48.636 $4.190 $4.400 $5.028 $23.880 $20.000 $137.045 $47.966 $109.080 0.903 $98.504 1
17 257 26 103 128 771 $94.00 $28.20 $3.29 $72.446 $76.068 $86.935 $47.090 $4.057 $4.260 $4.868 $23.121 $20.000 $132.054 $46.219 $105.835 0.897 $94.927 1
18 249 25 99 124 746 $94.00 $28.20 $3.29 $70.143 $73.651 $84.172 $45.593 $3.928 $4.124 $4.714 $22.386 $20.000 $127.221 $44.527 $102.693 0.891 $91.485 1
19 241 24 96 120 722 $94.00 $28.20 $3.29 $67.914 $71.310 $81.497 $44.144 $3.803 $3.993 $4.564 $21.675 $20.000 $122.541 $42.889 $99.652 0.885 $88.174 1
20 233 23 93 117 700 $94.00 $28.20 $3.29 $65.755 $69.043 $78.906 $42.741 $3.682 $3.866 $4.419 $20.986 $20.000 $118.011 $41.304 $96.707 0.879 $84.989 1
21 226 23 90 113 677 $94.00 $28.20 $3.29 $63.665 $66.849 $76.398 $41.382 $3.565 $3.744 $4.278 $20.319 $20.000 $113.624 $39.768 $93.856 0.873 $81.924 1
22 219 22 87 109 656 $94.00 $28.20 $3.29 $61.642 $64.724 $73.970 $40.067 $3.452 $3.625 $4.142 $19.673 $20.000 $109.377 $38.282 $91.095 0.867 $78.975 1
23 212 21 85 106 635 $94.00 $28.20 $3.29 $59.682 $62.667 $71.619 $38.794 $3.342 $3.509 $4.011 $19.048 $20.000 $105.264 $36.843 $88.422 0.861 $76.139 1
24 205 20 82 102 615 $94.00 $28.20 $3.29 $57.785 $60.675 $69.342 $37.560 $3.236 $3.398 $3.883 $18.442 $20.000 $101.283 $35.449 $85.834 0.855 $73.409 1
25 198 20 79 99 595 $94.00 $28.20 $3.29 $55.949 $58.746 $67.138 $36.367 $3.133 $3.290 $3.760 $17.856 $20.000 $97.428 $34.100 $83.328 0.849 $70.784 1
26 192 19 77 96 576 $94.00 $28.20 $3.29 $54.170 $56.879 $65.004 $35.211 $3.034 $3.185 $3.640 $17.288 $20.000 $93.695 $32.793 $80.902 0.844 $68.257 1
27 186 19 74 93 558 $94.00 $28.20 $3.29 $52.449 $55.071 $62.938 $34.092 $2.937 $3.084 $3.525 $16.739 $20.000 $90.082 $31.529 $78.553 0.838 $65.826 1
28 180 18 72 90 540 $94.00 $28.20 $3.29 $50.781 $53.321 $60.938 $33.008 $2.844 $2.986 $3.413 $16.207 $20.000 $86.583 $30.304 $76.279 0.832 $63.487 1
29 175 18 70 88 526 $94.00 $28.20 $3.29 $49.417 $51.888 $59.301 $32.121 $2.767 $2.906 $3.321 $15.771 $20.000 $83.719 $29.302 $74.418 0.827 $61.519 1
30 171 17 68 85 512 $94.00 $28.20 $3.29 $48.090 $50.494 $57.708 $31.258 $2.693 $2.828 $3.232 $15.348 $20.000 $80.933 $28.327 $72.606 0.821 $59.615 1
31 166 17 66 83 498 $94.00 $28.20 $3.29 $46.798 $49.138 $56.157 $30.419 $2.621 $2.752 $3.145 $14.935 $20.000 $78.221 $27.377 $70.844 0.816 $57.773 1
32 161 16 65 81 484 $94.00 $28.20 $3.29 $45.541 $47.818 $54.649 $29.601 $2.550 $2.678 $3.060 $14.534 $20.000 $75.583 $26.454 $69.129 0.810 $55.993 1
33 157 16 63 79 471 $94.00 $28.20 $3.29 $44.317 $46.533 $53.180 $28.806 $2.482 $2.606 $2.978 $14.144 $20.000 $73.015 $25.555 $67.460 0.804 $54.271 1
34 153 15 61 76 459 $94.00 $28.20 $3.29 $43.126 $45.283 $51.752 $28.032 $2.415 $2.536 $2.898 $13.764 $20.000 $70.516 $24.681 $65.835 0.799 $52.605 1
35 149 15 60 74 446 $94.00 $28.20 $3.29 $41.968 $44.066 $50.361 $27.279 $2.350 $2.468 $2.820 $13.394 $20.000 $68.084 $23.830 $64.255 0.794 $50.994 1
36 145 14 58 72 434 $94.00 $28.20 $3.29 $40.840 $42.882 $49.009 $26.546 $2.287 $2.401 $2.744 $13.034 $20.000 $65.718 $23.001 $62.717 0.788 $49.436 1
37 141 14 56 70 423 $94.00 $28.20 $3.29 $39.743 $41.730 $47.692 $25.833 $2.226 $2.337 $2.671 $12.684 $20.000 $63.415 $22.195 $61.220 0.783 $47.930 1
38 137 14 55 69 411 $94.00 $28.20 $3.29 $38.676 $40.609 $46.411 $25.139 $2.166 $2.274 $2.599 $12.343 $20.000 $61.174 $21.411 $59.763 0.778 $46.472 1
39 133 13 53 67 400 $94.00 $28.20 $3.29 $37.637 $39.518 $45.164 $24.464 $2.108 $2.213 $2.529 $12.012 $20.000 $58.994 $20.648 $58.346 0.772 $45.063 1
40 130 13 52 65 390 $94.00 $28.20 $3.29 $36.625 $38.457 $43.951 $23.807 $2.051 $2.154 $2.461 $11.689 $20.000 $56.871 $19.905 $56.966 0.767 $43.699 1
Capex ($1,000s) Production (boe/d) Prices Cash Flows ($1,000)
Results
minimum (breakeven) EUR and IP (flow) for the given price: minimum (breakeven) EUR and IP (flow) for the given price:
Full Cycle DUC Full Cycle DUC
Baseline Results (2016 factor prices) Sensitivity Results (2014 factor prices, G2=133%)
SCOOP Condensate My Assumptions:
Basin Characteristics Average Well SCOOP Condensate SCOOP Condensate
jsmith:
Constant exponential
decline begins at year 4
Page 66
Appendix A: Minimum EUR as function of price, 2014 and 2016 Cost scenarios.
A-15
Meramec
100% oilfield service & supply factor price scalar
$7.60 cost/well ($mm) IP EUR 30 days/month
459 EUR/well (mboe) 1,425 1,338 -0.80% exponential decline rate after year 3 (monthly)
-69% 1st yr decline -9.3% 444 $100.00 oil price WTI ($/bbl)
-35% 2nd yr decline -3.5% 289 0% oil price appreciation (per month) Price EUR IP EUR IP Price EUR IP EUR IP
-29% 3rd yr decline -2.8% 244 $3.50 gas price Henry Hub ($/mcf) $20 2,450 2,609 1,216 1,295 $20 4,419 4,706 2193 2,336
489 IP rate (boe/d) 0% gas price appreciation $25 2,086 2,222 1,035 1,102 $25 3,574 3,806 1774 1,889
$5.00 opex-LOE ($/boe) 30% NGL price/oil price (fixed ratio) $30 1,816 1,934 902 961 $30 3,000 3,195 1489 1,586
22% % oil 0.68% discount rate (compound monthly) $35 1,609 1,714 799 851 $35 2,585 2,753 1283 1,366
47% % gas 8.5% discount rate (annual) $40 1,443 1,537 717 764 $40 2,271 2,419 1127 1,200
31% % NGL 80% intangible drilling cost / total capex $45 1,309 1,394 650 692 $45 2,025 2,157 1005 1,070
20.0% royalty rate 1.065 IP/EUR ratio, (B8/B4 = fixed ratio) $50 1,197 1,275 595 634 $50 1,827 1,946 907 966
7.0% oil prod tax $60 1,023 1,090 508 541 $60 1,529 1,628 759 808
7.0% gas prod tax $70 893 951 444 473 $70 1,314 1,399 652 694
7.0% NGL prod tax -$1.842 = NPV/well ($ million) $80 792 843 394 420 $80 1,152 1,227 572 609
35.0% income tax rate 0 = EUR check (mboe) $90 712 758 354 377 $90 1,025 1,092 509 542
-6% oil differential 0.16% = ATIRR (monthly) $100 647 689 322 343 $100 924 984 459 489
-6% gas differential 1.89% = ATIRR (annual)
0 1 DUC 459 = total production (mboe)
25% auxillary cost/well cost $2.771 = "tail end" NPV/well ($ million)
50% completion cost/well cost 100% = "tail end" recovery factor
$2,000 min opex ($/month) 0 = months of lost production
Per Well Net Cash Flow Analysis
mcf/d AT NPV Active
Month Well Cost Aux. Cost Total Oil NGL Gas Gas Prod Oil/bbl NGL/bbl Gas/mcf Oil Rev Gas Rev NGL Rev Royalty Oil Tax Gas Tax NGL Tax Opex Depeciation Tax. Inc. Income Tax NCF PV Factor -$1,842 1/0
1 $1,900 $475 $94.00 $28.20 $3.29 $1,900.000 -$1,900.00 -$665.000 -1,710 1.000 -$1,710.00
2 $1,900 $475 $94.00 $28.20 $3.29 $1,900.000 -$1,900.00 -$665.000 -1,710 0.993 -$1,698.41
3 $1,900 $475 $94.00 $28.20 $3.29 $1,900.000 -$1,900.00 -$665.000 -1,710 0.986 -$1,686.91
4 $1,900 $475 $94.00 $28.20 $3.29 $1,900.000 -$1,900.00 -$665.000 -1,710 0.980 -$1,675.48
5 489 108 151 230 1,378 $94.00 $28.20 $3.29 $303.194 $136.024 $128.168 $113.48 $16.98 $7.62 $7.18 $73.306 $15.833 $332.996 $116.549 $232.281 0.973 $226.049 1
6 443 98 137 208 1,251 $94.00 $28.20 $3.29 $275.117 $123.428 $116.300 $102.969 $15.407 $6.912 $6.513 $66.518 $15.833 $300.693 $105.243 $211.284 0.967 $204.223 1
7 402 89 125 189 1,135 $94.00 $28.20 $3.29 $249.641 $111.998 $105.530 $93.434 $13.980 $6.272 $5.910 $60.358 $15.833 $271.382 $94.984 $192.232 0.960 $184.548 1
8 365 80 113 172 1,030 $94.00 $28.20 $3.29 $226.523 $101.626 $95.757 $84.781 $12.685 $5.691 $5.362 $54.769 $15.833 $244.785 $85.675 $174.943 0.954 $166.813 1
9 331 73 103 156 934 $94.00 $28.20 $3.29 $205.546 $92.216 $86.890 $76.930 $11.511 $5.164 $4.866 $49.697 $15.833 $220.651 $77.228 $159.256 0.947 $150.826 1
10 301 66 93 141 848 $94.00 $28.20 $3.29 $186.512 $83.676 $78.844 $69.806 $10.445 $4.686 $4.415 $45.095 $15.833 $198.752 $69.563 $145.022 0.941 $136.415 1
11 273 60 85 128 769 $94.00 $28.20 $3.29 $169.241 $75.927 $71.543 $63.342 $9.477 $4.252 $4.006 $40.919 $15.833 $178.880 $62.608 $132.106 0.934 $123.423 1
12 248 54 77 116 698 $94.00 $28.20 $3.29 $153.568 $68.896 $64.918 $57.476 $8.600 $3.858 $3.635 $37.130 $15.833 $160.849 $56.297 $120.385 0.928 $111.711 1
13 225 49 70 106 633 $94.00 $28.20 $3.29 $139.347 $62.516 $58.906 $52.154 $7.803 $3.501 $3.299 $33.691 $15.833 $144.488 $50.571 $109.751 0.922 $101.153 1
14 204 45 63 96 575 $94.00 $28.20 $3.29 $126.443 $56.727 $53.451 $47.324 $7.081 $3.177 $2.993 $30.571 $15.833 $129.642 $45.375 $100.101 0.915 $91.633 1
15 185 41 57 87 522 $94.00 $28.20 $3.29 $114.734 $51.474 $48.501 $42.942 $6.425 $2.883 $2.716 $27.740 $15.833 $116.170 $40.660 $91.344 0.909 $83.051 1
16 168 37 52 79 473 $94.00 $28.20 $3.29 $104.110 $46.707 $44.010 $38.965 $5.830 $2.616 $2.465 $25.172 $15.833 $103.946 $36.381 $83.399 0.903 $75.313 1
17 162 36 50 76 457 $94.00 $28.20 $3.29 $100.450 $45.066 $42.463 $37.596 $5.625 $2.524 $2.378 $24.287 $15.833 $99.736 $34.908 $80.662 0.897 $72.348 1
18 156 34 48 73 441 $94.00 $28.20 $3.29 $96.919 $43.482 $40.970 $36.274 $5.427 $2.435 $2.294 $23.433 $15.833 $95.674 $33.486 $78.021 0.891 $69.506 1
19 151 33 47 71 425 $94.00 $28.20 $3.29 $93.513 $41.953 $39.530 $34.999 $5.237 $2.349 $2.214 $22.609 $15.833 $91.754 $32.114 $75.474 0.885 $66.781 1
20 145 32 45 68 410 $94.00 $28.20 $3.29 $90.226 $40.478 $38.141 $33.769 $5.053 $2.267 $2.136 $21.815 $15.833 $87.973 $30.790 $73.015 0.879 $64.168 1
21 140 31 43 66 396 $94.00 $28.20 $3.29 $87.054 $39.056 $36.800 $32.582 $4.875 $2.187 $2.061 $21.048 $15.833 $84.324 $29.513 $70.644 0.873 $61.663 1
22 135 30 42 64 382 $94.00 $28.20 $3.29 $83.994 $37.683 $35.507 $31.437 $4.704 $2.110 $1.988 $20.308 $15.833 $80.803 $28.281 $68.355 0.867 $59.261 1
23 131 29 40 61 368 $94.00 $28.20 $3.29 $81.042 $36.358 $34.259 $30.332 $4.538 $2.036 $1.918 $19.594 $15.833 $77.406 $27.092 $66.147 0.861 $56.958 1
24 126 28 39 59 355 $94.00 $28.20 $3.29 $78.193 $35.080 $33.054 $29.265 $4.379 $1.964 $1.851 $18.905 $15.833 $74.129 $25.945 $64.017 0.855 $54.751 1
25 122 27 38 57 343 $94.00 $28.20 $3.29 $75.444 $33.847 $31.892 $28.237 $4.225 $1.895 $1.786 $18.241 $15.833 $70.967 $24.838 $61.962 0.849 $52.634 1
26 117 26 36 55 331 $94.00 $28.20 $3.29 $72.793 $32.657 $30.771 $27.244 $4.076 $1.829 $1.723 $17.600 $15.833 $67.916 $23.770 $59.978 0.844 $50.604 1
27 113 25 35 53 319 $94.00 $28.20 $3.29 $70.234 $31.509 $29.690 $26.287 $3.933 $1.765 $1.663 $16.981 $15.833 $64.972 $22.740 $58.065 0.838 $48.658 1
28 109 24 34 51 308 $94.00 $28.20 $3.29 $67.765 $30.402 $28.646 $25.363 $3.795 $1.703 $1.604 $16.384 $15.833 $62.131 $21.746 $56.219 0.832 $46.791 1
29 106 23 33 50 299 $94.00 $28.20 $3.29 $65.880 $29.556 $27.849 $24.657 $3.689 $1.655 $1.560 $15.928 $15.833 $59.963 $20.987 $54.809 0.827 $45.309 1
30 103 23 32 49 291 $94.00 $28.20 $3.29 $64.048 $28.734 $27.075 $23.971 $3.587 $1.609 $1.516 $15.485 $15.833 $57.854 $20.249 $53.439 0.821 $43.877 1
31 100 22 31 47 283 $94.00 $28.20 $3.29 $62.266 $27.935 $26.322 $23.305 $3.487 $1.564 $1.474 $15.055 $15.833 $55.805 $19.532 $52.106 0.816 $42.493 1
32 98 21 30 46 275 $94.00 $28.20 $3.29 $60.534 $27.158 $25.589 $22.656 $3.390 $1.521 $1.433 $14.636 $15.833 $53.812 $18.834 $50.811 0.810 $41.156 1
33 95 21 29 45 268 $94.00 $28.20 $3.29 $58.850 $26.402 $24.878 $22.026 $3.296 $1.479 $1.393 $14.229 $15.833 $51.875 $18.156 $49.552 0.804 $39.864 1
34 92 20 29 43 260 $94.00 $28.20 $3.29 $57.213 $25.668 $24.186 $21.413 $3.204 $1.437 $1.354 $13.833 $15.833 $49.992 $17.497 $48.328 0.799 $38.616 1
35 90 20 28 42 253 $94.00 $28.20 $3.29 $55.622 $24.954 $23.513 $20.818 $3.115 $1.397 $1.317 $13.448 $15.833 $48.161 $16.856 $47.138 0.794 $37.410 1
36 87 19 27 41 246 $94.00 $28.20 $3.29 $54.075 $24.260 $22.859 $20.239 $3.028 $1.359 $1.280 $13.074 $15.833 $46.381 $16.233 $45.981 0.788 $36.244 1
37 85 19 26 40 239 $94.00 $28.20 $3.29 $52.571 $23.585 $22.223 $19.676 $2.944 $1.321 $1.244 $12.711 $15.833 $44.650 $15.628 $44.856 0.783 $35.118 1
38 82 18 26 39 232 $94.00 $28.20 $3.29 $51.108 $22.929 $21.605 $19.128 $2.862 $1.284 $1.210 $12.357 $15.833 $42.968 $15.039 $43.762 0.778 $34.030 1
39 80 18 25 38 226 $94.00 $28.20 $3.29 $49.687 $22.291 $21.004 $18.596 $2.782 $1.248 $1.176 $12.013 $15.833 $41.332 $14.466 $42.699 0.772 $32.978 1
40 78 17 24 37 220 $94.00 $28.20 $3.29 $48.305 $21.671 $20.420 $18.079 $2.705 $1.214 $1.144 $11.679 $15.833 $39.742 $13.910 $41.666 0.767 $31.962 1
minimum (breakeven) EUR and IP (flow) for the given price: minimum (breakeven) EUR and IP (flow) for the given price:
Full Cycle DUC Full Cycle DUC
Meramec My Assumptions:
Basin Characteristics Average Well Meramec Meramec
Baseline Results (2016 factor prices) Sensitivity Results (2014 factor prices, G2=133%)
Results
Capex ($1,000s) Production (boe/d) Prices Cash Flows ($1,000)
jsmith:
Constant exponential
decline begins at year 4
Page 67
Appendix A: Minimum EUR as function of price, 2014 and 2016 Cost scenarios.
A-16
SCOOP Oil
100% oilfield service & supply factor price scalar
$9.35 cost/well ($mm) IP EUR 30 days/month
337 EUR/well (mboe) 762 979 -0.83% exponential decline rate after year 3 (monthly)
-54% 1st yr decline -6.2% 353 $100.00 oil price WTI ($/bbl)
-33% 2nd yr decline -3.2% 238 0% oil price appreciation (per month) Price EUR IP EUR IP Price EUR IP EUR IP
-29% 3rd yr decline -2.9% 200 $3.50 gas price Henry Hub ($/mcf) $20 2,630 2,047 1,305 1,016 $20 4,269 3,323 2119 1,649
262 IP rate (boe/d) 0% gas price appreciation $25 2,069 1,610 1,027 799 $25 3,207 2,496 1592 1,239
$4.00 opex-LOE ($/boe) 30% NGL price/oil price (fixed ratio) $30 1,705 1,327 846 658 $30 2,568 1,999 1275 992
48% % oil 0.68% discount rate (compound monthly) $35 1,450 1,129 720 560 $35 2,142 1,667 1063 827
23% % gas 8.5% discount rate (annual) $40 1,261 981 627 488 $40 1,837 1,430 912 710
29% % NGL 80% intangible drilling cost / total capex $45 1,116 869 555 432 $45 1,608 1,252 798 621
20.0% royalty rate 0.778 IP/EUR ratio, (B8/B4 = fixed ratio) $50 1,001 779 498 388 $50 1,429 1,112 710 553
7.0% oil prod tax $60 830 646 413 321 $60 1,170 911 581 452
7.0% gas prod tax $70 709 552 353 275 $70 990 771 492 383
7.0% NGL prod tax -$2.470 = NPV/well ($ million) $80 618 481 308 240 $80 858 668 426 332
35.0% income tax rate 0 = EUR check (mboe) $90 548 427 273 212 $90 758 590 376 293
-6% oil differential 0.12% = ATIRR (monthly) $100 493 384 246 191 $100 678 528 337 262
-6% gas differential 1.47% = ATIRR (annual)
0 1 = DUC 337 = total production (mboe)
25% auxillary cost/well cost $3.487 = "tail end" NPV/well ($ million)
50% completion cost/well cost 100% = "tail end" recovery factor
$2,000 min opex ($/month) 0 = months of lost production
Per Well Net Cash Flow Analysis
mcf/d AT NPV Active
Month Well Cost Aux. Cost Total Oil NGL Gas Gas Prod Oil/bbl NGL/bbl Gas/mcf Oil Rev Gas Rev NGL Rev Royalty Oil Tax Gas Tax NGL Tax Opex Depeciation Tax. Inc. Income Tax NCF PV Factor -$2,470 1/0
1 $2,338 $584 $94.00 $28.20 $3.29 $2,337.500 -$2,337.50 -$818.125 -2,104 1.000 -$2,103.75
2 $2,338 $584 $94.00 $28.20 $3.29 $2,337.500 -$2,337.50 -$818.125 -2,104 0.993 -$2,089.50
3 $2,338 $584 $94.00 $28.20 $3.29 $2,337.500 -$2,337.50 -$818.125 -2,104 0.986 -$2,075.34
4 $2,338 $584 $94.00 $28.20 $3.29 $2,337.500 -$2,337.50 -$818.125 -2,104 0.980 -$2,061.28
5 262 126 76 60 362 $94.00 $28.20 $3.29 $355.034 $35.725 $64.350 $91.02 $19.88 $2.00 $3.60 $31.475 $19.479 $287.647 $100.676 $206.450 0.973 $200.911 1
6 246 118 71 57 339 $94.00 $28.20 $3.29 $332.982 $33.506 $60.353 $85.368 $18.647 $1.876 $3.380 $29.520 $19.479 $268.571 $94.000 $194.051 0.967 $187.565 1
7 231 111 67 53 318 $94.00 $28.20 $3.29 $312.301 $31.425 $56.604 $80.066 $17.489 $1.760 $3.170 $27.686 $19.479 $250.680 $87.738 $182.421 0.960 $175.130 1
8 216 104 63 50 299 $94.00 $28.20 $3.29 $292.903 $29.473 $53.089 $75.093 $16.403 $1.651 $2.973 $25.967 $19.479 $233.901 $81.865 $171.515 0.954 $163.544 1
9 203 97 59 47 280 $94.00 $28.20 $3.29 $274.711 $27.643 $49.791 $70.429 $15.384 $1.548 $2.788 $24.354 $19.479 $218.163 $76.357 $161.285 0.947 $152.748 1
10 190 91 55 44 263 $94.00 $28.20 $3.29 $257.649 $25.926 $46.699 $66.055 $14.428 $1.452 $2.615 $22.841 $19.479 $203.403 $71.191 $151.691 0.941 $142.688 1
11 179 86 52 41 246 $94.00 $28.20 $3.29 $241.646 $24.316 $43.798 $61.952 $13.532 $1.362 $2.453 $21.423 $19.479 $189.560 $66.346 $142.693 0.934 $133.315 1
12 167 80 49 39 231 $94.00 $28.20 $3.29 $226.637 $22.805 $41.078 $58.104 $12.692 $1.277 $2.300 $20.092 $19.479 $176.576 $61.802 $134.254 0.928 $124.580 1
13 157 75 46 36 217 $94.00 $28.20 $3.29 $212.561 $21.389 $38.527 $54.495 $11.903 $1.198 $2.157 $18.844 $19.479 $164.399 $57.540 $126.339 0.922 $116.441 1
14 147 71 43 34 203 $94.00 $28.20 $3.29 $199.358 $20.060 $36.134 $51.110 $11.164 $1.123 $2.023 $17.674 $19.479 $152.978 $53.542 $118.915 0.915 $108.857 1
15 138 66 40 32 191 $94.00 $28.20 $3.29 $186.976 $18.814 $33.889 $47.936 $10.471 $1.054 $1.898 $16.576 $19.479 $142.267 $49.793 $111.953 0.909 $101.789 1
16 130 62 38 30 179 $94.00 $28.20 $3.29 $175.363 $17.646 $31.785 $44.959 $9.820 $0.988 $1.780 $15.546 $19.479 $132.221 $46.277 $105.423 0.903 $95.202 1
17 125 60 36 29 173 $94.00 $28.20 $3.29 $169.696 $17.076 $30.757 $43.506 $9.503 $0.956 $1.722 $15.044 $19.479 $127.318 $44.561 $102.236 0.897 $91.699 1
18 121 58 35 28 167 $94.00 $28.20 $3.29 $164.212 $16.524 $29.763 $42.100 $9.196 $0.925 $1.667 $14.558 $19.479 $122.574 $42.901 $99.153 0.891 $88.331 1
19 117 56 34 27 162 $94.00 $28.20 $3.29 $158.905 $15.990 $28.802 $40.739 $8.899 $0.895 $1.613 $14.087 $19.479 $117.984 $41.294 $96.169 0.885 $85.092 1
20 114 55 33 26 157 $94.00 $28.20 $3.29 $153.770 $15.473 $27.871 $39.423 $8.611 $0.866 $1.561 $13.632 $19.479 $113.542 $39.740 $93.281 0.879 $81.978 1
21 110 53 32 25 152 $94.00 $28.20 $3.29 $148.801 $14.973 $26.970 $38.149 $8.333 $0.838 $1.510 $13.192 $19.479 $109.243 $38.235 $90.487 0.873 $78.984 1
22 106 51 31 24 147 $94.00 $28.20 $3.29 $143.992 $14.489 $26.099 $36.916 $8.064 $0.811 $1.462 $12.765 $19.479 $105.083 $36.779 $87.783 0.867 $76.104 1
23 103 49 30 24 142 $94.00 $28.20 $3.29 $139.339 $14.021 $25.255 $35.723 $7.803 $0.785 $1.414 $12.353 $19.479 $101.058 $35.370 $85.167 0.861 $73.336 1
24 100 48 29 23 137 $94.00 $28.20 $3.29 $134.836 $13.568 $24.439 $34.569 $7.551 $0.760 $1.369 $11.954 $19.479 $97.162 $34.007 $82.635 0.855 $70.673 1
25 96 46 28 22 133 $94.00 $28.20 $3.29 $130.479 $13.129 $23.649 $33.451 $7.307 $0.735 $1.324 $11.567 $19.479 $93.393 $32.688 $80.185 0.849 $68.113 1
26 93 45 27 21 129 $94.00 $28.20 $3.29 $126.262 $12.705 $22.885 $32.370 $7.071 $0.711 $1.282 $11.193 $19.479 $89.745 $31.411 $77.814 0.844 $65.651 1
27 90 43 26 21 125 $94.00 $28.20 $3.29 $122.182 $12.295 $22.145 $31.324 $6.842 $0.688 $1.240 $10.832 $19.479 $86.216 $30.175 $75.519 0.838 $63.284 1
28 87 42 25 20 121 $94.00 $28.20 $3.29 $118.233 $11.897 $21.430 $30.312 $6.621 $0.666 $1.200 $10.482 $19.479 $82.800 $28.980 $73.299 0.832 $61.007 1
29 85 41 25 20 117 $94.00 $28.20 $3.29 $114.855 $11.557 $20.817 $29.446 $6.432 $0.647 $1.166 $10.182 $19.479 $79.877 $27.957 $71.399 0.827 $59.024 1
30 82 40 24 19 114 $94.00 $28.20 $3.29 $111.573 $11.227 $20.223 $28.604 $6.248 $0.629 $1.132 $9.891 $19.479 $77.038 $26.963 $69.554 0.821 $57.108 1
31 80 38 23 18 110 $94.00 $28.20 $3.29 $108.384 $10.906 $19.645 $27.787 $6.070 $0.611 $1.100 $9.609 $19.479 $74.280 $25.998 $67.761 0.816 $55.259 1
32 78 37 23 18 107 $94.00 $28.20 $3.29 $105.287 $10.595 $19.083 $26.993 $5.896 $0.593 $1.069 $9.334 $19.479 $71.601 $25.060 $66.020 0.810 $53.474 1
33 76 36 22 17 104 $94.00 $28.20 $3.29 $102.278 $10.292 $18.538 $26.222 $5.728 $0.576 $1.038 $9.067 $19.479 $68.998 $24.149 $64.328 0.804 $51.751 1
34 73 35 21 17 101 $94.00 $28.20 $3.29 $99.356 $9.998 $18.008 $25.472 $5.564 $0.560 $1.008 $8.808 $19.479 $66.470 $23.264 $62.684 0.799 $50.087 1
35 71 34 21 16 98 $94.00 $28.20 $3.29 $96.517 $9.712 $17.494 $24.744 $5.405 $0.544 $0.980 $8.556 $19.479 $64.014 $22.405 $61.088 0.794 $48.481 1
36 69 33 20 16 96 $94.00 $28.20 $3.29 $93.758 $9.434 $16.994 $24.037 $5.250 $0.528 $0.952 $8.312 $19.479 $61.628 $21.570 $59.537 0.788 $46.930 1
37 67 32 20 15 93 $94.00 $28.20 $3.29 $91.079 $9.165 $16.508 $23.350 $5.100 $0.513 $0.924 $8.074 $19.479 $59.310 $20.759 $58.031 0.783 $45.433 1
38 65 31 19 15 90 $94.00 $28.20 $3.29 $88.477 $8.903 $16.036 $22.683 $4.955 $0.499 $0.898 $7.844 $19.479 $57.059 $19.971 $56.567 0.778 $43.987 1
39 63 30 18 15 88 $94.00 $28.20 $3.29 $85.948 $8.649 $15.578 $22.035 $4.813 $0.484 $0.872 $7.620 $19.479 $54.871 $19.205 $55.146 0.772 $42.591 1
40 62 30 18 14 85 $94.00 $28.20 $3.29 $83.492 $8.401 $15.133 $21.405 $4.676 $0.470 $0.847 $7.402 $19.479 $52.747 $18.461 $53.765 0.767 $41.243 1
minimum (breakeven) EUR and IP (flow) for the given price: minimum (breakeven) EUR and IP (flow) for the given price:
Full Cycle DUC Full Cycle DUC
SCOOP Oil My Assumptions:
Basin Characteristics Average Well SCOOP Oil SCOOP Oil
Baseline Results (2016 factor prices) Sensitivity Results (2014 factor prices, G2=133%)
Results
Capex ($1,000s) Production (boe/d) Prices Cash Flows ($1,000)
jsmith:
Constant exponential
decline begins at year 4
Page 68
Appendix A: Minimum EUR as function of price, 2014 and 2016 Cost scenarios.
A-17
Cana Woodford
100% oilfield service & supply factor price scalar
$7.00 cost/well ($mm) IP EUR 30 days/month
738 EUR/well (mboe) 1,606 1,826 -0.91% exponential decline rate after year 3 (monthly)
-65% 1st yr decline -8.4% 560 $100.00 oil price WTI ($/bbl)
-31% 2nd yr decline -3.0% 387 0% oil price appreciation (per month) Price EUR IP EUR IP Price EUR IP EUR IP
-13% 3rd yr decline -1.2% 360 $3.50 gas price Henry Hub ($/mcf) $20 2,277 2,003 1,130 994 $20 4,104 3,610 2037 1,792
649 IP rate (boe/d) 0% gas price appreciation $25 2,106 1,852 1,045 919 $25 3,697 3,252 1835 1,614
$5.00 opex-LOE ($/boe) 30% NGL price/oil price (fixed ratio) $30 1,959 1,723 972 855 $30 3,364 2,959 1670 1,469
5% % oil 0.68% discount rate (compound monthly) $35 1,831 1,610 909 799 $35 3,086 2,714 1532 1,347
63% % gas 8.5% discount rate (annual) $40 1,719 1,512 853 750 $40 2,850 2,507 1415 1,245
32% % NGL 80% intangible drilling cost / total capex $45 1,620 1,425 804 707 $45 2,648 2,329 1314 1,156
20.0% royalty rate 0.880 IP/EUR ratio, (B8/B4 = fixed ratio) $50 1,531 1,347 761 669 $50 2,473 2,175 1227 1,079
7.0% oil prod tax $60 1,381 1,215 686 603 $60 2,183 1,920 1084 953
7.0% gas prod tax $70 1,257 1,106 625 550 $70 1,955 1,719 970 853
7.0% NGL prod tax -$1.486 = NPV/well ($ million) $80 1,154 1,015 573 504 $80 1,770 1,557 878 772
35.0% income tax rate 0 = EUR check (mboe) $90 1,066 938 530 466 $90 1,616 1,421 802 705
-6% oil differential 0.23% = ATIRR (monthly) $100 991 872 493 434 $100 1,487 1,308 738 649
-6% gas differential 2.85% = ATIRR (annual)
0 1 = DUC 738 = total production (mboe)
25% auxillary cost/well cost $2.923 = "tail end" NPV/well ($ million)
50% completion cost/well cost 100% = "tail end" recovery factor
$2,000 min opex ($/month) 0 = months of lost production
Per Well Net Cash Flow Analysis
mcf/d AT NPV Active
Month Well Cost Aux. Cost Total Oil NGL Gas Gas Prod Oil/bbl NGL/bbl Gas/mcf Oil Rev Gas Rev NGL Rev Royalty Oil Tax Gas Tax NGL Tax Opex Depeciation Tax. Inc. Income Tax NCF PV Factor -$1,486 1/0
1 $1,750 $438 $94.00 $28.20 $3.29 $1,750.000 -$1,750.00 -$612.500 -1,575 1.000 -$1,575.00
2 $1,750 $438 $94.00 $28.20 $3.29 $1,750.000 -$1,750.00 -$612.500 -1,575 0.993 -$1,564.33
3 $1,750 $438 $94.00 $28.20 $3.29 $1,750.000 -$1,750.00 -$612.500 -1,575 0.986 -$1,553.73
4 $1,750 $438 $94.00 $28.20 $3.29 $1,750.000 -$1,750.00 -$612.500 -1,575 0.980 -$1,543.20
5 649 32 208 409 2,455 $94.00 $28.20 $3.29 $91.570 $242.294 $175.814 $101.94 $5.13 $13.57 $9.85 $97.415 $14.583 $267.203 $93.521 $188.265 0.973 $183.215 1
6 595 30 190 375 2,249 $94.00 $28.20 $3.29 $83.873 $221.929 $161.037 $93.368 $4.697 $12.428 $9.018 $89.227 $14.583 $243.518 $85.231 $172.870 0.967 $167.092 1
7 545 27 174 343 2,060 $94.00 $28.20 $3.29 $76.823 $203.275 $147.501 $85.520 $4.302 $11.383 $8.260 $81.727 $14.583 $221.824 $77.638 $158.769 0.960 $152.423 1
8 499 25 160 314 1,886 $94.00 $28.20 $3.29 $70.366 $186.189 $135.103 $78.332 $3.941 $10.427 $7.566 $74.858 $14.583 $201.953 $70.683 $145.853 0.954 $139.074 1
9 457 23 146 288 1,728 $94.00 $28.20 $3.29 $64.452 $170.539 $123.747 $71.748 $3.609 $9.550 $6.930 $68.566 $14.583 $183.752 $64.313 $134.022 0.947 $126.928 1
10 419 21 134 264 1,583 $94.00 $28.20 $3.29 $59.034 $156.205 $113.346 $65.717 $3.306 $8.747 $6.347 $62.802 $14.583 $167.081 $58.478 $123.186 0.941 $115.875 1
11 383 19 123 242 1,450 $94.00 $28.20 $3.29 $54.072 $143.075 $103.819 $60.193 $3.028 $8.012 $5.814 $57.524 $14.583 $151.812 $53.134 $113.261 0.934 $105.817 1
12 351 18 112 221 1,328 $94.00 $28.20 $3.29 $49.527 $131.049 $95.092 $55.134 $2.774 $7.339 $5.325 $52.689 $14.583 $137.826 $48.239 $104.170 0.928 $96.664 1
13 322 16 103 203 1,216 $94.00 $28.20 $3.29 $45.364 $120.034 $87.100 $50.500 $2.540 $6.722 $4.878 $48.260 $14.583 $125.015 $43.755 $95.843 0.922 $88.335 1
14 295 15 94 186 1,114 $94.00 $28.20 $3.29 $41.551 $109.945 $79.779 $46.255 $2.327 $6.157 $4.468 $44.204 $14.583 $113.282 $39.649 $88.216 0.915 $80.755 1
15 270 13 86 170 1,020 $94.00 $28.20 $3.29 $38.059 $100.704 $73.073 $42.367 $2.131 $5.639 $4.092 $40.488 $14.583 $102.534 $35.887 $81.231 0.909 $73.856 1
16 247 12 79 156 935 $94.00 $28.20 $3.29 $34.860 $92.239 $66.931 $38.806 $1.952 $5.165 $3.748 $37.085 $14.583 $92.690 $32.442 $74.832 0.903 $67.577 1
17 240 12 77 151 906 $94.00 $28.20 $3.29 $33.803 $89.442 $64.901 $37.629 $1.893 $5.009 $3.634 $35.960 $14.583 $89.437 $31.303 $72.717 0.897 $65.223 1
18 232 12 74 146 879 $94.00 $28.20 $3.29 $32.778 $86.730 $62.933 $36.488 $1.836 $4.857 $3.524 $34.870 $14.583 $86.283 $30.199 $70.667 0.891 $62.954 1
19 225 11 72 142 852 $94.00 $28.20 $3.29 $31.784 $84.100 $61.025 $35.382 $1.780 $4.710 $3.417 $33.813 $14.583 $83.224 $29.128 $68.679 0.885 $60.769 1
20 219 11 70 138 826 $94.00 $28.20 $3.29 $30.820 $81.550 $59.174 $34.309 $1.726 $4.567 $3.314 $32.787 $14.583 $80.258 $28.090 $66.751 0.879 $58.663 1
21 212 11 68 134 801 $94.00 $28.20 $3.29 $29.885 $79.077 $57.380 $33.269 $1.674 $4.428 $3.213 $31.793 $14.583 $77.382 $27.084 $64.882 0.873 $56.634 1
22 206 10 66 129 777 $94.00 $28.20 $3.29 $28.979 $76.679 $55.640 $32.260 $1.623 $4.294 $3.116 $30.829 $14.583 $74.594 $26.108 $63.069 0.867 $54.678 1
23 199 10 64 126 753 $94.00 $28.20 $3.29 $28.101 $74.354 $53.953 $31.281 $1.574 $4.164 $3.021 $29.894 $14.583 $71.890 $25.161 $61.312 0.861 $52.794 1
24 193 10 62 122 730 $94.00 $28.20 $3.29 $27.248 $72.099 $52.317 $30.333 $1.526 $4.038 $2.930 $28.988 $14.583 $69.267 $24.244 $59.607 0.855 $50.979 1
25 187 9 60 118 708 $94.00 $28.20 $3.29 $26.422 $69.913 $50.730 $29.413 $1.480 $3.915 $2.841 $28.109 $14.583 $66.725 $23.354 $57.954 0.849 $49.230 1
26 182 9 58 114 687 $94.00 $28.20 $3.29 $25.621 $67.793 $49.192 $28.521 $1.435 $3.796 $2.755 $27.256 $14.583 $64.259 $22.491 $56.352 0.844 $47.544 1
27 176 9 56 111 666 $94.00 $28.20 $3.29 $24.844 $65.737 $47.701 $27.656 $1.391 $3.681 $2.671 $26.430 $14.583 $61.869 $21.654 $54.798 0.838 $45.920 1
28 171 9 55 108 646 $94.00 $28.20 $3.29 $24.091 $63.744 $46.254 $26.818 $1.349 $3.570 $2.590 $25.628 $14.583 $59.550 $20.843 $53.291 0.832 $44.354 1
29 169 8 54 106 638 $94.00 $28.20 $3.29 $23.802 $62.980 $45.700 $26.496 $1.333 $3.527 $2.559 $25.321 $14.583 $58.662 $20.532 $52.714 0.827 $43.577 1
30 167 8 53 105 630 $94.00 $28.20 $3.29 $23.517 $62.226 $45.152 $26.179 $1.317 $3.485 $2.529 $25.018 $14.583 $57.784 $20.225 $52.143 0.821 $42.813 1
31 165 8 53 104 623 $94.00 $28.20 $3.29 $23.235 $61.480 $44.611 $25.865 $1.301 $3.443 $2.498 $24.718 $14.583 $56.917 $19.921 $51.580 0.816 $42.063 1
32 163 8 52 103 615 $94.00 $28.20 $3.29 $22.957 $60.743 $44.077 $25.555 $1.286 $3.402 $2.468 $24.422 $14.583 $56.061 $19.621 $51.023 0.810 $41.327 1
33 161 8 51 101 608 $94.00 $28.20 $3.29 $22.682 $60.016 $43.549 $25.249 $1.270 $3.361 $2.439 $24.129 $14.583 $55.214 $19.325 $50.473 0.804 $40.605 1
34 159 8 51 100 601 $94.00 $28.20 $3.29 $22.410 $59.297 $43.027 $24.947 $1.255 $3.321 $2.410 $23.840 $14.583 $54.378 $19.032 $49.929 0.799 $39.895 1
35 157 8 50 99 594 $94.00 $28.20 $3.29 $22.141 $58.586 $42.512 $24.648 $1.240 $3.281 $2.381 $23.555 $14.583 $53.552 $18.743 $49.392 0.794 $39.199 1
36 155 8 50 98 586 $94.00 $28.20 $3.29 $21.876 $57.884 $42.002 $24.353 $1.225 $3.242 $2.352 $23.272 $14.583 $52.736 $18.457 $48.861 0.788 $38.515 1
37 153 8 49 97 579 $94.00 $28.20 $3.29 $21.614 $57.191 $41.499 $24.061 $1.210 $3.203 $2.324 $22.994 $14.583 $51.929 $18.175 $48.337 0.783 $37.844 1
38 151 8 48 95 572 $94.00 $28.20 $3.29 $21.355 $56.506 $41.002 $23.772 $1.196 $3.164 $2.296 $22.718 $14.583 $51.132 $17.896 $47.819 0.778 $37.184 1
39 150 7 48 94 566 $94.00 $28.20 $3.29 $21.099 $55.829 $40.511 $23.488 $1.182 $3.126 $2.269 $22.446 $14.583 $50.345 $17.621 $47.307 0.772 $36.537 1
40 148 7 47 93 559 $94.00 $28.20 $3.29 $20.846 $55.160 $40.025 $23.206 $1.167 $3.089 $2.241 $22.177 $14.583 $49.567 $17.348 $46.802 0.767 $35.902 1
minimum (breakeven) EUR and IP (flow) for the given price: minimum (breakeven) EUR and IP (flow) for the given price:
Full Cycle DUC Full Cycle DUC
Cana Woodford My Assumptions:
Basin Characteristics Average Well Cana Woodford Cana Woodford
Baseline Results (2016 factor prices) Sensitivity Results (2014 factor prices, G2=133%)
Results
Capex ($1,000s) Production (boe/d) Prices Cash Flows ($1,000)
jsmith:
Constant exponential
decline begins at year 4
Page 69
Appendix A: Minimum EUR as function of price, 2014 and 2016 Cost scenarios.
A-18
Mississippian
100% oilfield service & supply factor price scalar
$2.80 cost/well ($mm) IP EUR 30 days/month
147 EUR/well (mboe) 409 410 -0.68% exponential decline rate after year 3 (monthly)
-71% 1st yr decline -9.7% 120 $100.00 oil price WTI ($/bbl)
-31% 2nd yr decline -3.0% 83 0% oil price appreciation (per month) Price EUR IP EUR IP Price EUR IP EUR IP
-29% 3rd yr decline -2.8% 70 $3.50 gas price Henry Hub ($/mcf) $20 931 929 462 461 $20 1,799 1,795 893 891
147 IP rate (boe/d) 0% gas price appreciation $25 763 761 379 378 $25 1,363 1,360 676 674
$6.00 opex-LOE ($/boe) 30% NGL price/oil price (fixed ratio) $30 646 644 322 321 $30 1,097 1,094 544 543
34% % oil 0.68% discount rate (compound monthly) $35 560 559 279 278 $35 918 916 455 454
46% % gas 8.5% discount rate (annual) $40 495 494 247 246 $40 789 787 392 391
20% % NGL 80% intangible drilling cost / total capex $45 443 442 222 221 $45 692 690 344 343
20.0% royalty rate 0.998 IP/EUR ratio, (B8/B4 = fixed ratio) $50 401 400 201 201 $50 616 614 306 305
7.0% oil prod tax $60 337 336 169 169 $60 505 504 251 250
7.0% gas prod tax $70 291 290 147 147 $70 428 427 213 212
7.0% NGL prod tax -$0.686 = NPV/well ($ million) $80 256 255 130 130 $80 372 371 185 185
35.0% income tax rate 0 = EUR check (mboe) $90 229 228 116 116 $90 328 327 164 164
-6% oil differential 0.16% = ATIRR (monthly) $100 207 206 105 105 $100 294 293 147 147
-6% gas differential 1.96% = ATIRR (annual)
0 1 = DUC 147 = total production (mboe)
25% auxillary cost/well cost $1.055 = "tail end" NPV/well ($ million)
50% completion cost/well cost 100% = "tail end" recovery factor
$2,000 min opex ($/month) 0 = months of lost production
Per Well Net Cash Flow Analysis
mcf/d AT NPV Active
Month Well Cost Aux. Cost Total Oil NGL Gas Gas Prod Oil/bbl NGL/bbl Gas/mcf Oil Rev Gas Rev NGL Rev Royalty Oil Tax Gas Tax NGL Tax Opex Depeciation Tax. Inc. Income Tax NCF PV Factor -$686 1/0
1 $700 $175 $94.00 $28.20 $3.29 $700.000 -$700.00 -$245.000 -630 1.000 -$630.00
2 $700 $175 $94.00 $28.20 $3.29 $700.000 -$700.00 -$245.000 -630 0.993 -$625.73
3 $700 $175 $94.00 $28.20 $3.29 $700.000 -$700.00 -$245.000 -630 0.986 -$621.49
4 $700 $175 $94.00 $28.20 $3.29 $700.000 -$700.00 -$245.000 -630 0.980 -$617.28
5 147 50 29 67 405 $94.00 $28.20 $3.29 $140.617 $39.952 $24.815 $41.08 $7.87 $2.24 $1.39 $26.399 $5.833 $120.573 $42.201 $84.206 0.973 $81.947 1
6 132 45 26 61 365 $94.00 $28.20 $3.29 $126.958 $36.071 $22.404 $37.087 $7.110 $2.020 $1.255 $23.834 $5.833 $108.294 $37.903 $76.225 0.967 $73.677 1
7 120 41 24 55 330 $94.00 $28.20 $3.29 $114.625 $32.567 $20.228 $33.484 $6.419 $1.824 $1.133 $21.519 $5.833 $97.208 $34.023 $69.019 0.960 $66.260 1
8 108 37 22 50 298 $94.00 $28.20 $3.29 $103.491 $29.404 $18.263 $30.232 $5.795 $1.647 $1.023 $19.429 $5.833 $87.199 $30.520 $62.513 0.954 $59.608 1
9 97 33 19 45 269 $94.00 $28.20 $3.29 $93.438 $26.547 $16.489 $27.295 $5.233 $1.487 $0.923 $17.542 $5.833 $78.162 $27.357 $56.639 0.947 $53.641 1
10 88 30 18 40 243 $94.00 $28.20 $3.29 $84.362 $23.969 $14.887 $24.644 $4.724 $1.342 $0.834 $15.838 $5.833 $70.003 $24.501 $51.335 0.941 $48.288 1
11 79 27 16 37 219 $94.00 $28.20 $3.29 $76.167 $21.640 $13.441 $22.250 $4.265 $1.212 $0.753 $14.299 $5.833 $62.636 $21.923 $46.547 0.934 $43.488 1
12 72 24 14 33 198 $94.00 $28.20 $3.29 $68.768 $19.538 $12.136 $20.088 $3.851 $1.094 $0.680 $12.910 $5.833 $55.985 $19.595 $42.224 0.928 $39.181 1
13 65 22 13 30 179 $94.00 $28.20 $3.29 $62.088 $17.640 $10.957 $18.137 $3.477 $0.988 $0.614 $11.656 $5.833 $49.980 $17.493 $38.321 0.922 $35.319 1
14 58 20 12 27 161 $94.00 $28.20 $3.29 $56.057 $15.927 $9.892 $16.375 $3.139 $0.892 $0.554 $10.524 $5.833 $44.559 $15.596 $34.797 0.915 $31.853 1
15 53 18 11 24 146 $94.00 $28.20 $3.29 $50.612 $14.380 $8.932 $14.785 $2.834 $0.805 $0.500 $9.502 $5.833 $39.664 $13.882 $31.615 0.909 $28.745 1
16 48 16 10 22 132 $94.00 $28.20 $3.29 $45.696 $12.983 $8.064 $13.348 $2.559 $0.727 $0.452 $8.579 $5.833 $35.244 $12.336 $28.742 0.903 $25.956 1
17 46 16 9 21 128 $94.00 $28.20 $3.29 $44.313 $12.590 $7.820 $12.945 $2.482 $0.705 $0.438 $8.319 $5.833 $34.002 $11.901 $27.934 0.897 $25.055 1
18 45 15 9 21 124 $94.00 $28.20 $3.29 $42.972 $12.209 $7.583 $12.553 $2.406 $0.684 $0.425 $8.067 $5.833 $32.796 $11.479 $27.151 0.891 $24.188 1
19 43 15 9 20 120 $94.00 $28.20 $3.29 $41.672 $11.840 $7.354 $12.173 $2.334 $0.663 $0.412 $7.823 $5.833 $31.628 $11.070 $26.391 0.885 $23.352 1
20 42 14 8 19 116 $94.00 $28.20 $3.29 $40.412 $11.482 $7.131 $11.805 $2.263 $0.643 $0.399 $7.587 $5.833 $30.494 $10.673 $25.655 0.879 $22.546 1
21 41 14 8 19 113 $94.00 $28.20 $3.29 $39.189 $11.134 $6.916 $11.448 $2.195 $0.624 $0.387 $7.357 $5.833 $29.395 $10.288 $24.940 0.873 $21.770 1
22 40 13 8 18 109 $94.00 $28.20 $3.29 $38.003 $10.797 $6.706 $11.101 $2.128 $0.605 $0.376 $7.135 $5.833 $28.330 $9.915 $24.248 0.867 $21.022 1
23 38 13 8 18 106 $94.00 $28.20 $3.29 $36.854 $10.471 $6.504 $10.766 $2.064 $0.586 $0.364 $6.919 $5.833 $27.296 $9.554 $23.576 0.861 $20.301 1
24 37 13 7 17 103 $94.00 $28.20 $3.29 $35.739 $10.154 $6.307 $10.440 $2.001 $0.569 $0.353 $6.709 $5.833 $26.294 $9.203 $22.924 0.855 $19.606 1
25 36 12 7 17 100 $94.00 $28.20 $3.29 $34.657 $9.847 $6.116 $10.124 $1.941 $0.551 $0.342 $6.506 $5.833 $25.322 $8.863 $22.292 0.849 $18.936 1
26 35 12 7 16 97 $94.00 $28.20 $3.29 $33.609 $9.549 $5.931 $9.818 $1.882 $0.535 $0.332 $6.310 $5.833 $24.379 $8.533 $21.680 0.844 $18.291 1
27 34 12 7 16 94 $94.00 $28.20 $3.29 $32.592 $9.260 $5.752 $9.521 $1.825 $0.519 $0.322 $6.119 $5.833 $23.465 $8.213 $21.086 0.838 $17.669 1
28 33 11 7 15 91 $94.00 $28.20 $3.29 $31.606 $8.980 $5.578 $9.233 $1.770 $0.503 $0.312 $5.934 $5.833 $22.579 $7.903 $20.510 0.832 $17.070 1
29 32 11 6 15 88 $94.00 $28.20 $3.29 $30.721 $8.728 $5.421 $8.974 $1.720 $0.489 $0.304 $5.767 $5.833 $21.783 $7.624 $19.993 0.827 $16.527 1
30 31 11 6 14 86 $94.00 $28.20 $3.29 $29.861 $8.484 $5.270 $8.723 $1.672 $0.475 $0.295 $5.606 $5.833 $21.010 $7.354 $19.490 0.821 $16.003 1
31 30 10 6 14 84 $94.00 $28.20 $3.29 $29.026 $8.247 $5.122 $8.479 $1.625 $0.462 $0.287 $5.449 $5.833 $20.259 $7.091 $19.002 0.816 $15.496 1
32 29 10 6 14 81 $94.00 $28.20 $3.29 $28.213 $8.016 $4.979 $8.242 $1.580 $0.449 $0.279 $5.297 $5.833 $19.529 $6.835 $18.527 0.810 $15.006 1
33 29 10 6 13 79 $94.00 $28.20 $3.29 $27.423 $7.791 $4.839 $8.011 $1.536 $0.436 $0.271 $5.148 $5.833 $18.819 $6.587 $18.065 0.804 $14.534 1
34 28 9 6 13 77 $94.00 $28.20 $3.29 $26.656 $7.573 $4.704 $7.787 $1.493 $0.424 $0.263 $5.004 $5.833 $18.129 $6.345 $17.617 0.799 $14.077 1
35 27 9 5 12 75 $94.00 $28.20 $3.29 $25.910 $7.361 $4.572 $7.569 $1.451 $0.412 $0.256 $4.864 $5.833 $17.458 $6.110 $17.181 0.794 $13.635 1
36 26 9 5 12 72 $94.00 $28.20 $3.29 $25.184 $7.155 $4.444 $7.357 $1.410 $0.401 $0.249 $4.728 $5.833 $16.806 $5.882 $16.757 0.788 $13.209 1
37 26 9 5 12 70 $94.00 $28.20 $3.29 $24.479 $6.955 $4.320 $7.151 $1.371 $0.389 $0.242 $4.596 $5.833 $16.172 $5.660 $16.345 0.783 $12.797 1
38 25 8 5 11 68 $94.00 $28.20 $3.29 $23.794 $6.760 $4.199 $6.951 $1.332 $0.379 $0.235 $4.467 $5.833 $15.556 $5.445 $15.945 0.778 $12.399 1
39 24 8 5 11 67 $94.00 $28.20 $3.29 $23.128 $6.571 $4.081 $6.756 $1.295 $0.368 $0.229 $4.342 $5.833 $14.958 $5.235 $15.556 0.772 $12.014 1
40 23 8 5 11 65 $94.00 $28.20 $3.29 $22.481 $6.387 $3.967 $6.567 $1.259 $0.358 $0.222 $4.220 $5.833 $14.376 $5.031 $15.177 0.767 $11.643 1
minimum (breakeven) EUR and IP (flow) for the given price: minimum (breakeven) EUR and IP (flow) for the given price:
Full Cycle DUC Full Cycle DUC
Mississippian My Assumptions:
Basin Characteristics Average Well Mississippian Mississippian
Baseline Results (2016 factor prices) Sensitivity Results (2014 factor prices, G2=133%)
Results
Capex ($1,000s) Production (boe/d) Prices Cash Flows ($1,000)
jsmith:
Constant exponential
decline begins at year 4
Page 70
Appendix A: Minimum EUR as function of price, 2014 and 2016 Cost scenarios.
A-19
Marmaton
100% oilfield service & supply factor price scalar
$3.06 cost/well ($mm) IP EUR 30 days/month
94 EUR/well (mboe) 276 201 -1.22% exponential decline rate after year 3 (monthly)
-69% 1st yr decline -9.3% 85 $100.00 oil price WTI ($/bbl)
-41% 2nd yr decline -4.3% 50 0% oil price appreciation (per month) Price EUR IP EUR IP Price EUR IP EUR IP
-26% 3rd yr decline -2.5% 43 $3.50 gas price Henry Hub ($/mcf) $20 771 1,059 385 529 $20 1,326 1,821 660 906
130 IP rate (boe/d) 0% gas price appreciation $25 595 817 298 409 $25 959 1,317 478 656
$5.00 opex-LOE ($/boe) 30% NGL price/oil price (fixed ratio) $30 485 666 244 335 $30 751 1,031 375 515
55% % oil 0.68% discount rate (compound monthly) $35 409 562 206 283 $35 617 847 308 423
25% % gas 8.5% discount rate (annual) $40 354 486 179 246 $40 524 720 262 360
20% % NGL 80% intangible drilling cost / total capex $45 312 428 158 217 $45 455 625 228 313
20.0% royalty rate 1.373 IP/EUR ratio, (B8/B4 = fixed ratio) $50 279 383 141 194 $50 403 553 202 277
7.0% oil prod tax $60 231 317 117 161 $60 327 449 164 225
7.0% gas prod tax $70 196 269 100 137 $70 275 378 138 189
7.0% NGL prod tax -$0.805 = NPV/well ($ million) $80 171 235 87 119 $80 238 327 120 165
35.0% income tax rate 0 = EUR check (mboe) $90 152 209 78 107 $90 209 287 106 146
-6% oil differential -0.12% = ATIRR (monthly) $100 136 187 70 96 $100 187 257 94 129
-6% gas differential -1.42% = ATIRR (annual)
0 1 = DUC 94 = total production (mboe)
25% auxillary cost/well cost $0.879 = "tail end" NPV/well ($ million)
50% completion cost/well cost 94% = "tail end" recovery factor
$2,000 min opex ($/month) 110 = months of lost production
Per Well Net Cash Flow Analysis
mcf/d AT NPV Active
Month Well Cost Aux. Cost Total Oil NGL Gas Gas Prod Oil/bbl NGL/bbl Gas/mcf Oil Rev Gas Rev NGL Rev Royalty Oil Tax Gas Tax NGL Tax Opex Depeciation Tax. Inc. Income Tax NCF PV Factor -$805 1/0
1 $765 $191 $94.00 $28.20 $3.29 $765.000 -$765.00 -$267.750 -689 1.000 -$688.50
2 $765 $191 $94.00 $28.20 $3.29 $765.000 -$765.00 -$267.750 -689 0.993 -$683.84
3 $765 $191 $94.00 $28.20 $3.29 $765.000 -$765.00 -$267.750 -689 0.986 -$679.20
4 $765 $191 $94.00 $28.20 $3.29 $765.000 -$765.00 -$267.750 -689 0.980 -$674.60
5 130 71 26 32 194 $94.00 $28.20 $3.29 $201.014 $19.188 $21.929 $48.43 $11.26 $1.07 $1.23 $19.440 $6.375 $154.330 $54.015 $106.689 0.973 $103.827 1
6 117 65 23 29 176 $94.00 $28.20 $3.29 $182.223 $17.394 $19.879 $43.899 $10.204 $0.974 $1.113 $17.623 $6.375 $139.307 $48.757 $96.924 0.967 $93.685 1
7 107 59 21 27 160 $94.00 $28.20 $3.29 $165.188 $15.768 $18.021 $39.795 $9.251 $0.883 $1.009 $15.976 $6.375 $125.688 $43.991 $88.072 0.960 $84.552 1
8 97 53 19 24 145 $94.00 $28.20 $3.29 $149.746 $14.294 $16.336 $36.075 $8.386 $0.800 $0.915 $14.482 $6.375 $113.342 $39.670 $80.047 0.954 $76.327 1
9 88 48 18 22 131 $94.00 $28.20 $3.29 $135.747 $12.958 $14.809 $32.703 $7.602 $0.726 $0.829 $13.128 $6.375 $102.151 $35.753 $72.773 0.947 $68.921 1
10 79 44 16 20 119 $94.00 $28.20 $3.29 $123.057 $11.746 $13.424 $29.646 $6.891 $0.658 $0.752 $11.901 $6.375 $92.005 $32.202 $66.178 0.941 $62.251 1
11 72 40 14 18 108 $94.00 $28.20 $3.29 $111.553 $10.648 $12.169 $26.874 $6.247 $0.596 $0.681 $10.789 $6.375 $82.808 $28.983 $60.200 0.934 $56.244 1
12 65 36 13 16 98 $94.00 $28.20 $3.29 $101.125 $9.653 $11.032 $24.362 $5.663 $0.541 $0.618 $9.780 $6.375 $74.471 $26.065 $54.781 0.928 $50.834 1
13 59 33 12 15 89 $94.00 $28.20 $3.29 $91.671 $8.750 $10.001 $22.084 $5.134 $0.490 $0.560 $8.866 $6.375 $66.914 $23.420 $49.869 0.922 $45.962 1
14 54 29 11 13 80 $94.00 $28.20 $3.29 $83.102 $7.932 $9.066 $20.020 $4.654 $0.444 $0.508 $8.037 $6.375 $60.062 $21.022 $45.415 0.915 $41.574 1
15 49 27 10 12 73 $94.00 $28.20 $3.29 $75.333 $7.191 $8.218 $18.148 $4.219 $0.403 $0.460 $7.286 $6.375 $53.851 $18.848 $41.378 0.909 $37.622 1
16 44 24 9 11 66 $94.00 $28.20 $3.29 $68.291 $6.519 $7.450 $16.452 $3.824 $0.365 $0.417 $6.605 $6.375 $48.221 $16.877 $37.719 0.903 $34.062 1
17 42 23 8 11 63 $94.00 $28.20 $3.29 $65.337 $6.237 $7.128 $15.740 $3.659 $0.349 $0.399 $6.319 $6.375 $45.860 $16.051 $36.184 0.897 $32.454 1
18 40 22 8 10 60 $94.00 $28.20 $3.29 $62.511 $5.967 $6.819 $15.059 $3.501 $0.334 $0.382 $6.046 $6.375 $43.600 $15.260 $34.715 0.891 $30.926 1
19 39 21 8 10 58 $94.00 $28.20 $3.29 $59.807 $5.709 $6.524 $14.408 $3.349 $0.320 $0.365 $5.784 $6.375 $41.439 $14.503 $33.310 0.885 $29.473 1
20 37 20 7 9 55 $94.00 $28.20 $3.29 $57.220 $5.462 $6.242 $13.785 $3.204 $0.306 $0.350 $5.534 $6.375 $39.370 $13.780 $31.966 0.879 $28.092 1
21 35 19 7 9 53 $94.00 $28.20 $3.29 $54.745 $5.226 $5.972 $13.188 $3.066 $0.293 $0.334 $5.294 $6.375 $37.392 $13.087 $30.680 0.873 $26.779 1
22 34 19 7 8 51 $94.00 $28.20 $3.29 $52.377 $5.000 $5.714 $12.618 $2.933 $0.280 $0.320 $5.065 $6.375 $35.498 $12.424 $29.449 0.867 $25.531 1
23 32 18 6 8 48 $94.00 $28.20 $3.29 $50.111 $4.783 $5.467 $12.072 $2.806 $0.268 $0.306 $4.846 $6.375 $33.687 $11.791 $28.272 0.861 $24.344 1
24 31 17 6 8 46 $94.00 $28.20 $3.29 $47.943 $4.576 $5.230 $11.550 $2.685 $0.256 $0.293 $4.637 $6.375 $31.954 $11.184 $27.145 0.855 $23.216 1
25 30 16 6 7 44 $94.00 $28.20 $3.29 $45.870 $4.378 $5.004 $11.050 $2.569 $0.245 $0.280 $4.436 $6.375 $30.296 $10.604 $26.068 0.849 $22.143 1
26 28 16 6 7 42 $94.00 $28.20 $3.29 $43.885 $4.189 $4.788 $10.572 $2.458 $0.235 $0.268 $4.244 $6.375 $28.710 $10.049 $25.037 0.844 $21.123 1
27 27 15 5 7 41 $94.00 $28.20 $3.29 $41.987 $4.008 $4.580 $10.115 $2.351 $0.224 $0.257 $4.061 $6.375 $27.192 $9.517 $24.050 0.838 $20.154 1
28 26 14 5 6 39 $94.00 $28.20 $3.29 $40.171 $3.835 $4.382 $9.678 $2.250 $0.215 $0.245 $3.885 $6.375 $25.740 $9.009 $23.106 0.832 $19.232 1
29 25 14 5 6 38 $94.00 $28.20 $3.29 $39.174 $3.739 $4.274 $9.437 $2.194 $0.209 $0.239 $3.789 $6.375 $24.943 $8.730 $22.588 0.827 $18.673 1
30 25 14 5 6 37 $94.00 $28.20 $3.29 $38.201 $3.646 $4.167 $9.203 $2.139 $0.204 $0.233 $3.695 $6.375 $24.166 $8.458 $22.083 0.821 $18.131 1
31 24 13 5 6 36 $94.00 $28.20 $3.29 $37.253 $3.556 $4.064 $8.975 $2.086 $0.199 $0.228 $3.603 $6.375 $23.408 $8.193 $21.590 0.816 $17.607 1
32 23 13 5 6 35 $94.00 $28.20 $3.29 $36.328 $3.468 $3.963 $8.752 $2.034 $0.194 $0.222 $3.513 $6.375 $22.668 $7.934 $21.109 0.810 $17.098 1
33 23 13 5 6 34 $94.00 $28.20 $3.29 $35.426 $3.382 $3.865 $8.535 $1.984 $0.189 $0.216 $3.426 $6.375 $21.947 $7.682 $20.641 0.804 $16.605 1
34 22 12 4 6 33 $94.00 $28.20 $3.29 $34.547 $3.298 $3.769 $8.323 $1.935 $0.185 $0.211 $3.341 $6.375 $21.244 $7.436 $20.184 0.799 $16.128 1
35 22 12 4 5 33 $94.00 $28.20 $3.29 $33.689 $3.216 $3.675 $8.116 $1.887 $0.180 $0.206 $3.258 $6.375 $20.559 $7.196 $19.738 0.794 $15.665 1
36 21 12 4 5 32 $94.00 $28.20 $3.29 $32.853 $3.136 $3.584 $7.915 $1.840 $0.176 $0.201 $3.177 $6.375 $19.890 $6.962 $19.304 0.788 $15.216 1
37 21 11 4 5 31 $94.00 $28.20 $3.29 $32.038 $3.058 $3.495 $7.718 $1.794 $0.171 $0.196 $3.098 $6.375 $19.238 $6.733 $18.880 0.783 $14.781 1
38 20 11 4 5 30 $94.00 $28.20 $3.29 $31.242 $2.982 $3.408 $7.527 $1.750 $0.167 $0.191 $3.021 $6.375 $18.602 $6.511 $18.466 0.778 $14.360 1
39 20 11 4 5 29 $94.00 $28.20 $3.29 $30.467 $2.908 $3.324 $7.340 $1.706 $0.163 $0.186 $2.946 $6.375 $17.982 $6.294 $18.063 0.772 $13.951 1
40 19 11 4 5 29 $94.00 $28.20 $3.29 $29.710 $2.836 $3.241 $7.158 $1.664 $0.159 $0.182 $2.873 $6.375 $17.378 $6.082 $17.670 0.767 $13.555 1
minimum (breakeven) EUR and IP (flow) for the given price: minimum (breakeven) EUR and IP (flow) for the given price:
Full Cycle DUC Full Cycle DUC
Marmaton My Assumptions:
Basin Characteristics Average Well Marmaton Marmaton
Baseline Results (2016 factor prices) Sensitivity Results (2014 factor prices, G2=133%)
Results
Capex ($1,000s) Production (boe/d) Prices Cash Flows ($1,000)
jsmith:
Constant exponential
decline begins at year 4
Page 71
Appendix A: Minimum EUR as function of price, 2014 and 2016 Cost scenarios.
A-20
Tonkawa
100% oilfield service & supply factor price scalar
$3.70 cost/well ($mm) IP EUR 30 days/month
115 EUR/well (mboe) 340 249 -1.12% exponential decline rate after year 3 (monthly)
-73% 1st yr decline -10.4% 91 $100.00 oil price WTI ($/bbl)
-38% 2nd yr decline -4.0% 56 0% oil price appreciation (per month) Price EUR IP EUR IP Price EUR IP EUR IP
-20% 3rd yr decline -1.9% 50 $3.50 gas price Henry Hub ($/mcf) $20 901 1,230 449 613 $20 1,525 2,082 758 1,035
157 IP rate (boe/d) 0% gas price appreciation $25 705 963 352 481 $25 1,125 1,536 560 765
$5.00 opex-LOE ($/boe) 30% NGL price/oil price (fixed ratio) $30 579 791 290 396 $30 891 1,217 444 606
56% % oil 0.68% discount rate (compound monthly) $35 491 670 246 336 $35 738 1,008 368 502
28% % gas 8.5% discount rate (annual) $40 427 583 214 292 $40 630 860 314 429
17% % NGL 80% intangible drilling cost / total capex $45 377 515 190 259 $45 550 751 274 374
20.0% royalty rate 1.365 IP/EUR ratio, (B8/B4 = fixed ratio) $50 338 462 170 232 $50 487 665 244 333
7.0% oil prod tax $60 280 382 141 193 $60 398 543 199 272
7.0% gas prod tax $70 239 326 121 165 $70 336 459 168 229
7.0% NGL prod tax -$0.972 = NPV/well ($ million) $80 209 285 106 145 $80 291 397 146 199
35.0% income tax rate 0 = EUR check (mboe) $90 185 253 94 128 $90 256 350 129 176
-6% oil differential -0.05% = ATIRR (monthly) $100 166 227 85 116 $100 229 313 115 157
-6% gas differential -0.57% = ATIRR (annual)
0 1 = DUC 115 = total production (mboe)
25% auxillary cost/well cost $1.150 = "tail end" NPV/well ($ million)
50% completion cost/well cost 96% = "tail end" recovery factor
$2,000 min opex ($/month) 72 = months of lost production
Per Well Net Cash Flow Analysis
mcf/d AT NPV Active
Month Well Cost Aux. Cost Total Oil NGL Gas Gas Prod Oil/bbl NGL/bbl Gas/mcf Oil Rev Gas Rev NGL Rev Royalty Oil Tax Gas Tax NGL Tax Opex Depeciation Tax. Inc. Income Tax NCF PV Factor -$972 1/0
1 $925 $231 $94.00 $28.20 $3.29 $925.000 -$925.00 -$323.750 -833 1.000 -$832.50
2 $925 $231 $94.00 $28.20 $3.29 $925.000 -$925.00 -$323.750 -833 0.993 -$826.86
3 $925 $231 $94.00 $28.20 $3.29 $925.000 -$925.00 -$323.750 -833 0.986 -$821.26
4 $925 $231 $94.00 $28.20 $3.29 $925.000 -$925.00 -$323.750 -833 0.980 -$815.69
5 157 88 27 44 264 $94.00 $28.20 $3.29 $248.208 $26.062 $22.605 $59.38 $13.90 $1.46 $1.27 $23.576 $7.708 $189.591 $66.357 $130.942 0.973 $127.430 1
6 141 79 24 39 237 $94.00 $28.20 $3.29 $222.389 $23.351 $20.253 $53.199 $12.454 $1.308 $1.134 $21.124 $7.708 $169.067 $59.173 $117.602 0.967 $113.672 1
7 126 71 21 35 212 $94.00 $28.20 $3.29 $199.256 $20.922 $18.146 $47.665 $11.158 $1.172 $1.016 $18.926 $7.708 $150.678 $52.737 $105.649 0.960 $101.427 1
8 113 63 19 32 190 $94.00 $28.20 $3.29 $178.528 $18.745 $16.259 $42.707 $9.998 $1.050 $0.910 $16.957 $7.708 $134.203 $46.971 $94.940 0.954 $90.528 1
9 101 57 17 28 170 $94.00 $28.20 $3.29 $159.957 $16.796 $14.568 $38.264 $8.958 $0.941 $0.816 $15.194 $7.708 $119.441 $41.804 $85.345 0.947 $80.827 1
10 91 51 15 25 152 $94.00 $28.20 $3.29 $143.318 $15.048 $13.052 $34.284 $8.026 $0.843 $0.731 $13.613 $7.708 $106.214 $37.175 $76.748 0.941 $72.192 1
11 81 46 14 23 137 $94.00 $28.20 $3.29 $128.410 $13.483 $11.694 $30.717 $7.191 $0.755 $0.655 $12.197 $7.708 $94.364 $33.027 $69.045 0.934 $64.507 1
12 73 41 12 20 122 $94.00 $28.20 $3.29 $115.052 $12.080 $10.478 $27.522 $6.443 $0.677 $0.587 $10.928 $7.708 $83.746 $29.311 $62.143 0.928 $57.665 1
13 65 37 11 18 110 $94.00 $28.20 $3.29 $103.084 $10.824 $9.388 $24.659 $5.773 $0.606 $0.526 $9.791 $7.708 $74.232 $25.981 $55.959 0.922 $51.575 1
14 58 33 10 16 98 $94.00 $28.20 $3.29 $92.361 $9.698 $8.411 $22.094 $5.172 $0.543 $0.471 $8.773 $7.708 $65.709 $22.998 $50.419 0.915 $46.154 1
15 52 29 9 15 88 $94.00 $28.20 $3.29 $82.753 $8.689 $7.536 $19.796 $4.634 $0.487 $0.422 $7.860 $7.708 $58.072 $20.325 $45.455 0.909 $41.328 1
16 47 26 8 13 79 $94.00 $28.20 $3.29 $74.145 $7.785 $6.752 $17.737 $4.152 $0.436 $0.378 $7.043 $7.708 $51.229 $17.930 $41.007 0.903 $37.032 1
17 45 25 8 13 76 $94.00 $28.20 $3.29 $71.205 $7.477 $6.485 $17.033 $3.987 $0.419 $0.363 $6.763 $7.708 $48.892 $17.112 $39.488 0.897 $35.418 1
18 43 24 7 12 73 $94.00 $28.20 $3.29 $68.382 $7.180 $6.228 $16.358 $3.829 $0.402 $0.349 $6.495 $7.708 $46.648 $16.327 $38.029 0.891 $33.879 1
19 42 23 7 12 70 $94.00 $28.20 $3.29 $65.670 $6.895 $5.981 $15.709 $3.678 $0.386 $0.335 $6.238 $7.708 $44.492 $15.572 $36.628 0.885 $32.410 1
20 40 22 7 11 67 $94.00 $28.20 $3.29 $63.066 $6.622 $5.744 $15.086 $3.532 $0.371 $0.322 $5.990 $7.708 $42.423 $14.848 $35.283 0.879 $31.008 1
21 38 21 7 11 64 $94.00 $28.20 $3.29 $60.566 $6.359 $5.516 $14.488 $3.392 $0.356 $0.309 $5.753 $7.708 $40.435 $14.152 $33.991 0.873 $29.670 1
22 37 21 6 10 62 $94.00 $28.20 $3.29 $58.164 $6.107 $5.297 $13.914 $3.257 $0.342 $0.297 $5.525 $7.708 $38.526 $13.484 $32.750 0.867 $28.393 1
23 35 20 6 10 59 $94.00 $28.20 $3.29 $55.858 $5.865 $5.087 $13.362 $3.128 $0.328 $0.285 $5.306 $7.708 $36.693 $12.842 $31.559 0.861 $27.175 1
24 34 19 6 10 57 $94.00 $28.20 $3.29 $53.643 $5.633 $4.885 $12.832 $3.004 $0.315 $0.274 $5.095 $7.708 $34.932 $12.226 $30.414 0.855 $26.012 1
25 33 18 6 9 55 $94.00 $28.20 $3.29 $51.516 $5.409 $4.692 $12.323 $2.885 $0.303 $0.263 $4.893 $7.708 $33.241 $11.634 $29.315 0.849 $24.902 1
26 31 18 5 9 53 $94.00 $28.20 $3.29 $49.473 $5.195 $4.506 $11.835 $2.771 $0.291 $0.252 $4.699 $7.708 $31.618 $11.066 $28.260 0.844 $23.843 1
27 30 17 5 8 51 $94.00 $28.20 $3.29 $47.512 $4.989 $4.327 $11.365 $2.661 $0.279 $0.242 $4.513 $7.708 $30.058 $10.520 $27.246 0.838 $22.832 1
28 29 16 5 8 49 $94.00 $28.20 $3.29 $45.628 $4.791 $4.155 $10.915 $2.555 $0.268 $0.233 $4.334 $7.708 $28.561 $9.996 $26.273 0.832 $21.867 1
29 28 16 5 8 48 $94.00 $28.20 $3.29 $44.774 $4.701 $4.078 $10.711 $2.507 $0.263 $0.228 $4.253 $7.708 $27.882 $9.759 $25.832 0.827 $21.354 1
30 28 16 5 8 47 $94.00 $28.20 $3.29 $43.936 $4.613 $4.001 $10.510 $2.460 $0.258 $0.224 $4.173 $7.708 $27.216 $9.526 $25.399 0.821 $20.854 1
31 27 15 5 8 46 $94.00 $28.20 $3.29 $43.114 $4.527 $3.926 $10.314 $2.414 $0.254 $0.220 $4.095 $7.708 $26.563 $9.297 $24.974 0.816 $20.366 1
32 27 15 5 8 45 $94.00 $28.20 $3.29 $42.307 $4.442 $3.853 $10.121 $2.369 $0.249 $0.216 $4.019 $7.708 $25.922 $9.073 $24.557 0.810 $19.891 1
33 26 15 4 7 44 $94.00 $28.20 $3.29 $41.516 $4.359 $3.781 $9.931 $2.325 $0.244 $0.212 $3.943 $7.708 $25.292 $8.852 $24.148 0.804 $19.427 1
34 26 14 4 7 43 $94.00 $28.20 $3.29 $40.739 $4.278 $3.710 $9.745 $2.281 $0.240 $0.208 $3.870 $7.708 $24.675 $8.636 $23.747 0.799 $18.975 1
35 25 14 4 7 43 $94.00 $28.20 $3.29 $39.977 $4.198 $3.641 $9.563 $2.239 $0.235 $0.204 $3.797 $7.708 $24.069 $8.424 $23.353 0.794 $18.534 1
36 25 14 4 7 42 $94.00 $28.20 $3.29 $39.229 $4.119 $3.573 $9.384 $2.197 $0.231 $0.200 $3.726 $7.708 $23.474 $8.216 $22.967 0.788 $18.103 1
37 24 14 4 7 41 $94.00 $28.20 $3.29 $38.495 $4.042 $3.506 $9.209 $2.156 $0.226 $0.196 $3.656 $7.708 $22.891 $8.012 $22.587 0.783 $17.684 1
38 24 13 4 7 40 $94.00 $28.20 $3.29 $37.775 $3.966 $3.440 $9.036 $2.115 $0.222 $0.193 $3.588 $7.708 $22.318 $7.811 $22.215 0.778 $17.275 1
39 23 13 4 7 39 $94.00 $28.20 $3.29 $37.068 $3.892 $3.376 $8.867 $2.076 $0.218 $0.189 $3.521 $7.708 $21.757 $7.615 $21.850 0.772 $16.876 1
40 23 13 4 6 39 $94.00 $28.20 $3.29 $36.374 $3.819 $3.313 $8.701 $2.037 $0.214 $0.186 $3.455 $7.708 $21.205 $7.422 $21.492 0.767 $16.486 1
minimum (breakeven) EUR and IP (flow) for the given price: minimum (breakeven) EUR and IP (flow) for the given price:
Full Cycle DUC Full Cycle DUC
Tonkawa My Assumptions:
Basin Characteristics Average Well Tonkawa Tonkawa
Baseline Results (2016 factor prices) Sensitivity Results (2014 factor prices, G2=133%)
Results
Capex ($1,000s) Production (boe/d) Prices Cash Flows ($1,000)
jsmith:
Constant exponential
decline begins at year 4
Page 72
Appendix A: Minimum EUR as function of price, 2014 and 2016 Cost scenarios.
A-21
Granite Wash
100% oilfield service & supply factor price scalar
$7.50 cost/well ($mm) IP EUR 30 days/month
397 EUR/well (mboe) 1,340 736 -1.58% exponential decline rate after year 3 (monthly)
-74% 1st yr decline -10.5% 353 $100.00 oil price WTI ($/bbl)
-43% 2nd yr decline -4.6% 200 0% oil price appreciation (per month) Price EUR IP EUR IP Price EUR IP EUR IP
-32% 3rd yr decline -3.2% 165 $3.50 gas price Henry Hub ($/mcf) $20 1,964 3,576 977 1,779 $20 3,518 6,405 1747 3,181
723 IP rate (boe/d) 0% gas price appreciation $25 1,696 3,088 844 1,537 $25 2,899 5,278 1440 2,622
$5.00 opex-LOE ($/boe) 30% NGL price/oil price (fixed ratio) $30 1,492 2,716 743 1,353 $30 2,466 4,490 1225 2,230
20% % oil 0.68% discount rate (compound monthly) $35 1,332 2,425 663 1,207 $35 2,145 3,905 1066 1,941
50% % gas 8.5% discount rate (annual) $40 1,203 2,190 599 1,091 $40 1,898 3,456 943 1,717
30% % NGL 80% intangible drilling cost / total capex $45 1,097 1,997 546 994 $45 1,702 3,099 846 1,540
20.0% royalty rate 1.821 IP/EUR ratio, (B8/B4 = fixed ratio) $50 1,008 1,835 502 914 $50 1,543 2,809 767 1,396
7.0% oil prod tax $60 867 1,579 432 787 $60 1,300 2,367 646 1,176
7.0% gas prod tax $70 761 1,386 380 692 $70 1,123 2,045 559 1,018
7.0% NGL prod tax -$1.802 = NPV/well ($ million) $80 678 1,234 338 615 $80 989 1,801 492 896
35.0% income tax rate 0 = EUR check (mboe) $90 612 1,114 305 555 $90 883 1,608 439 799
-6% oil differential -0.13% = ATIRR (monthly) $100 557 1,014 278 506 $100 798 1,453 397 723
-6% gas differential -1.53% = ATIRR (annual)
0 1 = DUC 397 = total production (mboe)
25% auxillary cost/well cost $1.907 = "tail end" NPV/well ($ million)
50% completion cost/well cost 98% = "tail end" recovery factor
$2,000 min opex ($/month) 99 = months of lost production
Per Well Net Cash Flow Analysis
mcf/d AT NPV Active
Month Well Cost Aux. Cost Total Oil NGL Gas Gas Prod Oil/bbl NGL/bbl Gas/mcf Oil Rev Gas Rev NGL Rev Royalty Oil Tax Gas Tax NGL Tax Opex Depeciation Tax. Inc. Income Tax NCF PV Factor -$1,802 1/0
1 $1,875 $469 $94.00 $28.20 $3.29 $1,875.000 -$1,875.00 -$656.250 -1,688 1.000 -$1,687.50
2 $1,875 $469 $94.00 $28.20 $3.29 $1,875.000 -$1,875.00 -$656.250 -1,688 0.993 -$1,676.07
3 $1,875 $469 $94.00 $28.20 $3.29 $1,875.000 -$1,875.00 -$656.250 -1,688 0.986 -$1,664.71
4 $1,875 $469 $94.00 $28.20 $3.29 $1,875.000 -$1,875.00 -$656.250 -1,688 0.980 -$1,653.43
5 723 145 217 361 2,169 $94.00 $28.20 $3.29 $407.703 $214.044 $183.466 $161.04 $22.83 $11.99 $10.27 $108.432 $15.625 $475.022 $166.258 $324.389 0.973 $315.687 1
6 647 129 194 323 1,940 $94.00 $28.20 $3.29 $364.809 $191.525 $164.164 $144.100 $20.429 $10.725 $9.193 $97.024 $15.625 $423.402 $148.191 $290.836 0.967 $281.116 1
7 579 116 174 289 1,736 $94.00 $28.20 $3.29 $326.429 $171.375 $146.893 $128.939 $18.280 $9.597 $8.226 $86.816 $15.625 $377.213 $132.025 $260.814 0.960 $250.389 1
8 518 104 155 259 1,554 $94.00 $28.20 $3.29 $292.086 $153.345 $131.439 $115.374 $16.357 $8.587 $7.361 $77.682 $15.625 $335.884 $117.559 $233.949 0.954 $223.077 1
9 463 93 139 232 1,390 $94.00 $28.20 $3.29 $261.357 $137.212 $117.610 $103.236 $14.636 $7.684 $6.586 $69.510 $15.625 $298.903 $104.616 $209.912 0.947 $198.800 1
10 415 83 124 207 1,244 $94.00 $28.20 $3.29 $233.860 $122.776 $105.237 $92.375 $13.096 $6.875 $5.893 $62.197 $15.625 $265.812 $93.034 $188.403 0.941 $177.221 1
11 371 74 111 186 1,113 $94.00 $28.20 $3.29 $209.256 $109.860 $94.165 $82.656 $11.718 $6.152 $5.273 $55.653 $15.625 $236.203 $82.671 $169.157 0.934 $158.039 1
12 332 66 100 166 996 $94.00 $28.20 $3.29 $187.241 $98.302 $84.258 $73.960 $10.485 $5.505 $4.718 $49.798 $15.625 $209.709 $73.398 $151.936 0.928 $140.988 1
13 297 59 89 149 891 $94.00 $28.20 $3.29 $167.542 $87.959 $75.394 $66.179 $9.382 $4.926 $4.222 $44.559 $15.625 $186.002 $65.101 $136.526 0.922 $125.831 1
14 266 53 80 133 797 $94.00 $28.20 $3.29 $149.915 $78.706 $67.462 $59.217 $8.395 $4.408 $3.778 $39.871 $15.625 $164.789 $57.676 $122.738 0.915 $112.356 1
15 238 48 71 119 714 $94.00 $28.20 $3.29 $134.143 $70.425 $60.364 $52.987 $7.512 $3.944 $3.380 $35.676 $15.625 $145.809 $51.033 $110.401 0.909 $100.378 1
16 213 43 64 106 638 $94.00 $28.20 $3.29 $120.030 $63.016 $54.014 $47.412 $6.722 $3.529 $3.025 $31.923 $15.625 $128.825 $45.089 $99.361 0.903 $89.728 1
17 203 41 61 101 609 $94.00 $28.20 $3.29 $114.480 $60.102 $51.516 $45.220 $6.411 $3.366 $2.885 $30.447 $15.625 $122.145 $42.751 $95.019 0.897 $85.226 1
18 194 39 58 97 581 $94.00 $28.20 $3.29 $109.186 $57.323 $49.134 $43.128 $6.114 $3.210 $2.751 $29.039 $15.625 $115.774 $40.521 $90.878 0.891 $80.959 1
19 185 37 55 92 554 $94.00 $28.20 $3.29 $104.137 $54.672 $46.862 $41.134 $5.832 $3.062 $2.624 $27.696 $15.625 $109.698 $38.394 $86.929 0.885 $76.916 1
20 176 35 53 88 528 $94.00 $28.20 $3.29 $99.321 $52.144 $44.695 $39.232 $5.562 $2.920 $2.503 $26.415 $15.625 $103.903 $36.366 $83.162 0.879 $73.085 1
21 168 34 50 84 504 $94.00 $28.20 $3.29 $94.728 $49.732 $42.628 $37.418 $5.305 $2.785 $2.387 $25.194 $15.625 $98.375 $34.431 $79.569 0.873 $69.453 1
22 160 32 48 80 481 $94.00 $28.20 $3.29 $90.348 $47.433 $40.657 $35.687 $5.059 $2.656 $2.277 $24.029 $15.625 $93.104 $32.586 $76.142 0.867 $66.012 1
23 153 31 46 76 458 $94.00 $28.20 $3.29 $86.170 $45.239 $38.777 $34.037 $4.826 $2.533 $2.171 $22.918 $15.625 $88.076 $30.827 $72.874 0.861 $62.751 1
24 146 29 44 73 437 $94.00 $28.20 $3.29 $82.185 $43.147 $36.983 $32.463 $4.602 $2.416 $2.071 $21.858 $15.625 $83.280 $29.148 $69.757 0.855 $59.660 1
25 139 28 42 69 417 $94.00 $28.20 $3.29 $78.385 $41.152 $35.273 $30.962 $4.390 $2.305 $1.975 $20.847 $15.625 $78.707 $27.547 $66.784 0.849 $56.730 1
26 133 27 40 66 398 $94.00 $28.20 $3.29 $74.760 $39.249 $33.642 $29.530 $4.187 $2.198 $1.884 $19.883 $15.625 $74.345 $26.021 $63.949 0.844 $53.954 1
27 126 25 38 63 379 $94.00 $28.20 $3.29 $71.303 $37.434 $32.086 $28.165 $3.993 $2.096 $1.797 $18.964 $15.625 $70.184 $24.564 $61.245 0.838 $51.322 1
28 121 24 36 60 362 $94.00 $28.20 $3.29 $68.006 $35.703 $30.603 $26.862 $3.808 $1.999 $1.714 $18.087 $15.625 $66.216 $23.176 $58.665 0.832 $48.828 1
29 117 23 35 58 350 $94.00 $28.20 $3.29 $65.860 $34.577 $29.637 $26.015 $3.688 $1.936 $1.660 $17.516 $15.625 $63.634 $22.272 $56.987 0.827 $47.109 1
30 113 23 34 57 339 $94.00 $28.20 $3.29 $63.782 $33.485 $28.702 $25.194 $3.572 $1.875 $1.607 $16.963 $15.625 $61.133 $21.396 $55.361 0.821 $45.455 1
31 110 22 33 55 329 $94.00 $28.20 $3.29 $61.769 $32.429 $27.796 $24.399 $3.459 $1.816 $1.557 $16.428 $15.625 $58.711 $20.549 $53.787 0.816 $43.864 1
32 106 21 32 53 318 $94.00 $28.20 $3.29 $59.820 $31.406 $26.919 $23.629 $3.350 $1.759 $1.507 $15.910 $15.625 $56.365 $19.728 $52.262 0.810 $42.331 1
33 103 21 31 51 308 $94.00 $28.20 $3.29 $57.933 $30.415 $26.070 $22.883 $3.244 $1.703 $1.460 $15.408 $15.625 $54.094 $18.933 $50.786 0.804 $40.857 1
34 99 20 30 50 298 $94.00 $28.20 $3.29 $56.105 $29.455 $25.247 $22.161 $3.142 $1.649 $1.414 $14.921 $15.625 $51.894 $18.163 $49.356 0.799 $39.437 1
35 96 19 29 48 289 $94.00 $28.20 $3.29 $54.335 $28.526 $24.451 $21.462 $3.043 $1.597 $1.369 $14.451 $15.625 $49.763 $17.417 $47.971 0.794 $38.071 1
36 93 19 28 47 280 $94.00 $28.20 $3.29 $52.620 $27.626 $23.679 $20.785 $2.947 $1.547 $1.326 $13.995 $15.625 $47.700 $16.695 $46.630 0.788 $36.756 1
37 90 18 27 45 271 $94.00 $28.20 $3.29 $50.960 $26.754 $22.932 $20.129 $2.854 $1.498 $1.284 $13.553 $15.625 $45.702 $15.996 $45.331 0.783 $35.490 1
38 88 18 26 44 263 $94.00 $28.20 $3.29 $49.352 $25.910 $22.208 $19.494 $2.764 $1.451 $1.244 $13.125 $15.625 $43.767 $15.318 $44.074 0.778 $34.272 1
39 85 17 25 42 254 $94.00 $28.20 $3.29 $47.795 $25.092 $21.508 $18.879 $2.676 $1.405 $1.204 $12.711 $15.625 $41.893 $14.663 $42.855 0.772 $33.099 1
40 82 16 25 41 246 $94.00 $28.20 $3.29 $46.286 $24.300 $20.829 $18.283 $2.592 $1.361 $1.166 $12.310 $15.625 $40.078 $14.027 $41.676 0.767 $31.970 1
minimum (breakeven) EUR and IP (flow) for the given price: minimum (breakeven) EUR and IP (flow) for the given price:
Full Cycle DUC Full Cycle DUC
Granite Wash My Assumptions:
Basin Characteristics Average Well Granite Wash Granite Wash
Baseline Results (2016 factor prices) Sensitivity Results (2014 factor prices, G2=133%)
Results
Capex ($1,000s) Production (boe/d) Prices Cash Flows ($1,000)
jsmith:
Constant exponential
decline begins at year 4
Page 73
Appendix A: Minimum EUR as function of price, 2014 and 2016 Cost scenarios.
A-22
Cleveland
100% oilfield service & supply factor price scalar
$2.80 cost/well ($mm) IP EUR 30 days/month
123 EUR/well (mboe) 400 232 -1.50% exponential decline rate after year 3 (monthly)
-74% 1st yr decline -10.5% 106 $100.00 oil price WTI ($/bbl)
-47% 2nd yr decline -5.2% 56 0% oil price appreciation (per month) Price EUR IP EUR IP Price EUR IP EUR IP
-20% 3rd yr decline -1.9% 50 $3.50 gas price Henry Hub ($/mcf) $20 701 1,209 351 605 $20 1,225 2,112 610 1,052
213 IP rate (boe/d) 0% gas price appreciation $25 589 1,016 295 509 $25 979 1,688 488 841
$5.00 opex-LOE ($/boe) 30% NGL price/oil price (fixed ratio) $30 508 876 255 440 $30 815 1,405 407 702
30% % oil 0.68% discount rate (compound monthly) $35 447 771 225 388 $35 699 1,205 349 602
45% % gas 8.5% discount rate (annual) $40 399 688 201 347 $40 611 1,053 305 526
25% % NGL 80% intangible drilling cost / total capex $45 360 621 181 312 $45 543 936 272 469
20.0% royalty rate 1.724 IP/EUR ratio, (B8/B4 = fixed ratio) $50 328 566 165 284 $50 489 843 245 422
7.0% oil prod tax $60 279 481 141 243 $60 408 703 204 352
7.0% gas prod tax $70 243 419 123 212 $70 349 602 175 302
7.0% NGL prod tax -$0.702 = NPV/well ($ million) $80 215 371 109 188 $80 306 528 154 266
35.0% income tax rate 0 = EUR check (mboe) $90 193 333 98 169 $90 272 469 137 236
-6% oil differential -0.19% = ATIRR (monthly) $100 175 302 89 153 $100 245 422 123 212
-6% gas differential -2.27% = ATIRR (annual)
0 1 = DUC 123 = total production (mboe)
25% auxillary cost/well cost $0.728 = "tail end" NPV/well ($ million)
50% completion cost/well cost 93% = "tail end" recovery factor
$2,000 min opex ($/month) 151 = months of lost production
Per Well Net Cash Flow Analysis
mcf/d AT NPV Active
Month Well Cost Aux. Cost Total Oil NGL Gas Gas Prod Oil/bbl NGL/bbl Gas/mcf Oil Rev Gas Rev NGL Rev Royalty Oil Tax Gas Tax NGL Tax Opex Depeciation Tax. Inc. Income Tax NCF PV Factor -$702 1/0
1 $700 $175 $94.00 $28.20 $3.29 $700.000 -$700.00 -$245.000 -630 1.000 -$630.00
2 $700 $175 $94.00 $28.20 $3.29 $700.000 -$700.00 -$245.000 -630 0.993 -$625.73
3 $700 $175 $94.00 $28.20 $3.29 $700.000 -$700.00 -$245.000 -630 0.986 -$621.49
4 $700 $175 $94.00 $28.20 $3.29 $700.000 -$700.00 -$245.000 -630 0.980 -$617.28
5 213 64 53 96 574 $94.00 $28.20 $3.29 $179.776 $56.629 $44.944 $56.27 $10.07 $3.17 $2.52 $31.875 $5.833 $171.615 $60.065 $117.383 0.973 $114.234 1
6 190 57 48 86 514 $94.00 $28.20 $3.29 $160.942 $50.697 $40.235 $50.375 $9.013 $2.839 $2.253 $28.536 $5.833 $153.025 $53.559 $105.300 0.967 $101.780 1
7 170 51 43 77 460 $94.00 $28.20 $3.29 $144.081 $45.385 $36.020 $45.097 $8.069 $2.542 $2.017 $25.546 $5.833 $136.382 $47.734 $94.482 0.960 $90.705 1
8 152 46 38 69 412 $94.00 $28.20 $3.29 $128.986 $40.631 $32.247 $40.373 $7.223 $2.275 $1.806 $22.870 $5.833 $121.483 $42.519 $84.797 0.954 $80.856 1
9 136 41 34 61 369 $94.00 $28.20 $3.29 $115.473 $36.374 $28.868 $36.143 $6.466 $2.037 $1.617 $20.474 $5.833 $108.145 $37.851 $76.127 0.947 $72.098 1
10 122 37 31 55 330 $94.00 $28.20 $3.29 $103.375 $32.563 $25.844 $32.356 $5.789 $1.824 $1.447 $18.329 $5.833 $96.204 $33.671 $68.366 0.941 $64.308 1
11 109 33 27 49 295 $94.00 $28.20 $3.29 $92.545 $29.152 $23.136 $28.967 $5.183 $1.632 $1.296 $16.409 $5.833 $85.514 $29.930 $61.417 0.934 $57.381 1
12 98 29 24 44 264 $94.00 $28.20 $3.29 $82.850 $26.098 $20.712 $25.932 $4.640 $1.461 $1.160 $14.690 $5.833 $75.944 $26.580 $55.197 0.928 $51.220 1
13 88 26 22 39 237 $94.00 $28.20 $3.29 $74.170 $23.364 $18.543 $23.215 $4.154 $1.308 $1.038 $13.151 $5.833 $67.377 $23.582 $49.628 0.922 $45.740 1
14 78 24 20 35 212 $94.00 $28.20 $3.29 $66.400 $20.916 $16.600 $20.783 $3.718 $1.171 $0.930 $11.773 $5.833 $59.707 $20.897 $44.643 0.915 $40.867 1
15 70 21 18 32 190 $94.00 $28.20 $3.29 $59.443 $18.725 $14.861 $18.606 $3.329 $1.049 $0.832 $10.540 $5.833 $52.840 $18.494 $40.180 0.909 $36.532 1
16 63 19 16 28 170 $94.00 $28.20 $3.29 $53.216 $16.763 $13.304 $16.657 $2.980 $0.939 $0.745 $9.435 $5.833 $46.694 $16.343 $36.184 0.903 $32.676 1
17 60 18 15 27 161 $94.00 $28.20 $3.29 $50.460 $15.895 $12.615 $15.794 $2.826 $0.890 $0.706 $8.947 $5.833 $43.973 $15.391 $34.416 0.897 $30.869 1
18 57 17 14 25 153 $94.00 $28.20 $3.29 $47.847 $15.072 $11.962 $14.976 $2.679 $0.844 $0.670 $8.483 $5.833 $41.394 $14.488 $32.740 0.891 $29.166 1
19 54 16 13 24 145 $94.00 $28.20 $3.29 $45.369 $14.291 $11.342 $14.201 $2.541 $0.800 $0.635 $8.044 $5.833 $38.949 $13.632 $31.150 0.885 $27.562 1
20 51 15 13 23 137 $94.00 $28.20 $3.29 $43.020 $13.551 $10.755 $13.465 $2.409 $0.759 $0.602 $7.628 $5.833 $36.629 $12.820 $29.643 0.879 $26.051 1
21 48 14 12 22 130 $94.00 $28.20 $3.29 $40.792 $12.849 $10.198 $12.768 $2.284 $0.720 $0.571 $7.233 $5.833 $34.431 $12.051 $28.213 0.873 $24.627 1
22 46 14 11 21 123 $94.00 $28.20 $3.29 $38.680 $12.184 $9.670 $12.107 $2.166 $0.682 $0.542 $6.858 $5.833 $32.345 $11.321 $26.858 0.867 $23.285 1
23 43 13 11 20 117 $94.00 $28.20 $3.29 $36.677 $11.553 $9.169 $11.480 $2.054 $0.647 $0.513 $6.503 $5.833 $30.368 $10.629 $25.573 0.861 $22.020 1
24 41 12 10 18 111 $94.00 $28.20 $3.29 $34.777 $10.955 $8.694 $10.885 $1.948 $0.613 $0.487 $6.166 $5.833 $28.494 $9.973 $24.354 0.855 $20.829 1
25 39 12 10 18 105 $94.00 $28.20 $3.29 $32.976 $10.388 $8.244 $10.322 $1.847 $0.582 $0.462 $5.847 $5.833 $26.716 $9.351 $23.199 0.849 $19.706 1
26 37 11 9 17 100 $94.00 $28.20 $3.29 $31.269 $9.850 $7.817 $9.787 $1.751 $0.552 $0.438 $5.544 $5.833 $25.031 $8.761 $22.103 0.844 $18.648 1
27 35 11 9 16 95 $94.00 $28.20 $3.29 $29.649 $9.340 $7.412 $9.280 $1.660 $0.523 $0.415 $5.257 $5.833 $23.432 $8.201 $21.064 0.838 $17.652 1
28 33 10 8 15 90 $94.00 $28.20 $3.29 $28.114 $8.856 $7.028 $8.800 $1.574 $0.496 $0.394 $4.985 $5.833 $21.917 $7.671 $20.079 0.832 $16.712 1
29 33 10 8 15 88 $94.00 $28.20 $3.29 $27.588 $8.690 $6.897 $8.635 $1.545 $0.487 $0.386 $4.891 $5.833 $21.397 $7.489 $19.742 0.827 $16.320 1
30 32 10 8 14 86 $94.00 $28.20 $3.29 $27.072 $8.528 $6.768 $8.473 $1.516 $0.478 $0.379 $4.800 $5.833 $20.888 $7.311 $19.411 0.821 $15.937 1
31 31 9 8 14 85 $94.00 $28.20 $3.29 $26.565 $8.368 $6.641 $8.315 $1.488 $0.469 $0.372 $4.710 $5.833 $20.388 $7.136 $19.086 0.816 $15.564 1
32 31 9 8 14 83 $94.00 $28.20 $3.29 $26.068 $8.211 $6.517 $8.159 $1.460 $0.460 $0.365 $4.622 $5.833 $19.897 $6.964 $18.767 0.810 $15.201 1
33 30 9 8 14 82 $94.00 $28.20 $3.29 $25.580 $8.058 $6.395 $8.007 $1.433 $0.451 $0.358 $4.536 $5.833 $19.416 $6.796 $18.454 0.804 $14.846 1
34 30 9 7 13 80 $94.00 $28.20 $3.29 $25.102 $7.907 $6.275 $7.857 $1.406 $0.443 $0.351 $4.451 $5.833 $18.943 $6.630 $18.147 0.799 $14.500 1
35 29 9 7 13 79 $94.00 $28.20 $3.29 $24.632 $7.759 $6.158 $7.710 $1.379 $0.435 $0.345 $4.367 $5.833 $18.480 $6.468 $17.845 0.794 $14.162 1
36 29 9 7 13 77 $94.00 $28.20 $3.29 $24.171 $7.614 $6.043 $7.566 $1.354 $0.426 $0.338 $4.286 $5.833 $18.025 $6.309 $17.550 0.788 $13.833 1
37 28 8 7 13 76 $94.00 $28.20 $3.29 $23.719 $7.471 $5.930 $7.424 $1.328 $0.418 $0.332 $4.205 $5.833 $17.579 $6.152 $17.259 0.783 $13.513 1
38 28 8 7 12 74 $94.00 $28.20 $3.29 $23.275 $7.332 $5.819 $7.285 $1.303 $0.411 $0.326 $4.127 $5.833 $17.141 $5.999 $16.975 0.778 $13.200 1
39 27 8 7 12 73 $94.00 $28.20 $3.29 $22.840 $7.194 $5.710 $7.149 $1.279 $0.403 $0.320 $4.050 $5.833 $16.711 $5.849 $16.695 0.772 $12.894 1
40 26 8 7 12 72 $94.00 $28.20 $3.29 $22.412 $7.060 $5.603 $7.015 $1.255 $0.395 $0.314 $3.974 $5.833 $16.289 $5.701 $16.421 0.767 $12.597 1
minimum (breakeven) EUR and IP (flow) for the given price: minimum (breakeven) EUR and IP (flow) for the given price:
Full Cycle DUC Full Cycle DUC
Cleveland My Assumptions:
Basin Characteristics Average Well Cleveland Cleveland
Baseline Results (2016 factor prices) Sensitivity Results (2014 factor prices, G2=133%)
Results
Capex ($1,000s) Production (boe/d) Prices Cash Flows ($1,000)
jsmith:
Constant exponential
decline begins at year 4
Page 74
Appendix A: Minimum EUR as function of price, 2014 and 2016 Cost scenarios.
A-23
Northern Wattenberg XL
100% oilfield service & supply factor price scalar
$6.60 cost/well ($mm) IP EUR 30 days/month
211 EUR/well (mboe) 722 727 -0.90% exponential decline rate after year 3 (monthly)
-58% 1st yr decline -7.1% 300 $100.00 oil price WTI ($/bbl)
-43% 2nd yr decline -4.5% 172 0% oil price appreciation (per month) Price EUR IP EUR IP Price EUR IP EUR IP
-30% 3rd yr decline -2.9% 144 $3.50 gas price Henry Hub ($/mcf) $20 2,736 2,717 1,358 1,349 $20 8,237 8,180 4,088 4,060
210 IP rate (boe/d) 0% gas price appreciation $25 1,814 1,802 901 895 $25 3,831 3,805 1,902 1,889
$8.00 opex-LOE ($/boe) 30% NGL price/oil price (fixed ratio) $30 1,357 1,348 674 669 $30 2,496 2,479 1,239 1,230
67% % oil 0.68% discount rate (compound monthly) $35 1,084 1,077 538 534 $35 1,851 1,838 919 913
21% % gas 8.5% discount rate (annual) $40 902 896 448 445 $40 1,471 1,461 730 725
13% % NGL 80% intangible drilling cost / total capex $45 773 768 384 381 $45 1,220 1,212 606 602
20.0% royalty rate 0.993 IP/EUR ratio, (B8/B4 = fixed ratio) $50 676 671 336 334 $50 1,043 1,036 518 514
5.0% oil prod tax $60 540 536 269 267 $60 808 802 401 398
5.0% gas prod tax $70 450 447 224 222 $70 659 654 327 325
5.0% NGL prod tax -$1.635 = NPV/well ($ million) $80 386 383 192 191 $80 557 553 277 275
35.0% income tax rate 0 = EUR check (mboe) $90 338 336 168 167 $90 482 479 239 237
-11% oil differential 0.11% = ATIRR (monthly) $100 300 298 150 149 $100 425 422 211 210
-7% gas differential 1.30% = ATIRR (annual)
0 1 = DUC 211 = total production (mboe)
25% auxillary cost/well cost $2.283 = "tail end" NPV/well ($ million)
50% completion cost/well cost 100% = "tail end" recovery factor
$2,000 min opex ($/month) 0 = months of lost production
Per Well Net Cash Flow Analysis
mcf/d AT NPV Active
Month Well Cost Aux. Cost Total Oil NGL Gas Gas Prod Oil/bbl NGL/bbl Gas/mcf Oil Rev Gas Rev NGL Rev Royalty Oil Tax Gas Tax NGL Tax Opex Depeciation Tax. Inc. Income Tax NCF PV Factor -$1,635 1/0
1 $1,650 $413 $89.20 $26.76 $3.26 $1,650.000 -$1,650.00 -$577.500 -1,485 1.000 -$1,485.00
2 $1,650 $413 $89.20 $26.76 $3.26 $1,650.000 -$1,650.00 -$577.500 -1,485 0.993 -$1,474.94
3 $1,650 $413 $89.20 $26.76 $3.26 $1,650.000 -$1,650.00 -$577.500 -1,485 0.986 -$1,464.95
4 $1,650 $413 $89.20 $26.76 $3.26 $1,650.000 -$1,650.00 -$577.500 -1,485 0.980 -$1,455.02
5 210 141 27 44 264 $89.20 $26.76 $3.26 $376.027 $25.805 $21.888 $84.74 $15.04 $1.03 $0.88 $50.335 $13.750 $257.942 $90.280 $181.412 0.973 $176.546 1
6 195 131 25 41 246 $89.20 $26.76 $3.26 $349.490 $23.984 $20.343 $78.763 $13.980 $0.959 $0.814 $46.783 $13.750 $238.768 $83.569 $168.949 0.967 $163.303 1
7 181 121 24 38 228 $89.20 $26.76 $3.26 $324.825 $22.291 $18.908 $73.205 $12.993 $0.892 $0.756 $43.481 $13.750 $220.947 $77.332 $157.366 0.960 $151.076 1
8 168 113 22 35 212 $89.20 $26.76 $3.26 $301.901 $20.718 $17.573 $68.039 $12.076 $0.829 $0.703 $40.412 $13.750 $204.384 $71.534 $146.600 0.954 $139.787 1
9 157 105 20 33 197 $89.20 $26.76 $3.26 $280.595 $19.256 $16.333 $63.237 $11.224 $0.770 $0.653 $37.560 $13.750 $188.990 $66.146 $136.593 0.947 $129.363 1
10 145 97 19 31 183 $89.20 $26.76 $3.26 $260.793 $17.897 $15.180 $58.774 $10.432 $0.716 $0.607 $34.910 $13.750 $174.682 $61.139 $127.293 0.941 $119.738 1
11 135 91 18 28 170 $89.20 $26.76 $3.26 $242.388 $16.634 $14.109 $54.626 $9.696 $0.665 $0.564 $32.446 $13.750 $161.383 $56.484 $118.649 0.934 $110.851 1
12 126 84 16 26 158 $89.20 $26.76 $3.26 $225.282 $15.460 $13.113 $50.771 $9.011 $0.618 $0.525 $30.156 $13.750 $149.024 $52.158 $110.615 0.928 $102.645 1
13 117 78 15 25 147 $89.20 $26.76 $3.26 $209.383 $14.369 $12.188 $47.188 $8.375 $0.575 $0.488 $28.028 $13.750 $137.536 $48.138 $103.149 0.922 $95.068 1
14 109 73 14 23 137 $89.20 $26.76 $3.26 $194.606 $13.355 $11.328 $43.858 $7.784 $0.534 $0.453 $26.050 $13.750 $126.860 $44.401 $96.209 0.915 $88.071 1
15 101 68 13 21 127 $89.20 $26.76 $3.26 $180.872 $12.412 $10.528 $40.763 $7.235 $0.496 $0.421 $24.212 $13.750 $116.936 $40.928 $89.759 0.909 $81.610 1
16 94 63 12 20 118 $89.20 $26.76 $3.26 $168.108 $11.536 $9.785 $37.886 $6.724 $0.461 $0.391 $22.503 $13.750 $107.714 $37.700 $83.764 0.903 $75.643 1
17 90 60 12 19 113 $89.20 $26.76 $3.26 $160.493 $11.014 $9.342 $36.170 $6.420 $0.441 $0.374 $21.484 $13.750 $102.211 $35.774 $80.187 0.897 $71.923 1
18 85 57 11 18 108 $89.20 $26.76 $3.26 $153.222 $10.515 $8.919 $34.531 $6.129 $0.421 $0.357 $20.510 $13.750 $96.958 $33.935 $76.773 0.891 $68.394 1
19 82 55 11 17 103 $89.20 $26.76 $3.26 $146.282 $10.039 $8.515 $32.967 $5.851 $0.402 $0.341 $19.581 $13.750 $91.943 $32.180 $73.513 0.885 $65.046 1
20 78 52 10 16 98 $89.20 $26.76 $3.26 $139.655 $9.584 $8.129 $31.474 $5.586 $0.383 $0.325 $18.694 $13.750 $87.156 $30.504 $70.401 0.879 $61.870 1
21 74 50 10 16 94 $89.20 $26.76 $3.26 $133.329 $9.150 $7.761 $30.048 $5.333 $0.366 $0.310 $17.847 $13.750 $82.585 $28.905 $67.430 0.873 $58.858 1
22 71 48 9 15 89 $89.20 $26.76 $3.26 $127.289 $8.735 $7.409 $28.687 $5.092 $0.349 $0.296 $17.039 $13.750 $78.221 $27.377 $64.593 0.867 $56.000 1
23 68 45 9 14 85 $89.20 $26.76 $3.26 $121.523 $8.340 $7.074 $27.387 $4.861 $0.334 $0.283 $16.267 $13.750 $74.054 $25.919 $61.885 0.861 $53.289 1
24 65 43 8 14 82 $89.20 $26.76 $3.26 $116.018 $7.962 $6.753 $26.147 $4.641 $0.318 $0.270 $15.530 $13.750 $70.077 $24.527 $59.300 0.855 $50.716 1
25 62 41 8 13 78 $89.20 $26.76 $3.26 $110.763 $7.601 $6.447 $24.962 $4.431 $0.304 $0.258 $14.827 $13.750 $66.280 $23.198 $56.832 0.849 $48.276 1
26 59 40 8 12 74 $89.20 $26.76 $3.26 $105.745 $7.257 $6.155 $23.831 $4.230 $0.290 $0.246 $14.155 $13.750 $62.654 $21.929 $54.475 0.844 $45.961 1
27 56 38 7 12 71 $89.20 $26.76 $3.26 $100.955 $6.928 $5.876 $22.752 $4.038 $0.277 $0.235 $13.514 $13.750 $59.193 $20.718 $52.226 0.838 $43.764 1
28 54 36 7 11 68 $89.20 $26.76 $3.26 $96.382 $6.614 $5.610 $21.721 $3.855 $0.265 $0.224 $12.902 $13.750 $55.889 $19.561 $50.078 0.832 $41.680 1
29 52 35 7 11 66 $89.20 $26.76 $3.26 $93.569 $6.421 $5.447 $21.087 $3.743 $0.257 $0.218 $12.525 $13.750 $53.857 $18.850 $48.757 0.827 $40.306 1
30 51 34 7 11 64 $89.20 $26.76 $3.26 $90.839 $6.234 $5.288 $20.472 $3.634 $0.249 $0.212 $12.160 $13.750 $51.884 $18.160 $47.475 0.821 $38.980 1
31 49 33 6 10 62 $89.20 $26.76 $3.26 $88.188 $6.052 $5.133 $19.875 $3.528 $0.242 $0.205 $11.805 $13.750 $49.969 $17.489 $46.230 0.816 $37.701 1
32 48 32 6 10 60 $89.20 $26.76 $3.26 $85.615 $5.875 $4.984 $19.295 $3.425 $0.235 $0.199 $11.460 $13.750 $48.110 $16.838 $45.021 0.810 $36.466 1
33 46 31 6 10 58 $89.20 $26.76 $3.26 $83.117 $5.704 $4.838 $18.732 $3.325 $0.228 $0.194 $11.126 $13.750 $46.305 $16.207 $43.848 0.804 $35.275 1
34 45 30 6 9 57 $89.20 $26.76 $3.26 $80.692 $5.537 $4.697 $18.185 $3.228 $0.221 $0.188 $10.801 $13.750 $44.552 $15.593 $42.709 0.799 $34.126 1
35 44 29 6 9 55 $89.20 $26.76 $3.26 $78.337 $5.376 $4.560 $17.655 $3.133 $0.215 $0.182 $10.486 $13.750 $42.851 $14.998 $41.603 0.794 $33.017 1
36 42 28 6 9 53 $89.20 $26.76 $3.26 $76.051 $5.219 $4.427 $17.139 $3.042 $0.209 $0.177 $10.180 $13.750 $41.200 $14.420 $40.530 0.788 $31.948 1
37 41 28 5 9 52 $89.20 $26.76 $3.26 $73.832 $5.067 $4.298 $16.639 $2.953 $0.203 $0.172 $9.883 $13.750 $39.596 $13.859 $39.488 0.783 $30.915 1
38 40 27 5 8 50 $89.20 $26.76 $3.26 $71.678 $4.919 $4.172 $16.154 $2.867 $0.197 $0.167 $9.595 $13.750 $38.040 $13.314 $38.476 0.778 $29.919 1
39 39 26 5 8 49 $89.20 $26.76 $3.26 $69.586 $4.775 $4.051 $15.682 $2.783 $0.191 $0.162 $9.315 $13.750 $36.528 $12.785 $37.494 0.772 $28.958 1
40 38 25 5 8 47 $89.20 $26.76 $3.26 $67.556 $4.636 $3.932 $15.225 $2.702 $0.185 $0.157 $9.043 $13.750 $35.061 $12.271 $36.540 0.767 $28.030 1
minimum (breakeven) EUR and IP (flow) for the given price: minimum (breakeven) EUR and IP (flow) for the given price:
Full Cycle DUC Full Cycle DUC
Denver Julesburg Basin: Northern Wattenberg XL My Assumptions:
Basin Characteristics Average Well Denver Julesburg Basin: Northern Wattenberg XL Denver Julesburg Basin: Northern Wattenberg XL
Baseline Results (2016 factor prices) Sensitivity Results (2014 factor prices, G2=133%)
Results
Capex ($1,000s) Production (boe/d) Prices Cash Flows ($1,000)
jsmith:
Constant exponential
decline begins at year 4
Page 75
Appendix A: Minimum EUR as function of price, 2014 and 2016 Cost scenarios.
A-24
Northern Wattenberg
100% oilfield service & supply factor price scalar
$4.00 cost/well ($mm) IP EUR 30 days/month
116 EUR/well (mboe) 400 357 -1.07% exponential decline rate after year 3 (monthly)
-56% 1st yr decline -6.7% 175 $100.00 oil price WTI ($/bbl)
-43% 2nd yr decline -4.6% 100 0% oil price appreciation (per month) Price EUR IP EUR IP Price EUR IP EUR IP
-39% 3rd yr decline -4.1% 78 $3.50 gas price Henry Hub ($/mcf) $20 1,476 1,654 734 822 $20 4,158 4,659 2,064 2,313
130 IP rate (boe/d) 0% gas price appreciation $25 983 1,101 489 548 $25 2,016 2,259 1,001 1,122
$8.00 opex-LOE ($/boe) 30% NGL price/oil price (fixed ratio) $30 737 826 367 411 $30 1,331 1,491 661 741
71% % oil 0.68% discount rate (compound monthly) $35 590 661 294 329 $35 993 1,113 494 554
20% % gas 8.5% discount rate (annual) $40 492 551 246 276 $40 792 887 394 441
10% % NGL 80% intangible drilling cost / total capex $45 422 473 211 236 $45 659 738 328 368
20.0% royalty rate 1.120 IP/EUR ratio, (B8/B4 = fixed ratio) $50 369 413 185 207 $50 564 632 281 315
5.0% oil prod tax $60 296 332 148 166 $60 438 491 218 244
5.0% gas prod tax $70 247 277 124 139 $70 358 401 179 201
5.0% NGL prod tax -$1.002 = NPV/well ($ million) $80 211 236 106 119 $80 303 339 151 169
35.0% income tax rate 0 = EUR check (mboe) $90 185 207 93 104 $90 263 295 131 147
-11% oil differential -0.01% = ATIRR (monthly) $100 165 185 83 93 $100 232 260 116 130
-7% gas differential -0.13% = ATIRR (annual)
0 1 = DUC 116 = total production (mboe)
25% auxillary cost/well cost $1.202 = "tail end" NPV/well ($ million)
50% completion cost/well cost 97% = "tail end" recovery factor `
$2,000 min opex ($/month) 57 = months of lost production
Per Well Net Cash Flow Analysis
mcf/d AT NPV Active
Month Well Cost Aux. Cost Total Oil NGL Gas Gas Prod Oil/bbl NGL/bbl Gas/mcf Oil Rev Gas Rev NGL Rev Royalty Oil Tax Gas Tax NGL Tax Opex Depeciation Tax. Inc. Income Tax NCF PV Factor -$1,002 1/0
1 $1,000 $250 $89.20 $26.76 $3.26 $1,000.000 -$1,000.00 -$350.000 -900 1.000 -$900.00
2 $1,000 $250 $89.20 $26.76 $3.26 $1,000.000 -$1,000.00 -$350.000 -900 0.993 -$893.90
3 $1,000 $250 $89.20 $26.76 $3.26 $1,000.000 -$1,000.00 -$350.000 -900 0.986 -$887.85
4 $1,000 $250 $89.20 $26.76 $3.26 $1,000.000 -$1,000.00 -$350.000 -900 0.980 -$881.83
5 130 92 13 26 156 $89.20 $26.76 $3.26 $246.828 $15.223 $10.429 $54.50 $9.87 $0.61 $0.42 $31.179 $8.333 $167.573 $58.650 $117.256 0.973 $114.110 1
6 121 86 12 24 146 $89.20 $26.76 $3.26 $230.396 $14.210 $9.735 $50.868 $9.216 $0.568 $0.389 $29.103 $8.333 $155.863 $54.552 $109.644 0.967 $105.980 1
7 113 80 11 23 136 $89.20 $26.76 $3.26 $215.059 $13.264 $9.087 $47.482 $8.602 $0.531 $0.363 $27.166 $8.333 $144.932 $50.726 $102.539 0.960 $98.441 1
8 106 75 11 21 127 $89.20 $26.76 $3.26 $200.742 $12.381 $8.482 $44.321 $8.030 $0.495 $0.339 $25.357 $8.333 $134.729 $47.155 $95.907 0.954 $91.450 1
9 99 70 10 20 118 $89.20 $26.76 $3.26 $187.379 $11.557 $7.917 $41.371 $7.495 $0.462 $0.317 $23.669 $8.333 $125.205 $43.822 $89.717 0.947 $84.968 1
10 92 65 9 18 110 $89.20 $26.76 $3.26 $174.905 $10.787 $7.390 $38.616 $6.996 $0.431 $0.296 $22.094 $8.333 $116.316 $40.710 $83.938 0.941 $78.957 1
11 86 61 9 17 103 $89.20 $26.76 $3.26 $163.261 $10.069 $6.898 $36.046 $6.530 $0.403 $0.276 $20.623 $8.333 $108.018 $37.806 $78.545 0.934 $73.383 1
12 80 57 8 16 96 $89.20 $26.76 $3.26 $152.393 $9.399 $6.439 $33.646 $6.096 $0.376 $0.258 $19.250 $8.333 $100.272 $35.095 $73.510 0.928 $68.213 1
13 75 53 7 15 90 $89.20 $26.76 $3.26 $142.248 $8.773 $6.010 $31.406 $5.690 $0.351 $0.240 $17.969 $8.333 $93.042 $32.565 $68.811 0.922 $63.420 1
14 70 50 7 14 84 $89.20 $26.76 $3.26 $132.778 $8.189 $5.610 $29.316 $5.311 $0.328 $0.224 $16.772 $8.333 $86.294 $30.203 $64.424 0.915 $58.975 1
15 65 46 7 13 78 $89.20 $26.76 $3.26 $123.939 $7.644 $5.237 $27.364 $4.958 $0.306 $0.209 $15.656 $8.333 $79.994 $27.998 $60.330 0.909 $54.852 1
16 61 43 6 12 73 $89.20 $26.76 $3.26 $115.689 $7.135 $4.888 $25.542 $4.628 $0.285 $0.196 $14.614 $8.333 $74.114 $25.940 $56.508 0.903 $51.029 1
17 58 41 6 12 70 $89.20 $26.76 $3.26 $110.417 $6.810 $4.666 $24.379 $4.417 $0.272 $0.187 $13.948 $8.333 $70.358 $24.625 $54.066 0.897 $48.493 1
18 55 39 6 11 67 $89.20 $26.76 $3.26 $105.386 $6.500 $4.453 $23.268 $4.215 $0.260 $0.178 $13.312 $8.333 $66.772 $23.370 $51.735 0.891 $46.089 1
19 53 38 5 11 64 $89.20 $26.76 $3.26 $100.585 $6.204 $4.250 $22.208 $4.023 $0.248 $0.170 $12.706 $8.333 $63.350 $22.172 $49.511 0.885 $43.808 1
20 51 36 5 10 61 $89.20 $26.76 $3.26 $96.001 $5.921 $4.056 $21.196 $3.840 $0.237 $0.162 $12.127 $8.333 $60.084 $21.029 $47.388 0.879 $41.646 1
21 48 34 5 10 58 $89.20 $26.76 $3.26 $91.627 $5.651 $3.872 $20.230 $3.665 $0.226 $0.155 $11.574 $8.333 $56.966 $19.938 $45.362 0.873 $39.595 1
22 46 33 5 9 55 $89.20 $26.76 $3.26 $87.452 $5.394 $3.695 $19.308 $3.498 $0.216 $0.148 $11.047 $8.333 $53.991 $18.897 $43.428 0.867 $37.650 1
23 44 31 4 9 53 $89.20 $26.76 $3.26 $83.468 $5.148 $3.527 $18.428 $3.339 $0.206 $0.141 $10.544 $8.333 $51.151 $17.903 $41.582 0.861 $35.805 1
24 42 30 4 8 50 $89.20 $26.76 $3.26 $79.665 $4.913 $3.366 $17.589 $3.187 $0.197 $0.135 $10.063 $8.333 $48.441 $16.954 $39.820 0.855 $34.056 1
25 40 28 4 8 48 $89.20 $26.76 $3.26 $76.035 $4.689 $3.213 $16.787 $3.041 $0.188 $0.129 $9.605 $8.333 $45.854 $16.049 $38.139 0.849 $32.397 1
26 38 27 4 8 46 $89.20 $26.76 $3.26 $72.570 $4.476 $3.066 $16.022 $2.903 $0.179 $0.123 $9.167 $8.333 $43.385 $15.185 $36.534 0.844 $30.823 1
27 36 26 4 7 44 $89.20 $26.76 $3.26 $69.264 $4.272 $2.927 $15.292 $2.771 $0.171 $0.117 $8.749 $8.333 $41.029 $14.360 $35.002 0.838 $29.331 1
28 35 25 3 7 42 $89.20 $26.76 $3.26 $66.108 $4.077 $2.793 $14.596 $2.644 $0.163 $0.112 $8.351 $8.333 $38.780 $13.573 $33.540 0.832 $27.916 1
29 33 24 3 7 40 $89.20 $26.76 $3.26 $63.426 $3.912 $2.680 $14.004 $2.537 $0.156 $0.107 $8.012 $8.333 $36.868 $12.904 $32.298 0.827 $26.700 1
30 32 23 3 6 38 $89.20 $26.76 $3.26 $60.853 $3.753 $2.571 $13.436 $2.434 $0.150 $0.103 $7.687 $8.333 $35.035 $12.262 $31.106 0.821 $25.540 1
31 31 22 3 6 37 $89.20 $26.76 $3.26 $58.385 $3.601 $2.467 $12.891 $2.335 $0.144 $0.099 $7.375 $8.333 $33.276 $11.646 $29.962 0.816 $24.434 1
32 29 21 3 6 35 $89.20 $26.76 $3.26 $56.016 $3.455 $2.367 $12.368 $2.241 $0.138 $0.095 $7.076 $8.333 $31.588 $11.056 $28.865 0.810 $23.380 1
33 28 20 3 6 34 $89.20 $26.76 $3.26 $53.744 $3.315 $2.271 $11.866 $2.150 $0.133 $0.091 $6.789 $8.333 $29.968 $10.489 $27.813 0.804 $22.375 1
34 27 19 3 5 33 $89.20 $26.76 $3.26 $51.564 $3.180 $2.179 $11.385 $2.063 $0.127 $0.087 $6.513 $8.333 $28.415 $9.945 $26.803 0.799 $21.417 1
35 26 18 3 5 31 $89.20 $26.76 $3.26 $49.472 $3.051 $2.090 $10.923 $1.979 $0.122 $0.084 $6.249 $8.333 $26.924 $9.423 $25.834 0.794 $20.502 1
36 25 18 2 5 30 $89.20 $26.76 $3.26 $47.466 $2.927 $2.006 $10.480 $1.899 $0.117 $0.080 $5.996 $8.333 $25.494 $8.923 $24.904 0.788 $19.631 1
37 24 17 2 5 29 $89.20 $26.76 $3.26 $45.540 $2.809 $1.924 $10.055 $1.822 $0.112 $0.077 $5.753 $8.333 $24.122 $8.443 $24.012 0.783 $18.800 1
38 23 16 2 5 28 $89.20 $26.76 $3.26 $43.693 $2.695 $1.846 $9.647 $1.748 $0.108 $0.074 $5.519 $8.333 $22.805 $7.982 $23.157 0.778 $18.007 1
39 22 16 2 4 26 $89.20 $26.76 $3.26 $41.920 $2.585 $1.771 $9.255 $1.677 $0.103 $0.071 $5.295 $8.333 $21.542 $7.540 $22.336 0.772 $17.251 1
40 21 15 2 4 25 $89.20 $26.76 $3.26 $40.220 $2.481 $1.699 $8.880 $1.609 $0.099 $0.068 $5.081 $8.333 $20.330 $7.116 $21.548 0.767 $16.529 1
minimum (breakeven) EUR and IP (flow) for the given price: minimum (breakeven) EUR and IP (flow) for the given price:
Full Cycle DUC Full Cycle DUC
Denver Julesburg Basin: Northern Wattenberg My Assumptions:
Basin Characteristics Average Well Denver Julesburg Basin: Northern Wattenberg Denver Julesburg Basin: Northern Wattenberg
Baseline Results (2016 factor prices) Sensitivity Results (2014 factor prices, G2=133%)
Results
Capex ($1,000s) Production (boe/d) Prices Cash Flows ($1,000)
jsmith:
Constant exponential
decline begins at year 4
Page 76
Appendix A: Minimum EUR as function of price, 2014 and 2016 Cost scenarios.
A-25
Southern Wattenberg
100% oilfield service & supply factor price scalar
$3.40 cost/well ($mm) IP EUR 30 days/month
128 EUR/well (mboe) 430 395 -1.16% exponential decline rate after year 3 (monthly)
-55% 1st yr decline -6.5% 193 $100.00 oil price WTI ($/bbl)
-37% 2nd yr decline -3.8% 121 0% oil price appreciation (per month) Price EUR IP EUR IP Price EUR IP EUR IP
-41% 3rd yr decline -4.3% 93 $3.50 gas price Henry Hub ($/mcf) $20 1,379 1,501 686 747 $20 4,432 4,825 2,200 2,395
140 IP rate (boe/d) 0% gas price appreciation $25 970 1,056 483 526 $25 2,194 2,388 1,089 1,185
$8.00 opex-LOE ($/boe) 30% NGL price/oil price (fixed ratio) $30 749 815 373 406 $30 1,458 1,587 724 788
51% % oil 0.68% discount rate (compound monthly) $35 610 664 304 331 $35 1,092 1,189 543 591
33% % gas 8.5% discount rate (annual) $40 514 560 257 280 $40 873 950 434 472
17% % NGL 80% intangible drilling cost / total capex $45 445 484 222 242 $45 727 791 362 394
20.0% royalty rate 1.089 IP/EUR ratio, (B8/B4 = fixed ratio) $50 392 427 196 213 $50 623 678 310 337
5.0% oil prod tax $60 316 344 159 173 $60 484 527 241 262
5.0% gas prod tax $70 266 290 133 145 $70 396 431 198 216
5.0% NGL prod tax -$0.815 = NPV/well ($ million) $80 229 249 115 125 $80 335 365 168 183
35.0% income tax rate 0 = EUR check (mboe) $90 201 219 101 110 $90 291 317 145 158
-11% oil differential 0.00% = ATIRR (monthly) $100 179 195 91 99 $100 257 280 128 139
-7% gas differential 0.01% = ATIRR (annual)
0 1 = DUC 128 = total production (mboe)
25% auxillary cost/well cost $1.036 = "tail end" NPV/well ($ million)
50% completion cost/well cost 96% = "tail end" recovery factor
$2,000 min opex ($/month) 82 = months of lost production
Per Well Net Cash Flow Analysis
mcf/d AT NPV Active
Month Well Cost Aux. Cost Total Oil NGL Gas Gas Prod Oil/bbl NGL/bbl Gas/mcf Oil Rev Gas Rev NGL Rev Royalty Oil Tax Gas Tax NGL Tax Opex Depeciation Tax. Inc. Income Tax NCF PV Factor -$815 1/0
1 $850 $213 $89.20 $26.76 $3.26 $850.000 -$850.00 -$297.500 -765 1.000 -$765.00
2 $850 $213 $89.20 $26.76 $3.26 $850.000 -$850.00 -$297.500 -765 0.993 -$759.82
3 $850 $213 $89.20 $26.76 $3.26 $850.000 -$850.00 -$297.500 -765 0.986 -$754.67
4 $850 $213 $89.20 $26.76 $3.26 $850.000 -$850.00 -$297.500 -765 0.980 -$749.56
5 140 71 24 46 277 $89.20 $26.76 $3.26 $190.851 $27.038 $19.085 $47.39 $7.63 $1.08 $0.76 $33.562 $7.083 $139.455 $48.809 $97.729 0.973 $95.107 1
6 131 67 22 43 259 $89.20 $26.76 $3.26 $178.526 $25.292 $17.853 $44.334 $7.141 $1.012 $0.714 $31.395 $7.083 $129.992 $45.497 $91.578 0.967 $88.517 1
7 122 62 21 40 242 $89.20 $26.76 $3.26 $166.997 $23.659 $16.700 $41.471 $6.680 $0.946 $0.668 $29.367 $7.083 $121.140 $42.399 $85.824 0.960 $82.394 1
8 114 58 19 38 227 $89.20 $26.76 $3.26 $156.213 $22.131 $15.621 $38.793 $6.249 $0.885 $0.625 $27.471 $7.083 $112.859 $39.501 $80.442 0.954 $76.703 1
9 107 55 18 35 212 $89.20 $26.76 $3.26 $146.125 $20.702 $14.612 $36.288 $5.845 $0.828 $0.584 $25.697 $7.083 $105.114 $36.790 $75.407 0.947 $71.416 1
10 100 51 17 33 198 $89.20 $26.76 $3.26 $136.688 $19.365 $13.669 $33.944 $5.468 $0.775 $0.547 $24.037 $7.083 $97.868 $34.254 $70.698 0.941 $66.502 1
11 94 48 16 31 186 $89.20 $26.76 $3.26 $127.861 $18.114 $12.786 $31.752 $5.114 $0.725 $0.511 $22.485 $7.083 $91.091 $31.882 $66.292 0.934 $61.935 1
12 88 45 15 29 174 $89.20 $26.76 $3.26 $119.604 $16.944 $11.960 $29.702 $4.784 $0.678 $0.478 $21.033 $7.083 $84.751 $29.663 $62.171 0.928 $57.692 1
13 82 42 14 27 162 $89.20 $26.76 $3.26 $111.880 $15.850 $11.188 $27.784 $4.475 $0.634 $0.448 $19.675 $7.083 $78.820 $27.587 $58.316 0.922 $53.748 1
14 77 39 13 25 152 $89.20 $26.76 $3.26 $104.655 $14.827 $10.466 $25.990 $4.186 $0.593 $0.419 $18.404 $7.083 $73.273 $25.645 $54.711 0.915 $50.083 1
15 72 37 12 24 142 $89.20 $26.76 $3.26 $97.897 $13.869 $9.790 $24.311 $3.916 $0.555 $0.392 $17.216 $7.083 $68.083 $23.829 $51.338 0.909 $46.677 1
16 67 34 11 22 133 $89.20 $26.76 $3.26 $91.575 $12.974 $9.157 $22.741 $3.663 $0.519 $0.366 $16.104 $7.083 $63.229 $22.130 $48.182 0.903 $43.511 1
17 65 33 11 21 128 $89.20 $26.76 $3.26 $88.080 $12.478 $8.808 $21.873 $3.523 $0.499 $0.352 $15.489 $7.083 $60.546 $21.191 $46.438 0.897 $41.652 1
18 62 32 11 20 123 $89.20 $26.76 $3.26 $84.719 $12.002 $8.472 $21.039 $3.389 $0.480 $0.339 $14.898 $7.083 $57.965 $20.288 $44.761 0.891 $39.875 1
19 60 30 10 20 118 $89.20 $26.76 $3.26 $81.486 $11.544 $8.149 $20.236 $3.259 $0.462 $0.326 $14.330 $7.083 $55.483 $19.419 $43.147 0.885 $38.178 1
20 57 29 10 19 114 $89.20 $26.76 $3.26 $78.376 $11.104 $7.838 $19.464 $3.135 $0.444 $0.314 $13.783 $7.083 $53.095 $18.583 $41.595 0.879 $36.555 1
21 55 28 9 18 109 $89.20 $26.76 $3.26 $75.386 $10.680 $7.539 $18.721 $3.015 $0.427 $0.302 $13.257 $7.083 $50.799 $17.780 $40.103 0.873 $35.004 1
22 53 27 9 18 105 $89.20 $26.76 $3.26 $72.509 $10.272 $7.251 $18.006 $2.900 $0.411 $0.290 $12.751 $7.083 $48.590 $17.006 $38.667 0.867 $33.522 1
23 51 26 9 17 101 $89.20 $26.76 $3.26 $69.742 $9.880 $6.974 $17.319 $2.790 $0.395 $0.279 $12.264 $7.083 $46.465 $16.263 $37.286 0.861 $32.106 1
24 49 25 8 16 97 $89.20 $26.76 $3.26 $67.080 $9.503 $6.708 $16.658 $2.683 $0.380 $0.268 $11.796 $7.083 $44.422 $15.548 $35.958 0.855 $30.753 1
25 47 24 8 16 94 $89.20 $26.76 $3.26 $64.520 $9.141 $6.452 $16.023 $2.581 $0.366 $0.258 $11.346 $7.083 $42.456 $14.860 $34.680 0.849 $29.459 1
26 45 23 8 15 90 $89.20 $26.76 $3.26 $62.058 $8.792 $6.206 $15.411 $2.482 $0.352 $0.248 $10.913 $7.083 $40.566 $14.198 $33.451 0.844 $28.223 1
27 44 22 7 14 87 $89.20 $26.76 $3.26 $59.690 $8.456 $5.969 $14.823 $2.388 $0.338 $0.239 $10.497 $7.083 $38.748 $13.562 $32.269 0.838 $27.041 1
28 42 21 7 14 83 $89.20 $26.76 $3.26 $57.412 $8.134 $5.741 $14.257 $2.296 $0.325 $0.230 $10.096 $7.083 $36.999 $12.950 $31.132 0.832 $25.912 1
29 40 21 7 13 80 $89.20 $26.76 $3.26 $54.948 $7.785 $5.495 $13.646 $2.198 $0.311 $0.220 $9.663 $7.083 $35.107 $12.287 $29.903 0.827 $24.720 1
30 39 20 7 13 76 $89.20 $26.76 $3.26 $52.590 $7.450 $5.259 $13.060 $2.104 $0.298 $0.210 $9.248 $7.083 $33.296 $11.654 $28.726 0.821 $23.586 1
31 37 19 6 12 73 $89.20 $26.76 $3.26 $50.333 $7.131 $5.033 $12.499 $2.013 $0.285 $0.201 $8.851 $7.083 $31.563 $11.047 $27.599 0.816 $22.507 1
32 35 18 6 12 70 $89.20 $26.76 $3.26 $48.173 $6.825 $4.817 $11.963 $1.927 $0.273 $0.193 $8.471 $7.083 $29.905 $10.467 $26.521 0.810 $21.482 1
33 34 17 6 11 67 $89.20 $26.76 $3.26 $46.105 $6.532 $4.611 $11.450 $1.844 $0.261 $0.184 $8.108 $7.083 $28.317 $9.911 $25.489 0.804 $20.506 1
34 32 16 5 11 64 $89.20 $26.76 $3.26 $44.127 $6.251 $4.413 $10.958 $1.765 $0.250 $0.177 $7.760 $7.083 $26.798 $9.379 $24.502 0.799 $19.578 1
35 31 16 5 10 61 $89.20 $26.76 $3.26 $42.233 $5.983 $4.223 $10.488 $1.689 $0.239 $0.169 $7.427 $7.083 $25.344 $8.870 $23.557 0.794 $18.695 1
36 30 15 5 10 59 $89.20 $26.76 $3.26 $40.420 $5.726 $4.042 $10.038 $1.617 $0.229 $0.162 $7.108 $7.083 $23.952 $8.383 $22.652 0.788 $17.856 1
37 28 14 5 9 56 $89.20 $26.76 $3.26 $38.686 $5.481 $3.869 $9.607 $1.547 $0.219 $0.155 $6.803 $7.083 $22.620 $7.917 $21.786 0.783 $17.057 1
38 27 14 5 9 54 $89.20 $26.76 $3.26 $37.025 $5.245 $3.703 $9.195 $1.481 $0.210 $0.148 $6.511 $7.083 $21.345 $7.471 $20.958 0.778 $16.297 1
39 26 13 4 9 51 $89.20 $26.76 $3.26 $35.436 $5.020 $3.544 $8.800 $1.417 $0.201 $0.142 $6.232 $7.083 $20.125 $7.044 $20.165 0.772 $15.574 1
40 25 13 4 8 49 $89.20 $26.76 $3.26 $33.916 $4.805 $3.392 $8.422 $1.357 $0.192 $0.136 $5.964 $7.083 $18.958 $6.635 $19.406 0.767 $14.886 1
minimum (breakeven) EUR and IP (flow) for the given price: minimum (breakeven) EUR and IP (flow) for the given price:
Full Cycle DUC Full Cycle DUC
Denver Julesburg Basin: Southern Wattenberg My Assumptions:
Basin Characteristics Average Well Denver Julesburg Basin: Southern Wattenberg Denver Julesburg Basin: Southern Wattenberg
Baseline Results (2016 factor prices) Sensitivity Results (2014 factor prices, G2=133%)
Results
Capex ($1,000s) Production (boe/d) Prices Cash Flows ($1,000)
jsmith:
Constant exponential
decline begins at year 4
Page 77
Appendix A: Minimum EUR as function of price, 2014 and 2016 Cost scenarios.
A-26
Greater Monument Butte
100% oilfield service & supply factor price scalar
$1.40 cost/well ($mm) IP EUR 30 days/month
53 EUR/well (mboe) 120 188 -0.68% exponential decline rate after year 3 (monthly)
-55% 1st yr decline -6.4% 54 $100.00 oil price WTI ($/bbl)
-30% 2nd yr decline -2.9% 38 0% oil price appreciation (per month) Price EUR IP EUR IP Price EUR IP EUR IP
-20% 3rd yr decline -1.8% 34 $3.50 gas price Henry Hub ($/mcf) $20 2,075 1,324 1,030 657 $20 0 0
34 IP rate (boe/d) 0% gas price appreciation $25 760 485 377 241 $25 5,200 3,319 2,581 1,647
$10.00 opex-LOE ($/boe) 30% NGL price/oil price (fixed ratio) $30 465 297 231 147 $30 1,220 779 606 387
87% % oil 0.68% discount rate (compound monthly) $35 335 214 167 107 $35 691 441 343 219
9% % gas 8.5% discount rate (annual) $40 262 167 132 84 $40 482 308 239 153
4% % NGL 80% intangible drilling cost / total capex $45 215 137 109 70 $45 370 236 184 117
20.0% royalty rate 0.638 IP/EUR ratio, (B8/B4 = fixed ratio) $50 183 117 93 59 $50 300 191 150 96
8.0% oil prod tax $60 140 89 72 46 $60 218 139 109 70
8.0% gas prod tax $70 114 73 59 38 $70 171 109 86 55
8.0% NGL prod tax -$0.343 = NPV/well ($ million) $80 96 61 50 32 $80 141 90 71 45
35.0% income tax rate 0 = EUR check (mboe) $90 84 54 44 28 $90 120 77 61 39
-20% oil differential 0.16% = ATIRR (monthly) $100 74 47 39 25 $100 105 67 53 34
-20% gas differential 1.98% = ATIRR (annual)
0 1 = DUC 53 = total production (mboe)
25% auxillary cost/well cost $0.579 = "tail end" NPV/well ($ million)
50% completion cost/well cost 97% = "tail end" recovery factor
$2,000 min opex ($/month) 27 = months of lost production
Per Well Net Cash Flow Analysis
mcf/d AT NPV Active
Month Well Cost Aux. Cost Total Oil NGL Gas Gas Prod Oil/bbl NGL/bbl Gas/mcf Oil Rev Gas Rev NGL Rev Royalty Oil Tax Gas Tax NGL Tax Opex Depeciation Tax. Inc. Income Tax NCF PV Factor -$343 1/0
1 $350 $88 $80.00 $24.00 $2.80 $350.000 -$350.00 -$122.500 -315 1.000 -$315.00
2 $350 $88 $80.00 $24.00 $2.80 $350.000 -$350.00 -$122.500 -315 0.993 -$312.87
3 $350 $88 $80.00 $24.00 $2.80 $350.000 -$350.00 -$122.500 -315 0.986 -$310.75
4 $350 $88 $80.00 $24.00 $2.80 $350.000 -$350.00 -$122.500 -315 0.980 -$308.64
5 34 30 1 3 18 $80.00 $24.00 $2.80 $71.081 $1.544 $0.980 $14.72 $4.55 $0.10 $0.06 $10.213 $2.917 $41.045 $14.366 $29.596 0.973 $28.802 1
6 32 28 1 3 17 $80.00 $24.00 $2.80 $66.506 $1.445 $0.917 $13.774 $4.256 $0.092 $0.059 $9.555 $2.917 $38.214 $13.375 $27.756 0.967 $26.828 1
7 30 26 1 3 16 $80.00 $24.00 $2.80 $62.224 $1.352 $0.858 $12.887 $3.982 $0.087 $0.055 $8.940 $2.917 $35.567 $12.448 $26.035 0.960 $24.994 1
8 28 24 1 3 15 $80.00 $24.00 $2.80 $58.218 $1.265 $0.803 $12.057 $3.726 $0.081 $0.051 $8.365 $2.917 $33.089 $11.581 $24.425 0.954 $23.290 1
9 26 23 1 2 14 $80.00 $24.00 $2.80 $54.470 $1.183 $0.751 $11.281 $3.486 $0.076 $0.048 $7.826 $2.917 $30.771 $10.770 $22.918 0.947 $21.705 1
10 24 21 1 2 13 $80.00 $24.00 $2.80 $50.964 $1.107 $0.703 $10.555 $3.262 $0.071 $0.045 $7.322 $2.917 $28.603 $10.011 $21.508 0.941 $20.232 1
11 23 20 1 2 12 $80.00 $24.00 $2.80 $47.683 $1.036 $0.658 $9.875 $3.052 $0.066 $0.042 $6.851 $2.917 $26.573 $9.301 $20.189 0.934 $18.862 1
12 21 19 1 2 12 $80.00 $24.00 $2.80 $44.613 $0.969 $0.615 $9.240 $2.855 $0.062 $0.039 $6.410 $2.917 $24.675 $8.636 $18.955 0.928 $17.590 1
13 20 17 1 2 11 $80.00 $24.00 $2.80 $41.741 $0.907 $0.576 $8.645 $2.671 $0.058 $0.037 $5.997 $2.917 $22.899 $8.015 $17.801 0.922 $16.406 1
14 19 16 1 2 10 $80.00 $24.00 $2.80 $39.054 $0.848 $0.539 $8.088 $2.499 $0.054 $0.034 $5.611 $2.917 $21.237 $7.433 $16.721 0.915 $15.306 1
15 17 15 1 2 9 $80.00 $24.00 $2.80 $36.540 $0.794 $0.504 $7.568 $2.339 $0.051 $0.032 $5.250 $2.917 $19.682 $6.889 $15.710 0.909 $14.284 1
16 16 14 1 1 9 $80.00 $24.00 $2.80 $34.188 $0.743 $0.472 $7.080 $2.188 $0.048 $0.030 $4.912 $2.917 $18.227 $6.379 $14.764 0.903 $13.333 1
17 16 14 1 1 9 $80.00 $24.00 $2.80 $33.201 $0.721 $0.458 $6.876 $2.125 $0.046 $0.029 $4.770 $2.917 $17.617 $6.166 $14.368 0.897 $12.887 1
18 15 13 1 1 8 $80.00 $24.00 $2.80 $32.243 $0.700 $0.445 $6.678 $2.064 $0.045 $0.028 $4.633 $2.917 $17.024 $5.959 $13.982 0.891 $12.456 1
19 15 13 1 1 8 $80.00 $24.00 $2.80 $31.312 $0.680 $0.432 $6.485 $2.004 $0.044 $0.028 $4.499 $2.917 $16.449 $5.757 $13.608 0.885 $12.041 1
20 15 13 1 1 8 $80.00 $24.00 $2.80 $30.409 $0.661 $0.419 $6.298 $1.946 $0.042 $0.027 $4.369 $2.917 $15.890 $5.561 $13.245 0.879 $11.640 1
21 14 12 1 1 8 $80.00 $24.00 $2.80 $29.531 $0.642 $0.407 $6.116 $1.890 $0.041 $0.026 $4.243 $2.917 $15.347 $5.372 $12.892 0.873 $11.253 1
22 14 12 1 1 7 $80.00 $24.00 $2.80 $28.679 $0.623 $0.396 $5.940 $1.835 $0.040 $0.025 $4.121 $2.917 $14.820 $5.187 $12.550 0.867 $10.880 1
23 13 12 1 1 7 $80.00 $24.00 $2.80 $27.851 $0.605 $0.384 $5.768 $1.782 $0.039 $0.025 $4.002 $2.917 $14.308 $5.008 $12.217 0.861 $10.520 1
24 13 11 1 1 7 $80.00 $24.00 $2.80 $27.048 $0.588 $0.373 $5.602 $1.731 $0.038 $0.024 $3.886 $2.917 $13.811 $4.834 $11.894 0.855 $10.172 1
25 13 11 1 1 7 $80.00 $24.00 $2.80 $26.267 $0.571 $0.362 $5.440 $1.681 $0.037 $0.023 $3.774 $2.917 $13.328 $4.665 $11.580 0.849 $9.837 1
26 12 11 0 1 7 $80.00 $24.00 $2.80 $25.509 $0.554 $0.352 $5.283 $1.633 $0.035 $0.023 $3.665 $2.917 $12.860 $4.501 $11.275 0.844 $9.513 1
27 12 10 0 1 6 $80.00 $24.00 $2.80 $24.773 $0.538 $0.342 $5.131 $1.585 $0.034 $0.022 $3.559 $2.917 $12.404 $4.342 $10.980 0.838 $9.201 1
28 12 10 0 1 6 $80.00 $24.00 $2.80 $24.058 $0.523 $0.332 $4.982 $1.540 $0.033 $0.021 $3.457 $2.917 $11.962 $4.187 $10.692 0.832 $8.899 1
29 11 10 0 1 6 $80.00 $24.00 $2.80 $23.616 $0.513 $0.326 $4.891 $1.511 $0.033 $0.021 $3.393 $2.917 $11.689 $4.091 $10.514 0.827 $8.692 1
30 11 10 0 1 6 $80.00 $24.00 $2.80 $23.182 $0.504 $0.320 $4.801 $1.484 $0.032 $0.020 $3.331 $2.917 $11.421 $3.997 $10.340 0.821 $8.490 1
31 11 9 0 1 6 $80.00 $24.00 $2.80 $22.757 $0.494 $0.314 $4.713 $1.456 $0.032 $0.020 $3.270 $2.917 $11.157 $3.905 $10.169 0.816 $8.293 1
32 11 9 0 1 6 $80.00 $24.00 $2.80 $22.339 $0.485 $0.308 $4.626 $1.430 $0.031 $0.020 $3.210 $2.917 $10.899 $3.815 $10.001 0.810 $8.101 1
33 11 9 0 1 6 $80.00 $24.00 $2.80 $21.928 $0.476 $0.302 $4.541 $1.403 $0.030 $0.019 $3.151 $2.917 $10.645 $3.726 $9.836 0.804 $7.913 1
34 10 9 0 1 6 $80.00 $24.00 $2.80 $21.525 $0.468 $0.297 $4.458 $1.378 $0.030 $0.019 $3.093 $2.917 $10.396 $3.639 $9.674 0.799 $7.730 1
35 10 9 0 1 5 $80.00 $24.00 $2.80 $21.130 $0.459 $0.291 $4.376 $1.352 $0.029 $0.019 $3.036 $2.917 $10.152 $3.553 $9.515 0.794 $7.551 1
36 10 9 0 1 5 $80.00 $24.00 $2.80 $20.742 $0.451 $0.286 $4.296 $1.327 $0.029 $0.018 $2.980 $2.917 $9.912 $3.469 $9.359 0.788 $7.377 1
37 10 8 0 1 5 $80.00 $24.00 $2.80 $20.361 $0.442 $0.281 $4.217 $1.303 $0.028 $0.018 $2.925 $2.917 $9.676 $3.387 $9.206 0.783 $7.207 1
38 10 8 0 1 5 $80.00 $24.00 $2.80 $19.987 $0.434 $0.276 $4.139 $1.279 $0.028 $0.018 $2.872 $2.917 $9.445 $3.306 $9.056 0.778 $7.042 1
39 9 8 0 1 5 $80.00 $24.00 $2.80 $19.620 $0.426 $0.271 $4.063 $1.256 $0.027 $0.017 $2.819 $2.917 $9.218 $3.226 $8.908 0.772 $6.880 1
40 9 8 0 1 5 $80.00 $24.00 $2.80 $19.260 $0.418 $0.266 $3.989 $1.233 $0.027 $0.017 $2.767 $2.917 $8.995 $3.148 $8.763 0.767 $6.722 1
minimum (breakeven) EUR and IP (flow) for the given price: minimum (breakeven) EUR and IP (flow) for the given price:
Full Cycle DUC Full Cycle DUC
Uinta Basin: Greater Monument Butte/Uinta My Assumptions:
Basin Characteristics Average Well Uinta Basin: Greater Monument Butte/Uinta Uinta Basin: Greater Monument Butte/Uinta
Baseline Results (2016 factor prices) Sensitivity Results (2014 factor prices, G2=133%)
Results
Capex ($1,000s) Production (boe/d) Prices Cash Flows ($1,000)
jsmith:
Constant exponential
decline begins at year 4
Page 78
Appendix A: Minimum EUR as function of price, 2014 and 2016 Cost scenarios.
A-27
Wasatch SXL
100% oilfield service & supply factor price scalar
$14.00 cost/well ($mm) IP EUR 30 days/month
433 EUR/well (mboe) 1,444 1,000 -1.64% exponential decline rate after year 3 (monthly)
-68% 1st yr decline -9.0% 467 $100.00 oil price WTI ($/bbl)
-36% 2nd yr decline -3.6% 300 0% oil price appreciation (per month) Price EUR IP EUR IP Price EUR IP EUR IP
-28% 3rd yr decline -2.7% 255 $3.50 gas price Henry Hub ($/mcf) $20 6,114 8,829 3,036 4,384 $20 24,862 35,901 12,341 17,820
626 IP rate (boe/d) 0% gas price appreciation $25 3,913 5,650 1,943 2,806 $25 9,138 13,195 4,536 6,550
$8.00 opex-LOE ($/boe) 30% NGL price/oil price (fixed ratio) $30 2,877 4,154 1,429 2,063 $30 5,598 8,084 2,779 4,013
75% % oil 0.68% discount rate (compound monthly) $35 2,275 3,285 1,130 1,632 $35 4,035 5,827 2,003 2,892
25% % gas 8.5% discount rate (annual) $40 1,881 2,716 935 1,350 $40 3,154 4,554 1,566 2,261
0% % NGL 80% intangible drilling cost / total capex $45 1,604 2,316 797 1,151 $45 2,589 3,739 1,286 1,857
20.0% royalty rate 1.444 IP/EUR ratio, (B8/B4 = fixed ratio) $50 1,398 2,019 695 1,004 $50 2,196 3,171 1,091 1,575
8.0% oil prod tax $60 1,112 1,606 553 799 $60 1,684 2,432 837 1,209
8.0% gas prod tax $70 923 1,333 459 663 $70 1,366 1,973 679 980
8.0% NGL prod tax -$3.409 = NPV/well ($ million) $80 789 1,139 393 567 $80 1,149 1,659 571 825
35.0% income tax rate 0 = EUR check (mboe) $90 689 995 343 495 $90 991 1,431 493 712
-20% oil differential -0.07% = ATIRR (monthly) $100 612 884 304 439 $100 872 1,259 433 625
-20% gas differential -0.85% = ATIRR (annual)
0 1 = DUC 433 = total production (mboe)
25% auxillary cost/well cost $4.003 = "tail end" NPV/well ($ million)
50% completion cost/well cost 99% = "tail end" recovery factor
$2,000 min opex ($/month) 60 = months of lost production
Per Well Net Cash Flow Analysis
mcf/d AT NPV Active
Month Well Cost Aux. Cost Total Oil NGL Gas Gas Prod Oil/bbl NGL/bbl Gas/mcf Oil Rev Gas Rev NGL Rev Royalty Oil Tax Gas Tax NGL Tax Opex Depeciation Tax. Inc. Income Tax NCF PV Factor -$3,409 1/0
1 $3,500 $875 $80.00 $24.00 $2.80 $3,500.000 -$3,500.00 -1225 -3,150 1.000 -$3,150.00
2 $3,500 $875 $80.00 $24.00 $2.80 $3,500.000 -$3,500.00 -$1,225.000 -3,150 0.993 -$3,128.66
3 $3,500 $875 $80.00 $24.00 $2.80 $3,500.000 -$3,500.00 -$1,225.000 -3,150 0.986 -$3,107.46
4 $3,500 $875 $80.00 $24.00 $2.80 $3,500.000 -$3,500.00 -$1,225.000 -3,150 0.980 -$3,086.41
5 626 469 0 156 939 $80.00 $24.00 $2.80 $1,126.229 $78.836 $0.000 $241.01 $72.08 $5.05 $0.00 $150.164 $29.167 $707.598 $247.659 $489.105 0.973 $475.984 1
6 570 427 0 142 854 $80.00 $24.00 $2.80 $1,025.115 $71.758 $0.000 $219.375 $65.607 $4.593 $0.000 $136.682 $29.167 $641.450 $224.508 $446.109 0.967 $431.200 1
7 518 389 0 130 778 $80.00 $24.00 $2.80 $933.079 $65.316 $0.000 $199.679 $59.717 $4.180 $0.000 $124.411 $29.167 $581.241 $203.434 $406.973 0.960 $390.707 1
8 472 354 0 118 708 $80.00 $24.00 $2.80 $849.306 $59.451 $0.000 $181.752 $54.356 $3.805 $0.000 $113.241 $29.167 $526.438 $184.253 $371.351 0.954 $354.093 1
9 429 322 0 107 644 $80.00 $24.00 $2.80 $773.054 $54.114 $0.000 $165.434 $49.475 $3.463 $0.000 $103.074 $29.167 $476.555 $166.794 $338.928 0.947 $320.987 1
10 391 293 0 98 586 $80.00 $24.00 $2.80 $703.649 $49.255 $0.000 $150.581 $45.034 $3.152 $0.000 $93.820 $29.167 $431.151 $150.903 $309.415 0.941 $291.051 1
11 356 267 0 89 534 $80.00 $24.00 $2.80 $640.474 $44.833 $0.000 $137.061 $40.990 $2.869 $0.000 $85.397 $29.167 $389.823 $136.438 $282.552 0.934 $263.981 1
12 324 243 0 81 486 $80.00 $24.00 $2.80 $582.972 $40.808 $0.000 $124.756 $37.310 $2.612 $0.000 $77.730 $29.167 $352.206 $123.272 $258.100 0.928 $239.503 1
13 295 221 0 74 442 $80.00 $24.00 $2.80 $530.632 $37.144 $0.000 $113.555 $33.960 $2.377 $0.000 $70.751 $29.167 $317.966 $111.288 $235.844 0.922 $217.368 1
14 268 201 0 67 402 $80.00 $24.00 $2.80 $482.991 $33.809 $0.000 $103.360 $30.911 $2.164 $0.000 $64.399 $29.167 $286.800 $100.380 $215.586 0.915 $197.351 1
15 244 183 0 61 366 $80.00 $24.00 $2.80 $439.628 $30.774 $0.000 $94.080 $28.136 $1.970 $0.000 $58.617 $29.167 $258.432 $90.451 $197.147 0.909 $179.249 1
16 222 167 0 56 333 $80.00 $24.00 $2.80 $400.157 $28.011 $0.000 $85.634 $25.610 $1.793 $0.000 $53.354 $29.167 $232.611 $81.414 $180.364 0.903 $162.878 1
17 214 161 0 54 321 $80.00 $24.00 $2.80 $385.669 $26.997 $0.000 $82.533 $24.683 $1.728 $0.000 $51.422 $29.167 $223.133 $78.096 $174.203 0.897 $156.248 1
18 207 155 0 52 310 $80.00 $24.00 $2.80 $371.705 $26.019 $0.000 $79.545 $23.789 $1.665 $0.000 $49.561 $29.167 $213.998 $74.899 $168.265 0.891 $149.900 1
19 199 149 0 50 299 $80.00 $24.00 $2.80 $358.246 $25.077 $0.000 $76.665 $22.928 $1.605 $0.000 $47.766 $29.167 $205.193 $71.818 $162.542 0.885 $143.821 1
20 192 144 0 48 288 $80.00 $24.00 $2.80 $345.275 $24.169 $0.000 $73.889 $22.098 $1.547 $0.000 $46.037 $29.167 $196.708 $68.848 $157.027 0.879 $137.999 1
21 185 139 0 46 277 $80.00 $24.00 $2.80 $332.774 $23.294 $0.000 $71.214 $21.298 $1.491 $0.000 $44.370 $29.167 $188.530 $65.985 $151.711 0.873 $132.424 1
22 178 134 0 45 267 $80.00 $24.00 $2.80 $320.725 $22.451 $0.000 $68.635 $20.526 $1.437 $0.000 $42.763 $29.167 $180.647 $63.227 $146.587 0.867 $127.085 1
23 172 129 0 43 258 $80.00 $24.00 $2.80 $309.113 $21.638 $0.000 $66.150 $19.783 $1.385 $0.000 $41.215 $29.167 $173.051 $60.568 $141.650 0.861 $121.972 1
24 166 124 0 41 248 $80.00 $24.00 $2.80 $297.920 $20.854 $0.000 $63.755 $19.067 $1.335 $0.000 $39.723 $29.167 $165.729 $58.005 $136.890 0.855 $117.076 1
25 160 120 0 40 239 $80.00 $24.00 $2.80 $287.134 $20.099 $0.000 $61.447 $18.377 $1.286 $0.000 $38.284 $29.167 $158.672 $55.535 $132.304 0.849 $112.386 1
26 154 115 0 38 231 $80.00 $24.00 $2.80 $276.737 $19.372 $0.000 $59.222 $17.711 $1.240 $0.000 $36.898 $29.167 $151.871 $53.155 $127.883 0.844 $107.895 1
27 148 111 0 37 222 $80.00 $24.00 $2.80 $266.717 $18.670 $0.000 $57.078 $17.070 $1.195 $0.000 $35.562 $29.167 $145.316 $50.861 $123.622 0.838 $103.593 1
28 143 107 0 36 214 $80.00 $24.00 $2.80 $257.060 $17.994 $0.000 $55.011 $16.452 $1.152 $0.000 $34.275 $29.167 $138.999 $48.650 $119.516 0.832 $99.474 1
29 139 104 0 35 208 $80.00 $24.00 $2.80 $250.191 $17.513 $0.000 $53.541 $16.012 $1.121 $0.000 $33.359 $29.167 $134.505 $47.077 $116.595 0.827 $96.385 1
30 135 101 0 34 203 $80.00 $24.00 $2.80 $243.505 $17.045 $0.000 $52.110 $15.584 $1.091 $0.000 $32.467 $29.167 $130.131 $45.546 $113.752 0.821 $93.398 1
31 132 99 0 33 197 $80.00 $24.00 $2.80 $236.998 $16.590 $0.000 $50.718 $15.168 $1.062 $0.000 $31.600 $29.167 $125.874 $44.056 $110.985 0.816 $90.509 1
32 128 96 0 32 192 $80.00 $24.00 $2.80 $230.665 $16.147 $0.000 $49.362 $14.763 $1.033 $0.000 $30.755 $29.167 $121.731 $42.606 $108.292 0.810 $87.714 1
33 125 94 0 31 187 $80.00 $24.00 $2.80 $224.501 $15.715 $0.000 $48.043 $14.368 $1.006 $0.000 $29.933 $29.167 $117.699 $41.195 $105.671 0.804 $85.011 1
34 121 91 0 30 182 $80.00 $24.00 $2.80 $218.501 $15.295 $0.000 $46.759 $13.984 $0.979 $0.000 $29.134 $29.167 $113.774 $39.821 $103.120 0.799 $82.397 1
35 118 89 0 30 177 $80.00 $24.00 $2.80 $212.662 $14.886 $0.000 $45.510 $13.610 $0.953 $0.000 $28.355 $29.167 $109.954 $38.484 $100.637 0.794 $79.868 1
36 115 86 0 29 172 $80.00 $24.00 $2.80 $206.979 $14.489 $0.000 $44.294 $13.247 $0.927 $0.000 $27.597 $29.167 $106.236 $37.183 $98.220 0.788 $77.422 1
37 112 84 0 28 168 $80.00 $24.00 $2.80 $201.448 $14.101 $0.000 $43.110 $12.893 $0.902 $0.000 $26.860 $29.167 $102.618 $35.916 $95.868 0.783 $75.056 1
38 109 82 0 27 163 $80.00 $24.00 $2.80 $196.065 $13.725 $0.000 $41.958 $12.548 $0.878 $0.000 $26.142 $29.167 $99.096 $34.684 $93.579 0.778 $72.768 1
39 106 80 0 27 159 $80.00 $24.00 $2.80 $190.826 $13.358 $0.000 $40.837 $12.213 $0.855 $0.000 $25.443 $29.167 $95.669 $33.484 $91.351 0.772 $70.554 1
40 103 77 0 26 155 $80.00 $24.00 $2.80 $185.726 $13.001 $0.000 $39.745 $11.886 $0.832 $0.000 $24.763 $29.167 $92.333 $32.317 $89.183 0.767 $68.413 1
minimum (breakeven) EUR and IP (flow) for the given price: minimum (breakeven) EUR and IP (flow) for the given price:
Full Cycle DUC Full Cycle DUC
Uinta Basin: Wasatch SXL My Assumptions:
Basin Characteristics Average Well Uinta Basin: Wasatch SXL Uinta Basin: Wasatch SXL
Baseline Results (2016 factor prices) Sensitivity Results (2014 factor prices, G2=133%)
Results
Capex ($1,000s) Production (boe/d) Prices Cash Flows ($1,000)
jsmith:
Constant exponential
decline begins at year 4
Page 79
Appendix A: Minimum EUR as function of price, 2014 and 2016 Cost scenarios.
A-28
Uteland Butte SXL
100% oilfield service & supply factor price scalar
$11.00 cost/well ($mm) IP EUR 30 days/month
410 EUR/well (mboe) 1,290 700 -3.13% exponential decline rate after year 3 (monthly)
-55% 1st yr decline -6.4% 580 $100.00 oil price WTI ($/bbl)
-48% 2nd yr decline -5.3% 300 0% oil price appreciation (per month) Price EUR IP EUR IP Price EUR IP EUR IP
-55% 3rd yr decline -6.5% 201 $3.50 gas price Henry Hub ($/mcf) $20 0 0 $20 0 0
755 IP rate (boe/d) 0% gas price appreciation $25 0 0 $25 0 0
$15.43 opex-LOE ($/boe) 30% NGL price/oil price (fixed ratio) $30 18,221 33,579 9,045 16,669 $30 0 0
75% % oil 0.68% discount rate (compound monthly) $35 5,315 9,795 2,639 4,863 $35 0 0
25% % gas 8.5% discount rate (annual) $40 3,112 5,735 1,545 2,847 $40 94,438 174,036 46,876 86,386
0% % NGL 80% intangible drilling cost / total capex $45 2,200 4,054 1,093 2,014 $45 9,025 16,632 4,480 8,256
20.0% royalty rate 1.843 IP/EUR ratio, (B8/B4 = fixed ratio) $50 1,701 3,135 845 1,557 $50 4,739 8,733 2,353 4,336
8.0% oil prod tax $60 1,171 2,158 582 1,073 $60 2,431 4,480 1,207 2,224
8.0% gas prod tax $70 893 1,646 444 818 $70 1,635 3,013 812 1,496
8.0% NGL prod tax -$1.962 = NPV/well ($ million) $80 721 1,329 359 662 $80 1,232 2,270 612 1,128
35.0% income tax rate 0 = EUR check (mboe) $90 605 1,115 301 555 $90 988 1,821 491 905
-20% oil differential -0.19% = ATIRR (monthly) $100 521 960 259 477 $100 825 1,520 410 756
-20% gas differential -2.20% = ATIRR (annual)
0 1 = DUC 410 = total production (mboe)
25% auxillary cost/well cost $1.835 = "tail end" NPV/well ($ million)
50% completion cost/well cost 98% = "tail end" recovery factor
$2,000 min opex ($/month) 192 = months of lost production
Per Well Net Cash Flow Analysis
mcf/d AT NPV Active
Month Well Cost Aux. Cost Total Oil NGL Gas Gas Prod Oil/bbl NGL/bbl Gas/mcf Oil Rev Gas Rev NGL Rev Royalty Oil Tax Gas Tax NGL Tax Opex Depeciation Tax. Inc. Income Tax NCF PV Factor -$1,962 1/0
1 $2,750 $688 $80.00 $24.00 $2.80 $2,750.000 -$2,750.00 -$962.500 -2,475 1.000 -$2,475.00
2 $2,750 $688 $80.00 $24.00 $2.80 $2,750.000 -$2,750.00 -$962.500 -2,475 0.993 -$2,458.23
3 $2,750 $688 $80.00 $24.00 $2.80 $2,750.000 -$2,750.00 -$962.500 -2,475 0.986 -$2,441.58
4 $2,750 $688 $80.00 $24.00 $2.80 $2,750.000 -$2,750.00 -$962.500 -2,475 0.980 -$2,425.03
5 755 566 0 189 1,133 $80.00 $24.00 $2.80 $1,359.384 $95.157 $0.000 $290.91 $87.00 $6.09 $0.00 $349.588 $22.917 $698.037 $244.313 $476.641 0.973 $463.854 1
6 707 530 0 177 1,060 $80.00 $24.00 $2.80 $1,271.780 $89.025 $0.000 $272.161 $81.394 $5.698 $0.000 $327.059 $22.917 $651.576 $228.052 $446.441 0.967 $431.521 1
7 661 496 0 165 992 $80.00 $24.00 $2.80 $1,189.822 $83.288 $0.000 $254.622 $76.149 $5.330 $0.000 $305.982 $22.917 $608.109 $212.838 $418.188 0.960 $401.473 1
8 618 464 0 155 928 $80.00 $24.00 $2.80 $1,113.145 $77.920 $0.000 $238.213 $71.241 $4.987 $0.000 $286.264 $22.917 $567.443 $198.605 $391.755 0.954 $373.549 1
9 579 434 0 145 868 $80.00 $24.00 $2.80 $1,041.409 $72.899 $0.000 $222.862 $66.650 $4.666 $0.000 $267.816 $22.917 $529.398 $185.289 $367.026 0.947 $347.597 1
10 541 406 0 135 812 $80.00 $24.00 $2.80 $974.297 $68.201 $0.000 $208.500 $62.355 $4.365 $0.000 $250.557 $22.917 $493.805 $172.832 $343.890 0.941 $323.480 1
11 506 380 0 127 760 $80.00 $24.00 $2.80 $911.510 $63.806 $0.000 $195.063 $58.337 $4.084 $0.000 $234.410 $22.917 $460.505 $161.177 $322.245 0.934 $301.066 1
12 474 355 0 118 711 $80.00 $24.00 $2.80 $852.768 $59.694 $0.000 $182.492 $54.577 $3.820 $0.000 $219.304 $22.917 $429.352 $150.273 $301.995 0.928 $280.235 1
13 443 332 0 111 665 $80.00 $24.00 $2.80 $797.813 $55.847 $0.000 $170.732 $51.060 $3.574 $0.000 $205.171 $22.917 $400.206 $140.072 $283.051 0.922 $260.876 1
14 415 311 0 104 622 $80.00 $24.00 $2.80 $746.399 $52.248 $0.000 $159.729 $47.770 $3.344 $0.000 $191.949 $22.917 $372.938 $130.528 $265.327 0.915 $242.884 1
15 388 291 0 97 582 $80.00 $24.00 $2.80 $698.298 $48.881 $0.000 $149.436 $44.691 $3.128 $0.000 $179.579 $22.917 $347.428 $121.600 $248.745 0.909 $226.162 1
16 363 272 0 91 544 $80.00 $24.00 $2.80 $653.297 $45.731 $0.000 $139.806 $41.811 $2.927 $0.000 $168.006 $22.917 $323.561 $113.247 $233.232 0.903 $210.620 1
17 344 258 0 86 515 $80.00 $24.00 $2.80 $618.375 $43.286 $0.000 $132.332 $39.576 $2.770 $0.000 $159.025 $22.917 $305.040 $106.764 $221.193 0.897 $198.395 1
18 325 244 0 81 488 $80.00 $24.00 $2.80 $585.319 $40.972 $0.000 $125.258 $37.460 $2.622 $0.000 $150.525 $22.917 $287.509 $100.628 $209.798 0.891 $186.900 1
19 308 231 0 77 462 $80.00 $24.00 $2.80 $554.031 $38.782 $0.000 $118.563 $35.458 $2.482 $0.000 $142.478 $22.917 $270.915 $94.820 $199.012 0.885 $176.090 1
20 291 219 0 73 437 $80.00 $24.00 $2.80 $524.415 $36.709 $0.000 $112.225 $33.563 $2.349 $0.000 $134.862 $22.917 $255.208 $89.323 $188.802 0.879 $165.924 1
21 276 207 0 69 414 $80.00 $24.00 $2.80 $496.382 $34.747 $0.000 $106.226 $31.768 $2.224 $0.000 $127.653 $22.917 $240.341 $84.119 $179.138 0.873 $156.365 1
22 261 196 0 65 392 $80.00 $24.00 $2.80 $469.848 $32.889 $0.000 $100.547 $30.070 $2.105 $0.000 $120.829 $22.917 $226.269 $79.194 $169.991 0.867 $147.375 1
23 247 185 0 62 371 $80.00 $24.00 $2.80 $444.732 $31.131 $0.000 $95.173 $28.463 $1.992 $0.000 $114.370 $22.917 $212.948 $74.532 $161.333 0.861 $138.921 1
24 234 175 0 58 351 $80.00 $24.00 $2.80 $420.959 $29.467 $0.000 $90.085 $26.941 $1.886 $0.000 $108.257 $22.917 $200.340 $70.119 $153.138 0.855 $130.971 1
25 221 166 0 55 332 $80.00 $24.00 $2.80 $398.456 $27.892 $0.000 $85.270 $25.501 $1.785 $0.000 $102.470 $22.917 $188.406 $65.942 $145.380 0.849 $123.494 1
26 210 157 0 52 314 $80.00 $24.00 $2.80 $377.156 $26.401 $0.000 $80.711 $24.138 $1.690 $0.000 $96.992 $22.917 $177.110 $61.988 $138.038 0.844 $116.463 1
27 198 149 0 50 297 $80.00 $24.00 $2.80 $356.995 $24.990 $0.000 $76.397 $22.848 $1.599 $0.000 $91.807 $22.917 $166.417 $58.246 $131.088 0.838 $109.849 1
28 188 141 0 47 282 $80.00 $24.00 $2.80 $337.912 $23.654 $0.000 $72.313 $21.626 $1.514 $0.000 $86.900 $22.917 $156.296 $54.704 $124.509 0.832 $103.630 1
29 176 132 0 44 263 $80.00 $24.00 $2.80 $316.094 $22.127 $0.000 $67.644 $20.230 $1.416 $0.000 $81.289 $22.917 $144.725 $50.654 $116.988 0.827 $96.710 1
30 164 123 0 41 246 $80.00 $24.00 $2.80 $295.685 $20.698 $0.000 $63.277 $18.924 $1.325 $0.000 $76.040 $22.917 $133.901 $46.865 $109.952 0.821 $90.278 1
31 154 115 0 38 230 $80.00 $24.00 $2.80 $276.593 $19.362 $0.000 $59.191 $17.702 $1.239 $0.000 $71.131 $22.917 $123.775 $43.321 $103.371 0.816 $84.299 1
32 144 108 0 36 216 $80.00 $24.00 $2.80 $258.734 $18.111 $0.000 $55.369 $16.559 $1.159 $0.000 $66.538 $22.917 $114.304 $40.006 $97.214 0.810 $78.741 1
33 134 101 0 34 202 $80.00 $24.00 $2.80 $242.028 $16.942 $0.000 $51.794 $15.490 $1.084 $0.000 $62.242 $22.917 $105.444 $36.905 $91.455 0.804 $73.575 1
34 126 94 0 31 189 $80.00 $24.00 $2.80 $226.401 $15.848 $0.000 $48.450 $14.490 $1.014 $0.000 $58.223 $22.917 $97.156 $34.005 $86.068 0.799 $68.772 1
35 118 88 0 29 176 $80.00 $24.00 $2.80 $211.783 $14.825 $0.000 $45.322 $13.554 $0.949 $0.000 $54.464 $22.917 $89.403 $31.291 $81.029 0.794 $64.306 1
36 110 83 0 28 165 $80.00 $24.00 $2.80 $198.109 $13.868 $0.000 $42.395 $12.679 $0.888 $0.000 $50.947 $22.917 $82.151 $28.753 $76.315 0.788 $60.155 1
37 103 77 0 26 154 $80.00 $24.00 $2.80 $185.317 $12.972 $0.000 $39.658 $11.860 $0.830 $0.000 $47.657 $22.917 $75.367 $26.378 $71.905 0.783 $56.295 1
38 96 72 0 24 144 $80.00 $24.00 $2.80 $173.352 $12.135 $0.000 $37.097 $11.095 $0.777 $0.000 $44.580 $22.917 $69.021 $24.157 $67.780 0.778 $52.706 1
39 90 68 0 23 135 $80.00 $24.00 $2.80 $162.159 $11.351 $0.000 $34.702 $10.378 $0.726 $0.000 $41.702 $22.917 $63.085 $22.080 $63.922 0.772 $49.369 1
40 84 63 0 21 126 $80.00 $24.00 $2.80 $151.689 $10.618 $0.000 $32.461 $9.708 $0.680 $0.000 $39.009 $22.917 $57.532 $20.136 $60.312 0.767 $46.266 1
minimum (breakeven) EUR and IP (flow) for the given price: minimum (breakeven) EUR and IP (flow) for the given price:
Full Cycle DUC Full Cycle DUC
Uteland Butte SXL My Assumptions:
Basin Characteristics Average Well Uteland Butte SXL Uteland Butte SXL
Baseline Results (2016 factor prices) Sensitivity Results (2014 factor prices, G2=133%)
Results
Capex ($1,000s) Production (boe/d) Prices Cash Flows ($1,000)
jsmith:
Constant exponential
decline begins at year 4
Page 80
Appendix A: Minimum EUR as function of price, 2014 and 2016 Cost scenarios.
A-29
SW PA Wet Gas
100% oilfield service & supply factor price scalar
$5.90 cost/well ($mm) IP EUR 30 days/month
878 EUR/well (mboe) 2,485 2,933 -0.70% exponential decline rate after year 3 (monthly)
-63% 1st yr decline -8.0% 917 $100.00 oil price WTI ($/bbl)
-27% 2nd yr decline -2.6% 667 0% oil price appreciation (per month) Price EUR IP EUR IP Price EUR IP EUR IP
-34% 3rd yr decline -3.4% 542 $3.50 gas price Henry Hub ($/mcf) $20 5,642 4,780 2,800 2,372 $20 0 0
744 IP rate (boe/d) 0% gas price appreciation $25 4,451 3,771 2,209 1,872 $25 33,191 28,121 16,475 13,959
$7.00 opex-LOE ($/boe) 30% NGL price/oil price (fixed ratio) $30 3,675 3,114 1,824 1,545 $30 15,197 12,876 7,543 6,391
2% % oil 0.68% discount rate (compound monthly) $35 3,129 2,651 1,553 1,316 $35 9,855 8,350 4,891 4,144
49% % gas 8.5% discount rate (annual) $40 2,725 2,309 1,352 1,145 $40 7,291 6,177 3,619 3,066
50% % NGL 80% intangible drilling cost / total capex $45 2,413 2,044 1,198 1,015 $45 5,786 4,902 2,872 2,433
20.0% royalty rate 0.847 IP/EUR ratio, (B8/B4 = fixed ratio) $50 2,165 1,834 1,075 911 $50 4,796 4,063 2,381 2,017
3.0% oil prod tax $60 1,796 1,522 891 755 $60 3,573 3,027 1,774 1,503
3.0% gas prod tax $70 1,534 1,300 762 646 $70 2,847 2,412 1,413 1,197
3.0% NGL prod tax -$0.873 = NPV/well ($ million) $80 1,339 1,134 665 563 $80 2,367 2,005 1,175 996
35.0% income tax rate 0 = EUR check (mboe) $90 1,188 1,007 590 500 $90 2,025 1,716 1,005 851
-10% oil differential 0.38% = ATIRR (monthly) $100 1,068 905 530 449 $100 1,769 1,499 878 744
-14% gas differential 4.71% = ATIRR (annual)
0 1 = DUC 878 = total production (mboe)
25% auxillary cost/well cost $2.623 = "tail end" NPV/well ($ million)
50% completion cost/well cost 100% = "tail end" recovery factor
$2,000 min opex ($/month) 0 = months of lost production
Per Well Net Cash Flow Analysis
mcf/d AT NPV Active
Month Well Cost Aux. Cost Total Oil NGL Gas Gas Prod Oil/bbl NGL/bbl Gas/mcf Oil Rev Gas Rev NGL Rev Royalty Oil Tax Gas Tax NGL Tax Opex Depeciation Tax. Inc. Income Tax NCF PV Factor -$873 1/0
1 $1,475 $369 $90.00 $27.00 $3.00 $1,475.000 -$1,475.00 -$516.250 -1,328 1.000 -$1,327.50
2 $1,475 $369 $90.00 $27.00 $3.00 $1,475.000 -$1,475.00 -$516.250 -1,328 0.993 -$1,318.51
3 $1,475 $369 $90.00 $27.00 $3.00 $1,475.000 -$1,475.00 -$516.250 -1,328 0.986 -$1,309.57
4 $1,475 $369 $90.00 $27.00 $3.00 $1,475.000 -$1,475.00 -$516.250 -1,328 0.980 -$1,300.70
5 744 15 372 365 2,187 $90.00 $27.00 $3.00 $40.178 $196.837 $301.331 $107.67 $0.96 $4.72 $7.23 $156.246 $12.292 $249.219 $87.227 $174.284 0.973 $169.608 1
6 685 14 342 336 2,013 $90.00 $27.00 $3.00 $36.975 $181.145 $277.309 $99.086 $0.887 $4.347 $6.655 $143.790 $12.292 $228.371 $79.930 $160.733 0.967 $155.361 1
7 630 13 315 309 1,853 $90.00 $27.00 $3.00 $34.027 $166.705 $255.203 $91.187 $0.817 $4.001 $6.125 $132.327 $12.292 $209.186 $73.215 $148.263 0.960 $142.337 1
8 580 12 290 284 1,705 $90.00 $27.00 $3.00 $31.314 $153.415 $234.858 $83.917 $0.752 $3.682 $5.637 $121.778 $12.292 $191.530 $67.035 $136.786 0.954 $130.429 1
9 534 11 267 261 1,569 $90.00 $27.00 $3.00 $28.818 $141.185 $216.135 $77.228 $0.692 $3.388 $5.187 $112.070 $12.292 $175.281 $61.348 $126.225 0.947 $119.543 1
10 491 10 246 241 1,444 $90.00 $27.00 $3.00 $26.521 $129.930 $198.905 $71.071 $0.636 $3.118 $4.774 $103.136 $12.292 $160.328 $56.115 $116.505 0.941 $109.590 1
11 452 9 226 221 1,329 $90.00 $27.00 $3.00 $24.406 $119.572 $183.048 $65.405 $0.586 $2.870 $4.393 $94.914 $12.292 $146.567 $51.298 $107.560 0.934 $100.491 1
12 416 8 208 204 1,223 $90.00 $27.00 $3.00 $22.461 $110.039 $168.456 $60.191 $0.539 $2.641 $4.043 $87.347 $12.292 $133.903 $46.866 $99.329 0.928 $92.171 1
13 383 8 191 188 1,125 $90.00 $27.00 $3.00 $20.670 $101.267 $155.027 $55.393 $0.496 $2.430 $3.721 $80.384 $12.292 $122.248 $42.787 $91.753 0.922 $84.565 1
14 352 7 176 173 1,036 $90.00 $27.00 $3.00 $19.022 $93.194 $142.668 $50.977 $0.457 $2.237 $3.424 $73.976 $12.292 $111.523 $39.033 $84.782 0.915 $77.610 1
15 324 6 162 159 953 $90.00 $27.00 $3.00 $17.506 $85.765 $131.295 $46.913 $0.420 $2.058 $3.151 $68.079 $12.292 $101.652 $35.578 $78.366 0.909 $71.251 1
16 298 6 149 146 877 $90.00 $27.00 $3.00 $16.110 $78.928 $120.828 $43.173 $0.387 $1.894 $2.900 $62.651 $12.292 $92.569 $32.399 $72.461 0.903 $65.436 1
17 291 6 145 142 854 $90.00 $27.00 $3.00 $15.689 $76.862 $117.665 $42.043 $0.377 $1.845 $2.824 $61.011 $12.292 $89.824 $31.438 $70.677 0.897 $63.393 1
18 283 6 141 139 832 $90.00 $27.00 $3.00 $15.278 $74.850 $114.585 $40.942 $0.367 $1.796 $2.750 $59.414 $12.292 $87.151 $30.503 $68.940 0.891 $61.415 1
19 276 6 138 135 810 $90.00 $27.00 $3.00 $14.878 $72.890 $111.585 $39.871 $0.357 $1.749 $2.678 $57.859 $12.292 $84.548 $29.592 $67.248 0.885 $59.502 1
20 268 5 134 131 789 $90.00 $27.00 $3.00 $14.489 $70.982 $108.664 $38.827 $0.348 $1.704 $2.608 $56.344 $12.292 $82.012 $28.704 $65.600 0.879 $57.651 1
21 261 5 131 128 768 $90.00 $27.00 $3.00 $14.109 $69.124 $105.819 $37.811 $0.339 $1.659 $2.540 $54.869 $12.292 $79.544 $27.840 $63.995 0.873 $55.860 1
22 254 5 127 125 748 $90.00 $27.00 $3.00 $13.740 $67.314 $103.049 $36.821 $0.330 $1.616 $2.473 $53.433 $12.292 $77.140 $26.999 $62.433 0.867 $54.126 1
23 248 5 124 121 728 $90.00 $27.00 $3.00 $13.380 $65.552 $100.352 $35.857 $0.321 $1.573 $2.408 $52.034 $12.292 $74.799 $26.180 $60.911 0.861 $52.449 1
24 241 5 121 118 709 $90.00 $27.00 $3.00 $13.030 $63.836 $97.725 $34.918 $0.313 $1.532 $2.345 $50.672 $12.292 $72.519 $25.382 $59.429 0.855 $50.827 1
25 235 5 117 115 691 $90.00 $27.00 $3.00 $12.689 $62.165 $95.167 $34.004 $0.305 $1.492 $2.284 $49.346 $12.292 $70.299 $24.605 $57.986 0.849 $49.256 1
26 229 5 114 112 673 $90.00 $27.00 $3.00 $12.357 $60.538 $92.675 $33.114 $0.297 $1.453 $2.224 $48.054 $12.292 $68.137 $23.848 $56.580 0.844 $47.737 1
27 223 4 111 109 655 $90.00 $27.00 $3.00 $12.033 $58.953 $90.249 $32.247 $0.289 $1.415 $2.166 $46.796 $12.292 $66.031 $23.111 $55.212 0.838 $46.267 1
28 217 4 109 106 638 $90.00 $27.00 $3.00 $11.718 $57.410 $87.887 $31.403 $0.281 $1.378 $2.109 $45.571 $12.292 $63.981 $22.393 $53.879 0.832 $44.844 1
29 210 4 105 103 616 $90.00 $27.00 $3.00 $11.320 $55.458 $84.899 $30.335 $0.272 $1.331 $2.038 $44.022 $12.292 $61.388 $21.486 $52.194 0.827 $43.147 1
30 203 4 101 99 595 $90.00 $27.00 $3.00 $10.935 $53.573 $82.013 $29.304 $0.262 $1.286 $1.968 $42.525 $12.292 $58.883 $20.609 $50.566 0.821 $41.518 1
31 196 4 98 96 575 $90.00 $27.00 $3.00 $10.563 $51.751 $79.225 $28.308 $0.254 $1.242 $1.901 $41.079 $12.292 $56.463 $19.762 $48.993 0.816 $39.954 1
32 189 4 94 93 556 $90.00 $27.00 $3.00 $10.204 $49.992 $76.531 $27.346 $0.245 $1.200 $1.837 $39.683 $12.292 $54.126 $18.944 $47.474 0.810 $38.453 1
33 183 4 91 89 537 $90.00 $27.00 $3.00 $9.857 $48.293 $73.930 $26.416 $0.237 $1.159 $1.774 $38.334 $12.292 $51.868 $18.154 $46.006 0.804 $37.011 1
34 176 4 88 86 518 $90.00 $27.00 $3.00 $9.522 $46.651 $71.416 $25.518 $0.229 $1.120 $1.714 $37.031 $12.292 $49.687 $17.390 $44.588 0.799 $35.628 1
35 170 3 85 83 501 $90.00 $27.00 $3.00 $9.198 $45.065 $68.988 $24.650 $0.221 $1.082 $1.656 $35.772 $12.292 $47.580 $16.653 $43.219 0.794 $34.299 1
36 165 3 82 81 484 $90.00 $27.00 $3.00 $8.886 $43.533 $66.643 $23.812 $0.213 $1.045 $1.599 $34.556 $12.292 $45.545 $15.941 $41.896 0.788 $33.024 1
37 159 3 79 78 467 $90.00 $27.00 $3.00 $8.584 $42.053 $64.377 $23.003 $0.206 $1.009 $1.545 $33.381 $12.292 $43.578 $15.252 $40.618 0.783 $31.800 1
38 154 3 77 75 451 $90.00 $27.00 $3.00 $8.292 $40.623 $62.189 $22.221 $0.199 $0.975 $1.493 $32.246 $12.292 $41.679 $14.588 $39.383 0.778 $30.624 1
39 148 3 74 73 436 $90.00 $27.00 $3.00 $8.010 $39.242 $60.075 $21.465 $0.192 $0.942 $1.442 $31.150 $12.292 $39.844 $13.945 $38.190 0.772 $29.496 1
40 143 3 72 70 421 $90.00 $27.00 $3.00 $7.738 $37.908 $58.032 $20.736 $0.186 $0.910 $1.393 $30.091 $12.292 $38.072 $13.325 $37.038 0.767 $28.412 1
minimum (breakeven) EUR and IP (flow) for the given price: minimum (breakeven) EUR and IP (flow) for the given price:
Full Cycle DUC Full Cycle DUC
Appalachia Basin: SW PA Wet Gas My Assumptions:
Basin Characteristics Average Well Appalachia Basin: SW PA Wet Gas Appalachia Basin: SW PA Wet Gas
Baseline Results (2016 factor prices) Sensitivity Results (2014 factor prices, G2=133%)
Results
Capex ($1,000s) Production (boe/d) Prices Cash Flows ($1,000)
jsmith:
Constant exponential
decline begins at year 4
Page 81
Appendix A: Minimum EUR as function of price, 2014 and 2016 Cost scenarios.
A-30
SW PA Super Rich
100% oilfield service & supply factor price scalar
$5.90 cost/well ($mm) IP EUR 30 days/month
684 EUR/well (mboe) 1,536 2,150 -0.67% exponential decline rate after year 3 (monthly)
-55% 1st yr decline -6.5% 688 $100.00 oil price WTI ($/bbl)
-29% 2nd yr decline -2.8% 488 0% oil price appreciation (per month) Price EUR IP EUR IP Price EUR IP EUR IP
-33% 3rd yr decline -3.3% 400 $3.50 gas price Henry Hub ($/mcf) $20 5,180 3,701 2,571 1,837 $20 106,843 76,331 53,033 37,888
489 IP rate (boe/d) 0% gas price appreciation $25 3,960 2,829 1,965 1,404 $25 18,483 13,205 9,174 6,554
$7.00 opex-LOE ($/boe) 30% NGL price/oil price (fixed ratio) $30 3,205 2,290 1,591 1,137 $30 10,116 7,227 5,021 3,587
8% % oil 0.68% discount rate (compound monthly) $35 2,691 1,923 1,336 954 $35 6,964 4,975 3,457 2,470
46% % gas 8.5% discount rate (annual) $40 2,320 1,657 1,151 822 $40 5,309 3,793 2,635 1,882
46% % NGL 80% intangible drilling cost / total capex $45 2,038 1,456 1,012 723 $45 4,290 3,065 2,130 1,522
20.0% royalty rate 0.714 IP/EUR ratio, (B8/B4 = fixed ratio) $50 1,818 1,299 902 644 $50 3,599 2,571 1,787 1,277
3.0% oil prod tax $60 1,494 1,067 742 530 $60 2,722 1,945 1,351 965
3.0% gas prod tax $70 1,269 907 630 450 $70 2,189 1,564 1,087 777
3.0% NGL prod tax -$1.062 = NPV/well ($ million) $80 1,102 787 547 391 $80 1,830 1,307 909 649
35.0% income tax rate 0 = EUR check (mboe) $90 974 696 484 346 $90 1,573 1,124 781 558
-10% oil differential 0.33% = ATIRR (monthly) $100 873 624 433 309 $100 1,379 985 684 489
-14% gas differential 4.08% = ATIRR (annual)
0 1 = DUC 684 = total production (mboe)
25% auxillary cost/well cost $2.609 = "tail end" NPV/well ($ million)
50% completion cost/well cost 100% = "tail end" recovery factor
$2,000 min opex ($/month) 0 = months of lost production
Per Well Net Cash Flow Analysis
mcf/d AT NPV Active
Month Well Cost Aux. Cost Total Oil NGL Gas Gas Prod Oil/bbl NGL/bbl Gas/mcf Oil Rev Gas Rev NGL Rev Royalty Oil Tax Gas Tax NGL Tax Opex Depeciation Tax. Inc. Income Tax NCF PV Factor -$1,062 1/0
1 1475 $369 $90.00 $27.00 $3.00 $1,475.000 -$1,475.00 -$516.250 -1,328 1.000 -$1,327.50
2 $1,475 $369 $90.00 $27.00 $3.00 $1,475.000 -$1,475.00 -$516.250 -1,328 0.993 -$1,318.51
3 $1,475 $369 $90.00 $27.00 $3.00 $1,475.000 -$1,475.00 -$516.250 -1,328 0.986 -$1,309.57
4 $1,475 $369 $90.00 $27.00 $3.00 $1,475.000 -$1,475.00 -$516.250 -1,328 0.980 -$1,300.70
5 489 39 225 225 1,349 $90.00 $27.00 $3.00 $105.607 $121.428 $182.173 $81.84 $2.53 $2.91 $4.37 $102.674 12.2916667 $202.580 70.903007 $143.969 0.973 140.10644 1
6 457 37 210 210 1,262 $90.00 $27.00 $3.00 $98.770 $113.567 $170.379 $76.543 $2.370 $2.726 $4.089 $96.027 $12.292 $188.670 $66.034 $134.927 0.967 $130.418 1
7 428 34 197 197 1,180 $90.00 $27.00 $3.00 $92.376 $106.215 $159.349 $71.588 $2.217 $2.549 $3.824 $89.810 $12.292 $175.660 $61.481 $126.470 0.960 $121.416 1
8 400 32 184 184 1,104 $90.00 $27.00 $3.00 $86.396 $99.339 $149.033 $66.954 $2.074 $2.384 $3.577 $83.996 $12.292 $163.492 $57.222 $118.561 0.954 $113.051 1
9 374 30 172 172 1,032 $90.00 $27.00 $3.00 $80.803 $92.908 $139.385 $62.619 $1.939 $2.230 $3.345 $78.558 $12.292 $152.112 $53.239 $111.164 0.947 $105.280 1
10 350 28 161 161 966 $90.00 $27.00 $3.00 $75.572 $86.893 $130.361 $58.565 $1.814 $2.085 $3.129 $73.473 $12.292 $141.469 $49.514 $104.246 0.941 $98.059 1
11 327 26 151 151 903 $90.00 $27.00 $3.00 $70.679 $81.268 $121.922 $54.774 $1.696 $1.950 $2.926 $68.716 $12.292 $131.515 $46.030 $97.776 0.934 $91.350 1
12 306 24 141 141 845 $90.00 $27.00 $3.00 $66.104 $76.007 $114.029 $51.228 $1.586 $1.824 $2.737 $64.267 $12.292 $122.205 $42.772 $91.725 0.928 $85.116 1
13 286 23 132 132 790 $90.00 $27.00 $3.00 $61.824 $71.086 $106.647 $47.911 $1.484 $1.706 $2.560 $60.107 $12.292 $113.498 $39.724 $86.065 0.922 $79.323 1
14 268 21 123 123 739 $90.00 $27.00 $3.00 $57.822 $66.484 $99.743 $44.810 $1.388 $1.596 $2.394 $56.216 $12.292 $105.354 $36.874 $80.772 0.915 $73.940 1
15 250 20 115 115 691 $90.00 $27.00 $3.00 $54.079 $62.180 $93.285 $41.909 $1.298 $1.492 $2.239 $52.576 $12.292 $97.738 $34.208 $75.821 0.909 $68.938 1
16 234 19 108 108 646 $90.00 $27.00 $3.00 $50.578 $58.155 $87.246 $39.196 $1.214 $1.396 $2.094 $49.173 $12.292 $90.615 $31.715 $71.191 0.903 $64.290 1
17 228 18 105 105 628 $90.00 $27.00 $3.00 $49.150 $56.514 $84.784 $38.090 $1.180 $1.356 $2.035 $47.785 $12.292 $87.711 $30.699 $69.304 0.897 $62.161 1
18 221 18 102 102 610 $90.00 $27.00 $3.00 $47.764 $54.919 $82.392 $37.015 $1.146 $1.318 $1.977 $46.437 $12.292 $84.889 $29.711 $67.470 0.891 $60.106 1
19 215 17 99 99 593 $90.00 $27.00 $3.00 $46.416 $53.369 $80.067 $35.970 $1.114 $1.281 $1.922 $45.126 $12.292 $82.147 $28.752 $65.687 0.885 $58.122 1
20 209 17 96 96 576 $90.00 $27.00 $3.00 $45.106 $51.863 $77.808 $34.955 $1.083 $1.245 $1.867 $43.853 $12.292 $79.482 $27.819 $63.955 0.879 $56.206 1
21 203 16 93 93 560 $90.00 $27.00 $3.00 $43.833 $50.400 $75.612 $33.969 $1.052 $1.210 $1.815 $42.616 $12.292 $76.893 $26.913 $62.272 0.873 $54.356 1
22 197 16 91 91 544 $90.00 $27.00 $3.00 $42.596 $48.978 $73.479 $33.011 $1.022 $1.175 $1.763 $41.413 $12.292 $74.376 $26.032 $60.636 0.867 $52.569 1
23 192 15 88 88 529 $90.00 $27.00 $3.00 $41.395 $47.596 $71.406 $32.079 $0.993 $1.142 $1.714 $40.245 $12.292 $71.931 $25.176 $59.047 0.861 $50.844 1
24 186 15 86 86 514 $90.00 $27.00 $3.00 $40.227 $46.253 $69.391 $31.174 $0.965 $1.110 $1.665 $39.109 $12.292 $69.554 $24.344 $57.502 0.855 $49.179 1
25 181 14 83 83 500 $90.00 $27.00 $3.00 $39.091 $44.948 $67.433 $30.294 $0.938 $1.079 $1.618 $38.006 $12.292 $67.245 $23.536 $56.001 0.849 $47.570 1
26 176 14 81 81 485 $90.00 $27.00 $3.00 $37.988 $43.679 $65.530 $29.440 $0.912 $1.048 $1.573 $36.933 $12.292 $65.001 $22.750 $54.542 0.844 $46.017 1
27 171 14 79 79 472 $90.00 $27.00 $3.00 $36.916 $42.447 $63.681 $28.609 $0.886 $1.019 $1.528 $35.891 $12.292 $62.820 $21.987 $53.124 0.838 $44.517 1
28 166 13 76 76 458 $90.00 $27.00 $3.00 $35.875 $41.249 $61.884 $27.802 $0.861 $0.990 $1.485 $34.878 $12.292 $60.700 $21.245 $51.747 0.832 $43.069 1
29 161 13 74 74 443 $90.00 $27.00 $3.00 $34.705 $39.904 $59.867 $26.895 $0.833 $0.958 $1.437 $33.741 $12.292 $58.321 $20.412 $50.200 0.827 $41.499 1
30 155 12 72 72 429 $90.00 $27.00 $3.00 $33.574 $38.604 $57.915 $26.019 $0.806 $0.926 $1.390 $32.641 $12.292 $56.019 $19.607 $48.704 0.821 $39.989 1
31 150 12 69 69 415 $90.00 $27.00 $3.00 $32.480 $37.345 $56.027 $25.170 $0.780 $0.896 $1.345 $31.577 $12.292 $53.792 $18.827 $47.257 0.816 $38.538 1
32 145 12 67 67 401 $90.00 $27.00 $3.00 $31.421 $36.128 $54.201 $24.350 $0.754 $0.867 $1.301 $30.548 $12.292 $51.638 $18.073 $45.856 0.810 $37.143 1
33 141 11 65 65 388 $90.00 $27.00 $3.00 $30.396 $34.950 $52.434 $23.556 $0.730 $0.839 $1.258 $29.552 $12.292 $49.554 $17.344 $44.502 0.804 $35.801 1
34 136 11 63 63 376 $90.00 $27.00 $3.00 $29.406 $33.811 $50.725 $22.788 $0.706 $0.811 $1.217 $28.589 $12.292 $47.538 $16.638 $43.191 0.799 $34.511 1
35 132 11 61 61 363 $90.00 $27.00 $3.00 $28.447 $32.709 $49.071 $22.045 $0.683 $0.785 $1.178 $27.657 $12.292 $45.587 $15.956 $41.923 0.794 $33.272 1
36 127 10 59 59 352 $90.00 $27.00 $3.00 $27.520 $31.642 $47.471 $21.327 $0.660 $0.759 $1.139 $26.755 $12.292 $43.701 $15.295 $40.697 0.788 $32.079 1
37 123 10 57 57 340 $90.00 $27.00 $3.00 $26.623 $30.611 $45.924 $20.631 $0.639 $0.735 $1.102 $25.883 $12.292 $41.875 $14.656 $39.511 0.783 $30.933 1
38 119 10 55 55 329 $90.00 $27.00 $3.00 $25.755 $29.613 $44.427 $19.959 $0.618 $0.711 $1.066 $25.039 $12.292 $40.110 $14.038 $38.363 0.778 $29.831 1
39 115 9 53 53 318 $90.00 $27.00 $3.00 $24.915 $28.648 $42.979 $19.308 $0.598 $0.688 $1.031 $24.223 $12.292 $38.401 $13.440 $37.253 0.772 $28.771 1
40 112 9 51 51 308 $90.00 $27.00 $3.00 $24.103 $27.714 $41.578 $18.679 $0.578 $0.665 $0.998 $23.433 $12.292 $36.749 $12.862 $36.178 0.767 $27.753 1
minimum (breakeven) EUR and IP (flow) for the given price: minimum (breakeven) EUR and IP (flow) for the given price:
Full Cycle DUC Full Cycle DUC
Appalachia Basin: SW PA Super Rich My Assumptions:
Basin Characteristics Average Well Appalachia Basin: SW PA Super Rich Appalachia Basin: SW PA Super Rich
Baseline Results (2016 factor prices) Sensitivity Results (2014 factor prices, G2=133%)
Results
Capex ($1,000s) Production (boe/d) Prices Cash Flows ($1,000)
jsmith:
Constant exponential
decline begins at year 4
Page 82
Appendix A: Minimum EUR as function of price, 2014 and 2016 Cost scenarios.
A-31
Utica Wet Gas
100% oilfield service & supply factor price scalar
$10.25 cost/well ($mm) IP EUR 30 days/month
1,695 EUR/well (mboe) 3,000 3,000 -1.41% exponential decline rate after year 3 (monthly)
-46% 1st yr decline -5.0% 1625 $100.00 oil price WTI ($/bbl)
-38% 2nd yr decline -4.0% 1000 0% oil price appreciation (per month) Price EUR IP EUR IP Price EUR IP EUR IP
-36% 3rd yr decline -3.7% 800 $3.50 gas price Henry Hub ($/mcf) $20 6,006 6,006 2,981 2,981 $20 61,623 61,623 30,587 30,587
1,695 IP rate (boe/d) 0% gas price appreciation $25 5,277 5,277 2,619 2,619 $25 29,830 29,830 14,806 14,806
$8.00 opex-LOE ($/boe) 30% NGL price/oil price (fixed ratio) $30 4,706 4,706 2,336 2,336 $30 19,678 19,678 9,767 9,767
3% % oil 0.68% discount rate (compound monthly) $35 4,246 4,246 2,108 2,108 $35 14,681 14,681 7,287 7,287
67% % gas 8.5% discount rate (annual) $40 3,868 3,868 1,921 1,921 $40 11,708 11,708 5,811 5,811
30% % NGL 80% intangible drilling cost / total capex $45 3,552 3,552 1,764 1,764 $45 9,736 9,736 4,833 4,833
20.0% royalty rate 1.000 IP/EUR ratio, (B8/B4 = fixed ratio) $50 3,284 3,284 1,631 1,631 $50 8,333 8,333 4,136 4,136
3.0% oil prod tax $60 2,853 2,853 1,417 1,417 $60 6,469 6,469 3,211 3,211
3.0% gas prod tax $70 2,522 2,522 1,253 1,253 $70 5,286 5,286 2,624 2,624
3.0% NGL prod tax -$0.806 = NPV/well ($ million) $80 2,260 2,260 1,123 1,123 $80 4,469 4,469 2,218 2,218
35.0% income tax rate 0 = EUR check (mboe) $90 2,047 2,047 1,017 1,017 $90 3,870 3,870 1,921 1,921
-10% oil differential 0.46% = ATIRR (monthly) $100 1,871 1,871 930 930 $100 3,413 3,413 1,695 1,695
-14% gas differential 5.66% = ATIRR (annual)
0 1 = DUC 1,695 = total production (mboe)
25% auxillary cost/well cost $3.894 = "tail end" NPV/well ($ million)
50% completion cost/well cost 100% = "tail end" recovery factor
$2,000 min opex ($/month) 0 = months of lost production
Per Well Net Cash Flow Analysis
mcf/d AT NPV Active
Month Well Cost Aux. Cost Total Oil NGL Gas Gas Prod Oil/bbl NGL/bbl Gas/mcf Oil Rev Gas Rev NGL Rev Royalty Oil Tax Gas Tax NGL Tax Opex Depeciation Tax. Inc. Income Tax NCF PV Factor -$806 1/0
1 $2,563 $641 $90.00 $27.00 $3.00 $2,562.500 -$2,562.50 -$896.875 -2,306 1.000 -$2,306.25
2 $2,563 $641 $90.00 $27.00 $3.00 $2,562.500 -$2,562.50 -$896.875 -2,306 0.993 -$2,290.62
3 $2,563 $641 $90.00 $27.00 $3.00 $2,562.500 -$2,562.50 -$896.875 -2,306 0.986 -$2,275.10
4 $2,563 $641 $90.00 $27.00 $3.00 $2,562.500 -$2,562.50 -$896.875 -2,306 0.980 -$2,259.69
5 1695 51 508 1135 6,812 $90.00 $27.00 $3.00 $137.257 $612.977 $411.770 $232.40 $3.29 $14.71 $9.88 $406.686 $21.354 $473.674 $165.786 $329.243 0.973 $320.410 1
6 1610 48 483 1079 6,473 $90.00 $27.00 $3.00 $130.420 $582.446 $391.260 $220.825 $3.130 $13.979 $9.390 $386.430 $21.354 $449.018 $157.156 $313.216 0.967 $302.748 1
7 1530 46 459 1025 6,150 $90.00 $27.00 $3.00 $123.924 $553.435 $371.772 $209.826 $2.974 $13.282 $8.923 $367.182 $21.354 $425.589 $148.956 $297.987 0.960 $286.077 1
8 1454 44 436 974 5,844 $90.00 $27.00 $3.00 $117.751 $525.869 $353.254 $199.375 $2.826 $12.621 $8.478 $348.893 $21.354 $403.327 $141.165 $283.517 0.954 $270.341 1
9 1381 41 414 925 5,553 $90.00 $27.00 $3.00 $111.886 $499.676 $335.659 $189.444 $2.685 $11.992 $8.056 $331.515 $21.354 $382.174 $133.761 $269.768 0.947 $255.488 1
10 1313 39 394 879 5,276 $90.00 $27.00 $3.00 $106.313 $474.788 $318.940 $180.008 $2.552 $11.395 $7.655 $315.003 $21.354 $362.075 $126.726 $256.703 0.941 $241.467 1
11 1247 37 374 836 5,013 $90.00 $27.00 $3.00 $101.018 $451.139 $303.054 $171.042 $2.424 $10.827 $7.273 $299.313 $21.354 $342.977 $120.042 $244.289 0.934 $228.234 1
12 1185 36 356 794 4,764 $90.00 $27.00 $3.00 $95.987 $428.668 $287.960 $162.523 $2.304 $10.288 $6.911 $284.405 $21.354 $324.830 $113.691 $232.494 0.928 $215.742 1
13 1126 34 338 754 4,526 $90.00 $27.00 $3.00 $91.206 $407.317 $273.617 $154.428 $2.189 $9.776 $6.567 $270.239 $21.354 $307.587 $107.655 $221.286 0.922 $203.950 1
14 1070 32 321 717 4,301 $90.00 $27.00 $3.00 $86.663 $387.029 $259.988 $146.736 $2.080 $9.289 $6.240 $256.778 $21.354 $291.203 $101.921 $210.636 0.915 $192.819 1
15 1017 30 305 681 4,087 $90.00 $27.00 $3.00 $82.346 $367.751 $247.038 $139.427 $1.976 $8.826 $5.929 $243.989 $21.354 $275.635 $96.472 $200.517 0.909 $182.312 1
16 966 29 290 647 3,883 $90.00 $27.00 $3.00 $78.245 $349.434 $234.734 $132.483 $1.878 $8.386 $5.634 $231.836 $21.354 $260.842 $91.295 $190.902 0.903 $172.394 1
17 928 28 278 622 3,729 $90.00 $27.00 $3.00 $75.142 $335.579 $225.426 $127.229 $1.803 $8.054 $5.410 $222.643 $21.354 $249.653 $87.378 $183.628 0.897 $164.703 1
18 891 27 267 597 3,581 $90.00 $27.00 $3.00 $72.163 $322.272 $216.488 $122.185 $1.732 $7.735 $5.196 $213.815 $21.354 $238.907 $83.617 $176.644 0.891 $157.364 1
19 856 26 257 573 3,439 $90.00 $27.00 $3.00 $69.301 $309.494 $207.904 $117.340 $1.663 $7.428 $4.990 $205.337 $21.354 $228.587 $80.005 $169.936 0.885 $150.363 1
20 822 25 246 551 3,303 $90.00 $27.00 $3.00 $66.553 $297.222 $199.660 $112.687 $1.597 $7.133 $4.792 $197.195 $21.354 $218.677 $76.537 $163.494 0.879 $143.683 1
21 789 24 237 529 3,172 $90.00 $27.00 $3.00 $63.914 $285.437 $191.743 $108.219 $1.534 $6.850 $4.602 $189.376 $21.354 $209.159 $73.206 $157.308 0.873 $137.309 1
22 758 23 227 508 3,046 $90.00 $27.00 $3.00 $61.380 $274.119 $184.140 $103.928 $1.473 $6.579 $4.419 $181.867 $21.354 $200.019 $70.007 $151.366 0.867 $131.228 1
23 728 22 218 488 2,925 $90.00 $27.00 $3.00 $58.946 $263.250 $176.839 $99.807 $1.415 $6.318 $4.244 $174.656 $21.354 $191.241 $66.934 $145.661 0.861 $125.426 1
24 699 21 210 468 2,809 $90.00 $27.00 $3.00 $56.609 $252.811 $169.827 $95.849 $1.359 $6.067 $4.076 $167.730 $21.354 $182.811 $63.984 $140.182 0.855 $119.890 1
25 671 20 201 450 2,698 $90.00 $27.00 $3.00 $54.364 $242.787 $163.093 $92.049 $1.305 $5.827 $3.914 $161.080 $21.354 $174.716 $61.151 $134.920 0.849 $114.608 1
26 645 19 193 432 2,591 $90.00 $27.00 $3.00 $52.209 $233.160 $156.626 $88.399 $1.253 $5.596 $3.759 $154.693 $21.354 $166.941 $58.430 $129.866 0.844 $109.568 1
27 619 19 186 415 2,488 $90.00 $27.00 $3.00 $50.139 $223.915 $150.416 $84.894 $1.203 $5.374 $3.610 $148.559 $21.354 $159.475 $55.816 $125.013 0.838 $104.759 1
28 594 18 178 398 2,390 $90.00 $27.00 $3.00 $48.151 $215.036 $144.452 $81.528 $1.156 $5.161 $3.467 $142.668 $21.354 $152.305 $53.307 $120.352 0.832 $100.170 1
29 573 17 172 384 2,302 $90.00 $27.00 $3.00 $46.393 $207.186 $139.178 $78.551 $1.113 $4.972 $3.340 $137.460 $21.354 $145.965 $51.088 $116.232 0.827 $96.085 1
30 552 17 166 370 2,218 $90.00 $27.00 $3.00 $44.699 $199.622 $134.097 $75.684 $1.073 $4.791 $3.218 $132.441 $21.354 $139.857 $48.950 $112.261 0.821 $92.174 1
31 532 16 160 356 2,137 $90.00 $27.00 $3.00 $43.067 $192.334 $129.201 $72.921 $1.034 $4.616 $3.101 $127.606 $21.354 $133.971 $46.890 $108.436 0.816 $88.430 1
32 512 15 154 343 2,059 $90.00 $27.00 $3.00 $41.495 $185.313 $124.485 $70.258 $0.996 $4.448 $2.988 $122.948 $21.354 $128.301 $44.905 $104.750 0.810 $84.845 1
33 494 15 148 331 1,984 $90.00 $27.00 $3.00 $39.980 $178.547 $119.940 $67.693 $0.960 $4.285 $2.879 $118.459 $21.354 $122.837 $42.993 $101.198 0.804 $81.413 1
34 476 14 143 319 1,912 $90.00 $27.00 $3.00 $38.520 $172.029 $115.561 $65.222 $0.924 $4.129 $2.773 $114.135 $21.354 $117.573 $41.151 $97.777 0.799 $78.128 1
35 458 14 137 307 1,842 $90.00 $27.00 $3.00 $37.114 $165.749 $111.342 $62.841 $0.891 $3.978 $2.672 $109.968 $21.354 $112.501 $39.375 $94.480 0.794 $74.982 1
36 441 13 132 296 1,775 $90.00 $27.00 $3.00 $35.759 $159.698 $107.278 $60.547 $0.858 $3.833 $2.575 $105.953 $21.354 $107.615 $37.665 $91.304 0.788 $71.970 1
37 425 13 128 285 1,710 $90.00 $27.00 $3.00 $34.454 $153.868 $103.361 $58.336 $0.827 $3.693 $2.481 $102.085 $21.354 $102.906 $36.017 $88.243 0.783 $69.086 1
38 410 12 123 275 1,647 $90.00 $27.00 $3.00 $33.196 $148.250 $99.588 $56.207 $0.797 $3.558 $2.390 $98.358 $21.354 $98.370 $34.429 $85.295 0.778 $66.325 1
39 395 12 118 265 1,587 $90.00 $27.00 $3.00 $31.984 $142.838 $95.952 $54.155 $0.768 $3.428 $2.303 $94.767 $21.354 $93.999 $32.900 $82.454 0.772 $63.682 1
40 380 11 114 255 1,529 $90.00 $27.00 $3.00 $30.816 $137.623 $92.449 $52.178 $0.740 $3.303 $2.219 $91.308 $21.354 $89.788 $31.426 $79.716 0.767 $61.151 1
minimum (breakeven) EUR and IP (flow) for the given price: minimum (breakeven) EUR and IP (flow) for the given price:
Full Cycle DUC Full Cycle DUC
Appalachia Basin: Utica Wet Gas My Assumptions:
Basin Characteristics Average Well Appalachia Basin: Utica Wet Gas Appalachia Basin: Utica Wet Gas
Baseline Results (2016 factor prices) Sensitivity Results (2014 factor prices, G2=133%)
Results
Capex ($1,000s) Production (boe/d) Prices Cash Flows ($1,000)
jsmith:
Constant exponential
decline begins at year 4
Page 83
Appendix A: Minimum EUR as function of price, 2014 and 2016 Cost scenarios.
A-32
Utica Condensate
100% oilfield service & supply factor price scalar
$9.40 cost/well ($mm) IP EUR 30 days/month
533 EUR/well (mboe) 1,186 1,186 -1.47% exponential decline rate after year 3 (monthly)
-46% 1st yr decline -5.0% 640 $100.00 oil price WTI ($/bbl)
-39% 2nd yr decline -4.0% 390 0% oil price appreciation (per month) Price EUR IP EUR IP Price EUR IP EUR IP
-33% 3rd yr decline -3.2% 320 $3.50 gas price Henry Hub ($/mcf) $20 4,600 4,600 2,284 2,284 $20 22,595 22,595 11,215 11,215
533 IP rate (boe/d) 0% gas price appreciation $25 3,434 3,434 1,705 1,705 $25 10,025 10,025 4,976 4,976
$8.00 opex-LOE ($/boe) 30% NGL price/oil price (fixed ratio) $30 2,740 2,740 1,361 1,361 $30 6,441 6,441 3,197 3,197
28% % oil 0.68% discount rate (compound monthly) $35 2,279 2,279 1,132 1,132 $35 4,745 4,745 2,355 2,355
48% % gas 8.5% discount rate (annual) $40 1,951 1,951 969 969 $40 3,756 3,756 1,865 1,865
24% % NGL 80% intangible drilling cost / total capex $45 1,706 1,706 848 848 $45 3,108 3,108 1,543 1,543
20.0% royalty rate 1.000 IP/EUR ratio, (B8/B4 = fixed ratio) $50 1,515 1,515 753 753 $50 2,651 2,651 1,316 1,316
3.0% oil prod tax $60 1,239 1,239 616 616 $60 2,048 2,048 1,017 1,017
3.0% gas prod tax $70 1,047 1,047 521 521 $70 1,669 1,669 829 829
3.0% NGL prod tax -$2.001 = NPV/well ($ million) $80 907 907 451 451 $80 1,408 1,408 700 700
35.0% income tax rate 0 = EUR check (mboe) $90 800 800 398 398 $90 1,218 1,218 605 605
-10% oil differential 0.08% = ATIRR (monthly) $100 716 716 356 356 $100 1,073 1,073 533 533
-14% gas differential 0.91% = ATIRR (annual)
0 1 = DUC 533 = total production (mboe)
25% auxillary cost/well cost $3.027 = "tail end" NPV/well ($ million)
50% completion cost/well cost 99% = "tail end" recovery factor
$2,000 min opex ($/month) 46 = months of lost production
Per Well Net Cash Flow Analysis
mcf/d AT NPV Active
Month Well Cost Aux. Cost Total Oil NGL Gas Gas Prod Oil/bbl NGL/bbl Gas/mcf Oil Rev Gas Rev NGL Rev Royalty Oil Tax Gas Tax NGL Tax Opex Depeciation Tax. Inc. Income Tax NCF PV Factor -$2,001 1/0
1 $2,350 $588 $90.00 $27.00 $3.00 $2,350.000 -$2,350.00 -$822.500 -2,115 1.000 -$2,115.00
2 $2,350 $588 $90.00 $27.00 $3.00 $2,350.000 -$2,350.00 -$822.500 -2,115 0.993 -$2,100.67
3 $2,350 $588 $90.00 $27.00 $3.00 $2,350.000 -$2,350.00 -$822.500 -2,115 0.986 -$2,086.44
4 $2,350 $588 $90.00 $27.00 $3.00 $2,350.000 -$2,350.00 -$822.500 -2,115 0.980 -$2,072.30
5 533 149 128 256 1,536 $90.00 $27.00 $3.00 $403.182 $138.211 $103.675 $129.01 $9.68 $3.32 $2.49 $127.994 $19.583 $352.995 $123.548 $249.030 0.973 $242.349 1
6 507 142 122 243 1,459 $90.00 $27.00 $3.00 $382.980 $131.285 $98.480 $122.549 $9.192 $3.151 $2.364 $121.581 $19.583 $334.326 $117.014 $236.895 0.967 $228.978 1
7 481 135 115 231 1,386 $90.00 $27.00 $3.00 $363.790 $124.707 $93.546 $116.409 $8.731 $2.993 $2.245 $115.489 $19.583 $316.593 $110.808 $225.369 0.960 $216.361 1
8 457 128 110 219 1,316 $90.00 $27.00 $3.00 $345.561 $118.458 $88.859 $110.576 $8.293 $2.843 $2.133 $109.702 $19.583 $299.748 $104.912 $214.420 0.954 $204.455 1
9 434 122 104 208 1,250 $90.00 $27.00 $3.00 $328.246 $112.523 $84.406 $105.035 $7.878 $2.701 $2.026 $104.205 $19.583 $283.747 $99.312 $204.019 0.947 $193.219 1
10 412 115 99 198 1,188 $90.00 $27.00 $3.00 $311.799 $106.885 $80.177 $99.772 $7.483 $2.565 $1.924 $98.984 $19.583 $268.548 $93.992 $194.140 0.941 $182.617 1
11 392 110 94 188 1,128 $90.00 $27.00 $3.00 $296.175 $101.529 $76.159 $94.773 $7.108 $2.437 $1.828 $94.024 $19.583 $254.111 $88.939 $184.755 0.934 $172.612 1
12 372 104 89 179 1,072 $90.00 $27.00 $3.00 $281.335 $96.442 $72.343 $90.024 $6.752 $2.315 $1.736 $89.313 $19.583 $240.397 $84.139 $175.841 0.928 $163.171 1
13 353 99 85 170 1,018 $90.00 $27.00 $3.00 $267.238 $91.609 $68.718 $85.513 $6.414 $2.199 $1.649 $84.837 $19.583 $227.370 $79.579 $167.374 0.922 $154.262 1
14 336 94 81 161 967 $90.00 $27.00 $3.00 $253.847 $87.019 $65.275 $81.228 $6.092 $2.088 $1.567 $80.586 $19.583 $214.996 $75.249 $159.331 0.915 $145.854 1
15 319 89 77 153 919 $90.00 $27.00 $3.00 $241.128 $82.659 $62.004 $77.158 $5.787 $1.984 $1.488 $76.548 $19.583 $203.242 $71.135 $151.690 0.909 $137.919 1
16 303 85 73 145 873 $90.00 $27.00 $3.00 $229.045 $78.517 $58.897 $73.292 $5.497 $1.884 $1.414 $72.713 $19.583 $192.077 $67.227 $144.433 0.903 $130.431 1
17 291 81 70 140 837 $90.00 $27.00 $3.00 $219.784 $75.342 $56.516 $70.328 $5.275 $1.808 $1.356 $69.773 $19.583 $183.518 $64.231 $138.870 0.897 $124.557 1
18 279 78 67 134 803 $90.00 $27.00 $3.00 $210.896 $72.295 $54.231 $67.484 $5.062 $1.735 $1.302 $66.951 $19.583 $175.305 $61.357 $133.532 0.891 $118.958 1
19 268 75 64 128 771 $90.00 $27.00 $3.00 $202.368 $69.372 $52.038 $64.756 $4.857 $1.665 $1.249 $64.244 $19.583 $167.424 $58.599 $128.409 0.885 $113.619 1
20 257 72 62 123 740 $90.00 $27.00 $3.00 $194.185 $66.567 $49.933 $62.137 $4.660 $1.598 $1.198 $61.646 $19.583 $159.862 $55.952 $123.494 0.879 $108.530 1
21 246 69 59 118 710 $90.00 $27.00 $3.00 $186.333 $63.875 $47.914 $59.625 $4.472 $1.533 $1.150 $59.153 $19.583 $152.606 $53.412 $118.777 0.873 $103.677 1
22 237 66 57 114 681 $90.00 $27.00 $3.00 $178.799 $61.292 $45.977 $57.213 $4.291 $1.471 $1.103 $56.761 $19.583 $145.644 $50.975 $114.252 0.867 $99.051 1
23 227 64 54 109 654 $90.00 $27.00 $3.00 $171.569 $58.814 $44.118 $54.900 $4.118 $1.412 $1.059 $54.466 $19.583 $138.962 $48.637 $109.909 0.861 $94.641 1
24 218 61 52 105 627 $90.00 $27.00 $3.00 $164.631 $56.435 $42.334 $52.680 $3.951 $1.354 $1.016 $52.264 $19.583 $132.551 $46.393 $105.742 0.855 $90.436 1
25 209 59 50 100 602 $90.00 $27.00 $3.00 $157.974 $54.153 $40.622 $50.550 $3.791 $1.300 $0.975 $50.150 $19.583 $126.400 $44.240 $101.743 0.849 $86.426 1
26 201 56 48 96 577 $90.00 $27.00 $3.00 $151.586 $51.964 $38.979 $48.506 $3.638 $1.247 $0.936 $48.123 $19.583 $120.497 $42.174 $97.906 0.844 $82.603 1
27 192 54 46 92 554 $90.00 $27.00 $3.00 $145.456 $49.862 $37.403 $46.544 $3.491 $1.197 $0.898 $46.177 $19.583 $114.832 $40.191 $94.224 0.838 $78.958 1
28 185 52 44 89 532 $90.00 $27.00 $3.00 $139.575 $47.846 $35.891 $44.662 $3.350 $1.148 $0.861 $44.309 $19.583 $109.397 $38.289 $90.691 0.832 $75.483 1
29 179 50 43 86 514 $90.00 $27.00 $3.00 $135.048 $46.294 $34.727 $43.214 $3.241 $1.111 $0.833 $42.872 $19.583 $105.214 $36.825 $87.972 0.827 $72.724 1
30 173 48 41 83 498 $90.00 $27.00 $3.00 $130.668 $44.793 $33.600 $41.812 $3.136 $1.075 $0.806 $41.482 $19.583 $101.166 $35.408 $85.341 0.821 $70.071 1
31 167 47 40 80 482 $90.00 $27.00 $3.00 $126.430 $43.340 $32.510 $40.456 $3.034 $1.040 $0.780 $40.136 $19.583 $97.250 $34.037 $82.796 0.816 $67.520 1
32 162 45 39 78 466 $90.00 $27.00 $3.00 $122.329 $41.934 $31.456 $39.144 $2.936 $1.006 $0.755 $38.835 $19.583 $93.460 $32.711 $80.333 0.810 $65.068 1
33 157 44 38 75 451 $90.00 $27.00 $3.00 $118.362 $40.574 $30.436 $37.874 $2.841 $0.974 $0.730 $37.575 $19.583 $89.794 $31.428 $77.949 0.804 $62.710 1
34 151 42 36 73 436 $90.00 $27.00 $3.00 $114.523 $39.258 $29.449 $36.646 $2.749 $0.942 $0.707 $36.356 $19.583 $86.247 $30.186 $75.644 0.799 $60.442 1
35 147 41 35 70 422 $90.00 $27.00 $3.00 $110.808 $37.985 $28.494 $35.457 $2.659 $0.912 $0.684 $35.177 $19.583 $82.814 $28.985 $73.413 0.794 $58.262 1
36 142 40 34 68 408 $90.00 $27.00 $3.00 $107.214 $36.753 $27.569 $34.307 $2.573 $0.882 $0.662 $34.036 $19.583 $79.493 $27.823 $71.254 0.788 $56.166 1
37 137 38 33 66 395 $90.00 $27.00 $3.00 $103.737 $35.561 $26.675 $33.195 $2.490 $0.853 $0.640 $32.932 $19.583 $76.280 $26.698 $69.165 0.783 $54.150 1
38 133 37 32 64 382 $90.00 $27.00 $3.00 $100.373 $34.408 $25.810 $32.118 $2.409 $0.826 $0.619 $31.864 $19.583 $73.171 $25.610 $67.144 0.778 $52.212 1
39 128 36 31 62 370 $90.00 $27.00 $3.00 $97.117 $33.292 $24.973 $31.076 $2.331 $0.799 $0.599 $30.831 $19.583 $70.162 $24.557 $65.189 0.772 $50.348 1
40 124 35 30 60 358 $90.00 $27.00 $3.00 $93.967 $32.212 $24.163 $30.068 $2.255 $0.773 $0.580 $29.831 $19.583 $67.251 $23.538 $63.297 0.767 $48.555 1
minimum (breakeven) EUR and IP (flow) for the given price: minimum (breakeven) EUR and IP (flow) for the given price:
Full Cycle DUC Full Cycle DUC
Appalachia Basin: Utica Condensate My Assumptions:
Basin Characteristics Average Well Appalachia Basin: Utica Condensate Appalachia Basin: Utica Condensate
Baseline Results (2016 factor prices) Sensitivity Results (2014 factor prices, G2=133%)
Results
Capex ($1,000s) Production (boe/d) Prices Cash Flows ($1,000)
jsmith:
Constant exponential
decline begins at year 4
Page 84
Appendix A: Minimum EUR as function of price, 2014 and 2016 Cost scenarios.
A-33
San Juan - Gallup
100% oilfield service & supply factor price scalar
$4.20 cost/well ($mm) IP EUR 30 days/month
123 EUR/well (mboe) 550 451 -0.98% exponential decline rate after year 3 (monthly)
-69% 1st yr decline -9.3% 170 $100.00 oil price WTI ($/bbl)
-41% 2nd yr decline -4.3% 100 0% oil price appreciation (per month) Price EUR IP EUR IP Price EUR IP EUR IP
-24% 3rd yr decline -2.3% 87 $3.50 gas price Henry Hub ($/mcf) $20 1,235 1,506 614 749 $20 2,359 2,877 1,171 1,428
150 IP rate (boe/d) 0% gas price appreciation $25 899 1,096 448 546 $25 1,534 1,871 762 929
$6.00 opex-LOE ($/boe) 30% NGL price/oil price (fixed ratio) $30 707 862 353 430 $30 1,137 1,387 565 689
65% % oil 0.68% discount rate (compound monthly) $35 582 710 291 355 $35 903 1,101 449 548
18% % gas 8.5% discount rate (annual) $40 495 604 248 302 $40 749 913 373 455
18% % NGL 80% intangible drilling cost / total capex $45 431 526 216 263 $45 640 780 319 389
20.0% royalty rate 1.220 IP/EUR ratio, (B8/B4 = fixed ratio) $50 381 465 191 233 $50 559 682 278 339
3.8% oil prod tax $60 310 378 156 190 $60 445 543 222 271
3.8% gas prod tax $70 262 320 132 161 $70 370 451 185 226
3.8% NGL prod tax -$1.091 = NPV/well ($ million) $80 226 276 114 139 $80 317 387 159 194
35.0% income tax rate 0 = EUR check (mboe) $90 199 243 101 123 $90 277 338 139 170
-10% oil differential 0.02% = ATIRR (monthly) $100 178 217 90 110 $100 246 300 123 150
-5% gas differential 0.22% = ATIRR (annual)
0 1 = DUC 123 = total production (mboe)
25% auxillary cost/well cost $1.363 = "tail end" NPV/well ($ million)
50% completion cost/well cost 99% = "tail end" recovery factor
$2,000 min opex ($/month) 28 = months of lost production
Per Well Net Cash Flow Analysis
mcf/d AT NPV Active
Month Well Cost Aux. Cost Total Oil NGL Gas Gas Prod Oil/bbl NGL/bbl Gas/mcf Oil Rev Gas Rev NGL Rev Royalty Oil Tax Gas Tax NGL Tax Opex Depeciation Tax. Inc. Income Tax NCF PV Factor -$1,091 1/0
1 $1,050 $263 $90.00 $27.00 $3.33 $1,050.000 -$1,050.00 -$367.500 -945 1.000 -$945.00
2 $1,050 $263 $90.00 $27.00 $3.33 $1,050.000 -$1,050.00 -$367.500 -945 0.993 -$938.60
3 $1,050 $263 $90.00 $27.00 $3.33 $1,050.000 -$1,050.00 -$367.500 -945 0.986 -$932.24
4 $1,050 $263 $90.00 $27.00 $3.33 $1,050.000 -$1,050.00 -$367.500 -945 0.980 -$925.92
5 150 98 27 27 163 $90.00 $27.00 $3.33 $264.083 $16.211 $21.939 $60.45 $8.03 $0.49 $0.67 $27.085 $8.750 $196.763 $68.867 $136.646 0.973 $132.980 1
6 136 89 25 25 147 $90.00 $27.00 $3.33 $239.468 $14.700 $19.894 $54.812 $7.280 $0.447 $0.605 $24.561 $8.750 $177.607 $62.163 $124.195 0.967 $120.044 1
7 124 80 22 22 134 $90.00 $27.00 $3.33 $217.148 $13.330 $18.040 $49.703 $6.601 $0.405 $0.548 $22.272 $8.750 $160.237 $56.083 $112.904 0.960 $108.392 1
8 112 73 20 20 121 $90.00 $27.00 $3.33 $196.908 $12.087 $16.358 $45.071 $5.986 $0.367 $0.497 $20.196 $8.750 $144.486 $50.570 $102.666 0.954 $97.895 1
9 102 66 18 18 110 $90.00 $27.00 $3.33 $178.554 $10.960 $14.834 $40.870 $5.428 $0.333 $0.451 $18.313 $8.750 $130.203 $45.571 $93.382 0.947 $88.439 1
10 92 60 17 17 100 $90.00 $27.00 $3.33 $161.911 $9.939 $13.451 $37.060 $4.922 $0.302 $0.409 $16.606 $8.750 $117.251 $41.038 $84.963 0.941 $79.921 1
11 84 54 15 15 90 $90.00 $27.00 $3.33 $146.820 $9.012 $12.197 $33.606 $4.463 $0.274 $0.371 $15.058 $8.750 $105.507 $36.927 $77.330 0.934 $72.247 1
12 76 49 14 14 82 $90.00 $27.00 $3.33 $133.135 $8.172 $11.060 $30.474 $4.047 $0.248 $0.336 $13.655 $8.750 $94.857 $33.200 $70.407 0.928 $65.334 1
13 69 45 12 12 74 $90.00 $27.00 $3.33 $120.725 $7.411 $10.029 $27.633 $3.670 $0.225 $0.305 $12.382 $8.750 $85.200 $29.820 $64.130 0.922 $59.106 1
14 62 41 11 11 67 $90.00 $27.00 $3.33 $109.473 $6.720 $9.095 $25.057 $3.328 $0.204 $0.276 $11.228 $8.750 $76.443 $26.755 $58.438 0.915 $53.495 1
15 57 37 10 10 61 $90.00 $27.00 $3.33 $99.269 $6.094 $8.247 $22.722 $3.018 $0.185 $0.251 $10.181 $8.750 $68.502 $23.976 $53.277 0.909 $48.440 1
16 51 33 9 9 55 $90.00 $27.00 $3.33 $90.016 $5.526 $7.478 $20.604 $2.736 $0.168 $0.227 $9.232 $8.750 $61.302 $21.456 $48.596 0.903 $43.885 1
17 49 32 9 9 53 $90.00 $27.00 $3.33 $86.122 $5.287 $7.155 $19.713 $2.618 $0.161 $0.218 $8.833 $8.750 $58.272 $20.395 $46.627 0.897 $41.821 1
18 47 31 8 8 51 $90.00 $27.00 $3.33 $82.397 $5.058 $6.845 $18.860 $2.505 $0.154 $0.208 $8.451 $8.750 $55.373 $19.380 $44.742 0.891 $39.859 1
19 45 29 8 8 49 $90.00 $27.00 $3.33 $78.833 $4.839 $6.549 $18.044 $2.397 $0.147 $0.199 $8.085 $8.750 $52.599 $18.410 $42.939 0.885 $37.994 1
20 43 28 8 8 46 $90.00 $27.00 $3.33 $75.423 $4.630 $6.266 $17.264 $2.293 $0.141 $0.190 $7.736 $8.750 $49.945 $17.481 $41.214 0.879 $36.220 1
21 41 27 7 7 44 $90.00 $27.00 $3.33 $72.160 $4.430 $5.995 $16.517 $2.194 $0.135 $0.182 $7.401 $8.750 $47.406 $16.592 $39.564 0.873 $34.534 1
22 39 26 7 7 42 $90.00 $27.00 $3.33 $69.039 $4.238 $5.736 $15.803 $2.099 $0.129 $0.174 $7.081 $8.750 $44.977 $15.742 $37.985 0.867 $32.932 1
23 38 24 7 7 41 $90.00 $27.00 $3.33 $66.053 $4.055 $5.487 $15.119 $2.008 $0.123 $0.167 $6.775 $8.750 $42.653 $14.929 $36.475 0.861 $31.408 1
24 36 23 6 6 39 $90.00 $27.00 $3.33 $63.196 $3.879 $5.250 $14.465 $1.921 $0.118 $0.160 $6.482 $8.750 $40.430 $14.150 $35.029 0.855 $29.959 1
25 34 22 6 6 37 $90.00 $27.00 $3.33 $60.462 $3.711 $5.023 $13.839 $1.838 $0.113 $0.153 $6.201 $8.750 $38.302 $13.406 $33.647 0.849 $28.581 1
26 33 21 6 6 36 $90.00 $27.00 $3.33 $57.847 $3.551 $4.806 $13.241 $1.759 $0.108 $0.146 $5.933 $8.750 $36.267 $12.693 $32.324 0.844 $27.271 1
27 32 20 6 6 34 $90.00 $27.00 $3.33 $55.345 $3.397 $4.598 $12.668 $1.682 $0.103 $0.140 $5.676 $8.750 $34.320 $12.012 $31.058 0.838 $26.026 1
28 30 20 5 5 33 $90.00 $27.00 $3.33 $52.951 $3.250 $4.399 $12.120 $1.610 $0.099 $0.134 $5.431 $8.750 $32.457 $11.360 $29.847 0.832 $24.842 1
29 29 19 5 5 32 $90.00 $27.00 $3.33 $51.736 $3.176 $4.298 $11.842 $1.573 $0.097 $0.131 $5.306 $8.750 $31.511 $11.029 $29.232 0.827 $24.166 1
30 29 19 5 5 31 $90.00 $27.00 $3.33 $50.549 $3.103 $4.199 $11.570 $1.537 $0.094 $0.128 $5.184 $8.750 $30.588 $10.706 $28.632 0.821 $23.509 1
31 28 18 5 5 30 $90.00 $27.00 $3.33 $49.389 $3.032 $4.103 $11.305 $1.501 $0.092 $0.125 $5.066 $8.750 $29.685 $10.390 $28.045 0.816 $22.871 1
32 27 18 5 5 30 $90.00 $27.00 $3.33 $48.256 $2.962 $4.009 $11.045 $1.467 $0.090 $0.122 $4.949 $8.750 $28.803 $10.081 $27.472 0.810 $22.252 1
33 27 17 5 5 29 $90.00 $27.00 $3.33 $47.149 $2.894 $3.917 $10.792 $1.433 $0.088 $0.119 $4.836 $8.750 $27.942 $9.780 $26.912 0.804 $21.651 1
34 26 17 5 5 28 $90.00 $27.00 $3.33 $46.067 $2.828 $3.827 $10.544 $1.400 $0.086 $0.116 $4.725 $8.750 $27.100 $9.485 $26.365 0.799 $21.067 1
35 26 17 5 5 28 $90.00 $27.00 $3.33 $45.010 $2.763 $3.739 $10.302 $1.368 $0.084 $0.114 $4.616 $8.750 $26.277 $9.197 $25.830 0.794 $20.500 1
36 25 16 5 5 27 $90.00 $27.00 $3.33 $43.977 $2.700 $3.654 $10.066 $1.337 $0.082 $0.111 $4.511 $8.750 $25.474 $8.916 $25.308 0.788 $19.949 1
37 24 16 4 4 26 $90.00 $27.00 $3.33 $42.968 $2.638 $3.570 $9.835 $1.306 $0.080 $0.109 $4.407 $8.750 $24.689 $8.641 $24.798 0.783 $19.414 1
38 24 16 4 4 26 $90.00 $27.00 $3.33 $41.983 $2.577 $3.488 $9.610 $1.276 $0.078 $0.106 $4.306 $8.750 $23.921 $8.373 $24.299 0.778 $18.895 1
39 23 15 4 4 25 $90.00 $27.00 $3.33 $41.019 $2.518 $3.408 $9.389 $1.247 $0.077 $0.104 $4.207 $8.750 $23.172 $8.110 $23.812 0.772 $18.391 1
40 23 15 4 4 25 $90.00 $27.00 $3.33 $40.078 $2.460 $3.330 $9.174 $1.218 $0.075 $0.101 $4.111 $8.750 $22.439 $7.854 $23.336 0.767 $17.901 1
minimum (breakeven) EUR and IP (flow) for the given price: minimum (breakeven) EUR and IP (flow) for the given price:
Full Cycle DUC Full Cycle DUC
Other Regions: San Juan - Gallup My Assumptions:
Basin Characteristics Average Well Other Regions: San Juan - Gallup Other Regions: San Juan - Gallup
Baseline Results (2016 factor prices) Sensitivity Results (2014 factor prices, G2=133%)
Results
Capex ($1,000s) Production (boe/d) Prices Cash Flows ($1,000)
jsmith:
Constant exponential
decline begins at year 4
Page 85
Appendix A: Minimum EUR as function of price, 2014 and 2016 Cost scenarios.
A-34
Tuscaloosa Marine Shale
100% oilfield service & supply factor price scalar
$11.00 cost/well ($mm) IP EUR 30 days/month
267 EUR/well (mboe) 1,048 683 -1.01% exponential decline rate after year 3 (monthly)
-78% 1st yr decline -11.8% 233 $100.00 oil price WTI ($/bbl)
-39% 2nd yr decline -4.0% 142 0% oil price appreciation (per month) Price EUR IP EUR IP Price EUR IP EUR IP
-23% 3rd yr decline -2.1% 125 $3.50 gas price Henry Hub ($/mcf) $20 15,694 24,081 7,790 11,953 $20 0 0
409 IP rate (boe/d) 0% gas price appreciation $25 4,387 6,731 2,177 3,340 $25 115,246 176,834 57,204 87,774
$13.50 opex-LOE ($/boe) 30% NGL price/oil price (fixed ratio) $30 2,550 3,913 1,266 1,943 $30 7,566 11,609 3,755 5,762
92% % oil 0.68% discount rate (compound monthly) $35 1,797 2,757 892 1,369 $35 3,911 6,001 1,941 2,978
8% % gas 8.5% discount rate (annual) $40 1,387 2,128 689 1,057 $40 2,637 4,046 1,309 2,009
0% % NGL 80% intangible drilling cost / total capex $45 1,130 1,734 561 861 $45 1,989 3,052 987 1,514
20.0% royalty rate 1.534 IP/EUR ratio, (B8/B4 = fixed ratio) $50 953 1,462 473 726 $50 1,597 2,450 793 1,217
12.5% oil prod tax $60 726 1,114 360 552 $60 1,145 1,757 568 872
4.2% gas prod tax $70 586 899 291 447 $70 893 1,370 443 680
0.0% NGL prod tax -$2.586 = NPV/well ($ million) $80 491 753 244 374 $80 731 1,122 363 557
35.0% income tax rate 0 = EUR check (mboe) $90 423 649 210 322 $90 620 951 308 473
5% oil differential 0.09% = ATIRR (monthly) $100 372 571 185 284 $100 537 824 267 410
0% gas differential 1.13% = ATIRR (annual)
0 1 = DUC 267 = total production (mboe)
25% auxillary cost/well cost $3.589 = "tail end" NPV/well ($ million)
50% completion cost/well cost 100% = "tail end" recovery factor
$2,000 min opex ($/month) 0 = months of lost production
Per Well Net Cash Flow Analysis
mcf/d AT NPV Active
Month Well Cost Aux. Cost Total Oil NGL Gas Gas Prod Oil/bbl NGL/bbl Gas/mcf Oil Rev Gas Rev NGL Rev Royalty Oil Tax Gas Tax NGL Tax Opex Depeciation Tax. Inc. Income Tax NCF PV Factor -$2,586 1/0
1 $2,750 $688 $105.00 $31.50 $3.50 $2,750.000 -$2,750.00 -$962.500 -2,475 1.000 -$2,475.00
2 $2,750 $688 $105.00 $31.50 $3.50 $2,750.000 -$2,750.00 -$962.500 -2,475 0.993 -$2,458.23
3 $2,750 $688 $105.00 $31.50 $3.50 $2,750.000 -$2,750.00 -$962.500 -2,475 0.986 -$2,441.58
4 $2,750 $688 $105.00 $31.50 $3.50 $2,750.000 -$2,750.00 -$962.500 -2,475 0.980 -$2,425.03
5 409 377 0 33 197 $105.00 $31.50 $3.50 $1,186.411 $20.633 $0.000 $241.41 $118.64 $0.69 $0.00 $165.803 $22.917 $657.581 $230.153 $450.345 0.973 $438.263 1
6 361 332 0 29 173 $105.00 $31.50 $3.50 $1,046.690 $18.203 $0.000 $212.979 $104.669 $0.612 $0.000 $146.276 $22.917 $577.441 $202.104 $398.253 0.967 $384.943 1
7 319 293 0 25 153 $105.00 $31.50 $3.50 $923.423 $16.060 $0.000 $187.897 $92.342 $0.540 $0.000 $129.050 $22.917 $506.738 $177.358 $352.296 0.960 $338.215 1
8 281 259 0 22 135 $105.00 $31.50 $3.50 $814.674 $14.168 $0.000 $165.768 $81.467 $0.476 $0.000 $113.852 $22.917 $444.362 $155.527 $311.752 0.954 $297.263 1
9 248 228 0 20 119 $105.00 $31.50 $3.50 $718.731 $12.500 $0.000 $146.246 $71.873 $0.420 $0.000 $100.444 $22.917 $389.331 $136.266 $275.982 0.947 $261.373 1
10 219 201 0 18 105 $105.00 $31.50 $3.50 $634.088 $11.028 $0.000 $129.023 $63.409 $0.371 $0.000 $88.615 $22.917 $340.782 $119.274 $244.425 0.941 $229.918 1
11 193 178 0 15 93 $105.00 $31.50 $3.50 $559.413 $9.729 $0.000 $113.828 $55.941 $0.327 $0.000 $78.179 $22.917 $297.950 $104.282 $216.584 0.934 $202.349 1
12 170 157 0 14 82 $105.00 $31.50 $3.50 $493.532 $8.583 $0.000 $100.423 $49.353 $0.288 $0.000 $68.972 $22.917 $260.162 $91.057 $192.022 0.928 $178.186 1
13 150 138 0 12 72 $105.00 $31.50 $3.50 $435.410 $7.572 $0.000 $88.596 $43.541 $0.254 $0.000 $60.849 $22.917 $226.824 $79.389 $170.353 0.922 $157.007 1
14 133 122 0 11 64 $105.00 $31.50 $3.50 $384.132 $6.681 $0.000 $78.163 $38.413 $0.224 $0.000 $53.683 $22.917 $197.413 $69.095 $151.235 0.915 $138.443 1
15 117 108 0 9 56 $105.00 $31.50 $3.50 $338.894 $5.894 $0.000 $68.958 $33.889 $0.198 $0.000 $47.361 $22.917 $171.465 $60.013 $134.369 0.909 $122.170 1
16 103 95 0 8 50 $105.00 $31.50 $3.50 $298.983 $5.200 $0.000 $60.837 $29.898 $0.175 $0.000 $41.783 $22.917 $148.573 $52.001 $119.489 0.903 $107.905 1
17 99 91 0 8 48 $105.00 $31.50 $3.50 $286.896 $4.989 $0.000 $58.377 $28.690 $0.168 $0.000 $40.094 $22.917 $141.640 $49.574 $114.983 0.897 $103.132 1
18 95 87 0 8 46 $105.00 $31.50 $3.50 $275.297 $4.788 $0.000 $56.017 $27.530 $0.161 $0.000 $38.473 $22.917 $134.988 $47.246 $110.659 0.891 $98.581 1
19 91 84 0 7 44 $105.00 $31.50 $3.50 $264.168 $4.594 $0.000 $53.752 $26.417 $0.154 $0.000 $36.918 $22.917 $128.604 $45.011 $106.509 0.885 $94.242 1
20 87 80 0 7 42 $105.00 $31.50 $3.50 $253.488 $4.408 $0.000 $51.579 $25.349 $0.148 $0.000 $35.425 $22.917 $122.478 $42.867 $102.528 0.879 $90.104 1
21 84 77 0 7 40 $105.00 $31.50 $3.50 $243.240 $4.230 $0.000 $49.494 $24.324 $0.142 $0.000 $33.993 $22.917 $116.600 $40.810 $98.707 0.873 $86.158 1
22 81 74 0 6 39 $105.00 $31.50 $3.50 $233.407 $4.059 $0.000 $47.493 $23.341 $0.136 $0.000 $32.619 $22.917 $110.960 $38.836 $95.041 0.867 $82.396 1
23 77 71 0 6 37 $105.00 $31.50 $3.50 $223.970 $3.895 $0.000 $45.573 $22.397 $0.131 $0.000 $31.300 $22.917 $105.548 $36.942 $91.523 0.861 $78.809 1
24 74 68 0 6 36 $105.00 $31.50 $3.50 $214.916 $3.738 $0.000 $43.731 $21.492 $0.126 $0.000 $30.035 $22.917 $100.354 $35.124 $88.147 0.855 $75.388 1
25 71 65 0 6 34 $105.00 $31.50 $3.50 $206.227 $3.587 $0.000 $41.963 $20.623 $0.121 $0.000 $28.821 $22.917 $95.371 $33.380 $84.908 0.849 $72.125 1
26 68 63 0 5 33 $105.00 $31.50 $3.50 $197.890 $3.442 $0.000 $40.266 $19.789 $0.116 $0.000 $27.655 $22.917 $90.588 $31.706 $81.799 0.844 $69.014 1
27 66 60 0 5 31 $105.00 $31.50 $3.50 $189.890 $3.302 $0.000 $38.638 $18.989 $0.111 $0.000 $26.537 $22.917 $86.000 $30.100 $78.816 0.838 $66.047 1
28 63 58 0 5 30 $105.00 $31.50 $3.50 $182.213 $3.169 $0.000 $37.076 $18.221 $0.106 $0.000 $25.465 $22.917 $81.597 $28.559 $75.954 0.832 $63.217 1
29 62 57 0 5 30 $105.00 $31.50 $3.50 $178.381 $3.102 $0.000 $36.297 $17.838 $0.104 $0.000 $24.929 $22.917 $79.399 $27.790 $74.526 0.827 $61.608 1
30 60 55 0 5 29 $105.00 $31.50 $3.50 $174.630 $3.037 $0.000 $35.533 $17.463 $0.102 $0.000 $24.405 $22.917 $77.247 $27.037 $73.127 0.821 $60.042 1
31 59 54 0 5 28 $105.00 $31.50 $3.50 $170.958 $2.973 $0.000 $34.786 $17.096 $0.100 $0.000 $23.892 $22.917 $75.141 $26.299 $71.758 0.816 $58.519 1
32 58 53 0 5 28 $105.00 $31.50 $3.50 $167.363 $2.911 $0.000 $34.055 $16.736 $0.098 $0.000 $23.389 $22.917 $73.079 $25.578 $70.418 0.810 $57.037 1
33 57 52 0 5 27 $105.00 $31.50 $3.50 $163.844 $2.849 $0.000 $33.339 $16.384 $0.096 $0.000 $22.897 $22.917 $71.061 $24.871 $69.106 0.804 $55.595 1
34 55 51 0 4 27 $105.00 $31.50 $3.50 $160.399 $2.790 $0.000 $32.638 $16.040 $0.094 $0.000 $22.416 $22.917 $69.084 $24.180 $67.822 0.799 $54.192 1
35 54 50 0 4 26 $105.00 $31.50 $3.50 $157.026 $2.731 $0.000 $31.951 $15.703 $0.092 $0.000 $21.945 $22.917 $67.150 $23.502 $66.564 0.794 $52.827 1
36 53 49 0 4 25 $105.00 $31.50 $3.50 $153.724 $2.673 $0.000 $31.279 $15.372 $0.090 $0.000 $21.483 $22.917 $65.256 $22.840 $65.333 0.788 $51.499 1
37 52 48 0 4 25 $105.00 $31.50 $3.50 $150.491 $2.617 $0.000 $30.622 $15.049 $0.088 $0.000 $21.031 $22.917 $63.402 $22.191 $64.128 0.783 $50.206 1
38 51 47 0 4 24 $105.00 $31.50 $3.50 $147.327 $2.562 $0.000 $29.978 $14.733 $0.086 $0.000 $20.589 $22.917 $61.587 $21.555 $62.948 0.778 $48.949 1
39 50 46 0 4 24 $105.00 $31.50 $3.50 $144.229 $2.508 $0.000 $29.347 $14.423 $0.084 $0.000 $20.156 $22.917 $59.810 $20.933 $61.793 0.772 $47.725 1
40 49 45 0 4 23 $105.00 $31.50 $3.50 $141.196 $2.456 $0.000 $28.730 $14.120 $0.083 $0.000 $19.732 $22.917 $58.070 $20.325 $60.662 0.767 $46.534 1
minimum (breakeven) EUR and IP (flow) for the given price: minimum (breakeven) EUR and IP (flow) for the given price:
Full Cycle DUC Full Cycle DUC
Other Regions: Tuscaloosa Marine Shale My Assumptions:
Basin Characteristics Average Well Other Regions: Tuscaloosa Marine Shale Other Regions: Tuscaloosa Marine Shale
Baseline Results (2016 factor prices) Sensitivity Results (2014 factor prices, G2=133%)
Results
Capex ($1,000s) Production (boe/d) Prices Cash Flows ($1,000)
jsmith:
Constant exponential
decline begins at year 4
Page 86
Appendix B: Minimum EUR as function of price, Dynamic Cost scenario.
B-1
Midland Basin Spraberry
Northern Delaware Bone Spring
Price EUR IP EUR IP
$20 1,074 1,177 535 586
$25 915 1,002 456 500
$30 803 880 400 438
$35 719 788 358 392
$40 655 718 326 357
$45 603 661 300 329
$50 560 614 279 306
$60 494 541 246 270
$70 445 488 222 243
$80 407 446 203 222
$90 376 412 187 205
$100 350 383 174 191
Midland Basin: Spraberry
Full Cycle DUC
(Dynamic Cost scenario)
minimum (breakeven) EUR and IP (flow) for the given price:
Price EUR IP EUR IP
$20 1,089 1,611 543 803
$25 955 1,413 476 704
$30 854 1,263 426 630
$35 775 1,146 386 571
$40 712 1,053 355 525
$45 660 976 329 487
$50 616 911 307 454
$60 548 811 273 404
$70 495 732 247 365
$80 454 672 226 334
$90 420 621 209 309
$100 393 581 196 290
(Dynamic Cost scenario)
Northern Delaware Basin: Bone Springs
minimum (breakeven) EUR and IP (flow) for the given price:
Full Cycle DUC
Page 87
Appendix B: Minimum EUR as function of price, Dynamic Cost scenario.
B-2
Southern Delaware Wolfcamp
Culberson LL Wolfcamp
Price EUR IP EUR IP
$20 1,371 1,708 682 850
$25 1,227 1,529 610 760
$30 1,112 1,385 553 689
$35 1,019 1,269 507 632
$40 942 1,173 469 584
$45 878 1,094 437 544
$50 824 1,027 410 511
$60 736 917 366 456
$70 669 833 333 415
$80 615 766 306 381
$90 571 711 284 354
$100 534 665 265 330
(Dynamic Cost scenario)
minimum (breakeven) EUR and IP (flow) for the given price:
Full Cycle DUC
Southern Delaware Basin: Wolfcamp
Price EUR IP EUR IP
$20 2,870 3,597 1,425 1,786
$25 2,902 3,637 1,441 1,806
$30 2,883 3,613 1,431 1,793
$35 2,834 3,552 1,407 1,763
$40 2,770 3,471 1,375 1,723
$45 2,698 3,381 1,339 1,678
$50 2,622 3,286 1,302 1,632
$60 2,473 3,099 1,227 1,538
$70 2,332 2,922 1,158 1,451
$80 2,204 2,762 1,094 1,371
$90 2,089 2,618 1,037 1,300
$100 1,985 2,488 986 1,236
(Dynamic Cost scenario)
minimum (breakeven) EUR and IP (flow) for the given price:
Full Cycle DUC
Culberson LL: Wolfcamp
Page 88
Appendix B: Minimum EUR as function of price, Dynamic Cost scenario.
B-3
Midland Basin Wolfcamp
Southern Midland Basin Wolfcamp
Price EUR IP EUR IP
$20 1,230 1,228 612 611
$25 1,073 1,072 534 533
$30 955 954 475 474
$35 864 863 430 429
$40 792 791 394 393
$45 733 732 365 365
$50 684 683 340 340
$60 606 605 302 302
$70 547 546 272 272
$80 501 500 249 249
$90 464 463 231 231
$100 433 432 215 215
minimum (breakeven) EUR and IP (flow) for the given price:
Full Cycle DUC
Midland Basin: Wolfcamp
(Dynamic Cost scenario)
Price EUR IP EUR IP
$20 964 1,012 480 504
$25 869 912 433 455
$30 791 831 394 414
$35 727 763 362 380
$40 674 708 336 353
$45 629 660 313 329
$50 591 621 294 309
$60 528 554 263 276
$70 480 504 239 251
$80 442 464 220 231
$90 410 431 204 214
$100 383 402 191 201
(Dynamic Cost scenario)
minimum (breakeven) EUR and IP (flow) for the given price:
Full Cycle DUC
Southern Midland Basin: Wolfcamp
Page 89
Appendix B: Minimum EUR as function of price, Dynamic Cost scenario.
B-4
Eagle Ford Condensate
Eagle Ford Oil
Price EUR IP EUR IP
$20 1,449 2,473 721 1,230
$25 1,252 2,137 623 1,063
$30 1,108 1,891 551 940
$35 997 1,701 496 846
$40 910 1,553 453 773
$45 839 1,432 418 713
$50 781 1,333 388 662
$60 689 1,176 343 585
$70 620 1,058 309 527
$80 566 966 282 481
$90 523 893 260 444
$100 487 831 242 413
(Dynamic Cost scenario)
minimum (breakeven) EUR and IP (flow) for the given price:
Full Cycle DUC
Eagle Ford: Condensate Region
Price EUR IP EUR IP
$20 1,011 1,796 504 895
$25 858 1,524 428 760
$30 750 1,333 374 664
$35 671 1,192 334 593
$40 609 1,082 303 538
$45 559 993 279 496
$50 519 922 259 460
$60 456 810 227 403
$70 409 727 204 362
$80 373 663 186 330
$90 344 611 172 306
$100 320 569 160 284
(Dynamic Cost scenario)
minimum (breakeven) EUR and IP (flow) for the given price:
Full Cycle DUC
Eagle Ford: Oil Region
Page 90
Appendix B: Minimum EUR as function of price, Dynamic Cost scenario.
B-5
Eagle Ford Combo
Bakken Core
Price EUR IP EUR IP
$20 1,029 1,243 514 621
$25 1,024 1,237 511 617
$30 1,005 1,214 501 605
$35 979 1,183 488 590
$40 950 1,148 474 573
$45 921 1,113 459 555
$50 891 1,077 444 536
$60 836 1,010 416 503
$70 785 948 391 472
$80 740 894 369 446
$90 701 847 349 422
$100 666 805 331 400
(Dynamic Cost scenario)
minimum (breakeven) EUR and IP (flow) for the given price:
Full Cycle DUC
Eagle Ford:Combo Region
Price EUR IP EUR IP
$20 1,448 1,700 739 867
$25 1,259 1,478 625 734
$30 1,100 1,291 546 641
$35 982 1,153 488 573
$40 891 1,046 442 519
$45 818 960 406 477
$50 759 891 377 443
$60 667 783 331 389
$70 599 703 297 349
$80 546 641 271 318
$90 504 592 250 293
$100 469 551 233 273
Bakken: Core
minimum (breakeven) EUR and IP (flow) for the given price:
Full Cycle DUC
(Dynamic Cost scenario)
Page 91
Appendix B: Minimum EUR as function of price, Dynamic Cost scenario.
B-6
Bakken Non-Core
Springer
Price EUR IP EUR IP
$20 1,552 1,822 770 904
$25 1,255 1,473 623 731
$30 1,064 1,249 529 621
$35 931 1,093 462 542
$40 833 978 413 485
$45 756 887 375 440
$50 695 816 345 405
$60 602 707 299 351
$70 535 628 266 312
$80 485 569 241 283
$90 444 521 221 259
$100 412 484 205 241
Bakken: Non Core
minimum (breakeven) EUR and IP (flow) for the given price:
Full Cycle DUC
(Dynamic Cost scenario)
Price EUR IP EUR IP
$20 1,504 1,198 748 596
$25 1,311 1,044 652 519
$30 1,169 931 582 464
$35 1,060 844 527 420
$40 973 775 484 385
$45 902 718 449 358
$50 843 671 419 334
$60 749 597 373 297
$70 678 540 337 268
$80 622 495 309 246
$90 577 460 287 229
$100 539 429 268 213
Springer
minimum (breakeven) EUR and IP (flow) for the given price:
Full Cycle DUC
(Dynamic Cost scenario)
Page 92
Appendix B: Minimum EUR as function of price, Dynamic Cost scenario.
B-7
STACK
SCOOP Condensate
Price EUR IP EUR IP
$20 1,274 1,119 637 560
$25 1,202 1,056 600 527
$30 1,136 998 567 498
$35 1,076 946 537 472
$40 1,023 899 510 448
$45 975 857 486 427
$50 932 819 465 409
$60 859 755 428 376
$70 799 702 398 350
$80 749 658 373 328
$90 706 620 351 308
$100 669 588 333 293
STACK
minimum (breakeven) EUR and IP (flow) for the given price:
Full Cycle DUC
(Dynamic Cost scenario)
Price EUR IP EUR IP
$20 1,724 1,236 858 615
$25 1,771 1,270 880 631
$30 1,791 1,285 890 638
$35 1,795 1,287 892 640
$40 1,787 1,282 888 637
$45 1,773 1,272 881 632
$50 1,753 1,257 871 625
$60 1,706 1,224 847 607
$70 1,653 1,186 821 589
$80 1,601 1,148 795 570
$90 1,549 1,111 769 552
$100 1,500 1,076 745 534
SCOOP Condensate
minimum (breakeven) EUR and IP (flow) for the given price:
Full Cycle DUC
(Dynamic Cost scenario)
Page 93
Appendix B: Minimum EUR as function of price, Dynamic Cost scenario.
B-8
Meramec
SCOOP Oil
Price EUR IP EUR IP
$20 1,425 1,518 709 755
$25 1,425 1,518 708 754
$30 1,407 1,498 699 744
$35 1,378 1,468 684 728
$40 1,344 1,431 668 711
$45 1,309 1,394 650 692
$50 1,273 1,356 632 673
$60 1,204 1,282 598 637
$70 1,139 1,213 566 603
$80 1,081 1,151 537 572
$90 1,029 1,096 511 544
$100 982 1,046 487 519
Meramec
minimum (breakeven) EUR and IP (flow) for the given price:
Full Cycle DUC
(Dynamic Cost scenario)
Price EUR IP EUR IP
$20 1,624 1,264 808 629
$25 1,483 1,154 737 574
$30 1,366 1,063 679 528
$35 1,268 987 630 490
$40 1,186 923 590 459
$45 1,116 869 555 432
$50 1,055 821 525 409
$60 956 744 475 370
$70 877 683 436 339
$80 813 633 404 314
$90 760 592 378 294
$100 715 557 355 276
SCOOP Oil
minimum (breakeven) EUR and IP (flow) for the given price:
Full Cycle DUC
(Dynamic Cost scenario)
Page 94
Appendix B: Minimum EUR as function of price, Dynamic Cost scenario.
B-9
Cana Woodford
Mississippian
Price EUR IP EUR IP
$20 1,325 1,165 660 580
$25 1,424 1,252 708 623
$30 1,497 1,317 744 654
$35 1,552 1,365 771 678
$40 1,591 1,399 790 695
$45 1,620 1,425 804 707
$50 1,639 1,442 814 716
$60 1,657 1,457 823 724
$70 1,656 1,456 822 723
$80 1,643 1,445 816 718
$90 1,623 1,427 805 708
$100 1,597 1,405 793 697
(Dynamic Cost scenario)
minimum (breakeven) EUR and IP (flow) for the given price:
Full Cycle DUC
Cana Woodford
Price EUR IP EUR IP
$20 524 523 264 263
$25 512 511 257 256
$30 496 495 249 248
$35 478 477 240 239
$40 460 459 230 229
$45 443 442 222 221
$50 427 426 213 212
$60 397 396 198 198
$70 371 370 185 185
$80 349 348 174 174
$90 329 328 164 164
$100 312 311 156 156
Mississippian
minimum (breakeven) EUR and IP (flow) for the given price:
Full Cycle DUC
(Dynamic Cost scenario)
Page 95
Appendix B: Minimum EUR as function of price, Dynamic Cost scenario.
B-10
Marmaton
Tonkawa
Price EUR IP EUR IP
$20 462 634 234 321
$25 420 577 212 291
$30 385 529 195 268
$35 357 490 180 247
$40 333 457 168 231
$45 312 428 158 217
$50 295 405 149 205
$60 266 365 134 184
$70 243 334 123 169
$80 225 309 113 155
$90 210 288 106 146
$100 197 271 99 136
Marmaton
minimum (breakeven) EUR and IP (flow) for the given price:
Full Cycle DUC
(Dynamic Cost scenario)
Price EUR IP EUR IP
$20 545 744 275 376
$25 499 681 251 343
$30 461 629 232 317
$35 428 584 216 295
$40 401 548 202 276
$45 377 515 190 259
$50 357 487 179 244
$60 323 441 162 221
$70 297 406 149 203
$80 275 376 138 188
$90 257 351 129 176
$100 242 330 121 165
Tonkawa
minimum (breakeven) EUR and IP (flow) for the given price:
Full Cycle DUC
(Dynamic Cost scenario)
Page 96
Appendix B: Minimum EUR as function of price, Dynamic Cost scenario.
B-11
Granite Wash
Cleveland
Price EUR IP EUR IP
$20 1,149 2,092 573 1,043
$25 1,161 2,114 579 1,054
$30 1,156 2,105 576 1,049
$35 1,141 2,077 568 1,034
$40 1,120 2,039 558 1,016
$45 1,097 1,997 546 994
$50 1,072 1,952 534 972
$60 1,021 1,859 508 925
$70 973 1,771 484 881
$80 927 1,688 462 841
$90 886 1,613 441 803
$100 848 1,544 422 768
Granite Wash
minimum (breakeven) EUR and IP (flow) for the given price:
Full Cycle DUC
(Dynamic Cost scenario)
Price EUR IP EUR IP
$20 418 721 212 366
$25 410 707 207 357
$30 399 688 201 347
$35 386 666 195 336
$40 373 643 188 324
$45 360 621 181 312
$50 348 600 175 302
$60 325 560 164 283
$70 305 526 154 266
$80 288 497 145 250
$90 273 471 137 236
$100 259 447 130 224
Cleveland
minimum (breakeven) EUR and IP (flow) for the given price:
Full Cycle DUC
(Dynamic Cost scenario)
Page 97
Appendix B: Minimum EUR as function of price, Dynamic Cost scenario.
B-12
Northern Wattenberg XL
Northern Wattenberg
Price EUR IP EUR IP
$20 1,318 1,309 655 650
$25 1,144 1,136 568 564
$30 1,015 1,008 504 501
$35 916 910 455 452
$40 837 831 416 413
$45 773 768 384 381
$50 720 715 358 356
$60 636 632 316 314
$70 573 569 285 283
$80 523 519 260 258
$90 483 480 240 238
$100 450 447 224 222
(Dynamic Cost scenario)
minimum (breakeven) EUR and IP (flow) for the given price:
Full Cycle DUC
Denver Julesburg Basin: Northern Wattenberg XL
Price EUR IP EUR IP
$20 725 812 362 406
$25 627 703 314 352
$30 555 622 278 311
$35 501 561 250 280
$40 457 512 229 257
$45 422 473 211 236
$50 393 440 196 220
$60 347 389 173 194
$70 312 350 156 175
$80 285 319 143 160
$90 263 295 132 148
$100 245 275 123 138
(Dynamic Cost scenario)
minimum (breakeven) EUR and IP (flow) for the given price:
Full Cycle DUC
Denver Julesburg Basin: Northern Wattenberg
Page 98
Appendix B: Minimum EUR as function of price, Dynamic Cost scenario.
B-13
Southern Wattenberg
Greater Monument Butte
Price EUR IP EUR IP
$20 656 714 328 357
$25 600 653 300 327
$30 552 601 276 300
$35 510 555 255 278
$40 475 517 238 259
$45 445 484 222 242
$50 418 455 209 228
$60 375 408 188 205
$70 342 372 171 186
$80 314 342 157 171
$90 292 318 146 159
$100 273 297 136 148
(Dynamic Cost scenario)
minimum (breakeven) EUR and IP (flow) for the given price:
Full Cycle DUC
Denver Julesburg Basin: Southern Wattenberg
Price EUR IP EUR IP
$20 510 326 255 163
$25 389 248 196 125
$30 319 204 161 103
$35 273 174 138 88
$40 240 153 121 77
$45 215 137 109 70
$50 196 125 99 63
$60 167 107 85 54
$70 147 94 75 48
$80 132 84 67 43
$90 121 77 61 39
$100 111 71 56 36
(Dynamic Cost scenario)
minimum (breakeven) EUR and IP (flow) for the given price:
Full Cycle DUC
Uinta Basin: Greater Monument Butte/Uinta
Page 99
Appendix B: Minimum EUR as function of price, Dynamic Cost scenario.
B-14
Wasatch SXL
Uteland Butte SXL
Price EUR IP EUR IP
$20 2,760 3,985 1,372 1,981
$25 2,391 3,453 1,188 1,715
$30 2,117 3,057 1,052 1,519
$35 1,907 2,754 947 1,367
$40 1,740 2,513 864 1,248
$45 1,604 2,316 797 1,151
$50 1,491 2,153 741 1,070
$60 1,314 1,897 653 943
$70 1,182 1,707 587 848
$80 1,078 1,557 536 774
$90 995 1,437 494 713
$100 926 1,337 460 664
(Dynamic Cost scenario)
minimum (breakeven) EUR and IP (flow) for the given price:
Full Cycle DUC
Uinta Basin: Wasatch SXL
Price EUR IP EUR IP
$20 13,112 24,164 6,509 11,995
$25 6,360 11,721 3,158 5,820
$30 4,245 7,823 2,108 3,885
$35 3,214 5,923 1,596 2,941
$40 2,604 4,799 1,293 2,383
$45 2,200 4,054 1,093 2,014
$50 1,913 3,525 950 1,751
$60 1,531 2,821 760 1,401
$70 1,287 2,372 639 1,178
$80 1,118 2,060 555 1,023
$90 993 1,830 493 909
$100 896 1,651 445 820
(Dynamic Cost scenario)
minimum (breakeven) EUR and IP (flow) for the given price:
Full Cycle DUC
Uteland Butte SXL
Page 100
Appendix B: Minimum EUR as function of price, Dynamic Cost scenario.
B-15
SW PA Wet Gas
SW PA Super Rich
Price EUR IP EUR IP
$20 2,119 1,795 1,052 891
$25 2,266 1,920 1,125 953
$30 2,356 1,996 1,169 990
$35 2,403 2,036 1,193 1,011
$40 2,419 2,050 1,201 1,018
$45 2,413 2,044 1,198 1,015
$50 2,391 2,026 1,187 1,006
$60 2,319 1,965 1,151 975
$70 2,228 1,888 1,106 937
$80 2,131 1,806 1,058 896
$90 2,036 1,725 1,010 856
$100 1,944 1,647 965 818
(Dynamic Cost scenario)
minimum (breakeven) EUR and IP (flow) for the given price:
Full Cycle DUC
Appalachia Basin: SW PA Wet Gas
Price EUR IP EUR IP
$20 2,044 1,460 1,015 725
$25 2,112 1,509 1,048 749
$30 2,130 1,522 1,057 755
$35 2,116 1,512 1,050 750
$40 2,083 1,488 1,034 739
$45 2,038 1,456 1,012 723
$50 1,987 1,420 986 704
$60 1,879 1,342 933 667
$70 1,772 1,266 879 628
$80 1,672 1,195 830 593
$90 1,580 1,129 784 560
$100 1,497 1,069 743 531
(Dynamic Cost scenario)
minimum (breakeven) EUR and IP (flow) for the given price:
Full Cycle DUC
Appalachia Basin: SW PA Super Rich
Page 101
Appendix B: Minimum EUR as function of price, Dynamic Cost scenario.
B-16
Utica Wet Gas
Utica Condensate
Price EUR IP EUR IP
$20 2,447 2,447 1,216 1,216
$25 2,754 2,754 1,368 1,368
$30 3,013 3,013 1,497 1,497
$35 3,229 3,229 1,604 1,604
$40 3,408 3,408 1,692 1,692
$45 3,552 3,552 1,764 1,764
$50 3,667 3,667 1,821 1,821
$60 3,822 3,822 1,897 1,897
$70 3,898 3,898 1,935 1,935
$80 3,917 3,917 1,945 1,945
$90 3,896 3,896 1,934 1,934
$100 3,948 3,948 1,910 1,910
(Dynamic Cost scenario)
minimum (breakeven) EUR and IP (flow) for the given price:
Full Cycle DUC
Appalachia Basin: Utica Wet Gas
Price EUR IP EUR IP
$20 2,015 2,015 1,002 1,002
$25 1,984 1,984 986 986
$30 1,924 1,924 956 956
$35 1,853 1,853 921 921
$40 1,779 1,779 884 884
$45 1,706 1,706 848 848
$50 1,636 1,636 813 813
$60 1,509 1,509 750 750
$70 1,399 1,399 695 695
$80 1,305 1,305 648 648
$90 1,223 1,223 608 608
$100 1,152 1,152 572 572
(Dynamic Cost scenario)
minimum (breakeven) EUR and IP (flow) for the given price:
Full Cycle DUC
Appalachia Basin: Utica Condensate
Page 102
Appendix B: Minimum EUR as function of price, Dynamic Cost scenario.
B-17
San Juan - Gallup
Tuscaloosa Marine Shale
Price EUR IP EUR IP
$20 700 854 351 428
$25 616 751 309 377
$30 553 674 277 338
$35 504 615 252 307
$40 464 566 232 283
$45 431 526 216 263
$50 403 491 202 246
$60 360 439 180 220
$70 326 398 163 199
$80 300 366 150 183
$90 278 339 139 170
$100 260 317 130 159
(Dynamic Cost scenario)
minimum (breakeven) EUR and IP (flow) for the given price:
Full Cycle DUC
Other Regions: San Juan - Gallup
Price EUR IP EUR IP
$20 2,844 4,364 1,412 2,167
$25 2,118 3,250 1,051 1,613
$30 1,711 2,625 850 1,304
$35 1,450 2,225 720 1,105
$40 1,266 1,943 629 965
$45 1,130 1,734 561 861
$50 1,024 1,571 508 779
$60 870 1,335 432 663
$70 763 1,171 379 582
$80 683 1,048 339 520
$90 622 954 309 474
$100 572 878 284 436
(Dynamic Cost scenario)
minimum (breakeven) EUR and IP (flow) for the given price:
Full Cycle DUC
Other Regions: Tuscaloosa Marine Shale
Page 103
Appendix C: Reserve Elasticity & Drill Site Elasticity, 2014 and 2016 Cost scenarios.
C-1
Midland Basin Spraberry
min: 0.0000
median: 0.4177
mean: 0.7530
m: -0.8730
s: 1.0857
h: 1.5000
mean: 0.7530
stdev: 1.1295
a=b/e eur: 1.3590
transform: 1.0867
E[x|x>a]: 2.7145
Pr[x>a): 13.9%
Q[R|a]: 0.3762
Price EUR (x) Transform E[x|x>a] Pr[x>a) Q[R|a] Price EUR (x) Transform E[x|x>a] Pr[x>a) Q[R|a]
$20 1,981 1.43 3.614 8% 36% $20 4,161 2.12 6.649 2% 15%
2.64 $25 1,359 1.09 2.714 14% 50% 1.41 4.61 $25 2,416 1.62 4.232 5% 30% 2.94
2.04 $30 1,034 0.83 2.234 20% 60% 1.00 3.27 $30 1,702 1.29 3.213 10% 42% 1.84
1.68 $35 835 0.64 1.936 26% 67% 0.75 2.55 $35 1,314 1.06 2.648 15% 51% 1.32
1.44 $40 700 0.48 1.731 32% 73% 0.60 2.11 $40 1,070 0.87 2.288 19% 59% 1.02
1.25 $45 603 0.34 1.583 37% 77% 0.49 1.81 $45 902 0.71 2.037 24% 65% 0.83
1.12 $50 529 0.22 1.469 41% 81% 0.42 1.58 $50 780 0.58 1.852 28% 70% 0.68
0.96 $60 426 0.02 1.310 49% 86% 0.33 1.35 $60 614 0.35 1.599 36% 77% 0.54
0.81 $70 356 -0.15 1.202 56% 89% 0.25 1.13 $70 506 0.18 1.433 43% 82% 0.42
0.70 $80 306 -0.29 1.124 61% 92% 0.20 0.97 $80 430 0.03 1.316 49% 86% 0.33
0.61 $90 268 -0.41 1.066 66% 93% 0.16 0.83 $90 375 -0.10 1.231 54% 88% 0.26
0.53 $100 239 -0.51 1.022 70% 95% 0.13 0.75 $100 332 -0.21 1.164 58% 90% 0.22
Full Cycle Full CycleReserve
Elasticity
Well
Elasticity
Well
Elasticity
EUR
Distribution
Midland Basin: Spraberry
Baseline Results (2016 factor prices)
% of wells and technical recoverable reserves economic at given price:
Reserve
Elasticity
Midland Basin: Spraberry
Sensitivity Results (2014 factor prices, G2=133%)
% of wells and technical recoverable reserves economic at given price:
2.64
2.04 1.68
1.44 1.25
1.12
0.96
0.81
0.70
0.61
0.53
$0
$10
$20
$30
$40
$50
$60
$70
$80
$90
$100
0% 10% 20% 30% 40% 50% 60% 70% 80% 90% 100%
$/b
arr
el, W
TI
Percent of Drill Sites that are Economic at Given Price(elasticities to the right)
2016 factor prices 2014 factor prices
Midland Basin: Spraberry
1.41
1.000.75
0.600.49
0.42
0.33
0.25
0.20
0.16
0.13
$0
$10
$20
$30
$40
$50
$60
$70
$80
$90
$100
0% 10% 20% 30% 40% 50% 60% 70% 80% 90% 100%
$/b
arr
el, W
TI
Percent of Recoverable Resources that are Economic(elasticities to the right)
2016 factor prices 2014 factor prices
Midland Basin: Spraberry
Page 104
Appendix C: Reserve Elasticity & Drill Site Elasticity, 2014 and 2016 Cost scenarios.
C-2
Northern Delaware Bone Spring
min: 0.0000
median: 0.3750
mean: 0.6760
m: -0.9809
s: 1.0857
h: 1.5000
mean: 0.6760
stdev: 1.0140
a=b/e eur: 1.3590
transform: 1.1860
E[x|x>a]: 2.6398
Pr[x>a): 11.8%
Q[R|a]: 0.3110
Price EUR (x) Transform E[x|x>a] Pr[x>a) Q[R|a] Price EUR (x) Transform E[x|x>a] Pr[x>a) Q[R|a]
$20 2,067 1.57 3.655 6% 31% $20 4,686 2.33 7.257 1% 11%
2.66 $25 1,448 1.24 2.769 11% 44% 1.48 4.93 $25 2,711 1.82 4.558 3% 23% 3.28
2.13 $30 1,115 1.00 2.283 16% 53% 1.09 3.57 $30 1,907 1.50 3.428 7% 34% 2.11
1.78 $35 907 0.81 1.974 21% 61% 0.85 2.81 $35 1,471 1.26 2.802 10% 43% 1.54
1.56 $40 764 0.66 1.759 26% 67% 0.70 2.33 $40 1,198 1.07 2.405 14% 51% 1.20
1.38 $45 660 0.52 1.602 30% 71% 0.58 2.02 $45 1,010 0.91 2.127 18% 57% 0.99
1.24 $50 581 0.40 1.482 34% 75% 0.50 1.78 $50 873 0.78 1.923 22% 62% 0.83
1.08 $60 469 0.21 1.310 42% 81% 0.41 1.53 $60 687 0.56 1.643 29% 70% 0.67
0.93 $70 393 0.04 1.192 48% 85% 0.32 1.29 $70 566 0.38 1.459 35% 76% 0.52
0.81 $80 338 -0.10 1.107 54% 88% 0.26 1.11 $80 482 0.23 1.330 41% 80% 0.42
0.71 $90 297 -0.21 1.044 59% 90% 0.21 0.99 $90 419 0.10 1.232 46% 84% 0.35
0.63 $100 265 -0.32 0.994 63% 92% 0.17 0.88 $100 371 -0.01 1.158 50% 86% 0.29
EUR
Distribution
North Delaware Bone Spring North Delaware Bone Spring
Baseline Results (2016 factor prices) Sensitivity Results (2014 factor prices, G2=133%)
% of wells and technical recoverable reserves economic at given price: % of wells and technical recoverable reserves economic at given price:
Well
Elasticity
Full Cycle Reserve
Elasticity
Well
Elasticity
Full Cycle Reserve
Elasticity
2.66
2.13 1.78
1.56 1.38
1.24
1.08
0.93
0.81
0.71
0.63
$0
$10
$20
$30
$40
$50
$60
$70
$80
$90
$100
0% 10% 20% 30% 40% 50% 60% 70% 80% 90% 100%
$/b
arr
el, W
TI
Percent of Drill Sites that are Economic at Given Price(elasticities to the right)
2016 factor prices 2014 factor prices
North Delaware Bone Spring
1.48
1.090.85
0.700.58
0.50
0.41
0.32
0.26
0.21
0.17
$0
$10
$20
$30
$40
$50
$60
$70
$80
$90
$100
0% 10% 20% 30% 40% 50% 60% 70% 80% 90% 100%
$/b
arr
el, W
TI
Percent of Recoverable Resources that are Economic(elasticities to the right)
2016 factor prices 2014 factor prices
North Delaware Bone Spring
Page 105
Appendix C: Reserve Elasticity & Drill Site Elasticity, 2014 and 2016 Cost scenarios.
C-3
Southern Delaware Wolfcamp
min: 0.0000
median: 0.4898
mean: 0.8830
m: -0.7138
s: 1.0857
h: 1.5000
mean: 0.8830
stdev: 1.3245
a=b/e eur: 1.3590
transform: 0.9400
E[x|x>a]: 2.8376
Pr[x>a): 17.4%
Q[R|a]: 0.4926
Price EUR (x) Transform E[x|x>a] Pr[x>a) Q[R|a] Price EUR (x) Transform E[x|x>a] Pr[x>a) Q[R|a]
$20 2,601 1.54 4.634 6% 33% $20 5,872 2.29 9.143 1% 11%
2.46 $25 1,868 1.23 3.583 11% 44% 1.36 4.63 $25 3,525 1.82 5.931 3% 23% 3.05
2.01 $30 1,458 1.00 2.984 16% 53% 1.03 3.43 $30 2,518 1.51 4.516 7% 34% 2.02
1.72 $35 1,195 0.82 2.594 21% 60% 0.82 2.74 $35 1,959 1.28 3.715 10% 42% 1.50
1.52 $40 1,012 0.67 2.319 25% 66% 0.68 2.30 $40 1,603 1.09 3.197 14% 50% 1.19
1.35 $45 878 0.54 2.117 30% 71% 0.58 2.00 $45 1,356 0.94 2.833 17% 56% 0.99
1.22 $50 776 0.42 1.961 34% 75% 0.49 1.78 $50 1,175 0.81 2.564 21% 61% 0.84
1.08 $60 629 0.23 1.736 41% 80% 0.41 1.53 $60 928 0.59 2.192 28% 69% 0.68
0.93 $70 529 0.07 1.581 47% 84% 0.32 1.30 $70 767 0.41 1.948 34% 75% 0.53
0.82 $80 456 -0.07 1.469 53% 88% 0.26 1.14 $80 653 0.26 1.773 40% 79% 0.43
0.72 $90 401 -0.18 1.384 57% 90% 0.22 1.00 $90 569 0.14 1.643 45% 83% 0.36
0.65 $100 358 -0.29 1.317 61% 92% 0.18 0.90 $100 504 0.03 1.543 49% 86% 0.30
EUR
Distribution
South Delaware Wolfcamp South Delaware Wolfcamp
Baseline Results (2016 factor prices) Sensitivity Results (2014 factor prices, G2=133%)
% of wells and technical recoverable reserves economic at given price: % of wells and technical recoverable reserves economic at given price:
Well
Elasticity
Full Cycle Reserve
Elasticity
Well
Elasticity
Full Cycle Reserve
Elasticity
2.46 2.01
1.72 1.52
1.35 1.22
1.08
0.93
0.82
0.72
0.65
$0
$10
$20
$30
$40
$50
$60
$70
$80
$90
$100
0% 10% 20% 30% 40% 50% 60% 70% 80% 90% 100%
$/b
arr
el, W
TI
Percent of Drill Sites that are Economic at Given Price(elasticities to the right)
2016 factor prices 2014 factor prices
South Delaware Wolfcamp
1.36
1.030.82
0.680.58
0.49
0.41
0.32
0.26
0.22
0.18
$0
$10
$20
$30
$40
$50
$60
$70
$80
$90
$100
0% 10% 20% 30% 40% 50% 60% 70% 80% 90% 100%
$/b
arr
el, W
TI
Percent of Recoverable Resources that are Economic(elasticities to the right)
2016 factor prices 2014 factor prices
South Delaware Wolfcamp
Page 106
Appendix C: Reserve Elasticity & Drill Site Elasticity, 2014 and 2016 Cost scenarios.
C-4
Culberson LL Wolfcamp
min: 0.0000
median: 1.0844
mean: 1.9550
m: 0.0811
s: 1.0857
h: 1.5000
mean: 1.9550
stdev: 2.9325
a=b/e eur: 1.3590
transform: 0.2079
E[x|x>a]: 3.7913
Pr[x>a): 41.8%
Q[R|a]: 1.5835
Price EUR (x) Transform E[x|x>a] Pr[x>a) Q[R|a] Price EUR (x) Transform E[x|x>a] Pr[x>a) Q[R|a]
$20 5,787 1.54 10.299 6% 32% $20 15,643 2.46 23.791 1% 8%
1.60 $25 4,708 1.35 8.759 9% 39% 0.89 3.91 $25 10,647 2.10 17.048 2% 15% 2.61
1.50 $30 3,969 1.20 7.691 12% 46% 0.80 3.17 $30 8,101 1.85 13.544 3% 22% 1.97
1.42 $35 3,430 1.06 6.903 14% 51% 0.72 2.75 $35 6,527 1.65 11.345 5% 29% 1.63
1.34 $40 3,020 0.94 6.299 17% 56% 0.66 2.43 $40 5,466 1.49 9.843 7% 34% 1.38
1.27 $45 2,698 0.84 5.821 20% 60% 0.60 2.20 $45 4,701 1.35 8.749 9% 40% 1.21
1.21 $50 2,437 0.75 5.430 23% 63% 0.55 2.01 $50 4,124 1.23 7.916 11% 44% 1.07
1.13 $60 2,043 0.58 4.837 28% 69% 0.49 1.80 $60 3,311 1.03 6.728 15% 52% 0.92
1.03 $70 1,759 0.45 4.405 33% 74% 0.42 1.59 $70 2,766 0.86 5.922 19% 59% 0.76
0.95 $80 1,544 0.33 4.076 37% 78% 0.37 1.43 $80 2,375 0.72 5.337 24% 64% 0.65
0.88 $90 1,376 0.22 3.818 41% 81% 0.33 1.30 $90 2,081 0.60 4.894 27% 69% 0.57
0.82 $100 1,241 0.12 3.609 45% 83% 0.29 1.20 $100 1,852 0.49 4.547 31% 72% 0.50
EUR
Distribution
Culberson LL Wolfcamp Culberson LL Wolfcamp
Baseline Results (2016 factor prices) Sensitivity Results (2014 factor prices, G2=133%)
% of wells and technical recoverable reserves economic at given price: % of wells and technical recoverable reserves economic at given price:
Well
Elasticity
Full Cycle Reserve
Elasticity
Well
Elasticity
Full Cycle Reserve
Elasticity
1.60
1.50 1.42
1.34 1.27
1.21
1.13
1.03
0.95
0.88
0.82
$0
$10
$20
$30
$40
$50
$60
$70
$80
$90
$100
0% 10% 20% 30% 40% 50% 60% 70% 80% 90% 100%
$/b
arr
el, W
TI
Percent of Drill Sites that are Economic at Given Price(elasticities to the right)
2016 factor prices 2014 factor prices
Culberson LL Wolfcamp
0.890.80
0.720.66
0.600.55
0.49
0.42
0.37
0.33
0.29
$0
$10
$20
$30
$40
$50
$60
$70
$80
$90
$100
0% 10% 20% 30% 40% 50% 60% 70% 80% 90% 100%
$/b
arr
el, W
TI
Percent of Recoverable Resources that are Economic(elasticities to the right)
2016 factor prices 2014 factor prices
Culberson LL Wolfcamp
Page 107
Appendix C: Reserve Elasticity & Drill Site Elasticity, 2014 and 2016 Cost scenarios.
C-5
Midland Basin Wolfcamp
min: 0.0000
median: 0.4138
mean: 0.7460
m: -0.8824
s: 1.0857
h: 1.5000
mean: 0.7460
stdev: 1.1190
a=b/e eur: 1.3590
transform: 1.0953
E[x|x>a]: 2.7077
Pr[x>a): 13.7%
Q[R|a]: 0.3701
Price EUR (x) Transform E[x|x>a] Pr[x>a) Q[R|a] Price EUR (x) Transform E[x|x>a] Pr[x>a) Q[R|a]
$20 2,362 1.60 4.148 5% 30% $20 5,496 2.38 8.445 1% 10%
2.78 $25 1,635 1.27 3.109 10% 43% 1.56 5.19 $25 3,091 1.85 5.168 3% 22% 3.51
2.20 $30 1,250 1.02 2.548 15% 53% 1.13 3.70 $30 2,151 1.52 3.849 6% 33% 2.20
1.84 $35 1,012 0.82 2.195 21% 60% 0.88 2.90 $35 1,649 1.27 3.130 10% 43% 1.59
1.59 $40 850 0.66 1.952 25% 66% 0.72 2.40 $40 1,337 1.08 2.675 14% 50% 1.24
1.40 $45 733 0.53 1.775 30% 71% 0.60 2.06 $45 1,124 0.92 2.362 18% 57% 1.01
1.26 $50 644 0.41 1.639 34% 75% 0.51 1.81 $50 970 0.78 2.132 22% 62% 0.85
1.09 $60 519 0.21 1.447 42% 81% 0.41 1.55 $60 761 0.56 1.817 29% 70% 0.68
0.94 $70 434 0.04 1.316 48% 85% 0.32 1.31 $70 626 0.38 1.612 35% 76% 0.53
0.82 $80 373 -0.10 1.222 54% 88% 0.26 1.13 $80 532 0.23 1.467 41% 80% 0.42
0.72 $90 327 -0.22 1.151 59% 90% 0.21 1.00 $90 462 0.10 1.359 46% 84% 0.35
0.63 $100 292 -0.32 1.097 63% 92% 0.17 0.88 $100 409 -0.01 1.277 50% 86% 0.29
EUR
Distribution
Midland Basin Wolfcamp Midland Basin Wolfcamp
Baseline Results (2016 factor prices) Sensitivity Results (2014 factor prices, G2=133%)
% of wells and technical recoverable reserves economic at given price: % of wells and technical recoverable reserves economic at given price:
Well
Elasticity
Full Cycle Reserve
Elasticity
Well
Elasticity
Full Cycle Reserve
Elasticity
2.78
2.20 1.84
1.59 1.40
1.26
1.09
0.94
0.82
0.72
0.63
$0
$10
$20
$30
$40
$50
$60
$70
$80
$90
$100
0% 10% 20% 30% 40% 50% 60% 70% 80% 90% 100%
$/b
arr
el, W
TI
Percent of Drill Sites that are Economic at Given Price(elasticities to the right)
2016 factor prices 2014 factor prices
Midland Basin Wolfcamp
1.561.13
0.880.72
0.600.51
0.41
0.32
0.26
0.21
0.17
$0
$10
$20
$30
$40
$50
$60
$70
$80
$90
$100
0% 10% 20% 30% 40% 50% 60% 70% 80% 90% 100%
$/b
arr
el, W
TI
Percent of Recoverable Resources that are Economic(elasticities to the right)
2014 factor prices normal factor prices
Midland Basin Wolfcamp
Page 108
Appendix C: Reserve Elasticity & Drill Site Elasticity, 2014 and 2016 Cost scenarios.
C-6
Southern Midland Basin Wolfcamp
min: 0.0000
median: 0.2774
mean: 0.5000
m: -1.2825
s: 1.0857
h: 1.5000
mean: 0.5000
stdev: 0.7500
a=b/e eur: 1.3590
transform: 1.4638
E[x|x>a]: 2.4620
Pr[x>a): 7.2%
Q[R|a]: 0.1763
Price EUR (x) Transform E[x|x>a] Pr[x>a) Q[R|a] Price EUR (x) Transform E[x|x>a] Pr[x>a) Q[R|a]
$20 1,888 1.77 3.208 4% 25% $20 4,667 2.60 6.971 0% 6%
2.75 $25 1,348 1.46 2.446 7% 36% 1.60 5.37 $25 2,675 2.09 4.295 2% 16% 3.76
2.27 $30 1,048 1.22 2.015 11% 44% 1.23 3.97 $30 1,875 1.76 3.190 4% 25% 2.47
1.95 $35 857 1.04 1.736 15% 52% 1.00 3.16 $35 1,443 1.52 2.582 6% 33% 1.84
1.71 $40 726 0.89 1.542 19% 58% 0.83 2.65 $40 1,173 1.33 2.195 9% 40% 1.46
1.55 $45 629 0.75 1.397 23% 63% 0.72 2.31 $45 988 1.17 1.927 12% 47% 1.21
1.41 $50 555 0.64 1.286 26% 67% 0.62 2.04 $50 854 1.04 1.731 15% 52% 1.03
1.25 $60 449 0.44 1.125 33% 74% 0.52 1.77 $60 671 0.81 1.460 21% 61% 0.85
1.07 $70 378 0.29 1.016 39% 79% 0.41 1.51 $70 553 0.64 1.283 26% 67% 0.68
0.96 $80 326 0.15 0.936 44% 83% 0.35 1.33 $80 470 0.49 1.157 31% 73% 0.56
0.88 $90 286 0.03 0.875 49% 85% 0.30 1.18 $90 409 0.36 1.064 36% 77% 0.47
0.79 $100 255 -0.08 0.827 53% 88% 0.25 1.07 $100 362 0.25 0.992 40% 80% 0.40
Baseline Results (2016 factor prices) Sensitivity Results (2014 factor prices, G2=133%)
% of wells and technical recoverable reserves economic at given price: % of wells and technical recoverable reserves economic at given price:
Well
Elasticity
Full Cycle Reserve
Elasticity
Well
Elasticity
Full Cycle Reserve
Elasticity
EUR
Distribution
Southern Midland Basin Wolfcamp Southern Midland Basin Wolfcamp
2.75
2.27 1.95
1.71 1.55
1.41
1.25
1.07
0.96
0.88
0.79
$0
$10
$20
$30
$40
$50
$60
$70
$80
$90
$100
0% 10% 20% 30% 40% 50% 60% 70% 80% 90% 100%
$/b
arr
el, W
TI
Percent of Drill Sites that are Economic at Given Price(elasticities to the right)
2016 factor prices 2014 factor prices
Southern Midland Basin Wolfcamp
1.60
1.231.00
0.830.72
0.62
0.52
0.41
0.35
0.30
0.25
$0
$10
$20
$30
$40
$50
$60
$70
$80
$90
$100
0% 10% 20% 30% 40% 50% 60% 70% 80% 90% 100%
$/b
arr
el, W
TI
Percent of Recoverable Resources that are Economic(elasticities to the right)
2016 factor prices 2014 factor prices
Southern Midland Basin Wolfcamp
Page 109
Appendix C: Reserve Elasticity & Drill Site Elasticity, 2014 and 2016 Cost scenarios.
C-7
Eagle Ford Condensate
min: 0.0000
median: 0.4443
mean: 0.8010
m: -0.8112
s: 1.0857
h: 1.5000
mean: 0.8010
stdev: 1.2015
a=b/e eur: 1.3590
transform: 1.0298
E[x|x>a]: 2.7603
Pr[x>a): 15.2%
Q[R|a]: 0.4184
Price EUR (x) Transform E[x|x>a] Pr[x>a) Q[R|a] Price EUR (x) Transform E[x|x>a] Pr[x>a) Q[R|a]
$20 3,014 1.76 5.125 4% 25% $20 9,143 2.79 13.364 0% 4%
3.30 $25 1,985 1.38 3.669 8% 38% 1.93 6.82 $25 4,190 2.07 6.750 2% 16% 5.14
2.52 $30 1,480 1.11 2.938 13% 49% 1.33 4.64 $30 2,717 1.67 4.708 5% 28% 2.90
2.06 $35 1,180 0.90 2.496 18% 57% 1.01 3.45 $35 2,011 1.39 3.707 8% 38% 1.97
1.75 $40 981 0.73 2.199 23% 64% 0.81 2.77 $40 1,596 1.18 3.107 12% 46% 1.48
1.54 $45 839 0.59 1.985 28% 69% 0.67 2.33 $45 1,323 1.01 2.707 16% 53% 1.18
1.35 $50 734 0.46 1.825 32% 73% 0.56 2.02 $50 1,130 0.86 2.421 19% 59% 0.97
1.18 $60 586 0.25 1.598 40% 80% 0.46 1.71 $60 874 0.62 2.038 27% 68% 0.77
0.99 $70 488 0.09 1.447 47% 84% 0.35 1.41 $70 713 0.44 1.793 33% 74% 0.59
0.86 $80 418 -0.06 1.339 52% 87% 0.28 1.21 $80 602 0.28 1.623 39% 79% 0.47
0.75 $90 366 -0.18 1.258 57% 90% 0.23 1.06 $90 521 0.15 1.498 44% 83% 0.38
0.68 $100 325 -0.29 1.195 61% 92% 0.19 0.95 $100 459 0.03 1.402 49% 85% 0.32
Baseline Results (2016 factor prices) Sensitivity Results (2014 factor prices, G2=133%)
% of wells and technical recoverable reserves economic at given price: % of wells and technical recoverable reserves economic at given price:
Well
Elasticity
Full Cycle Reserve
Elasticity
Well
Elasticity
Full Cycle Reserve
Elasticity
EUR
Distribution
Eagle Ford Condensate Region Eagle Ford Condensate Region
3.30
2.52 2.06
1.75 1.54
1.35
1.18
0.99
0.86
0.75
0.68
$0
$10
$20
$30
$40
$50
$60
$70
$80
$90
$100
0% 10% 20% 30% 40% 50% 60% 70% 80% 90% 100%
$/b
arr
el, W
TI
Percent of Drill Sites that are Economic at Given Price(elasticities to the right)
2016 factor prices 2014 factor prices
Eagle Ford Condensate Region
1.93
1.331.01
0.810.67
0.56
0.46
0.35
0.28
0.23
0.19
$0
$10
$20
$30
$40
$50
$60
$70
$80
$90
$100
0% 10% 20% 30% 40% 50% 60% 70% 80% 90% 100%
$/b
arr
el, W
TI
Percent of Recoverable Resources that are Economic(elasticities to the right)
2016 factor prices 2014 factor prices
Eagle Ford Condensate Region
Page 110
Appendix C: Reserve Elasticity & Drill Site Elasticity, 2014 and 2016 Cost scenarios.
C-8
Eagle Ford Oil
min: 0.0000
median: 0.2857
mean: 0.5150
m: -1.2529
s: 1.0857
h: 1.5000
mean: 0.5150
stdev: 0.7725
a=b/e eur: 1.3590
transform: 1.4366
E[x|x>a]: 2.4776
Pr[x>a): 7.5%
Q[R|a]: 0.1868
Price EUR (x) Transform E[x|x>a] Pr[x>a) Q[R|a] Price EUR (x) Transform E[x|x>a] Pr[x>a) Q[R|a]
$20 2,048 1.81 3.448 3% 23% $20 5,645 2.75 8.286 0% 5%
3.43 $25 1,336 1.42 2.445 8% 37% 2.03 6.61 $25 2,681 2.06 4.322 2% 16% 4.92
2.61 $30 991 1.15 1.946 13% 48% 1.40 4.54 $30 1,758 1.67 3.043 5% 28% 2.83
2.12 $35 788 0.93 1.648 17% 56% 1.05 3.42 $35 1,307 1.40 2.403 8% 38% 1.95
1.80 $40 654 0.76 1.449 22% 63% 0.84 2.75 $40 1,041 1.19 2.019 12% 46% 1.47
1.57 $45 559 0.62 1.306 27% 68% 0.69 2.32 $45 865 1.02 1.762 15% 53% 1.17
1.40 $50 488 0.49 1.198 31% 72% 0.59 2.02 $50 740 0.88 1.577 19% 58% 0.97
1.20 $60 390 0.29 1.048 39% 79% 0.47 1.71 $60 574 0.64 1.328 26% 67% 0.77
1.03 $70 324 0.12 0.946 45% 83% 0.37 1.42 $70 469 0.46 1.169 32% 74% 0.59
0.87 $80 278 -0.03 0.875 51% 87% 0.29 1.23 $80 396 0.30 1.057 38% 78% 0.48
0.78 $90 243 -0.15 0.821 56% 89% 0.24 1.07 $90 343 0.17 0.976 43% 82% 0.39
0.69 $100 216 -0.26 0.779 60% 91% 0.20 0.94 $100 303 0.05 0.914 48% 85% 0.32
Baseline Results (2016 factor prices) Sensitivity Results (2014 factor prices, G2=133%)
% of wells and technical recoverable reserves economic at given price: % of wells and technical recoverable reserves economic at given price:
Well
Elasticity
Full Cycle Reserve
Elasticity
Well
Elasticity
Full Cycle Reserve
Elasticity
EUR
Distribution
Eagle Ford Oil Region Eagle Ford Oil Region
3.43
2.61 2.12
1.80 1.57
1.40
1.20
1.03
0.87
0.78
0.69
$0
$10
$20
$30
$40
$50
$60
$70
$80
$90
$100
0% 10% 20% 30% 40% 50% 60% 70% 80% 90% 100%
$/b
arr
el, W
TI
Percent of Drill Sites that are Economic at Given Price(elasticities to the right)
2016 factor prices 2014 factor prices
Eagle Ford Oil Region
2.03
1.401.05
0.840.69
0.59
0.47
0.37
0.29
0.24
0.20
$0
$10
$20
$30
$40
$50
$60
$70
$80
$90
$100
0% 10% 20% 30% 40% 50% 60% 70% 80% 90% 100%
$/b
arr
el, W
TI
Percent of Recoverable Resourcs that are Economic (elasticities to the right)
2016 factor prices 2014 factor prices
Eagle Ford Oil Region
Page 111
Appendix C: Reserve Elasticity & Drill Site Elasticity, 2014 and 2016 Cost scenarios.
C-9
Eagle Ford Combo
min: 0.0000
median: 0.4981
mean: 0.8980
m: -0.6969
s: 1.0857
h: 1.5000
mean: 0.8980
stdev: 1.3470
a=b/e eur: 1.3590
transform: 0.9245
E[x|x>a]: 2.8516
Pr[x>a): 17.8%
Q[R|a]: 0.5065
Price EUR (x) Transform E[x|x>a] Pr[x>a) Q[R|a] Price EUR (x) Transform E[x|x>a] Pr[x>a) Q[R|a]
$20 1,923 1.24 3.678 11% 44% $20 4,193 1.96 6.874 2% 19%
1.34 $25 1,579 1.06 3.176 14% 51% 0.69 2.72 $25 3,088 1.68 5.338 5% 28% 1.65
1.25 $30 1,340 0.91 2.823 18% 57% 0.61 2.33 $30 2,444 1.47 4.426 7% 35% 1.33
1.19 $35 1,163 0.78 2.560 22% 62% 0.55 2.07 $35 2,022 1.29 3.821 10% 42% 1.12
1.11 $40 1,028 0.67 2.357 25% 66% 0.50 1.86 $40 1,724 1.14 3.388 13% 48% 0.97
1.06 $45 921 0.57 2.195 29% 70% 0.45 1.70 $45 1,503 1.02 3.064 15% 53% 0.85
1.00 $50 834 0.47 2.063 32% 73% 0.41 1.57 $50 1,333 0.91 2.813 18% 57% 0.76
0.93 $60 702 0.32 1.861 38% 78% 0.36 1.42 $60 1,086 0.72 2.444 24% 64% 0.66
0.85 $70 606 0.18 1.713 43% 82% 0.31 1.26 $70 916 0.56 2.188 29% 70% 0.55
0.78 $80 533 0.06 1.601 48% 85% 0.27 1.13 $80 793 0.43 2.000 33% 74% 0.46
0.71 $90 476 -0.04 1.512 52% 87% 0.23 1.04 $90 698 0.31 1.855 38% 78% 0.40
0.67 $100 429 -0.14 1.440 55% 89% 0.21 0.95 $100 624 0.21 1.741 42% 81% 0.35
Baseline Results (2016 factor prices) Sensitivity Results (2014 factor prices, G2=133%)
% of wells and technical recoverable reserves economic at given price: % of wells and technical recoverable reserves economic at given price:
Well
Elasticity
Full Cycle Reserve
Elasticity
Well
Elasticity
Full Cycle Reserve
Elasticity
EUR
Distribution
Eagle Ford Combo Region Eagle Ford Combo Region
1.34
1.25 1.19
1.11 1.06
1.00
0.93
0.85
0.78
0.71
0.67
$0
$10
$20
$30
$40
$50
$60
$70
$80
$90
$100
0% 10% 20% 30% 40% 50% 60% 70% 80% 90% 100%
$/b
arr
el, W
TI
Percent of Drill Sites that are Economic at Given Price(elasticities to the right)
2016 factor prices 2014 factor prices
Eagle Ford Combo Region
0.69
0.610.55
0.500.45
0.41
0.36
0.31
0.27
0.23
0.21
$0
$10
$20
$30
$40
$50
$60
$70
$80
$90
$100
0% 10% 20% 30% 40% 50% 60% 70% 80% 90% 100%
$/b
arr
el, W
TI
Percent of Recoverable Resources that are Economic (elasticities to the right)
2016 factor prices 2014 factor prices
Eagle Ford Combo Region
Page 112
Appendix C: Reserve Elasticity & Drill Site Elasticity, 2014 and 2016 Cost scenarios.
C-10
Bakken Core
min: 0.0000
median: 0.4022
mean: 0.7250
m: -0.9109
s: 1.0857
h: 1.5000
mean: 0.7250
stdev: 1.0875
a=b/e eur: 1.3590
transform: 1.1216
E[x|x>a]: 2.6875
Pr[x>a): 13.1%
Q[R|a]: 0.3521
Price EUR (x) Transform E[x|x>a] Pr[x>a) Q[R|a] Price EUR (x) Transform E[x|x>a] Pr[x>a) Q[R|a]
$20 2,970 1.84 4.975 3% 22% $20 7,767 2.73 11.428 0% 5%
3.44 $25 1,946 1.45 3.535 7% 36% 2.04 6.42 $25 3,819 2.07 6.145 2% 16% 4.73
2.62 $30 1,448 1.18 2.817 12% 46% 1.42 4.46 $30 2,532 1.69 4.364 5% 27% 2.78
2.15 $35 1,152 0.97 2.383 17% 55% 1.08 3.38 $35 1,894 1.43 3.461 8% 37% 1.94
1.83 $40 957 0.80 2.094 21% 61% 0.86 2.75 $40 1,513 1.22 2.912 11% 45% 1.48
1.61 $45 818 0.65 1.885 26% 67% 0.72 2.34 $45 1,259 1.05 2.541 15% 51% 1.19
1.42 $50 715 0.53 1.729 30% 71% 0.60 2.04 $50 1,078 0.91 2.274 18% 57% 0.99
1.23 $60 571 0.32 1.509 37% 78% 0.49 1.72 $60 838 0.68 1.915 25% 66% 0.79
1.05 $70 475 0.15 1.361 44% 82% 0.38 1.45 $70 685 0.49 1.683 31% 72% 0.61
0.92 $80 406 0.01 1.255 50% 86% 0.31 1.25 $80 579 0.34 1.521 37% 77% 0.49
0.80 $90 355 -0.11 1.176 55% 89% 0.25 1.09 $90 502 0.20 1.403 42% 81% 0.40
0.71 $100 316 -0.22 1.116 59% 90% 0.21 0.98 $100 443 0.09 1.312 46% 84% 0.34
Baseline Results (2016 factor prices) Sensitivity Results (2014 factor prices, G2=133%)
% of wells and technical recoverable reserves economic at given price: % of wells and technical recoverable reserves economic at given price:
Well
Elasticity
Full Cycle Reserve
Elasticity
Well
Elasticity
Full Cycle Reserve
Elasticity
EUR
Distribution
Bakken Core Bakken Core
3.44
2.62 2.15
1.83 1.61
1.42
1.23
1.05
0.92
0.80
0.71
$0
$10
$20
$30
$40
$50
$60
$70
$80
$90
$100
0% 10% 20% 30% 40% 50% 60% 70% 80% 90% 100%
$/b
arr
el, W
TI
Percent of Drill Sites that are Economic at Given Price(elasticities to the right)
2016 factor prices 2014 factor prices
Bakken Core
2.04
1.421.08
0.860.72
0.60
0.49
0.38
0.31
0.25
0.21
$0
$10
$20
$30
$40
$50
$60
$70
$80
$90
$100
0% 10% 20% 30% 40% 50% 60% 70% 80% 90% 100%
$/b
arr
el, W
TI
Percent of Recoverable Reserves that are Economic(elasticities to the right)
2016 factor prices 2014 factor prices
Bakken Core
Page 113
Appendix C: Reserve Elasticity & Drill Site Elasticity, 2014 and 2016 Cost scenarios.
C-11
Bakken Non-Core
min: 0.0000
median: 0.3095
mean: 0.5580
m: -1.1727
s: 1.0857
h: 1.5000
mean: 0.5580
stdev: 0.8370
a=b/e eur: 1.3590
transform: 1.3627
E[x|x>a]: 2.5219
Pr[x>a): 8.6%
Q[R|a]: 0.2181
Price EUR (x) Transform E[x|x>a] Pr[x>a) Q[R|a] Price EUR (x) Transform E[x|x>a] Pr[x>a) Q[R|a]
$20 3,787 2.31 5.881 1% 11% $20 35,582 4.37 45.918 0% 0%
5.16 $25 2,101 1.76 3.572 4% 25% 3.45 8.97 $25 5,338 2.62 7.951 0% 6% 8.85
3.63 $30 1,454 1.42 2.658 8% 37% 2.11 7.04 $30 2,886 2.06 4.657 2% 17% 5.00
2.80 $35 1,112 1.18 2.165 12% 46% 1.50 4.89 $35 1,977 1.71 3.398 4% 27% 3.04
2.31 $40 900 0.98 1.854 16% 54% 1.16 3.72 $40 1,504 1.46 2.730 7% 36% 2.14
1.97 $45 756 0.82 1.640 21% 60% 0.93 3.03 $45 1,213 1.26 2.311 10% 43% 1.64
1.72 $50 652 0.69 1.484 25% 66% 0.78 2.56 $50 1,017 1.10 2.026 14% 50% 1.32
1.47 $60 511 0.46 1.271 32% 73% 0.62 2.11 $60 768 0.84 1.658 20% 60% 1.03
1.23 $70 420 0.28 1.132 39% 79% 0.48 1.72 $70 617 0.64 1.432 26% 67% 0.77
1.05 $80 357 0.13 1.034 45% 83% 0.38 1.45 $80 516 0.47 1.279 32% 73% 0.61
0.93 $90 310 0.00 0.962 50% 86% 0.31 1.27 $90 443 0.33 1.167 37% 77% 0.50
0.82 $100 274 -0.11 0.906 54% 88% 0.26 1.13 $100 388 0.21 1.082 42% 81% 0.42
Baseline Results (2016 factor prices) Sensitivity Results (2014 factor prices, G2=133%)
% of wells and technical recoverable reserves economic at given price: % of wells and technical recoverable reserves economic at given price:
Well
Elasticity
Full Cycle Reserve
Elasticity
Well
Elasticity
Full Cycle Reserve
Elasticity
EUR
Distribution
Bakken Non Core Bakken Non Core
5.16
3.63 2.80
2.31 1.97
1.72
1.47
1.23
1.05
0.93
0.82
$0
$10
$20
$30
$40
$50
$60
$70
$80
$90
$100
0% 10% 20% 30% 40% 50% 60% 70% 80% 90% 100%
$/b
arr
el, W
TI
Percent of Drill Sites that are Economic at Given Price(elasticities to the right)
2016 factor prices 2014 factor prices
Bakken Non Core
3.45
2.111.50
1.160.93
0.78
0.62
0.48
0.38
0.31
0.26
$0
$10
$20
$30
$40
$50
$60
$70
$80
$90
$100
0% 10% 20% 30% 40% 50% 60% 70% 80% 90% 100%
$/b
arr
el, W
TI
Percent of Recoverable Resources that are Economic(elasticities to the right)
2016 factor prices 2014 factor prices
Bakken Non Core
Page 114
Appendix C: Reserve Elasticity & Drill Site Elasticity, 2014 and 2016 Cost scenarios.
C-12
Springer
min: 0.0000
median: 0.5014
mean: 0.9040
m: -0.6903
s: 1.0857
h: 1.5000
mean: 0.9040
stdev: 1.3560
a=b/e eur: 1.3590
transform: 0.9183
E[x|x>a]: 2.8572
Pr[x>a): 17.9%
Q[R|a]: 0.5121
Price EUR (x) Transform E[x|x>a] Pr[x>a) Q[R|a] Price EUR (x) Transform E[x|x>a] Pr[x>a) Q[R|a]
$20 2,655 1.54 4.733 6% 33% $20 5,052 2.13 8.059 2% 15%
2.45 $25 1,911 1.23 3.666 11% 44% 1.35 3.94 $25 3,246 1.72 5.566 4% 26% 2.50
2.00 $30 1,493 1.00 3.055 16% 53% 1.02 3.03 $30 2,391 1.44 4.357 8% 36% 1.75
1.72 $35 1,225 0.82 2.658 21% 60% 0.82 2.48 $35 1,893 1.22 3.640 11% 45% 1.34
1.50 $40 1,039 0.67 2.379 25% 66% 0.68 2.13 $40 1,566 1.05 3.163 15% 51% 1.09
1.35 $45 902 0.54 2.172 29% 71% 0.58 1.87 $45 1,336 0.90 2.823 18% 57% 0.91
1.22 $50 797 0.43 2.012 33% 75% 0.50 1.67 $50 1,165 0.78 2.568 22% 62% 0.78
1.08 $60 646 0.23 1.780 41% 80% 0.41 1.46 $60 927 0.57 2.210 29% 70% 0.64
0.92 $70 544 0.08 1.623 47% 84% 0.32 1.25 $70 770 0.40 1.971 35% 76% 0.51
0.82 $80 469 -0.06 1.507 52% 87% 0.27 1.10 $80 658 0.25 1.799 40% 80% 0.42
0.72 $90 413 -0.18 1.420 57% 90% 0.22 0.97 $90 575 0.13 1.671 45% 83% 0.35
0.66 $100 368 -0.29 1.351 61% 91% 0.19 0.88 $100 510 0.02 1.570 49% 86% 0.30
Baseline Results (2016 factor prices) Sensitivity Results (2014 factor prices, G2=133%)
% of wells and technical recoverable reserves economic at given price: % of wells and technical recoverable reserves economic at given price:
Well
Elasticity
Full Cycle Reserve
Elasticity
Well
Elasticity
Full Cycle Reserve
Elasticity
EUR
Distribution
Springer Springer
2.45
2.00 1.72
1.50 1.35
1.22
1.08
0.92
0.82
0.72
0.66
$0
$10
$20
$30
$40
$50
$60
$70
$80
$90
$100
0% 10% 20% 30% 40% 50% 60% 70% 80% 90% 100%
$/b
arr
el, W
TI
Percent of Drill Sites that are Economic at Given Price(elasticities to the right)
2016 factor prices 2014 factor prices
Springer
1.35
1.020.82
0.680.58
0.50
0.41
0.32
0.27
0.22
0.19
$0
$10
$20
$30
$40
$50
$60
$70
$80
$90
$100
0% 10% 20% 30% 40% 50% 60% 70% 80% 90% 100%
$/b
arr
el, W
TI
Percent of Recoverable Resources that are Economic(elasticities to the right)
2016 factor prices 2014 factor prices
Springer
Page 115
Appendix C: Reserve Elasticity & Drill Site Elasticity, 2014 and 2016 Cost scenarios.
C-13
STACK
min: 0.0000
median: 0.5214
mean: 0.9400
m: -0.6512
s: 1.0857
h: 1.5000
mean: 0.9400
stdev: 1.4100
a=b/e eur: 1.3590
transform: 0.8824
E[x|x>a]: 2.8906
Pr[x>a): 18.9%
Q[R|a]: 0.5457
Price EUR (x) Transform E[x|x>a] Pr[x>a) Q[R|a] Price EUR (x) Transform E[x|x>a] Pr[x>a) Q[R|a]
$20 1,927 1.20 3.725 11% 45% $20 2,829 1.56 5.018 6% 32%
1.19 $25 1,612 1.04 3.265 15% 52% 0.61 1.54 $25 2,326 1.38 4.301 8% 39% 0.85
1.15 $30 1,385 0.90 2.929 18% 57% 0.56 1.46 $30 1,976 1.23 3.796 11% 44% 0.78
1.09 $35 1,215 0.78 2.676 22% 62% 0.51 1.39 $35 1,717 1.10 3.419 14% 50% 0.71
1.05 $40 1,082 0.67 2.476 25% 66% 0.47 1.32 $40 1,518 0.98 3.126 16% 54% 0.65
1.00 $45 975 0.58 2.314 28% 69% 0.43 1.26 $45 1,360 0.88 2.892 19% 58% 0.61
0.96 $50 887 0.49 2.181 31% 72% 0.40 1.21 $50 1,232 0.79 2.701 21% 62% 0.56
0.90 $60 752 0.34 1.974 37% 77% 0.36 1.13 $60 1,037 0.63 2.408 26% 67% 0.50
0.83 $70 653 0.21 1.822 42% 81% 0.31 1.04 $70 896 0.50 2.194 31% 72% 0.44
0.77 $80 577 0.09 1.705 46% 84% 0.27 0.97 $80 788 0.38 2.030 35% 76% 0.39
0.71 $90 517 -0.01 1.612 50% 86% 0.23 0.90 $90 704 0.28 1.901 39% 79% 0.34
0.67 $100 468 -0.10 1.536 54% 88% 0.21 0.84 $100 636 0.18 1.796 43% 82% 0.31
Baseline Results (2016 factor prices) Sensitivity Results (2014 factor prices, G2=133%)
% of wells and technical recoverable reserves economic at given price: % of wells and technical recoverable reserves economic at given price:
Well
Elasticity
Full Cycle Reserve
Elasticity
Well
Elasticity
Full Cycle Reserve
Elasticity
EUR
Distribution
STACK STACK
1.19
1.15 1.09
1.05 1.00
0.96
0.90
0.83
0.77
0.71
0.67
$0
$10
$20
$30
$40
$50
$60
$70
$80
$90
$100
0% 10% 20% 30% 40% 50% 60% 70% 80% 90% 100%
$/b
arr
el, W
TI
Percent of Drill Sites that are Economic at Given Price(elasticities to the right)
2016 factor prices 2014 factor prices
STACK
0.61
0.560.51
0.470.43
0.40
0.36
0.31
0.27
0.23
0.21
$0
$10
$20
$30
$40
$50
$60
$70
$80
$90
$100
0% 10% 20% 30% 40% 50% 60% 70% 80% 90% 100%
$/b
arr
el, W
TI
Percent of Recoverable Resources that are Economic(elasticities to the right)
2016 factor prices 2014 factor prices
STACK
Page 116
Appendix C: Reserve Elasticity & Drill Site Elasticity, 2014 and 2016 Cost scenarios.
C-14
SCOOP Condensate
min: 0.0000
median: 1.0828
mean: 1.9520
m: 0.0795
s: 1.0857
h: 1.5000
mean: 1.9520
stdev: 2.9280
a=b/e eur: 1.3590
transform: 0.2093
E[x|x>a]: 3.7887
Pr[x>a): 41.7%
Q[R|a]: 1.5803
Price EUR (x) Transform E[x|x>a] Pr[x>a) Q[R|a] Price EUR (x) Transform E[x|x>a] Pr[x>a) Q[R|a]
$20 2,692 0.84 5.809 20% 60% $20 4,131 1.23 7.923 11% 44%
0.56 $25 2,439 0.75 5.431 23% 63% 0.25 0.78 $25 3,689 1.13 7.280 13% 48% 0.40
0.59 $30 2,229 0.67 5.115 25% 66% 0.26 0.82 $30 3,333 1.04 6.758 15% 52% 0.41
0.61 $35 2,053 0.59 4.849 28% 69% 0.26 0.84 $35 3,040 0.95 6.326 17% 55% 0.41
0.62 $40 1,903 0.52 4.622 30% 71% 0.26 0.85 $40 2,794 0.87 5.961 19% 58% 0.40
0.63 $45 1,773 0.45 4.424 32% 74% 0.25 0.85 $45 2,585 0.80 5.649 21% 61% 0.39
0.63 $50 1,659 0.39 4.249 35% 76% 0.25 0.85 $50 2,405 0.74 5.380 23% 64% 0.38
0.62 $60 1,471 0.28 3.961 39% 79% 0.24 0.84 $60 2,111 0.61 4.937 27% 68% 0.37
0.61 $70 1,322 0.18 3.732 43% 82% 0.22 0.82 $70 1,881 0.51 4.588 31% 72% 0.34
0.59 $80 1,200 0.09 3.543 46% 84% 0.21 0.80 $80 1,696 0.41 4.306 34% 75% 0.32
0.58 $90 1,098 0.01 3.386 49% 86% 0.19 0.77 $90 1,544 0.33 4.073 37% 78% 0.30
0.55 $100 1,013 -0.06 3.254 52% 87% 0.18 0.74 $100 1,418 0.25 3.880 40% 80% 0.27
Baseline Results (2016 factor prices) Sensitivity Results (2014 factor prices, G2=133%)
% of wells and technical recoverable reserves economic at given price: % of wells and technical recoverable reserves economic at given price:
Well
Elasticity
Full Cycle Reserve
Elasticity
Well
Elasticity
Full Cycle Reserve
Elasticity
EUR
Distribution
SCOOP Condensate SCOOP Condensate
0.56
0.59 0.61
0.62 0.63
0.63
0.62
0.61
0.59
0.58
0.55
$0
$10
$20
$30
$40
$50
$60
$70
$80
$90
$100
0% 10% 20% 30% 40% 50% 60% 70% 80% 90% 100%
$/b
arr
el, W
TI
Percent of Drill Sites that are Economic at Given Price(elasticities to the right)
2016 factor prices 2014 factor prices
SCOOP Condensate
0.25
0.260.26
0.260.25
0.25
0.24
0.22
0.21
0.19
0.18
$0
$10
$20
$30
$40
$50
$60
$70
$80
$90
$100
0% 10% 20% 30% 40% 50% 60% 70% 80% 90% 100%
$/b
arr
el, W
TI
Percent of Recoverable Resources that are Economic(elasticities to the right)
2016 factor prices 2014 factor prices
SCOOP Condensate
Page 117
Appendix C: Reserve Elasticity & Drill Site Elasticity, 2014 and 2016 Cost scenarios.
C-15
Meramec
min: 0.0000
median: 0.7422
mean: 1.3380
m: -0.2982
s: 1.0857
h: 1.5000
mean: 1.3380
stdev: 2.0070
a=b/e eur: 1.3590
transform: 0.5572
E[x|x>a]: 3.2507
Pr[x>a): 28.9%
Q[R|a]: 0.9385
Price EUR (x) Transform E[x|x>a] Pr[x>a) Q[R|a] Price EUR (x) Transform E[x|x>a] Pr[x>a) Q[R|a]
$20 2,450 1.10 4.875 14% 49% $20 4,419 1.64 7.697 5% 29%
1.03 $25 2,086 0.95 4.339 17% 55% 0.51 1.72 $25 3,574 1.45 6.499 7% 36% 0.97
1.01 $30 1,816 0.82 3.938 20% 60% 0.47 1.61 $30 3,000 1.29 5.675 10% 42% 0.87
0.97 $35 1,609 0.71 3.628 24% 65% 0.44 1.51 $35 2,585 1.15 5.072 13% 47% 0.79
0.95 $40 1,443 0.61 3.378 27% 68% 0.41 1.42 $40 2,271 1.03 4.612 15% 52% 0.72
0.91 $45 1,309 0.52 3.175 30% 71% 0.38 1.35 $45 2,025 0.92 4.249 18% 56% 0.66
0.88 $50 1,197 0.44 3.004 33% 74% 0.36 1.28 $50 1,827 0.83 3.955 20% 60% 0.60
0.83 $60 1,023 0.30 2.738 38% 79% 0.32 1.19 $60 1,529 0.67 3.508 25% 66% 0.54
0.77 $70 893 0.17 2.538 43% 82% 0.28 1.10 $70 1,314 0.53 3.182 30% 71% 0.47
0.72 $80 792 0.06 2.382 48% 85% 0.25 1.01 $80 1,152 0.40 2.935 34% 75% 0.41
0.67 $90 712 -0.04 2.258 52% 87% 0.22 0.94 $90 1,025 0.30 2.741 38% 78% 0.36
0.62 $100 647 -0.13 2.157 55% 89% 0.19 0.87 $100 924 0.20 2.585 42% 81% 0.32
EUR
Distribution
Meramec Meramec
Baseline Results (2016 factor prices) Sensitivity Results (2014 factor prices, G2=133%)
% of wells and technical recoverable reserves economic at given price: % of wells and technical recoverable reserves economic at given price:
Well
Elasticity
Full Cycle Reserve
Elasticity
Well
Elasticity
Full Cycle Reserve
Elasticity
1.03
1.01 0.97
0.95 0.91
0.88
0.83
0.77
0.72
0.67
0.62
$0
$10
$20
$30
$40
$50
$60
$70
$80
$90
$100
0% 10% 20% 30% 40% 50% 60% 70% 80% 90% 100%
$/b
arr
el, W
TI
Percent of Drill Sites that are Economic at Given Price(elasticities to the right)
2016 factor prices 2014 factor prices
Meramec
0.510.47
0.440.41
0.380.36
0.32
0.28
0.25
0.22
0.19
$0
$10
$20
$30
$40
$50
$60
$70
$80
$90
$100
0% 10% 20% 30% 40% 50% 60% 70% 80% 90% 100%
$/b
arr
el, W
TI
Percent of Recoverable Resources that are Economic(elasticities to the right)
2016 factor prices 2014 factor prices
Meramec
Page 118
Appendix C: Reserve Elasticity & Drill Site Elasticity, 2014 and 2016 Cost scenarios.
C-16
SCOOP Oil
min: 0.0000
median: 0.5431
mean: 0.9790
m: -0.6106
s: 1.0857
h: 1.5000
mean: 0.9790
stdev: 1.4685
a=b/e eur: 1.3590
transform: 0.8449
E[x|x>a]: 2.9266
Pr[x>a): 19.9%
Q[R|a]: 0.5826
Price EUR (x) Transform E[x|x>a] Pr[x>a) Q[R|a] Price EUR (x) Transform E[x|x>a] Pr[x>a) Q[R|a]
$20 2,630 1.45 4.776 7% 36% $20 4,269 1.90 7.077 3% 21%
1.77 $25 2,069 1.23 3.970 11% 44% 0.96 2.50 $25 3,207 1.64 5.595 5% 29% 1.50
1.60 $30 1,705 1.05 3.438 15% 51% 0.82 2.19 $30 2,568 1.43 4.688 8% 36% 1.24
1.46 $35 1,450 0.90 3.062 18% 57% 0.71 1.95 $35 2,142 1.26 4.075 10% 43% 1.05
1.35 $40 1,261 0.78 2.780 22% 62% 0.63 1.78 $40 1,837 1.12 3.632 13% 49% 0.92
1.25 $45 1,116 0.66 2.562 25% 66% 0.56 1.64 $45 1,608 1.00 3.296 16% 53% 0.82
1.16 $50 1,001 0.56 2.389 29% 70% 0.50 1.53 $50 1,429 0.89 3.031 19% 58% 0.73
1.06 $60 830 0.39 2.128 35% 76% 0.43 1.38 $60 1,170 0.71 2.644 24% 65% 0.63
0.95 $70 709 0.25 1.942 40% 80% 0.36 1.23 $70 990 0.55 2.372 29% 70% 0.53
0.87 $80 618 0.12 1.802 45% 83% 0.31 1.12 $80 858 0.42 2.171 34% 75% 0.45
0.79 $90 548 0.01 1.694 50% 86% 0.26 1.01 $90 758 0.31 2.018 38% 78% 0.39
0.71 $100 493 -0.09 1.609 54% 88% 0.23 0.94 $100 678 0.20 1.895 42% 81% 0.35
EUR
Distribution
SCOOP Oil SCOOP Oil
Baseline Results (2016 factor prices) Sensitivity Results (2014 factor prices, G2=133%)
% of wells and technical recoverable reserves economic at given price: % of wells and technical recoverable reserves economic at given price:
Well
Elasticity
Full Cycle Reserve
Elasticity
Well
Elasticity
Full Cycle Reserve
Elasticity
1.77
1.60 1.46
1.35 1.25
1.16
1.06
0.95
0.87
0.79
0.71
$0
$10
$20
$30
$40
$50
$60
$70
$80
$90
$100
0% 10% 20% 30% 40% 50% 60% 70% 80% 90% 100%
$/b
arr
el, W
TI
Percent of Drill Sites that are Economic at Given Price(elasticities to the right)
2016 factor prices 2014 factor prices
SCOOP Oil
0.96
0.820.71
0.630.56
0.50
0.43
0.36
0.31
0.26
0.23
$0
$10
$20
$30
$40
$50
$60
$70
$80
$90
$100
0% 10% 20% 30% 40% 50% 60% 70% 80% 90% 100%
$/b
arr
el, W
TI
Percent of Recoverable Resources that are Economic(elasticities to the right)
2016 factor prices 2014 factor prices
SCOOP Oil
Page 119
Appendix C: Reserve Elasticity & Drill Site Elasticity, 2014 and 2016 Cost scenarios.
C-17
Cana Woodford
min: 0.0000
median: 1.0129
mean: 1.8260
m: 0.0128
s: 1.0857
h: 1.5000
mean: 1.8260
stdev: 2.7390
a=b/e eur: 1.3590
transform: 0.2708
E[x|x>a]: 3.6792
Pr[x>a): 39.3%
Q[R|a]: 1.4470
Price EUR (x) Transform E[x|x>a] Pr[x>a) Q[R|a] Price EUR (x) Transform E[x|x>a] Pr[x>a) Q[R|a]
$20 2,277 0.75 5.073 23% 63% $20 4,104 1.29 7.758 10% 42%
0.42 $25 2,106 0.67 4.816 25% 66% 0.19 0.74 $25 3,697 1.19 7.168 12% 46% 0.39
0.46 $30 1,959 0.61 4.594 27% 68% 0.20 0.79 $30 3,364 1.11 6.683 13% 49% 0.40
0.48 $35 1,831 0.55 4.400 29% 71% 0.20 0.81 $35 3,086 1.03 6.275 15% 52% 0.41
0.50 $40 1,719 0.49 4.230 31% 73% 0.21 0.83 $40 2,850 0.95 5.927 17% 55% 0.41
0.52 $45 1,620 0.43 4.079 33% 74% 0.21 0.84 $45 2,648 0.89 5.627 19% 58% 0.40
0.53 $50 1,531 0.38 3.943 35% 76% 0.21 0.84 $50 2,473 0.82 5.367 21% 60% 0.39
0.53 $60 1,381 0.29 3.713 39% 79% 0.20 0.85 $60 2,183 0.71 4.932 24% 65% 0.38
0.54 $70 1,257 0.20 3.522 42% 81% 0.20 0.83 $70 1,955 0.61 4.588 27% 68% 0.36
0.53 $80 1,154 0.12 3.363 45% 83% 0.19 0.81 $80 1,770 0.51 4.308 30% 72% 0.34
0.53 $90 1,066 0.05 3.227 48% 85% 0.18 0.80 $90 1,616 0.43 4.073 33% 74% 0.32
0.51 $100 991 -0.02 3.111 51% 87% 0.17 0.77 $100 1,487 0.35 3.876 36% 77% 0.30
EUR
Distribution
Cana Woodford Cana Woodford
Baseline Results (2016 factor prices) Sensitivity Results (2014 factor prices, G2=133%)
% of wells and technical recoverable reserves economic at given price: % of wells and technical recoverable reserves economic at given price:
Well
Elasticity
Full Cycle Reserve
Elasticity
Well
Elasticity
Full Cycle Reserve
Elasticity
0.42
0.46 0.48
0.50 0.52
0.53
0.53
0.54
0.53
0.53
0.51
$0
$10
$20
$30
$40
$50
$60
$70
$80
$90
$100
0% 10% 20% 30% 40% 50% 60% 70% 80% 90% 100%
$/b
arr
el, W
TI
Percent of Drill Sites that are Economic at Given Price(elasticities to the right)
2016 factor prices 2014 factor prices
Cana Woodford
0.190.20
0.200.21
0.210.21
0.20
0.20
0.19
0.18
0.17
$0
$10
$20
$30
$40
$50
$60
$70
$80
$90
$100
0% 10% 20% 30% 40% 50% 60% 70% 80% 90% 100%
$/b
arr
el, W
TI
Percent of Recoverable Resources that are Economic(elasticities to the right)
2016 factor prices 2014 factor prices
Cana Woodford
Page 120
Appendix C: Reserve Elasticity & Drill Site Elasticity, 2014 and 2016 Cost scenarios.
C-18
Mississippian
min: 0.0000
median: 0.2274
mean: 0.4100
m: -1.4809
s: 1.0857
h: 1.5000
mean: 0.4100
stdev: 0.6150
a=b/e eur: 1.3590
transform: 1.6466
E[x|x>a]: 2.3654
Pr[x>a): 5.0%
Q[R|a]: 0.1178
Price EUR (x) Transform E[x|x>a] Pr[x>a) Q[R|a] Price EUR (x) Transform E[x|x>a] Pr[x>a) Q[R|a]
$20 931 1.30 1.756 10% 42% $20 1,799 1.90 2.979 3% 21%
1.39 $25 763 1.11 1.512 13% 49% 0.72 2.44 $25 1,363 1.65 2.371 5% 29% 1.46
1.31 $30 646 0.96 1.340 17% 55% 0.65 2.15 $30 1,097 1.45 1.994 7% 36% 1.22
1.23 $35 560 0.83 1.212 20% 60% 0.58 1.93 $35 918 1.29 1.737 10% 42% 1.05
1.15 $40 495 0.72 1.115 24% 64% 0.52 1.77 $40 789 1.15 1.550 13% 48% 0.92
1.10 $45 443 0.61 1.036 27% 68% 0.48 1.63 $45 692 1.02 1.408 15% 52% 0.82
1.04 $50 401 0.52 0.973 30% 71% 0.44 1.53 $50 616 0.92 1.295 18% 57% 0.74
0.97 $60 337 0.36 0.875 36% 77% 0.39 1.39 $60 505 0.73 1.130 23% 64% 0.64
0.87 $70 291 0.23 0.804 41% 80% 0.33 1.24 $70 428 0.58 1.014 28% 69% 0.54
0.80 $80 256 0.11 0.750 46% 84% 0.28 1.12 $80 372 0.45 0.929 33% 74% 0.46
0.73 $90 229 0.01 0.709 50% 86% 0.24 1.05 $90 328 0.34 0.861 37% 77% 0.41
0.68 $100 207 -0.09 0.675 53% 88% 0.22 0.95 $100 294 0.24 0.809 41% 80% 0.35
EUR
Distribution
Mississippian Mississippian
Baseline Results (2016 factor prices) Sensitivity Results (2014 factor prices, G2=133%)
% of wells and technical recoverable reserves economic at given price: % of wells and technical recoverable reserves economic at given price:
Well
Elasticity
Full Cycle Reserve
Elasticity
Well
Elasticity
Full Cycle Reserve
Elasticity
1.39
1.31 1.23
1.15 1.10
1.04
0.97
0.87
0.80
0.73
0.68
$0
$10
$20
$30
$40
$50
$60
$70
$80
$90
$100
0% 10% 20% 30% 40% 50% 60% 70% 80% 90% 100%
$/b
arr
el, W
TI
Percent of Drill Sites that are Economic at Given Price(elasticities to the right)
2016 factor prices 2014 factor prices
Mississippian
0.72
0.650.58
0.520.48
0.44
0.39
0.33
0.28
0.24
0.22
$0
$10
$20
$30
$40
$50
$60
$70
$80
$90
$100
0% 10% 20% 30% 40% 50% 60% 70% 80% 90% 100%
$/b
arr
el, W
TI
Percent of Recoverable Resources that are Economic(elasticities to the right)
2016 factor prices 2014 factor prices
Mississippian
Page 121
Appendix C: Reserve Elasticity & Drill Site Elasticity, 2014 and 2016 Cost scenarios.
C-19
Marmaton
min: 0.0000
median: 0.1115
mean: 0.2010
m: -2.1938
s: 1.0857
h: 1.5000
mean: 0.2010
stdev: 0.3015
a=b/e eur: 1.3590
transform: 2.3032
E[x|x>a]: 2.1114
Pr[x>a): 1.1%
Q[R|a]: 0.0225
Price EUR (x) Transform E[x|x>a] Pr[x>a) Q[R|a] Price EUR (x) Transform E[x|x>a] Pr[x>a) Q[R|a]
$20 771 1.78 1.306 4% 24% $20 1,326 2.28 2.067 1% 12%
2.19 $25 595 1.54 1.059 6% 32% 1.28 3.20 $25 959 1.98 1.567 2% 19% 2.06
1.94 $30 485 1.35 0.902 9% 39% 1.08 2.74 $30 751 1.76 1.279 4% 25% 1.67
1.77 $35 409 1.20 0.792 12% 46% 0.94 2.42 $35 617 1.58 1.090 6% 31% 1.41
1.62 $40 354 1.06 0.712 14% 51% 0.82 2.17 $40 524 1.43 0.958 8% 37% 1.22
1.51 $45 312 0.95 0.650 17% 55% 0.74 2.00 $45 455 1.30 0.859 10% 42% 1.08
1.41 $50 279 0.84 0.601 20% 60% 0.67 1.82 $50 403 1.18 0.783 12% 46% 0.95
1.27 $60 231 0.67 0.529 25% 66% 0.58 1.68 $60 327 0.99 0.672 16% 54% 0.84
1.19 $70 196 0.52 0.476 30% 71% 0.51 1.50 $70 275 0.83 0.595 20% 60% 0.72
1.04 $80 171 0.39 0.438 35% 76% 0.42 1.33 $80 238 0.70 0.539 24% 65% 0.60
0.95 $90 152 0.29 0.409 39% 79% 0.36 1.26 $90 209 0.58 0.496 28% 69% 0.55
0.93 $100 136 0.18 0.384 43% 82% 0.34 1.13 $100 187 0.48 0.462 32% 73% 0.47
EUR
Distribution
Marmaton Marmaton
Baseline Results (2016 factor prices) Sensitivity Results (2014 factor prices, G2=133%)
% of wells and technical recoverable reserves economic at given price: % of wells and technical recoverable reserves economic at given price:
Well
Elasticity
Full Cycle Reserve
Elasticity
Well
Elasticity
Full Cycle Reserve
Elasticity
2.19
1.94 1.77
1.62 1.51
1.41
1.27
1.19
1.04
0.95
0.93
$0
$10
$20
$30
$40
$50
$60
$70
$80
$90
$100
0% 10% 20% 30% 40% 50% 60% 70% 80% 90% 100%
$/b
arr
el, W
TI
Percent of Drill Sites that are Economic at Given Price(elasticities to the right)
2016 factor prices 2014 factor prices
Marmaton
1.28
1.080.94
0.820.74
0.67
0.58
0.51
0.42
0.36
0.34
$0
$10
$20
$30
$40
$50
$60
$70
$80
$90
$100
0% 10% 20% 30% 40% 50% 60% 70% 80% 90% 100%
$/b
arr
el, W
TI
Percent of Recoverable Resources that are Economic(elasticities to the right)
2016 factor prices 2014 factor prices
Marmaton
Page 122
Appendix C: Reserve Elasticity & Drill Site Elasticity, 2014 and 2016 Cost scenarios.
C-20
Tonkawa
min: 0.0000
median: 0.1381
mean: 0.2490
m: -1.9796
s: 1.0857
h: 1.5000
mean: 0.2490
stdev: 0.3735
a=b/e eur: 1.3590
transform: 2.1060
E[x|x>a]: 2.1754
Pr[x>a): 1.8%
Q[R|a]: 0.0383
Price EUR (x) Transform E[x|x>a] Pr[x>a) Q[R|a] Price EUR (x) Transform E[x|x>a] Pr[x>a) Q[R|a]
$20 901 1.73 1.543 4% 26% $20 1,525 2.21 2.401 1% 13%
2.04 $25 705 1.50 1.266 7% 34% 1.18 2.96 $25 1,125 1.93 1.854 3% 20% 1.88
1.84 $30 579 1.32 1.086 9% 41% 1.01 2.57 $30 891 1.72 1.529 4% 26% 1.55
1.69 $35 491 1.17 0.958 12% 47% 0.89 2.29 $35 738 1.54 1.313 6% 32% 1.32
1.55 $40 427 1.04 0.865 15% 52% 0.78 2.08 $40 630 1.40 1.159 8% 38% 1.15
1.47 $45 377 0.92 0.791 18% 56% 0.71 1.91 $45 550 1.27 1.044 10% 43% 1.02
1.36 $50 338 0.82 0.733 20% 60% 0.64 1.81 $50 487 1.16 0.953 12% 47% 0.94
1.25 $60 280 0.65 0.646 26% 67% 0.56 1.60 $60 398 0.97 0.822 16% 54% 0.80
1.13 $70 239 0.51 0.584 31% 72% 0.48 1.46 $70 336 0.82 0.730 21% 61% 0.69
1.02 $80 209 0.38 0.538 35% 76% 0.41 1.32 $80 291 0.69 0.663 25% 66% 0.59
0.97 $90 185 0.27 0.501 39% 79% 0.37 1.24 $90 256 0.57 0.610 28% 70% 0.53
0.89 $100 166 0.17 0.472 43% 82% 0.32 1.12 $100 229 0.47 0.569 32% 73% 0.46
EUR
Distribution
Tonkawa Tonkawa
Baseline Results (2016 factor prices) Sensitivity Results (2014 factor prices, G2=133%)
% of wells and technical recoverable reserves economic at given price: % of wells and technical recoverable reserves economic at given price:
Well
Elasticity
Full Cycle Reserve
Elasticity
Well
Elasticity
Full Cycle Reserve
Elasticity
2.04
1.84 1.69
1.55 1.47
1.36
1.25
1.13
1.02
0.97
0.89
$0
$10
$20
$30
$40
$50
$60
$70
$80
$90
$100
0% 10% 20% 30% 40% 50% 60% 70% 80% 90% 100%
$/b
arr
el, W
TI
Percent of Drill Sites that are Economic at Given Price(elasticities to the right)
2016 factor prices 2014 factor prices
Tonkawa
1.18
1.010.89
0.780.71
0.64
0.56
0.48
0.41
0.37
0.32
$0
$10
$20
$30
$40
$50
$60
$70
$80
$90
$100
0% 10% 20% 30% 40% 50% 60% 70% 80% 90% 100%
$/b
arr
el, W
TI
Percent of Recoverable Resources that are Economic(elasticities to the right)
2016 factor prices 2014 factor prices
Tonkawa
Page 123
Appendix C: Reserve Elasticity & Drill Site Elasticity, 2014 and 2016 Cost scenarios.
C-21
Granite Wash
min: 0.0000
median: 0.4083
mean: 0.7360
m: -0.8959
s: 1.0857
h: 1.5000
mean: 0.7360
stdev: 1.1040
a=b/e eur: 1.3590
transform: 1.1077
E[x|x>a]: 2.6981
Pr[x>a): 13.4%
Q[R|a]: 0.3615
Price EUR (x) Transform E[x|x>a] Pr[x>a) Q[R|a] Price EUR (x) Transform E[x|x>a] Pr[x>a) Q[R|a]
$20 1,964 1.45 3.572 7% 36% $20 3,518 1.98 5.746 2% 18%
1.11 $25 1,696 1.31 3.187 9% 41% 0.60 1.80 $25 2,899 1.81 4.889 4% 24% 1.10
1.12 $30 1,492 1.19 2.892 12% 46% 0.59 1.74 $30 2,466 1.66 4.283 5% 28% 1.02
1.11 $35 1,332 1.09 2.659 14% 50% 0.57 1.68 $35 2,145 1.53 3.830 6% 33% 0.96
1.10 $40 1,203 1.00 2.469 16% 54% 0.54 1.61 $40 1,898 1.42 3.478 8% 37% 0.89
1.07 $45 1,097 0.91 2.312 18% 57% 0.52 1.55 $45 1,702 1.32 3.196 9% 41% 0.84
1.05 $50 1,008 0.83 2.180 20% 60% 0.49 1.49 $50 1,543 1.22 2.966 11% 44% 0.79
1.02 $60 867 0.69 1.969 24% 65% 0.46 1.42 $60 1,300 1.07 2.612 14% 51% 0.73
0.97 $70 761 0.57 1.809 28% 70% 0.42 1.33 $70 1,123 0.93 2.351 18% 56% 0.65
0.92 $80 678 0.47 1.682 32% 73% 0.38 1.25 $80 989 0.81 2.151 21% 61% 0.59
0.87 $90 612 0.37 1.582 35% 76% 0.34 1.19 $90 883 0.71 1.993 24% 65% 0.54
0.84 $100 557 0.29 1.497 39% 79% 0.32 1.12 $100 798 0.62 1.865 27% 68% 0.49
EUR
Distribution
Granite Wash Granite Wash
Baseline Results (2016 factor prices) Sensitivity Results (2014 factor prices, G2=133%)
% of wells and technical recoverable reserves economic at given price: % of wells and technical recoverable reserves economic at given price:
Well
Elasticity
Full Cycle Reserve
Elasticity
Well
Elasticity
Full Cycle Reserve
Elasticity
1.11
1.12 1.11
1.10 1.07
1.05
1.02
0.97
0.92
0.87
0.84
$0
$10
$20
$30
$40
$50
$60
$70
$80
$90
$100
0% 10% 20% 30% 40% 50% 60% 70% 80% 90% 100%
$/b
arr
el, W
TI
Percent of Drill Sites that are Economic at Given Price(elasticities to the right)
2016 factor prices 2014 factor prices
Granite Wash
0.600.59
0.570.54
0.520.49
0.46
0.42
0.38
0.34
0.32
$0
$10
$20
$30
$40
$50
$60
$70
$80
$90
$100
0% 10% 20% 30% 40% 50% 60% 70% 80% 90% 100%
$/b
arr
el, W
TI
Percent of Recoverable Resources that are Economic(elasticities to the right)
2016 factor prices 2014 factor prices
Granite Wash
Page 124
Appendix C: Reserve Elasticity & Drill Site Elasticity, 2014 and 2016 Cost scenarios.
C-22
Cleveland
min: 0.0000
median: 0.1287
mean: 0.2320
m: -2.0503
s: 1.0857
h: 1.5000
mean: 0.2320
stdev: 0.3480
a=b/e eur: 1.3590
transform: 2.1711
E[x|x>a]: 2.1533
Pr[x>a): 1.5%
Q[R|a]: 0.0322
Price EUR (x) Transform E[x|x>a] Pr[x>a) Q[R|a] Price EUR (x) Transform E[x|x>a] Pr[x>a) Q[R|a]
$20 701 1.56 1.242 6% 32% $20 1,225 2.08 1.971 2% 16%
1.38 $25 589 1.40 1.083 8% 38% 0.77 2.14 $25 979 1.87 1.632 3% 22% 1.32
1.34 $30 508 1.26 0.966 10% 43% 0.72 2.01 $30 815 1.70 1.403 4% 27% 1.19
1.29 $35 447 1.15 0.878 13% 48% 0.67 1.87 $35 699 1.56 1.240 6% 32% 1.08
1.25 $40 399 1.04 0.807 15% 52% 0.63 1.79 $40 611 1.43 1.114 8% 36% 1.00
1.22 $45 360 0.95 0.750 17% 55% 0.60 1.69 $45 543 1.33 1.017 9% 40% 0.92
1.18 $50 328 0.86 0.702 19% 59% 0.56 1.60 $50 489 1.23 0.939 11% 44% 0.85
1.11 $60 279 0.71 0.629 24% 65% 0.51 1.50 $60 408 1.06 0.821 14% 51% 0.77
1.03 $70 243 0.59 0.575 28% 69% 0.45 1.41 $70 349 0.92 0.734 18% 57% 0.69
0.98 $80 215 0.47 0.532 32% 73% 0.41 1.28 $80 306 0.80 0.670 21% 61% 0.60
0.92 $90 193 0.37 0.499 35% 76% 0.36 1.22 $90 272 0.69 0.619 25% 65% 0.55
0.87 $100 175 0.28 0.471 39% 79% 0.33 1.14 $100 245 0.59 0.578 28% 69% 0.49
EUR
Distribution
Cleveland Cleveland
Baseline Results (2016 factor prices) Sensitivity Results (2014 factor prices, G2=133%)
% of wells and technical recoverable reserves economic at given price: % of wells and technical recoverable reserves economic at given price:
Well
Elasticity
Full Cycle Reserve
Elasticity
Well
Elasticity
Full Cycle Reserve
Elasticity
1.38
1.34 1.29
1.25 1.22
1.18
1.11
1.03
0.98
0.92
0.87
$0
$10
$20
$30
$40
$50
$60
$70
$80
$90
$100
0% 10% 20% 30% 40% 50% 60% 70% 80% 90% 100%
$/b
arr
el, W
TI
Percent of Drill Sites that are Economic at Given Price(elasticities to the right)
2016 factor prices 2014 factor prices
Cleveland
0.77
0.720.67
0.630.60
0.56
0.51
0.45
0.41
0.36
0.33
$0
$10
$20
$30
$40
$50
$60
$70
$80
$90
$100
0% 10% 20% 30% 40% 50% 60% 70% 80% 90% 100%
$/b
arr
el, W
TI
Percent of Recoverable Resources that are Economic(elasticities to the right)
2016 factor prices 2014 factor prices
Cleveland
Page 125
Appendix C: Reserve Elasticity & Drill Site Elasticity, 2014 and 2016 Cost scenarios.
C-23
Northern Wattenberg XL
min: 0.0000
median: 0.4033
mean: 0.7270
m: -0.9082
s: 1.0857
h: 1.5000
mean: 0.7270
stdev: 1.0905
a=b/e eur: 1.3590
transform: 1.1190
E[x|x>a]: 2.6894
Pr[x>a): 13.2%
Q[R|a]: 0.3538
Price EUR (x) Transform E[x|x>a] Pr[x>a) Q[R|a] Price EUR (x) Transform E[x|x>a] Pr[x>a) Q[R|a]
$20 2,736 1.76 4.652 4% 25% $20 8,237 2.78 12.049 0% 5%
3.26 $25 1,814 1.39 3.348 8% 38% 1.90 6.75 $25 3,831 2.07 6.164 2% 16% 5.06
2.50 $30 1,357 1.12 2.686 13% 49% 1.33 4.61 $30 2,496 1.68 4.316 5% 28% 2.89
2.05 $35 1,084 0.91 2.285 18% 57% 1.01 3.45 $35 1,851 1.40 3.401 8% 38% 1.97
1.75 $40 902 0.74 2.013 23% 63% 0.81 2.78 $40 1,471 1.19 2.853 12% 46% 1.48
1.53 $45 773 0.60 1.819 27% 69% 0.67 2.34 $45 1,220 1.02 2.485 15% 53% 1.19
1.37 $50 676 0.48 1.671 32% 73% 0.57 2.03 $50 1,043 0.88 2.224 19% 58% 0.98
1.19 $60 540 0.27 1.463 39% 79% 0.46 1.71 $60 808 0.64 1.872 26% 67% 0.78
1.00 $70 450 0.10 1.324 46% 84% 0.36 1.43 $70 659 0.45 1.645 33% 74% 0.60
0.87 $80 386 -0.04 1.225 52% 87% 0.28 1.22 $80 557 0.30 1.489 38% 78% 0.47
0.76 $90 338 -0.16 1.151 56% 89% 0.23 1.07 $90 482 0.16 1.374 43% 82% 0.39
0.69 $100 300 -0.27 1.093 61% 91% 0.20 0.95 $100 425 0.05 1.286 48% 85% 0.33
Baseline Results (2016 factor prices) Sensitivity Results (2014 factor prices, G2=133%)
% of wells and technical recoverable reserves economic at given price: % of wells and technical recoverable reserves economic at given price:
Well
Elasticity
Full Cycle Reserve
Elasticity
Well
Elasticity
Full Cycle Reserve
Elasticity
EUR
Distribution
Northern Wattenberg XL Northern Wattenberg XL
3.26
2.50 2.05
1.75 1.53
1.37
1.19
1.00
0.87
0.76
0.69
$0
$10
$20
$30
$40
$50
$60
$70
$80
$90
$100
0% 10% 20% 30% 40% 50% 60% 70% 80% 90% 100%
$/b
arr
el, W
TI
Percent of Drill Sites that are Economic at Given Price(elasticities to the right)
2016 factor prices 2014 factor prices
Northern Wattenberg XL
1.90
1.331.01
0.810.67
0.57
0.46
0.36
0.28
0.23
0.20
$0
$10
$20
$30
$40
$50
$60
$70
$80
$90
$100
0% 10% 20% 30% 40% 50% 60% 70% 80% 90% 100%
$/b
arr
el, W
TI
Percent of Recoverable Resources that are Economic(elasticities to the right)
2016 factor prices 2014 factor prices
Northern Wattenberg XL
Page 126
Appendix C: Reserve Elasticity & Drill Site Elasticity, 2014 and 2016 Cost scenarios.
C-24
Northern Wattenberg
min: 0.0000
median: 0.1980
mean: 0.3570
m: -1.6193
s: 1.0857
h: 1.5000
mean: 0.3570
stdev: 0.5355
a=b/e eur: 1.3590
transform: 1.7741
E[x|x>a]: 2.3059
Pr[x>a): 3.8%
Q[R|a]: 0.0877
Price EUR (x) Transform E[x|x>a] Pr[x>a) Q[R|a] Price EUR (x) Transform E[x|x>a] Pr[x>a) Q[R|a]
$20 1,476 1.85 2.469 3% 22% $20 4,158 2.80 6.065 0% 4%
3.34 $25 983 1.48 1.776 7% 35% 1.99 6.59 $25 2,016 2.14 3.211 2% 15% 4.93
2.59 $30 737 1.21 1.422 11% 45% 1.41 4.59 $30 1,331 1.75 2.267 4% 25% 2.91
2.13 $35 590 1.01 1.207 16% 53% 1.08 3.49 $35 993 1.49 1.790 7% 34% 2.03
1.83 $40 492 0.84 1.062 20% 60% 0.87 2.84 $40 792 1.28 1.502 10% 42% 1.55
1.61 $45 422 0.70 0.957 24% 65% 0.73 2.40 $45 659 1.11 1.308 13% 49% 1.25
1.46 $50 369 0.57 0.877 28% 70% 0.63 2.11 $50 564 0.96 1.169 17% 55% 1.04
1.25 $60 296 0.37 0.766 36% 76% 0.51 1.78 $60 438 0.73 0.981 23% 64% 0.84
1.07 $70 247 0.20 0.691 42% 81% 0.40 1.50 $70 358 0.55 0.860 29% 71% 0.65
0.96 $80 211 0.06 0.635 48% 85% 0.33 1.29 $80 303 0.39 0.777 35% 76% 0.52
0.82 $90 185 -0.06 0.595 52% 87% 0.26 1.13 $90 263 0.26 0.715 40% 80% 0.43
0.73 $100 165 -0.17 0.564 57% 90% 0.22 1.02 $100 232 0.15 0.667 44% 83% 0.37
Baseline Results (2016 factor prices) Sensitivity Results (2014 factor prices, G2=133%)
% of wells and technical recoverable reserves economic at given price: % of wells and technical recoverable reserves economic at given price:
Well
Elasticity
Full Cycle Reserve
Elasticity
Well
Elasticity
Full Cycle Reserve
Elasticity
EUR
Distribution
Northern Wattenberg Northern Wattenberg
3.34
2.59 2.13
1.83 1.61
1.46
1.25
1.07
0.96
0.82
0.73
$0
$10
$20
$30
$40
$50
$60
$70
$80
$90
$100
0% 10% 20% 30% 40% 50% 60% 70% 80% 90% 100%
$/b
arr
el, W
TI
Percent of Drill Sites that are Economic at Given Price(elasticities to the right)
2016 factor prices 2014 factor prices
Northern Wattenberg
1.99
1.411.08
0.870.73
0.63
0.51
0.40
0.33
0.26
0.22
$0
$10
$20
$30
$40
$50
$60
$70
$80
$90
$100
0% 10% 20% 30% 40% 50% 60% 70% 80% 90% 100%
$/b
arr
el, W
TI
Percent of Recoverable Resources that are Economic(elasticities to the right)
2016 factor prices 2014 factor prices
Northern Wattenberg
Page 127
Appendix C: Reserve Elasticity & Drill Site Elasticity, 2014 and 2016 Cost scenarios.
C-25
Southern Wattenberg
min: 0.0000
median: 0.2191
mean: 0.3950
m: -1.5182
s: 1.0857
h: 1.5000
mean: 0.3950
stdev: 0.5925
a=b/e eur: 1.3590
transform: 1.6810
E[x|x>a]: 2.3488
Pr[x>a): 4.6%
Q[R|a]: 0.1089
Price EUR (x) Transform E[x|x>a] Pr[x>a) Q[R|a] Price EUR (x) Transform E[x|x>a] Pr[x>a) Q[R|a]
$20 1,379 1.69 2.377 5% 27% $20 4,432 2.77 6.490 0% 5%
2.77 $25 970 1.37 1.797 9% 39% 1.59 6.44 $25 2,194 2.12 3.503 2% 15% 4.77
2.23 $30 749 1.13 1.477 13% 48% 1.18 4.51 $30 1,458 1.75 2.488 4% 25% 2.84
1.90 $35 610 0.94 1.272 17% 56% 0.94 3.44 $35 1,092 1.48 1.971 7% 35% 1.99
1.67 $40 514 0.79 1.130 22% 62% 0.78 2.80 $40 873 1.27 1.657 10% 43% 1.53
1.47 $45 445 0.65 1.026 26% 67% 0.65 2.39 $45 727 1.10 1.445 13% 49% 1.24
1.34 $50 392 0.54 0.946 30% 71% 0.57 2.09 $50 623 0.96 1.292 17% 55% 1.03
1.19 $60 316 0.34 0.830 37% 77% 0.48 1.78 $60 484 0.73 1.085 23% 64% 0.83
1.00 $70 266 0.18 0.753 43% 82% 0.37 1.49 $70 396 0.55 0.952 29% 71% 0.64
0.90 $80 229 0.04 0.696 48% 85% 0.31 1.29 $80 335 0.39 0.859 35% 76% 0.52
0.80 $90 201 -0.08 0.652 53% 88% 0.26 1.12 $90 291 0.26 0.791 40% 80% 0.42
0.73 $100 179 -0.19 0.618 57% 90% 0.22 1.01 $100 257 0.15 0.739 44% 83% 0.36
Baseline Results (2016 factor prices) Sensitivity Results (2014 factor prices, G2=133%)
% of wells and technical recoverable reserves economic at given price: % of wells and technical recoverable reserves economic at given price:
Well
Elasticity
Full Cycle Reserve
Elasticity
Well
Elasticity
Full Cycle Reserve
Elasticity
EUR
Distribution
Southern Wattenberg Southern Wattenberg
2.77
2.23 1.90
1.67 1.47
1.34
1.19
1.00
0.90
0.80
0.73
$0
$10
$20
$30
$40
$50
$60
$70
$80
$90
$100
0% 10% 20% 30% 40% 50% 60% 70% 80% 90% 100%
$/b
arr
el, W
TI
Percent of Drill Sites that are Economic at Given Price(elasticities to the right)
2016 factor prices 2014 factor prices
Southern Wattenberg
1.59
1.180.94
0.780.65
0.57
0.48
0.37
0.31
0.26
0.22
$0
$10
$20
$30
$40
$50
$60
$70
$80
$90
$100
0% 10% 20% 30% 40% 50% 60% 70% 80% 90% 100%
$/b
arr
el, W
TI
Percent of Recoverable Resources that are Economic(elasticities to the right)
2016 factor prices 2014 factor prices
Southern Wattenberg
Page 128
Appendix C: Reserve Elasticity & Drill Site Elasticity, 2014 and 2016 Cost scenarios.
C-26
Greater Monument Butte
min: 0.0000
median: 0.1043
mean: 0.1880
m: -2.2606
s: 1.0857
h: 1.5000
mean: 0.1880
stdev: 0.2820
a=b/e eur: 1.3590
transform: 2.3648
E[x|x>a]: 2.0932
Pr[x>a): 0.9%
Q[R|a]: 0.0189
Price EUR (x) Transform E[x|x>a] Pr[x>a) Q[R|a] Price EUR (x) Transform E[x|x>a] Pr[x>a) Q[R|a]
$20 2,075 2.75 3.044 0% 5% $20 0% 0%
7.56 $25 760 1.83 1.276 3% 23% 5.90 9.00 $25 5,200 3.60 7.052 0% 1%
4.72 $30 465 1.38 0.860 8% 39% 2.81 10.71 $30 1,220 2.27 1.906 1% 12% 9.95
3.28 $35 335 1.07 0.671 14% 50% 1.74 7.19 $35 691 1.74 1.180 4% 26% 4.74
2.51 $40 262 0.85 0.564 20% 59% 1.22 4.81 $40 482 1.41 0.884 8% 37% 2.79
2.06 $45 215 0.67 0.493 25% 66% 0.93 3.59 $45 370 1.17 0.723 12% 47% 1.92
1.70 $50 183 0.52 0.445 30% 71% 0.72 2.88 $50 300 0.97 0.620 17% 54% 1.44
1.44 $60 140 0.27 0.379 39% 79% 0.57 2.21 $60 218 0.68 0.498 25% 66% 1.03
1.12 $70 114 0.08 0.339 47% 84% 0.40 1.72 $70 171 0.46 0.426 32% 74% 0.73
0.95 $80 96 -0.08 0.311 53% 88% 0.31 1.39 $80 141 0.28 0.380 39% 79% 0.54
0.74 $90 84 -0.20 0.292 58% 90% 0.22 1.17 $90 120 0.13 0.348 45% 83% 0.42
0.71 $100 74 -0.32 0.277 62% 92% 0.20 0.98 $100 105 0.01 0.325 50% 86% 0.33
Baseline Results (2016 factor prices) Sensitivity Results (2014 factor prices, G2=133%)
% of wells and technical recoverable reserves economic at given price: % of wells and technical recoverable reserves economic at given price:
Well
Elasticity
Full Cycle Reserve
Elasticity
Well
Elasticity
Full Cycle Reserve
Elasticity
EUR
Distribution
Greater Monument Butte (Uinta) Greater Monument Butte (Uinta)
7.56 4.72
3.28 2.51
2.06 1.70
1.44
1.12
0.95
0.74
0.71
$0
$10
$20
$30
$40
$50
$60
$70
$80
$90
$100
0% 10% 20% 30% 40% 50% 60% 70% 80% 90% 100%
$/b
arr
el, W
TI
Percent of Drill Sites that are Economic at Given Price(elasticities to the right)
2016 factor prices 2014 factor prices
Greater Monument Butte (Uinta)
5.902.81
1.741.22
0.930.72
0.57
0.40
0.31
0.22
0.20
$0
$10
$20
$30
$40
$50
$60
$70
$80
$90
$100
0% 10% 20% 30% 40% 50% 60% 70% 80% 90% 100%
$/b
arr
el, W
TI
Percent of Recoverable Resources that are Economic(elasticities to the right)
2016 factor prices 2014 factor prices
Greater Monument Butte (Uinta)
Page 129
Appendix C: Reserve Elasticity & Drill Site Elasticity, 2014 and 2016 Cost scenarios.
C-27
Wasatch SXL
min: 0.0000
median: 0.5547
mean: 1.0000
m: -0.5893
s: 1.0857
h: 1.5000
mean: 1.0000
stdev: 1.5000
a=b/e eur: 1.3590
transform: 0.8254
E[x|x>a]: 2.9459
Pr[x>a): 20.5%
Q[R|a]: 0.6027
Price EUR (x) Transform E[x|x>a] Pr[x>a) Q[R|a] Price EUR (x) Transform E[x|x>a] Pr[x>a) Q[R|a]
$20 6,114 2.21 9.629 1% 13% $20 24,862 3.50 33.972 0% 1%
4.08 $25 3,913 1.80 6.607 4% 24% 2.63 8.20 $25 9,138 2.58 13.682 0% 7% 7.13
3.14 $30 2,877 1.52 5.150 6% 33% 1.84 5.97 $30 5,598 2.13 8.928 2% 15% 4.12
2.58 $35 2,275 1.30 4.288 10% 42% 1.42 4.43 $35 4,035 1.83 6.777 3% 23% 2.78
2.21 $40 1,881 1.12 3.716 13% 48% 1.15 3.54 $40 3,154 1.60 5.543 5% 30% 2.09
1.95 $45 1,604 0.98 3.310 16% 54% 0.97 2.98 $45 2,589 1.42 4.740 8% 37% 1.67
1.75 $50 1,398 0.85 3.004 20% 59% 0.83 2.59 $50 2,196 1.27 4.174 10% 43% 1.39
1.53 $60 1,112 0.64 2.575 26% 67% 0.69 2.18 $60 1,684 1.02 3.427 15% 53% 1.12
1.31 $70 923 0.47 2.289 32% 73% 0.55 1.83 $70 1,366 0.83 2.956 20% 60% 0.88
1.15 $80 789 0.32 2.084 37% 78% 0.45 1.58 $80 1,149 0.67 2.631 25% 66% 0.71
1.03 $90 689 0.20 1.930 42% 81% 0.38 1.41 $90 991 0.53 2.392 30% 71% 0.60
0.92 $100 612 0.09 1.811 46% 84% 0.32 1.26 $100 872 0.42 2.211 34% 75% 0.51
Baseline Results (2016 factor prices) Sensitivity Results (2014 factor prices, G2=133%)
% of wells and technical recoverable reserves economic at given price: % of wells and technical recoverable reserves economic at given price:
Well
Elasticity
Full Cycle Reserve
Elasticity
Well
Elasticity
Full Cycle Reserve
Elasticity
EUR
Distribution
Wasatch SXL Wasatch SXL
4.08 3.14
2.58 2.21
1.95 1.75
1.53
1.31
1.15
1.03
0.92
$0
$10
$20
$30
$40
$50
$60
$70
$80
$90
$100
0% 10% 20% 30% 40% 50% 60% 70% 80% 90% 100%
$/b
arr
el, W
TI
Percent of Drill Sites that are Economic at Given Price(elasticities to the right)
2016 factor prices 2014 factor prices
Wasatch SXL
2.631.84
1.421.15
0.970.83
0.69
0.55
0.45
0.38
0.32
$0
$10
$20
$30
$40
$50
$60
$70
$80
$90
$100
0% 10% 20% 30% 40% 50% 60% 70% 80% 90% 100%
$/b
arr
el, W
TI
Percent of Recoverable Resources that are Economic(elasticities to the right)
2016 factor prices 2014 factor prices
Wasatch SXL
Page 130
Appendix C: Reserve Elasticity & Drill Site Elasticity, 2014 and 2016 Cost scenarios.
C-28
Uteland Butte SXL
min: 0.0000
median: 0.3883
mean: 0.7000
m: -0.9460
s: 1.0857
h: 1.5000
mean: 0.7000
stdev: 1.0500
a=b/e eur: 1.3590
transform: 1.1539
E[x|x>a]: 2.6632
Pr[x>a): 12.4%
Q[R|a]: 0.3310
Price EUR (x) Transform E[x|x>a] Pr[x>a) Q[R|a] Price EUR (x) Transform E[x|x>a] Pr[x>a) Q[R|a]
$20 0% 0% $20 0% 0%
$25 0% 0% $25 0% 0%
11.00 $30 18,221 3.54 24.815 0% 1% $30 0% 0%
12.38 $35 5,315 2.41 8.136 1% 9% 11.18 $35 0% 0%
8.28 $40 3,112 1.92 5.142 3% 20% 5.59 $40 94,438 5.06 117.891 0% 0%
5.64 $45 2,200 1.60 3.869 6% 30% 3.40 17.00 $45 9,025 2.90 13.032 0% 3% 16.97
4.25 $50 1,701 1.36 3.158 9% 39% 2.38 13.28 $50 4,739 2.30 7.361 1% 11% 9.92
3.09 $60 1,171 1.02 2.388 15% 53% 1.63 6.85 $60 2,431 1.69 4.194 5% 27% 4.62
2.31 $70 893 0.77 1.975 22% 62% 1.10 4.43 $70 1,635 1.32 3.063 9% 41% 2.54
1.86 $80 721 0.57 1.716 28% 70% 0.82 3.24 $80 1,232 1.06 2.477 14% 51% 1.69
1.55 $90 605 0.41 1.539 34% 75% 0.63 2.56 $90 988 0.86 2.117 19% 59% 1.24
1.34 $100 521 0.27 1.410 39% 79% 0.51 2.12 $100 825 0.69 1.873 24% 65% 0.97
Baseline Results (2016 factor prices) Sensitivity Results (2014 factor prices, G2=133%)
% of wells and technical recoverable reserves economic at given price: % of wells and technical recoverable reserves economic at given price:
Well
Elasticity
Full Cycle Reserve
Elasticity
Well
Elasticity
Full Cycle Reserve
Elasticity
EUR
Distribution
Uteland Butte SXL Uteland Butte SXL
11.00 12.38
8.28 5.64
4.25
3.09
2.31
1.86
1.55
1.34
$0
$10
$20
$30
$40
$50
$60
$70
$80
$90
$100
0% 10% 20% 30% 40% 50% 60% 70% 80% 90% 100%
$/b
arr
el, W
TI
Percent of Drill Sites that are Economic at Given Price(elasticities to the right)
2016 factor prices 2014 factor prices
Uteland Butte SXL11.18
5.593.40
2.38
1.63
1.10
0.82
0.63
0.51
$0
$10
$20
$30
$40
$50
$60
$70
$80
$90
$100
0% 10% 20% 30% 40% 50% 60% 70% 80% 90% 100%
$/b
arr
el, W
TI
Percent of Recoverable Resources that are Economic(elasticities to the right)
2016 factor prices 2014 factor prices
Uteland Butte SXL
Page 131
Appendix C: Reserve Elasticity & Drill Site Elasticity, 2014 and 2016 Cost scenarios.
C-29
SW PA Wet Gas
min: 0.0000
median: 1.6269
mean: 2.9330
m: 0.4867
s: 1.0857
h: 1.5000
mean: 2.9330
stdev: 4.3995
a=b/e eur: 1.3590
transform: -0.1658
E[x|x>a]: 4.6373
Pr[x>a): 56.6%
Q[R|a]: 2.6239
Price EUR (x) Transform E[x|x>a] Pr[x>a) Q[R|a] Price EUR (x) Transform E[x|x>a] Pr[x>a) Q[R|a]
$20 5,642 1.15 11.083 13% 48% $20 #NUM! #NUM! #NUM! #NUM!
1.51 $25 4,451 0.93 9.332 18% 56% 0.75 #NUM! $25 33,191 2.78 48.558 0% 5% #NUM!
1.35 $30 3,675 0.75 8.175 23% 63% 0.63 8.33 $30 15,197 2.06 24.515 2% 17% 6.27
1.22 $35 3,129 0.60 7.353 27% 69% 0.54 5.47 $35 9,855 1.66 17.109 5% 28% 3.41
1.11 $40 2,725 0.48 6.740 32% 73% 0.46 3.98 $40 7,291 1.38 13.468 8% 38% 2.26
1.03 $45 2,413 0.36 6.263 36% 77% 0.41 3.13 $45 5,786 1.17 11.293 12% 47% 1.66
0.96 $50 2,165 0.26 5.882 40% 79% 0.36 2.60 $50 4,796 1.00 9.842 16% 54% 1.30
0.86 $60 1,796 0.09 5.313 46% 84% 0.31 2.08 $60 3,573 0.72 8.022 23% 64% 0.98
0.76 $70 1,534 -0.05 4.908 52% 87% 0.25 1.66 $70 2,847 0.52 6.925 30% 72% 0.72
0.68 $80 1,339 -0.18 4.606 57% 90% 0.21 1.39 $80 2,367 0.35 6.192 36% 77% 0.55
0.61 $90 1,188 -0.29 4.374 61% 92% 0.17 1.20 $90 2,025 0.20 5.667 42% 81% 0.44
0.55 $100 1,068 -0.39 4.189 65% 93% 0.15 1.05 $100 1,769 0.08 5.271 47% 84% 0.36
EUR
Distribution
SW PA Wet Gas SW PA Wet Gas
Baseline Results (2016 factor prices) Sensitivity Results (2014 factor prices, G2=133%)
% of wells and technical recoverable reserves economic at given price: % of wells and technical recoverable reserves economic at given price:
Well
Elasticity
Full Cycle Reserve
Elasticity
Well
Elasticity
Full Cycle Reserve
Elasticity
1.51
1.35 1.22
1.11 1.03
0.96
0.86
0.76
0.68
0.61
0.55
$0
$10
$20
$30
$40
$50
$60
$70
$80
$90
$100
0% 10% 20% 30% 40% 50% 60% 70% 80% 90% 100%
$/b
arr
el, W
TI
Percent of Drill Sites that are Economic at Given Price(elasticities to the right)
2016 Cost 2014 Cost
SW PA Wet Gas
0.75
0.630.54
0.460.41
0.36
0.31
0.25
0.21
0.17
0.15
$0
$10
$20
$30
$40
$50
$60
$70
$80
$90
$100
0% 10% 20% 30% 40% 50% 60% 70% 80% 90% 100%
$/b
arr
el, W
TI
Percent of Recoverable Resources that are Economic(elasticities to the right)
2016 Cost 2014 Cost
SW PA Wet Gas
Page 132
Appendix C: Reserve Elasticity & Drill Site Elasticity, 2014 and 2016 Cost scenarios.
C-30
SW PA Super Rich
min: 0.0000
median: 1.1926
mean: 2.1500
m: 0.1761
s: 1.0857
h: 1.5000
mean: 2.1500
stdev: 3.2250
a=b/e eur: 1.3590
transform: 0.1203
E[x|x>a]: 3.9603
Pr[x>a): 45.2%
Q[R|a]: 1.7906
Price EUR (x) Transform E[x|x>a] Pr[x>a) Q[R|a] Price EUR (x) Transform E[x|x>a] Pr[x>a) Q[R|a]
$20 5,180 1.35 9.636 9% 39% $20 106,843 4.14 139.708 0% 0%
1.88 $25 3,960 1.11 7.867 13% 49% 0.99 8.95 $25 18,483 2.52 27.870 1% 8% 8.73
1.63 $30 3,205 0.91 6.755 18% 57% 0.80 6.79 $30 10,116 1.97 16.564 2% 19% 4.73
1.45 $35 2,691 0.75 5.988 23% 63% 0.67 4.69 $35 6,964 1.63 12.175 5% 29% 2.86
1.30 $40 2,320 0.61 5.430 27% 68% 0.57 3.57 $40 5,309 1.38 9.821 8% 39% 2.01
1.20 $45 2,038 0.49 5.002 31% 72% 0.50 2.89 $45 4,290 1.18 8.349 12% 46% 1.54
1.10 $50 1,818 0.39 4.666 35% 76% 0.44 2.45 $50 3,599 1.02 7.337 15% 53% 1.24
0.99 $60 1,494 0.21 4.169 42% 81% 0.37 2.01 $60 2,722 0.76 6.035 22% 63% 0.96
0.86 $70 1,269 0.06 3.821 48% 85% 0.30 1.64 $70 2,189 0.56 5.231 29% 70% 0.71
0.77 $80 1,102 -0.07 3.563 53% 88% 0.25 1.39 $80 1,830 0.39 4.685 35% 76% 0.56
0.69 $90 974 -0.19 3.365 57% 90% 0.21 1.20 $90 1,573 0.26 4.290 40% 80% 0.46
0.63 $100 873 -0.29 3.209 61% 92% 0.18 1.07 $100 1,379 0.13 3.991 45% 83% 0.38
EUR
Distribution
SW PA Super Rich SW PA Super Rich
Baseline Results (2016 factor prices) Sensitivity Results (2014 factor prices, G2=133%)
% of wells and technical recoverable reserves economic at given price: % of wells and technical recoverable reserves economic at given price:
Well
Elasticity
Full Cycle Reserve
Elasticity
Well
Elasticity
Full Cycle Reserve
Elasticity
1.88
1.63 1.45
1.30 1.20
1.10
0.99
0.86
0.77
0.69
0.63
$0
$10
$20
$30
$40
$50
$60
$70
$80
$90
$100
0% 10% 20% 30% 40% 50% 60% 70% 80% 90% 100%
$/b
arr
el, W
TI
Percent of Drill Sites that are Economic at Given Price(elasticities to the right)
2016 Cost 2014 Cost
SW PA Super Rich
0.99
0.800.67
0.570.50
0.44
0.37
0.30
0.25
0.21
0.18
$0
$10
$20
$30
$40
$50
$60
$70
$80
$90
$100
0% 10% 20% 30% 40% 50% 60% 70% 80% 90% 100%
$/b
arr
el, W
TI
Percent of Recoverable Resources that are Economic(elasticities to the right)
2016 Cost 2014 Cost
SW PA Super Rich
Page 133
Appendix C: Reserve Elasticity & Drill Site Elasticity, 2014 and 2016 Cost scenarios.
C-31
Utica Wet Gas
min: 0.0000
median: 1.6641
mean: 3.0000
m: 0.5093
s: 1.0857
h: 1.5000
mean: 3.0000
stdev: 4.5000
a=b/e eur: 1.3590
transform: -0.1866
E[x|x>a]: 4.6953
Pr[x>a): 57.4%
Q[R|a]: 2.6951
Price EUR (x) Transform E[x|x>a] Pr[x>a) Q[R|a] Price EUR (x) Transform E[x|x>a] Pr[x>a) Q[R|a]
$20 6,006 1.18 11.679 12% 46% $20 61,623 3.33 85.430 0% 1%
0.87 $25 5,277 1.06 10.613 14% 51% 0.44 7.19 $25 29,830 2.66 44.244 0% 6% 5.80
0.89 $30 4,706 0.96 9.772 17% 55% 0.44 5.38 $30 19,678 2.28 30.696 1% 12% 3.72
0.89 $35 4,246 0.86 9.090 19% 59% 0.42 4.22 $35 14,681 2.01 23.891 2% 18% 2.71
0.89 $40 3,868 0.78 8.525 22% 62% 0.41 3.51 $40 11,708 1.80 19.778 4% 24% 2.14
0.88 $45 3,552 0.70 8.051 24% 65% 0.39 3.03 $45 9,736 1.63 17.015 5% 29% 1.78
0.87 $50 3,284 0.63 7.647 27% 68% 0.38 2.69 $50 8,333 1.48 15.027 7% 35% 1.52
0.84 $60 2,853 0.50 6.994 31% 72% 0.35 2.31 $60 6,469 1.25 12.351 11% 43% 1.26
0.81 $70 2,522 0.38 6.488 35% 76% 0.32 1.98 $70 5,286 1.06 10.626 14% 51% 1.02
0.77 $80 2,260 0.28 6.087 39% 79% 0.29 1.75 $80 4,469 0.91 9.421 18% 57% 0.85
0.74 $90 2,047 0.19 5.759 42% 81% 0.27 1.57 $90 3,870 0.78 8.528 22% 62% 0.73
0.70 $100 1,871 0.11 5.487 46% 84% 0.25 1.43 $100 3,413 0.66 7.842 25% 66% 0.64
EUR
Distribution
Utica Wet Gas Utica Wet Gas
Baseline Results (2016 factor prices) Sensitivity Results (2014 factor prices, G2=133%)
% of wells and technical recoverable reserves economic at given price: % of wells and technical recoverable reserves economic at given price:
Well
Elasticity
Full Cycle Reserve
Elasticity
Well
Elasticity
Full Cycle Reserve
Elasticity
0.87
0.89 0.89
0.89 0.88
0.87
0.84
0.81
0.77
0.74
0.70
$0
$10
$20
$30
$40
$50
$60
$70
$80
$90
$100
0% 10% 20% 30% 40% 50% 60% 70% 80% 90% 100%
$/b
arr
el, W
TI
Percent of Drill Sites that are Economic at Given Price(elasticities to the right)
2016 Cost 2014 Cost
Utica Wet Gas
0.44
0.440.42
0.410.39
0.38
0.35
0.32
0.29
0.27
0.25
$0
$10
$20
$30
$40
$50
$60
$70
$80
$90
$100
0% 10% 20% 30% 40% 50% 60% 70% 80% 90% 100%
$/b
arr
el, W
TI
Percent of Recoverable Resources that are Economic(elasticities to the right)
2016 Cost 2014 Cost
Utica Wet Gas
Page 134
Appendix C: Reserve Elasticity & Drill Site Elasticity, 2014 and 2016 Cost scenarios.
C-32
Utica Condensate
min: 0.0000
median: 0.6579
mean: 1.1860
m: -0.4187
s: 1.0857
h: 1.5000
mean: 1.1860
stdev: 1.7790
a=b/e eur: 1.3590
transform: 0.6682
E[x|x>a]: 3.1149
Pr[x>a): 25.2%
Q[R|a]: 0.7849
Price EUR (x) Transform E[x|x>a] Pr[x>a) Q[R|a] Price EUR (x) Transform E[x|x>a] Pr[x>a) Q[R|a]
$20 4,600 1.79 7.779 4% 24% $20 22,595 3.26 31.514 0% 1%
2.45 $25 3,434 1.52 6.139 6% 33% 1.43 7.47 $25 10,025 2.51 15.147 1% 8% 6.09
2.11 $30 2,740 1.31 5.146 9% 41% 1.16 5.42 $30 6,441 2.10 10.318 2% 15% 3.67
1.87 $35 2,279 1.14 4.478 13% 48% 0.98 4.13 $35 4,745 1.82 7.981 3% 23% 2.58
1.69 $40 1,951 1.00 3.997 16% 53% 0.85 3.37 $40 3,756 1.60 6.595 5% 30% 1.98
1.55 $45 1,706 0.88 3.634 19% 58% 0.74 2.87 $45 3,108 1.43 5.675 8% 37% 1.61
1.44 $50 1,515 0.77 3.349 22% 62% 0.66 2.52 $50 2,651 1.28 5.018 10% 42% 1.36
1.29 $60 1,239 0.58 2.934 28% 69% 0.57 2.14 $60 2,048 1.05 4.140 15% 52% 1.11
1.15 $70 1,047 0.43 2.642 33% 74% 0.47 1.81 $70 1,669 0.86 3.579 20% 59% 0.87
1.03 $80 907 0.30 2.427 38% 79% 0.40 1.58 $80 1,408 0.70 3.189 24% 65% 0.72
0.94 $90 800 0.18 2.262 43% 82% 0.34 1.40 $90 1,218 0.57 2.902 29% 70% 0.61
0.86 $100 716 0.08 2.133 47% 84% 0.30 1.27 $100 1,073 0.45 2.681 33% 74% 0.52
EUR
Distribution
Utica Condensate Utica Condensate
Baseline Results (2016 factor prices) Sensitivity Results (2014 factor prices, G2=133%)
% of wells and technical recoverable reserves economic at given price: % of wells and technical recoverable reserves economic at given price:
Well
Elasticity
Full Cycle Reserve
Elasticity
Well
Elasticity
Full Cycle Reserve
Elasticity
2.45
2.11 1.87
1.69 1.55
1.44
1.29
1.15
1.03
0.94
0.86
$0
$10
$20
$30
$40
$50
$60
$70
$80
$90
$100
0% 10% 20% 30% 40% 50% 60% 70% 80% 90% 100%
$/b
arr
el, W
TI
Percent of Drill Sites that are Economic at Given Price(elasticities to the right)
2016 Cost 2014 Cost
Utica Condensate
1.43
1.160.98
0.850.74
0.66
0.57
0.47
0.40
0.34
0.30
$0
$10
$20
$30
$40
$50
$60
$70
$80
$90
$100
0% 10% 20% 30% 40% 50% 60% 70% 80% 90% 100%
$/b
arr
el, W
TI
Percent of Recoverable Resources that are Economic(elasticities to the right)
2016 Cost 2014 Cost
Utica Condensate
Page 135
Appendix C: Reserve Elasticity & Drill Site Elasticity, 2014 and 2016 Cost scenarios.
C-33
San Juan - Gallup
min: 0.0000
median: 0.2502
mean: 0.4510
m: -1.3856
s: 1.0857
h: 1.5000
mean: 0.4510
stdev: 0.6765
a=b/e eur: 1.3590
transform: 1.5588
E[x|x>a]: 2.4100
Pr[x>a): 6.0%
Q[R|a]: 0.1434
Price EUR (x) Transform E[x|x>a] Pr[x>a) Q[R|a] Price EUR (x) Transform E[x|x>a] Pr[x>a) Q[R|a]
$20 1,235 1.47 2.234 7% 35% $20 2,359 2.07 3.800 2% 16%
2.30 $25 899 1.18 1.750 12% 46% 1.25 3.78 $25 1,534 1.67 2.657 5% 28% 2.36
1.90 $30 707 0.96 1.468 17% 55% 0.96 2.91 $30 1,137 1.39 2.094 8% 38% 1.66
1.65 $35 582 0.78 1.282 22% 62% 0.77 2.40 $35 903 1.18 1.756 12% 46% 1.28
1.44 $40 495 0.63 1.152 26% 68% 0.64 2.06 $40 749 1.01 1.530 16% 53% 1.04
1.29 $45 431 0.50 1.055 31% 72% 0.54 1.81 $45 640 0.87 1.369 19% 59% 0.87
1.19 $50 381 0.39 0.978 35% 76% 0.47 1.62 $50 559 0.74 1.248 23% 63% 0.74
1.03 $60 310 0.20 0.869 42% 81% 0.39 1.43 $60 445 0.53 1.076 30% 71% 0.62
0.88 $70 262 0.04 0.795 48% 85% 0.30 1.21 $70 370 0.36 0.961 36% 77% 0.49
0.80 $80 226 -0.09 0.739 54% 88% 0.25 1.06 $80 317 0.22 0.880 41% 81% 0.39
0.70 $90 199 -0.21 0.698 58% 90% 0.21 0.95 $90 277 0.09 0.818 46% 84% 0.33
0.62 $100 178 -0.31 0.665 62% 92% 0.17 0.85 $100 246 -0.02 0.770 51% 86% 0.28
EUR
Distribution
San Juan Gallup San Juan Gallup
Baseline Results (2016 factor prices) Sensitivity Results (2014 factor prices, G2=133%)
% of wells and technical recoverable reserves economic at given price: % of wells and technical recoverable reserves economic at given price:
Well
Elasticity
Full Cycle Reserve
Elasticity
Well
Elasticity
Full Cycle Reserve
Elasticity
2.30
1.90 1.65
1.44 1.29
1.19
1.03
0.88
0.80
0.70
0.62
$0
$10
$20
$30
$40
$50
$60
$70
$80
$90
$100
0% 10% 20% 30% 40% 50% 60% 70% 80% 90% 100%
$/b
arr
el, W
TI
Percent of Drill Sites that are Economic at Given Price(elasticities to the right)
2016 Cost 2014 Cost
San Juan Gallup
1.25
0.960.77
0.640.54
0.47
0.39
0.30
0.25
0.21
0.17
$0
$10
$20
$30
$40
$50
$60
$70
$80
$90
$100
0% 10% 20% 30% 40% 50% 60% 70% 80% 90% 100%
$/b
arr
el, W
TI
Percent of Recoverable Resources that are Economic(elasticities to the right)
2016 Cost 2014 Cost
San Juan Gallup
Page 136
Appendix C: Reserve Elasticity & Drill Site Elasticity, 2014 and 2016 Cost scenarios.
C-34
Tuscaloosa Marine Shale
min: 0.0000
median: 0.3789
mean: 0.6830
m: -0.9706
s: 1.0857
h: 1.5000
mean: 0.6830
stdev: 1.0245
a=b/e eur: 1.3590
transform: 1.1766
E[x|x>a]: 2.6466
Pr[x>a): 12.0%
Q[R|a]: 0.3168
Price EUR (x) Transform E[x|x>a] Pr[x>a) Q[R|a] Price EUR (x) Transform E[x|x>a] Pr[x>a) Q[R|a]
$20 15,694 3.43 21.570 0% 1% $20 #NUM! #NUM! #NUM! #NUM!
8.56 $25 4,387 2.26 6.863 1% 12% 7.69 #NUM! $25 115,246 5.27 142.663 0% 0% #NUM!
5.86 $30 2,550 1.76 4.342 4% 25% 3.85 11.00 $30 7,566 2.76 11.093 0% 5% 10.99
4.09 $35 1,797 1.43 3.278 8% 36% 2.38 8.95 $35 3,911 2.15 6.217 2% 14% 6.56
3.14 $40 1,387 1.20 2.687 12% 46% 1.69 6.03 $40 2,637 1.79 4.463 4% 24% 3.82
2.56 $45 1,130 1.01 2.311 16% 53% 1.29 4.47 $45 1,989 1.53 3.552 6% 33% 2.62
2.18 $50 953 0.85 2.049 20% 59% 1.04 3.56 $50 1,597 1.33 2.991 9% 41% 1.97
1.79 $60 726 0.60 1.708 27% 69% 0.80 2.75 $60 1,145 1.02 2.333 15% 53% 1.43
1.46 $70 586 0.40 1.495 34% 75% 0.60 2.14 $70 893 0.79 1.960 21% 62% 1.02
1.23 $80 491 0.24 1.350 41% 80% 0.47 1.77 $80 731 0.61 1.716 27% 68% 0.79
1.06 $90 423 0.10 1.245 46% 84% 0.37 1.50 $90 620 0.45 1.547 33% 74% 0.62
0.93 $100 372 -0.02 1.166 51% 86% 0.31 1.33 $100 537 0.32 1.420 37% 78% 0.52
EUR
Distribution
Tuscaloosa Marine Shale Tuscaloosa Marine Shale
Baseline Results (2016 factor prices) Sensitivity Results (2014 factor prices, G2=133%)
% of wells and technical recoverable reserves economic at given price: % of wells and technical recoverable reserves economic at given price:
Well
Elasticity
Full Cycle Reserve
Elasticity
Well
Elasticity
Full Cycle Reserve
Elasticity
8.56
5.86 4.09
3.14 2.56
2.18
1.79
1.46
1.23
1.06
0.93
$0
$10
$20
$30
$40
$50
$60
$70
$80
$90
$100
0% 10% 20% 30% 40% 50% 60% 70% 80% 90% 100%
$/b
arr
el, W
TI
Percent of Drill Sites that are Economic at Given Price(elasticities to the right)
2016 Cost 2014 Cost
Tuscaloosa Marine Shale
7.693.85
2.381.69
1.291.04
0.80
0.60
0.47
0.37
0.31
$0
$10
$20
$30
$40
$50
$60
$70
$80
$90
$100
0% 10% 20% 30% 40% 50% 60% 70% 80% 90% 100%
$/b
arr
el, W
TI
Percent of Recoverable Resources that are Economic(elasticities to the right)
2016 Cost 2014 Cost
Tuscaloosa Marine Shale
Page 137
Appendix D: Reserve Elasticity & Drill Site Elasticity, Dynamic Cost Scenario, Alternative Coefficients of Variation.
D-1
Midland Basin Spraberry
min: 0.0000
median: 0.4177
mean: 0.7530
m: -0.8730
s: 1.0857
h: 1.5000
mean: 0.7530
stdev: 1.1295
a=b/e eur: 1.3590
transform: 1.0867
E[x|x>a]: 2.7145
Pr[x>a): 13.9%
Q[R|a]: 0.3762
Price EUR (x) Transform E[x|x>a] Pr[x>a) Q[R|a] Price EUR (x) Transform E[x|x>a] Pr[x>a) Q[R|a]
$20 1,074 0.87 2.294 19% 59% $20 1,074 0.86 1.693 20% 44%
0.90 $25 915 0.72 2.056 24% 64% 0.41 1.34 $25 915 0.63 1.511 26% 53% 0.84
0.83 $30 803 0.60 1.887 27% 69% 0.36 1.18 $30 803 0.44 1.384 33% 60% 0.70
0.78 $35 719 0.50 1.760 31% 72% 0.33 1.06 $35 719 0.29 1.290 39% 66% 0.60
0.71 $40 655 0.41 1.662 34% 75% 0.29 0.93 $40 655 0.16 1.219 44% 71% 0.51
0.68 $45 603 0.34 1.583 37% 77% 0.26 0.86 $45 603 0.04 1.163 48% 75% 0.45
0.65 $50 560 0.27 1.517 39% 79% 0.24 0.78 $50 560 -0.07 1.116 53% 78% 0.40
0.60 $60 494 0.15 1.415 44% 82% 0.21 0.68 $60 494 -0.24 1.047 60% 83% 0.33
0.54 $70 445 0.06 1.339 48% 85% 0.18 0.58 $70 445 -0.39 0.998 65% 86% 0.27
0.50 $80 407 -0.02 1.280 51% 87% 0.16 0.50 $80 407 -0.52 0.960 70% 89% 0.22
0.47 $90 376 -0.10 1.232 54% 88% 0.15 0.45 $90 376 -0.63 0.931 74% 91% 0.19
0.45 $100 350 -0.16 1.192 56% 89% 0.13 0.41 $100 350 -0.73 0.907 77% 92% 0.16
Full Cycle Full CycleReserve
Elasticity
Well
Elasticity
Well
Elasticity
EUR
Distribution
Midland Basin: Spraberry
Baseline Results (scaled factor prices)
% of wells and technical recoverable reserves economic at given price:
Reserve
Elasticity
This table is based on play-specific coefficient of variation
% of wells and technical recoverable reserves economic at given price:
0.90
0.83 0.78
0.71 0.68
0.65
0.60
0.54
0.50
0.47
0.45
$0
$10
$20
$30
$40
$50
$60
$70
$80
$90
$100
0% 10% 20% 30% 40% 50% 60% 70% 80% 90% 100%
$/b
arr
el, W
TI
Percent of Drill Sites that are Economic at Given Price(elasticities to the right)
Average EUR Variability Play Specific EUR Variability
Midland Basin: Spraberry
0.41
0.360.33
0.290.26
0.24
0.21
0.18
0.16
0.15
0.13
$0
$10
$20
$30
$40
$50
$60
$70
$80
$90
$100
0% 10% 20% 30% 40% 50% 60% 70% 80% 90% 100%
$/b
arr
el, W
TI
Percent of Recoverable Resources that are Economic(elasticities to the right)
Average EUR Variability Play Specific EUR Variability
Midland Basin: Spraberry
Page 138
Appendix D: Reserve Elasticity & Drill Site Elasticity, Dynamic Cost Scenario, Alternative Coefficients of Variation.
D-2
Northern Delaware Bone Spring
min: 0.0000
median: 0.3750
mean: 0.6760
m: -0.9809
s: 1.0857
h: 1.5000
mean: 0.6760
stdev: 1.0140
a=b/e eur: 1.3590
transform: 1.1860
E[x|x>a]: 2.6398
Pr[x>a): 11.8%
Q[R|a]: 0.3110
Price EUR (x) Transform E[x|x>a] Pr[x>a) Q[R|a] Price EUR (x) Transform E[x|x>a] Pr[x>a) Q[R|a]
$20 1,089 0.98 2.244 16% 54% $20 1,089 1.03 1.664 15% 37%
0.79 $25 955 0.86 2.046 19% 59% 0.38 1.22 $25 955 0.84 1.509 20% 45% 0.79
0.78 $30 854 0.76 1.895 22% 63% 0.36 1.16 $30 854 0.68 1.393 25% 51% 0.72
0.76 $35 775 0.67 1.776 25% 66% 0.34 1.09 $35 775 0.55 1.304 29% 56% 0.66
0.72 $40 712 0.59 1.681 28% 69% 0.31 1.02 $40 712 0.43 1.232 33% 61% 0.60
0.70 $45 660 0.52 1.602 30% 71% 0.29 0.96 $45 660 0.32 1.174 37% 65% 0.55
0.68 $50 616 0.46 1.535 32% 74% 0.28 0.91 $50 616 0.22 1.125 41% 69% 0.50
0.63 $60 548 0.35 1.431 36% 77% 0.25 0.81 $60 548 0.06 1.051 48% 74% 0.43
0.61 $70 495 0.26 1.350 40% 80% 0.23 0.74 $70 495 -0.09 0.994 53% 79% 0.38
0.56 $80 454 0.18 1.286 43% 82% 0.20 0.65 $80 454 -0.21 0.951 58% 82% 0.32
0.54 $90 420 0.10 1.234 46% 84% 0.19 0.60 $90 420 -0.32 0.916 63% 85% 0.28
0.49 $100 393 0.04 1.192 48% 85% 0.16 0.52 $100 393 -0.41 0.889 66% 87% 0.23
EUR
Distribution
North Delaware Bone Spring This table is based on play-specific coefficient of variation
Baseline Results (scaled factor prices)
% of wells and technical recoverable reserves economic at given price: % of wells and technical recoverable reserves economic at given price:
Well
Elasticity
Full Cycle Reserve
Elasticity
Well
Elasticity
Full Cycle Reserve
Elasticity
0.79
0.78 0.76
0.72 0.70
0.68
0.63
0.61
0.56
0.54
0.49
$0
$10
$20
$30
$40
$50
$60
$70
$80
$90
$100
0% 10% 20% 30% 40% 50% 60% 70% 80% 90% 100%
$/b
arr
el, W
TI
Percent of Drill Sites that are Economic at Given Price(elasticities to the right)
Average EUR Variability Play Specific EUR Variability
North Delaware Bone
0.380.36
0.340.31
0.290.28
0.25
0.23
0.20
0.19
0.16
$0
$10
$20
$30
$40
$50
$60
$70
$80
$90
$100
0% 10% 20% 30% 40% 50% 60% 70% 80% 90% 100%
$/b
arr
el, W
TI
Percent of Recoverable Resources that are Economic(elasticities to the right)
Average EUR Variability Play Specific EUR Variability
North Delaware Bone Spring
Page 139
Appendix D: Reserve Elasticity & Drill Site Elasticity, Dynamic Cost Scenario, Alternative Coefficients of Variation.
D-3
Southern Delaware Wolfcamp
min: 0.0000
median: 0.4898
mean: 0.8830
m: -0.7138
s: 1.0857
h: 1.5000
mean: 0.8830
stdev: 1.3245
a=b/e eur: 1.3590
transform: 0.9400
E[x|x>a]: 2.8376
Pr[x>a): 17.4%
Q[R|a]: 0.4926
Price EUR (x) Transform E[x|x>a] Pr[x>a) Q[R|a] Price EUR (x) Transform E[x|x>a] Pr[x>a) Q[R|a]
$20 1,371 0.95 2.855 17% 55% $20 1,371 0.98 2.114 16% 39%
0.66 $25 1,227 0.85 2.642 20% 59% 0.31 1.02 $25 1,227 0.82 1.948 21% 46% 0.65
0.68 $30 1,112 0.76 2.470 23% 63% 0.31 1.01 $30 1,112 0.68 1.816 25% 51% 0.63
0.68 $35 1,019 0.67 2.330 25% 66% 0.30 0.98 $35 1,019 0.56 1.710 29% 56% 0.60
0.67 $40 942 0.60 2.214 27% 69% 0.29 0.95 $40 942 0.44 1.623 33% 60% 0.56
0.66 $45 878 0.54 2.117 30% 71% 0.28 0.90 $45 878 0.35 1.551 36% 64% 0.52
0.64 $50 824 0.48 2.035 32% 73% 0.26 0.85 $50 824 0.26 1.491 40% 67% 0.48
0.62 $60 736 0.38 1.900 35% 76% 0.25 0.80 $60 736 0.10 1.395 46% 73% 0.43
0.58 $70 669 0.29 1.797 39% 79% 0.22 0.72 $70 669 -0.04 1.322 52% 77% 0.37
0.56 $80 615 0.21 1.714 42% 81% 0.20 0.66 $80 615 -0.16 1.265 56% 81% 0.33
0.53 $90 571 0.14 1.646 44% 83% 0.19 0.60 $90 571 -0.26 1.220 60% 83% 0.28
0.51 $100 534 0.08 1.589 47% 84% 0.17 0.55 $100 534 -0.36 1.182 64% 86% 0.25
EUR
Distribution
South Delaware Wolfcamp This table is based on play-specific coefficient of variation
Baseline Results (scaled factor prices)
% of wells and technical recoverable reserves economic at given price: % of wells and technical recoverable reserves economic at given price:
Well
Elasticity
Full Cycle Reserve
Elasticity
Well
Elasticity
Full Cycle Reserve
Elasticity
0.66
0.68 0.68
0.67 0.66
0.64
0.62
0.58
0.56
0.53
0.51
$0
$10
$20
$30
$40
$50
$60
$70
$80
$90
$100
0% 10% 20% 30% 40% 50% 60% 70% 80% 90% 100%
$/b
arr
el, W
TI
Percent of Drill Sites that are Economic at Given Price(elasticities to the right)
Average EUR Variability Play Specific EUR Variability
South Delaware Wolfcamp
0.310.31
0.300.29
0.280.26
0.25
0.22
0.20
0.19
0.17
$0
$10
$20
$30
$40
$50
$60
$70
$80
$90
$100
0% 10% 20% 30% 40% 50% 60% 70% 80% 90% 100%
$/b
arr
el, W
TI
Percent of Recoverable Resources that are Economic(elasticities to the right)
Average EUR Variability Play Specific EUR Variability
South Delaware Wolfcamp
Page 140
Appendix D: Reserve Elasticity & Drill Site Elasticity, Dynamic Cost Scenario, Alternative Coefficients of Variation.
D-4
Culberson LL Wolfcamp
min: 0.0000
median: 1.0844
mean: 1.9550
m: 0.0811
s: 1.0857
h: 1.5000
mean: 1.9550
stdev: 2.9325
a=b/e eur: 1.3590
transform: 0.2079
E[x|x>a]: 3.7913
Pr[x>a): 41.8%
Q[R|a]: 1.5835
Price EUR (x) Transform E[x|x>a] Pr[x>a) Q[R|a] Price EUR (x) Transform E[x|x>a] Pr[x>a) Q[R|a]
$20 2,870 0.90 6.077 19% 58% $20 2,870 0.90 4.489 18% 42%
(0.07) $25 2,902 0.91 6.124 18% 57% -0.03 (0.10) $25 2,902 0.91 4.526 18% 42% -0.07
0.05 $30 2,883 0.90 6.096 18% 57% 0.02 0.07 $30 2,883 0.90 4.504 18% 42% 0.05
0.15 $35 2,834 0.88 6.023 19% 58% 0.07 0.23 $35 2,834 0.88 4.448 19% 43% 0.14
0.22 $40 2,770 0.86 5.928 19% 59% 0.11 0.34 $40 2,770 0.85 4.374 20% 44% 0.22
0.29 $45 2,698 0.84 5.821 20% 60% 0.14 0.44 $45 2,698 0.81 4.291 21% 46% 0.28
0.35 $50 2,622 0.81 5.707 21% 61% 0.16 0.52 $50 2,622 0.77 4.204 22% 48% 0.33
0.40 $60 2,473 0.76 5.484 22% 63% 0.18 0.60 $60 2,473 0.69 4.034 25% 51% 0.37
0.46 $70 2,332 0.71 5.273 24% 65% 0.21 0.67 $70 2,332 0.60 3.873 27% 54% 0.41
0.50 $80 2,204 0.65 5.080 26% 67% 0.22 0.71 $80 2,204 0.52 3.727 30% 57% 0.42
0.52 $90 2,089 0.60 4.906 27% 69% 0.22 0.73 $90 2,089 0.45 3.598 33% 60% 0.43
0.54 $100 1,985 0.56 4.749 29% 70% 0.23 0.74 $100 1,985 0.37 3.481 35% 63% 0.43
EUR
Distribution
Culberson LL Wolfcamp This table is based on play-specific coefficient of variation
Baseline Results (scaled factor prices)
% of wells and technical recoverable reserves economic at given price: % of wells and technical recoverable reserves economic at given price:
Well
Elasticity
Full Cycle Reserve
Elasticity
Well
Elasticity
Full Cycle Reserve
Elasticity
(0.07)0.05 0.15 0.22 0.29 0.35
0.40
0.46
0.50
0.52
0.54
$0
$10
$20
$30
$40
$50
$60
$70
$80
$90
$100
0% 10% 20% 30% 40% 50% 60% 70% 80% 90% 100%
$/b
arr
el, W
TI
Percent of Drill Sites that are Economic at Given Price(elasticities to the right)
Average EUR Variability Play Specific EUR Variability
Culberson LL Wolfcamp
-0.030.020.070.110.140.16
0.18
0.21
0.22
0.22
0.23
$0
$10
$20
$30
$40
$50
$60
$70
$80
$90
$100
0% 10% 20% 30% 40% 50% 60% 70% 80% 90% 100%
$/b
arr
el, W
TI
Percent of Recoverable Resources that are Economic(elasticities to the right)
Average EUR Variaibility Play Specific EUR Variability
Culberson LL Wolfcamp
Page 141
Appendix D: Reserve Elasticity & Drill Site Elasticity, Dynamic Cost Scenario, Alternative Coefficients of Variation.
D-5
Midland Basin Wolfcamp
min: 0.0000
median: 0.4138
mean: 0.7460
m: -0.8824
s: 1.0857
h: 1.5000
mean: 0.7460
stdev: 1.1190
a=b/e eur: 1.3590
transform: 1.0953
E[x|x>a]: 2.7077
Pr[x>a): 13.7%
Q[R|a]: 0.3701
Price EUR (x) Transform E[x|x>a] Pr[x>a) Q[R|a] Price EUR (x) Transform E[x|x>a] Pr[x>a) Q[R|a]
$20 1,230 1.00 2.518 16% 53% $20 1,230 1.06 1.869 14% 36%
0.83 $25 1,073 0.88 2.286 19% 58% 0.40 1.29 $25 1,073 0.87 1.688 19% 44% 0.84
0.82 $30 955 0.77 2.110 22% 62% 0.38 1.22 $30 955 0.70 1.552 24% 50% 0.77
0.78 $35 864 0.68 1.973 25% 66% 0.35 1.14 $35 864 0.56 1.448 29% 56% 0.69
0.75 $40 792 0.60 1.864 27% 69% 0.32 1.05 $40 792 0.44 1.367 33% 61% 0.62
0.72 $45 733 0.53 1.775 30% 71% 0.30 0.98 $45 733 0.33 1.301 37% 65% 0.56
0.69 $50 684 0.46 1.700 32% 73% 0.28 0.91 $50 684 0.23 1.246 41% 68% 0.51
0.66 $60 606 0.35 1.581 36% 77% 0.26 0.84 $60 606 0.06 1.161 48% 74% 0.45
0.61 $70 547 0.26 1.490 40% 80% 0.23 0.74 $70 547 -0.09 1.098 53% 79% 0.38
0.57 $80 501 0.18 1.420 43% 82% 0.21 0.66 $80 501 -0.21 1.049 58% 82% 0.32
0.53 $90 464 0.11 1.362 46% 84% 0.19 0.59 $90 464 -0.32 1.012 62% 85% 0.28
0.51 $100 433 0.04 1.315 48% 85% 0.17 0.54 $100 433 -0.42 0.981 66% 87% 0.24
EUR
Distribution
Midland Basin Wolfcamp This table is based on play-specific coefficient of variation
Baseline Results (scaled factor prices)
% of wells and technical recoverable reserves economic at given price:
Well
Elasticity
Full Cycle Reserve
Elasticity
Well
Elasticity
Full Cycle Reserve
Elasticity
0.83
0.82 0.78
0.75 0.72
0.69
0.66
0.61
0.57
0.53
0.51
$0
$10
$20
$30
$40
$50
$60
$70
$80
$90
$100
0% 10% 20% 30% 40% 50% 60% 70% 80% 90% 100%
$/b
arr
el, W
TI
Percent of Drill Sites that are Economic at Given Price(elasticities to the right)
Average EUR Variability Play Specific EUR Variability
Midland Basin Wolfcamp
0.400.38
0.350.32
0.300.28
0.26
0.23
0.21
0.19
0.17
$0
$10
$20
$30
$40
$50
$60
$70
$80
$90
$100
0% 10% 20% 30% 40% 50% 60% 70% 80% 90% 100%
$/b
arr
el, W
TI
Percent of Recoverable Resources that are Economic(elasticities to the right)
Average EUR Variability Play Specific EUR Variaibility
Midland Basin Wolfcamp
Page 142
Appendix D: Reserve Elasticity & Drill Site Elasticity, Dynamic Cost Scenario, Alternative Coefficients of Variation.
D-6
Southern Midland Basin Wolfcamp
min: 0.0000
median: 0.2774
mean: 0.5000
m: -1.2825
s: 1.0857
h: 1.5000
mean: 0.5000
stdev: 0.7500
a=b/e eur: 1.3590
transform: 1.4638
E[x|x>a]: 2.4620
Pr[x>a): 7.2%
Q[R|a]: 0.1763
Price EUR (x) Transform E[x|x>a] Pr[x>a) Q[R|a] Price EUR (x) Transform E[x|x>a] Pr[x>a) Q[R|a]
$20 964 1.15 1.893 13% 48% $20 964 1.28 1.414 10% 28%
0.69 $25 869 1.05 1.753 15% 51% 0.35 1.11 $25 869 1.14 1.304 13% 33% 0.75
0.73 $30 791 0.97 1.639 17% 55% 0.36 1.15 $30 791 1.00 1.214 16% 38% 0.76
0.74 $35 727 0.89 1.544 19% 58% 0.35 1.14 $35 727 0.88 1.140 19% 43% 0.74
0.74 $40 674 0.82 1.465 21% 61% 0.34 1.11 $40 674 0.78 1.079 22% 47% 0.70
0.73 $45 629 0.75 1.397 23% 63% 0.33 1.09 $45 629 0.68 1.028 25% 51% 0.67
0.71 $50 591 0.70 1.340 24% 65% 0.32 1.04 $50 591 0.59 0.984 28% 55% 0.63
0.71 $60 528 0.59 1.245 28% 69% 0.31 1.00 $60 528 0.43 0.913 33% 61% 0.59
0.67 $70 480 0.51 1.172 31% 72% 0.28 0.91 $70 480 0.30 0.859 38% 66% 0.52
0.64 $80 442 0.43 1.115 33% 74% 0.26 0.83 $80 442 0.18 0.817 43% 70% 0.46
0.63 $90 410 0.36 1.066 36% 77% 0.24 0.79 $90 410 0.07 0.782 47% 74% 0.42
0.61 $100 383 0.30 1.024 38% 78% 0.23 0.74 $100 383 -0.02 0.753 51% 77% 0.38
Baseline Results (scaled factor prices)
% of wells and technical recoverable reserves economic at given price: % of wells and technical recoverable reserves economic at given price:
Well
Elasticity
Full Cycle Reserve
Elasticity
Well
Elasticity
Full Cycle Reserve
Elasticity
EUR
Distribution
Southern Midland Basin Wolfcamp This table is based on play-specific coefficient of variation
0.69
0.73 0.74
0.74 0.73
0.71
0.71
0.67
0.64
0.63
0.61
$0
$10
$20
$30
$40
$50
$60
$70
$80
$90
$100
0% 10% 20% 30% 40% 50% 60% 70% 80% 90% 100%
$/b
arr
el, W
TI
Percent of Drill Sites that are Economic at Given Price(elasticities to the right)
Average EUR Variability Play Specific EUR Variability
Southern Midland Basin Wolfcamp
0.35
0.360.35
0.340.33
0.32
0.31
0.28
0.26
0.24
0.23
$0
$10
$20
$30
$40
$50
$60
$70
$80
$90
$100
0% 10% 20% 30% 40% 50% 60% 70% 80% 90% 100%
$/b
arr
el, W
TI
Percent of Recoverable Resources that are Economic(elasticities to the right)
Average EUR Variability Play Specific EUR Variability
Southern Midland Basin Wolfcamp
Page 143
Appendix D: Reserve Elasticity & Drill Site Elasticity, Dynamic Cost Scenario, Alternative Coefficients of Variation.
D-7
Eagle Ford Condensate
min: 0.0000
median: 0.4443
mean: 0.8010
m: -0.8112
s: 1.0857
h: 1.5000
mean: 0.8010
stdev: 1.2015
a=b/e eur: 1.3590
transform: 1.0298
E[x|x>a]: 2.7603
Pr[x>a): 15.2%
Q[R|a]: 0.4184
Price EUR (x) Transform E[x|x>a] Pr[x>a) Q[R|a] Price EUR (x) Transform E[x|x>a] Pr[x>a) Q[R|a]
$20 1,449 1.09 2.892 14% 50% $20 1,449 1.09 3.008 14% 52%
0.93 $25 1,252 0.95 2.602 17% 55% 0.46 0.89 $25 1,252 0.96 2.708 17% 57% 0.42
0.89 $30 1,108 0.84 2.389 20% 60% 0.42 0.86 $30 1,108 0.85 2.487 20% 61% 0.39
0.86 $35 997 0.74 2.223 23% 63% 0.39 0.83 $35 997 0.76 2.315 22% 65% 0.36
0.81 $40 910 0.66 2.092 25% 66% 0.36 0.79 $40 910 0.68 2.179 25% 68% 0.33
0.78 $45 839 0.59 1.985 28% 69% 0.34 0.76 $45 839 0.61 2.067 27% 70% 0.31
0.74 $50 781 0.52 1.897 30% 71% 0.31 0.72 $50 781 0.55 1.976 29% 72% 0.29
0.71 $60 689 0.40 1.756 34% 75% 0.28 0.69 $60 689 0.43 1.829 33% 76% 0.27
0.65 $70 620 0.31 1.651 38% 78% 0.25 0.64 $70 620 0.34 1.719 37% 79% 0.24
0.61 $80 566 0.22 1.568 41% 81% 0.23 0.60 $80 566 0.26 1.632 40% 81% 0.21
0.57 $90 523 0.15 1.501 44% 83% 0.20 0.56 $90 523 0.19 1.563 42% 83% 0.19
0.55 $100 487 0.08 1.446 47% 84% 0.19 0.54 $100 487 0.13 1.504 45% 84% 0.18
Baseline Results (scaled factor prices)
% of wells and technical recoverable reserves economic at given price: % of wells and technical recoverable reserves economic at given price:
Well
Elasticity
Full Cycle Reserve
Elasticity
Well
Elasticity
Full Cycle Reserve
Elasticity
EUR
Distribution
Eagle Ford Condensate Region This table is based on play-specific coefficient of variation
0.93
0.89 0.86
0.81 0.78
0.74
0.71
0.65
0.61
0.57
0.55
$0
$10
$20
$30
$40
$50
$60
$70
$80
$90
$100
0% 10% 20% 30% 40% 50% 60% 70% 80% 90% 100%
$/b
arr
el, W
TI
Percent of Drill Sites that are Economic at Given Price(elasticities to the right)
Average EUR Variability Play Specific EUR Variability
Eagle Ford CondensateRegion
0.46
0.420.39
0.360.34
0.31
0.28
0.25
0.23
0.20
0.19
$0
$10
$20
$30
$40
$50
$60
$70
$80
$90
$100
0% 10% 20% 30% 40% 50% 60% 70% 80% 90% 100%
$/b
arr
el, W
TI
Percent of Recoverable Resources that are Economic(elasticities to the right)
Average EUR Variability Play Specific EUR Variability
Eagle Ford Condensate Region
Page 144
Appendix D: Reserve Elasticity & Drill Site Elasticity, Dynamic Cost Scenario, Alternative Coefficients of Variation.
D-8
Eagle Ford Oil
min: 0.0000
median: 0.2857
mean: 0.5150
m: -1.2529
s: 1.0857
h: 1.5000
mean: 0.5150
stdev: 0.7725
a=b/e eur: 1.3590
transform: 1.4366
E[x|x>a]: 2.4776
Pr[x>a): 7.5%
Q[R|a]: 0.1868
Price EUR (x) Transform E[x|x>a] Pr[x>a) Q[R|a] Price EUR (x) Transform E[x|x>a] Pr[x>a) Q[R|a]
$20 1,011 1.16 1.976 12% 47% $20 1,011 1.16 2.054 12% 49%
1.08 $25 858 1.01 1.752 16% 53% 0.54 1.03 $25 858 1.02 1.822 15% 55% 0.50
1.01 $30 750 0.89 1.592 19% 58% 0.49 0.97 $30 750 0.90 1.657 18% 59% 0.45
0.93 $35 671 0.79 1.474 22% 62% 0.43 0.90 $35 671 0.80 1.535 21% 63% 0.40
0.88 $40 609 0.70 1.381 24% 65% 0.40 0.85 $40 609 0.72 1.438 24% 66% 0.37
0.84 $45 559 0.62 1.306 27% 68% 0.37 0.82 $45 559 0.64 1.360 26% 69% 0.34
0.78 $50 519 0.55 1.245 29% 70% 0.33 0.76 $50 519 0.57 1.297 28% 71% 0.31
0.74 $60 456 0.43 1.149 33% 74% 0.30 0.72 $60 456 0.46 1.197 32% 75% 0.28
0.69 $70 409 0.33 1.077 37% 77% 0.27 0.67 $70 409 0.36 1.122 36% 78% 0.25
0.63 $80 373 0.25 1.022 40% 80% 0.23 0.62 $80 373 0.28 1.064 39% 80% 0.22
0.59 $90 344 0.17 0.977 43% 82% 0.21 0.58 $90 344 0.21 1.017 42% 82% 0.20
0.56 $100 320 0.10 0.940 46% 84% 0.19 0.55 $100 320 0.15 0.978 44% 84% 0.18
Baseline Results (scaled factor prices)
% of wells and technical recoverable reserves economic at given price: % of wells and technical recoverable reserves economic at given price:
Well
Elasticity
Full Cycle Reserve
Elasticity
Well
Elasticity
Full Cycle Reserve
Elasticity
EUR
Distribution
Eagle Ford Oil Region This table is based on play-specific coefficient of variation
1.08
1.01 0.93
0.88 0.84
0.78
0.74
0.69
0.63
0.59
0.56
$0
$10
$20
$30
$40
$50
$60
$70
$80
$90
$100
0% 10% 20% 30% 40% 50% 60% 70% 80% 90% 100%
$/b
arr
el, W
TI
Percent of Drill Sites that are Economic at Given Price(elasticities to the right)
Average EUR Variability Play Specific EUR Variability
Eagle Ford Oil Region
0.54
0.490.43
0.400.37
0.33
0.30
0.27
0.23
0.21
0.19
$0
$10
$20
$30
$40
$50
$60
$70
$80
$90
$100
0% 10% 20% 30% 40% 50% 60% 70% 80% 90% 100%
$/b
arr
el, W
TI
Percent of Recoverable Resources that are Economic(elasticities to the right)
Average EUR Variability Play Specific EUR Variability
Eagle Ford Oil Region
Page 145
Appendix D: Reserve Elasticity & Drill Site Elasticity, Dynamic Cost Scenario, Alternative Coefficients of Variation.
D-9
Eagle Ford Combo
min: 0.0000
median: 0.4981
mean: 0.8980
m: -0.6969
s: 1.0857
h: 1.5000
mean: 0.8980
stdev: 1.3470
a=b/e eur: 1.3590
transform: 0.9245
E[x|x>a]: 2.8516
Pr[x>a): 17.8%
Q[R|a]: 0.5065
Price EUR (x) Transform E[x|x>a] Pr[x>a) Q[R|a] Price EUR (x) Transform E[x|x>a] Pr[x>a) Q[R|a]
$20 1,029 0.67 2.358 25% 66% $20 1,029 0.69 2.456 25% 67%
0.03 $25 1,024 0.66 2.351 25% 66% 0.01 0.02 $25 1,024 0.68 2.449 25% 67% 0.01
0.12 $30 1,005 0.65 2.322 26% 67% 0.05 0.12 $30 1,005 0.67 2.419 25% 68% 0.05
0.19 $35 979 0.62 2.283 27% 68% 0.08 0.19 $35 979 0.64 2.378 26% 69% 0.08
0.25 $40 950 0.59 2.239 28% 69% 0.11 0.25 $40 950 0.62 2.332 27% 70% 0.10
0.29 $45 921 0.57 2.195 29% 70% 0.12 0.28 $45 921 0.59 2.287 28% 71% 0.11
0.34 $50 891 0.54 2.150 30% 71% 0.14 0.33 $50 891 0.56 2.239 29% 72% 0.13
0.37 $60 836 0.48 2.066 32% 73% 0.15 0.36 $60 836 0.50 2.152 31% 74% 0.14
0.42 $70 785 0.42 1.988 34% 75% 0.17 0.41 $70 785 0.45 2.071 33% 75% 0.16
0.43 $80 740 0.36 1.919 36% 76% 0.17 0.42 $80 740 0.40 1.999 35% 77% 0.16
0.43 $90 701 0.31 1.860 38% 78% 0.17 0.43 $90 701 0.35 1.937 36% 78% 0.16
0.44 $100 666 0.27 1.806 39% 79% 0.17 0.44 $100 666 0.30 1.881 38% 80% 0.16
Baseline Results (scaled factor prices)
% of wells and technical recoverable reserves economic at given price: % of wells and technical recoverable reserves economic at given price:
Well
Elasticity
Full Cycle Reserve
Elasticity
Well
Elasticity
Full Cycle Reserve
Elasticity
EUR
Distribution
Eagle Ford Combo Region This table is based on play-specific coefficient of variation
0.03 0.12 0.19 0.25 0.29 0.34
0.37
0.42
0.43
0.43
0.44
$0
$10
$20
$30
$40
$50
$60
$70
$80
$90
$100
0% 10% 20% 30% 40% 50% 60% 70% 80% 90% 100%
$/b
arr
el, W
TI
Percent of Drill Sites that are Economic at Given Price(elasticities to the right)
Average EUR Variability Play Specific EUR Variability
Eagle Ford Combo Region
0.010.050.080.110.120.14
0.15
0.17
0.17
0.17
0.17
$0
$10
$20
$30
$40
$50
$60
$70
$80
$90
$100
0% 10% 20% 30% 40% 50% 60% 70% 80% 90% 100%
$/b
arr
el, W
TI
Percent of Recoverable Resources that are Economic(elasticities to the right)
Average EUR Variability Play Specific EUR Variability
Eagle Ford Combo Region
Page 146
Appendix D: Reserve Elasticity & Drill Site Elasticity, Dynamic Cost Scenario, Alternative Coefficients of Variation.
D-10
Bakken Core
min: 0.0000
median: 0.4022
mean: 0.7250
m: -0.9109
s: 1.0857
h: 1.5000
mean: 0.7250
stdev: 1.0875
a=b/e eur: 1.3590
transform: 1.1216
E[x|x>a]: 2.6875
Pr[x>a): 13.1%
Q[R|a]: 0.3521
Price EUR (x) Transform E[x|x>a] Pr[x>a) Q[R|a] Price EUR (x) Transform E[x|x>a] Pr[x>a) Q[R|a]
$20 1,448 1.18 2.817 12% 46% $20 1,448 1.18 3.235 12% 53%
0.93 $25 1,259 1.05 2.541 15% 51% 0.47 0.81 $25 1,259 1.07 2.924 14% 58% 0.36
1.03 $30 1,100 0.93 2.306 18% 56% 0.50 0.90 $30 1,100 0.96 2.658 17% 62% 0.38
0.97 $35 982 0.82 2.131 21% 60% 0.45 0.85 $35 982 0.87 2.459 19% 65% 0.35
0.91 $40 891 0.73 1.995 23% 64% 0.41 0.81 $40 891 0.79 2.304 21% 68% 0.32
0.86 $45 818 0.65 1.885 26% 67% 0.38 0.77 $45 818 0.73 2.178 23% 70% 0.29
0.81 $50 759 0.59 1.796 28% 69% 0.35 0.73 $50 759 0.67 2.075 25% 72% 0.27
0.76 $60 667 0.47 1.656 32% 73% 0.31 0.69 $60 667 0.56 1.914 29% 76% 0.25
0.70 $70 599 0.37 1.552 36% 76% 0.27 0.64 $70 599 0.48 1.794 32% 78% 0.22
0.65 $80 546 0.28 1.471 39% 79% 0.25 0.61 $80 546 0.40 1.699 34% 80% 0.20
0.60 $90 504 0.21 1.406 42% 81% 0.22 0.57 $90 504 0.34 1.623 37% 82% 0.18
0.57 $100 469 0.14 1.352 44% 83% 0.20 0.55 $100 469 0.28 1.559 39% 84% 0.17
Baseline Results (scaled factor prices)
% of wells and technical recoverable reserves economic at given price: % of wells and technical recoverable reserves economic at given price:
Well
Elasticity
Full Cycle Reserve
Elasticity
Well
Elasticity
Full Cycle Reserve
Elasticity
EUR
Distribution
Bakken Core This table is based on play-specific coefficient of variation
0.93
1.03 0.97
0.91 0.86
0.81
0.76
0.70
0.65
0.60
0.57
$0
$10
$20
$30
$40
$50
$60
$70
$80
$90
$100
0% 10% 20% 30% 40% 50% 60% 70% 80% 90% 100%
$/b
arr
el, W
TI
Percent of Drill Sites that are Economic at Given Price(elasticities to the right)
Average EUR Variability Play Specific EUR Variability
Bakken Core
0.47
0.500.45
0.410.38
0.35
0.31
0.27
0.25
0.22
0.20
$0
$10
$20
$30
$40
$50
$60
$70
$80
$90
$100
0% 10% 20% 30% 40% 50% 60% 70% 80% 90% 100%
$/b
arr
el, W
TI
Percent of Recoverable Resources that are Economic(elasticities to the right)
Average EUR Variability Play Specific EUR Variability
Bakken Core
Page 147
Appendix D: Reserve Elasticity & Drill Site Elasticity, Dynamic Cost Scenario, Alternative Coefficients of Variation.
D-11
Bakken Non-Core
min: 0.0000
median: 0.3095
mean: 0.5580
m: -1.1727
s: 1.0857
h: 1.5000
mean: 0.5580
stdev: 0.8370
a=b/e eur: 1.3590
transform: 1.3627
E[x|x>a]: 2.5219
Pr[x>a): 8.6%
Q[R|a]: 0.2181
Price EUR (x) Transform E[x|x>a] Pr[x>a) Q[R|a] Price EUR (x) Transform E[x|x>a] Pr[x>a) Q[R|a]
$20 1,552 1.49 2.798 7% 34% $20 1,552 1.44 3.195 7% 43%
1.61 $25 1,255 1.29 2.372 10% 42% 0.88 1.37 $25 1,255 1.27 2.719 10% 49% 0.65
1.41 $30 1,064 1.14 2.095 13% 48% 0.74 1.22 $30 1,064 1.14 2.407 13% 55% 0.55
1.26 $35 931 1.01 1.900 16% 53% 0.63 1.10 $35 931 1.04 2.187 15% 59% 0.48
1.15 $40 833 0.91 1.755 18% 57% 0.55 1.00 $40 833 0.95 2.023 17% 62% 0.42
1.08 $45 756 0.82 1.640 21% 60% 0.50 0.95 $45 756 0.87 1.893 19% 65% 0.39
1.00 $50 695 0.75 1.549 23% 63% 0.45 0.89 $50 695 0.80 1.789 21% 68% 0.35
0.93 $60 602 0.61 1.409 27% 68% 0.41 0.83 $60 602 0.69 1.628 25% 72% 0.32
0.84 $70 535 0.50 1.307 31% 72% 0.35 0.76 $70 535 0.60 1.511 28% 75% 0.27
0.75 $80 485 0.41 1.231 34% 75% 0.30 0.69 $80 485 0.52 1.423 30% 77% 0.24
0.73 $90 444 0.33 1.168 37% 77% 0.28 0.67 $90 444 0.45 1.350 33% 79% 0.23
0.65 $100 412 0.26 1.119 40% 79% 0.24 0.61 $100 412 0.39 1.293 35% 81% 0.20
Baseline Results (scaled factor prices)
% of wells and technical recoverable reserves economic at given price: % of wells and technical recoverable reserves economic at given price:
Well
Elasticity
Full Cycle Reserve
Elasticity
Well
Elasticity
Full Cycle Reserve
Elasticity
EUR
Distribution
Bakken Non Core This table is based on play-specific coefficient of variation
1.61
1.41 1.26
1.15 1.08
1.00
0.93
0.84
0.75
0.73
0.65
$0
$10
$20
$30
$40
$50
$60
$70
$80
$90
$100
0% 10% 20% 30% 40% 50% 60% 70% 80% 90% 100%
$/b
arr
el, W
TI
Percent of Drill Sites that are Economic at Given Price(elasticities to the right)
Average EUR Variability Play Specific EUR Variability
Bakken Non Core
0.88
0.740.63
0.550.50
0.45
0.41
0.35
0.30
0.28
0.24
$0
$10
$20
$30
$40
$50
$60
$70
$80
$90
$100
0% 10% 20% 30% 40% 50% 60% 70% 80% 90% 100%
$/b
arr
el, W
TI
Percent of Recoverable Resources that are Economic (elasticities to the right)
Average EUR Variability Play Specific EUR Variability
Bakken Non Core
Page 148
Appendix D: Reserve Elasticity & Drill Site Elasticity, Dynamic Cost Scenario, Alternative Coefficients of Variation.
D-12
Springer
min: 0.0000
median: 0.5014
mean: 0.9040
m: -0.6903
s: 1.0857
h: 1.5000
mean: 0.9040
stdev: 1.3560
a=b/e eur: 1.3590
transform: 0.9183
E[x|x>a]: 2.8572
Pr[x>a): 17.9%
Q[R|a]: 0.5121
Price EUR (x) Transform E[x|x>a] Pr[x>a) Q[R|a] Price EUR (x) Transform E[x|x>a] Pr[x>a) Q[R|a]
$20 1,504 1.01 3.071 16% 53% $20 1,504 1.04 3.556 15% 59%
0.84 $25 1,311 0.89 2.786 19% 58% 0.41 0.74 $25 1,311 0.93 3.230 18% 63% 0.31
0.81 $30 1,169 0.78 2.574 22% 62% 0.37 0.71 $30 1,169 0.84 2.988 20% 67% 0.28
0.77 $35 1,060 0.69 2.411 25% 65% 0.34 0.69 $35 1,060 0.76 2.800 22% 69% 0.26
0.74 $40 973 0.61 2.279 27% 68% 0.32 0.66 $40 973 0.69 2.649 24% 72% 0.25
0.71 $45 902 0.54 2.172 29% 71% 0.30 0.64 $45 902 0.63 2.525 26% 74% 0.23
0.68 $50 843 0.48 2.082 32% 73% 0.28 0.62 $50 843 0.58 2.420 28% 75% 0.22
0.65 $60 749 0.37 1.938 36% 76% 0.26 0.60 $60 749 0.48 2.253 31% 78% 0.20
0.60 $70 678 0.28 1.829 39% 79% 0.23 0.56 $70 678 0.41 2.125 34% 81% 0.18
0.57 $80 622 0.20 1.743 42% 81% 0.21 0.54 $80 622 0.34 2.023 37% 82% 0.17
0.53 $90 577 0.13 1.674 45% 83% 0.19 0.51 $90 577 0.28 1.941 39% 84% 0.15
0.51 $100 539 0.07 1.615 47% 85% 0.17 0.49 $100 539 0.22 1.871 41% 85% 0.14
Baseline Results (scaled factor prices)
% of wells and technical recoverable reserves economic at given price: % of wells and technical recoverable reserves economic at given price:
Well
Elasticity
Full Cycle Reserve
Elasticity
Well
Elasticity
Full Cycle Reserve
Elasticity
EUR
Distribution
Springer This table is based on play-specific coefficient of variation
0.84
0.81 0.77
0.74 0.71
0.68
0.65
0.60
0.57
0.53
0.51
$0
$10
$20
$30
$40
$50
$60
$70
$80
$90
$100
0% 10% 20% 30% 40% 50% 60% 70% 80% 90% 100%
$/b
arr
el, W
TI
Percent of Drill Sites that are Economic at Given Price(elasticities to the right)
Average EUR Variability Play Specific EUR Variability
Springer
0.41
0.370.34
0.320.30
0.28
0.26
0.23
0.21
0.19
0.17
$0
$10
$20
$30
$40
$50
$60
$70
$80
$90
$100
0% 10% 20% 30% 40% 50% 60% 70% 80% 90% 100%
$/b
arr
el, W
TI
Percent of Recoverable Resources that are Economic (elasticities to the right)
Average EUR Variability Play Specific EUR Variability
Springer
Page 149
Appendix D: Reserve Elasticity & Drill Site Elasticity, Dynamic Cost Scenario, Alternative Coefficients of Variation.
D-13
STACK
min: 0.0000
median: 0.5214
mean: 0.9400
m: -0.6512
s: 1.0857
h: 1.5000
mean: 0.9400
stdev: 1.4100
a=b/e eur: 1.3590
transform: 0.8824
E[x|x>a]: 2.8906
Pr[x>a): 18.9%
Q[R|a]: 0.5457
Price EUR (x) Transform E[x|x>a] Pr[x>a) Q[R|a] Price EUR (x) Transform E[x|x>a] Pr[x>a) Q[R|a]
$20 1,274 0.82 2.764 21% 60% $20 1,274 0.87 3.207 19% 65%
0.33 $25 1,202 0.77 2.656 22% 62% 0.15 0.29 $25 1,202 0.83 3.084 20% 67% 0.11
0.38 $30 1,136 0.72 2.557 24% 64% 0.17 0.34 $30 1,136 0.78 2.970 22% 69% 0.13
0.42 $35 1,076 0.67 2.467 25% 66% 0.18 0.37 $35 1,076 0.74 2.866 23% 70% 0.14
0.44 $40 1,023 0.62 2.387 27% 68% 0.19 0.39 $40 1,023 0.70 2.774 24% 71% 0.15
0.46 $45 975 0.58 2.314 28% 69% 0.19 0.41 $45 975 0.66 2.690 25% 73% 0.15
0.47 $50 932 0.53 2.249 30% 71% 0.19 0.42 $50 932 0.63 2.615 27% 74% 0.15
0.47 $60 859 0.46 2.138 32% 73% 0.19 0.43 $60 859 0.56 2.486 29% 76% 0.15
0.47 $70 799 0.39 2.046 35% 76% 0.19 0.43 $70 799 0.50 2.379 31% 78% 0.15
0.47 $80 749 0.33 1.970 37% 77% 0.18 0.43 $80 749 0.45 2.289 33% 79% 0.14
0.46 $90 706 0.28 1.904 39% 79% 0.17 0.43 $90 706 0.41 2.212 34% 80% 0.14
0.46 $100 669 0.23 1.847 41% 80% 0.17 0.43 $100 669 0.36 2.144 36% 82% 0.13
EUR
Distribution
STACK This table is based on play-specific coefficient of variation
Baseline Results (scaled factor prices)
% of wells and technical recoverable reserves economic at given price: % of wells and technical recoverable reserves economic at given price:
Well
Elasticity
Full Cycle Reserve
Elasticity
Well
Elasticity
Full Cycle Reserve
Elasticity
0.33
0.38 0.42
0.44 0.46
0.47
0.47
0.47
0.47
0.46
0.46
$0
$10
$20
$30
$40
$50
$60
$70
$80
$90
$100
0% 10% 20% 30% 40% 50% 60% 70% 80% 90% 100%
$/b
arr
el, W
TI
Percent of Drill Sites that are Economic at Given Price(elasticities to the right)
Average EUR Variability Play Specific EUR Variability
STACK
0.15
0.170.18
0.190.19
0.19
0.19
0.19
0.18
0.17
0.17
$0
$10
$20
$30
$40
$50
$60
$70
$80
$90
$100
0% 10% 20% 30% 40% 50% 60% 70% 80% 90% 100%
$/b
arr
el, W
TI
Percent of Recoverable Resources that are Economic (elasticities to the right)
Average EUR Variability Play Specific EUR Variability
STACK
Page 150
Appendix D: Reserve Elasticity & Drill Site Elasticity, Dynamic Cost Scenario, Alternative Coefficients of Variation.
D-14
SCOOP Condensate
min: 0.0000
median: 1.0828
mean: 1.9520
m: 0.0795
s: 1.0857
h: 1.5000
mean: 1.9520
stdev: 2.9280
a=b/e eur: 1.3590
transform: 0.2093
E[x|x>a]: 3.7887
Pr[x>a): 41.7%
Q[R|a]: 1.5803
Price EUR (x) Transform E[x|x>a] Pr[x>a) Q[R|a] Price EUR (x) Transform E[x|x>a] Pr[x>a) Q[R|a]
$20 1,724 0.43 4.349 33% 74% $20 1,724 0.53 5.055 30% 77%
(0.12) $25 1,771 0.45 4.421 33% 74% -0.05 (0.11) $25 1,771 0.56 5.139 29% 76% -0.04
(0.06) $30 1,791 0.46 4.451 32% 73% -0.03 (0.06) $30 1,791 0.56 5.174 29% 76% -0.02
(0.01) $35 1,795 0.47 4.457 32% 73% -0.01 (0.01) $35 1,795 0.57 5.181 29% 76% 0.00
0.03 $40 1,787 0.46 4.445 32% 73% 0.01 0.03 $40 1,787 0.56 5.167 29% 76% 0.01
0.07 $45 1,773 0.45 4.424 32% 74% 0.03 0.06 $45 1,773 0.56 5.142 29% 76% 0.02
0.11 $50 1,753 0.44 4.393 33% 74% 0.04 0.10 $50 1,753 0.55 5.107 29% 76% 0.03
0.15 $60 1,706 0.42 4.321 34% 75% 0.06 0.14 $60 1,706 0.53 5.023 30% 77% 0.05
0.20 $70 1,653 0.39 4.240 35% 76% 0.08 0.19 $70 1,653 0.50 4.929 31% 78% 0.06
0.23 $80 1,601 0.36 4.161 36% 77% 0.09 0.21 $80 1,601 0.48 4.835 32% 79% 0.07
0.27 $90 1,549 0.33 4.081 37% 78% 0.10 0.25 $90 1,549 0.45 4.742 33% 79% 0.08
0.28 $100 1,500 0.30 4.006 38% 78% 0.11 0.26 $100 1,500 0.42 4.654 34% 80% 0.09
EUR
Distribution
SCOOP Condensate This table is based on play-specific coefficient of variation
Baseline Results (scaled factor prices)
% of wells and technical recoverable reserves economic at given price: % of wells and technical recoverable reserves economic at given price:
Well
Elasticity
Full Cycle Reserve
Elasticity
Well
Elasticity
Full Cycle Reserve
Elasticity
(0.12)(0.06)(0.01)0.03 0.07 0.11
0.15
0.20
0.23
0.27
0.28
$0
$10
$20
$30
$40
$50
$60
$70
$80
$90
$100
0% 10% 20% 30% 40% 50% 60% 70% 80% 90% 100%
$/b
arr
el, W
TI
Percent of Drill Sites that are Economic at Given Price(elasticities to the right)
Average EUR Variability Play Specific EUR Variability
SCOOP Condensate
-0.05-0.03-0.010.010.030.04
0.06
0.08
0.09
0.10
0.11
$0
$10
$20
$30
$40
$50
$60
$70
$80
$90
$100
0% 10% 20% 30% 40% 50% 60% 70% 80% 90% 100%
$/b
arr
el, W
TI
Percent of Recoverable Resources that are Economic (elasticities to the right)
Average EUR Variaibility Play Specific EUR Variability
SCOOP Condensate
Page 151
Appendix D: Reserve Elasticity & Drill Site Elasticity, Dynamic Cost Scenario, Alternative Coefficients of Variation.
D-15
Meramec
min: 0.0000
median: 0.7422
mean: 1.3380
m: -0.2982
s: 1.0857
h: 1.5000
mean: 1.3380
stdev: 2.0070
a=b/e eur: 1.3590
transform: 0.5572
E[x|x>a]: 3.2507
Pr[x>a): 28.9%
Q[R|a]: 0.9385
Price EUR (x) Transform E[x|x>a] Pr[x>a) Q[R|a] Price EUR (x) Transform E[x|x>a] Pr[x>a) Q[R|a]
$20 1,425 0.60 3.351 27% 69% $20 1,425 0.68 3.894 25% 72%
- $25 1,425 0.60 3.351 27% 69% 0.00 - $25 1,425 0.68 3.894 25% 72% 0.00
0.08 $30 1,407 0.59 3.323 28% 69% 0.03 0.07 $30 1,407 0.67 3.863 25% 72% 0.03
0.15 $35 1,378 0.57 3.280 28% 70% 0.06 0.14 $35 1,378 0.66 3.812 26% 73% 0.05
0.20 $40 1,344 0.55 3.228 29% 70% 0.09 0.18 $40 1,344 0.64 3.752 26% 74% 0.07
0.24 $45 1,309 0.52 3.175 30% 71% 0.10 0.22 $45 1,309 0.62 3.691 27% 74% 0.08
0.28 $50 1,273 0.50 3.120 31% 72% 0.11 0.26 $50 1,273 0.59 3.627 28% 75% 0.09
0.32 $60 1,204 0.45 3.015 33% 74% 0.13 0.29 $60 1,204 0.55 3.505 29% 76% 0.10
0.36 $70 1,139 0.39 2.916 35% 76% 0.14 0.33 $70 1,139 0.51 3.389 31% 78% 0.11
0.38 $80 1,081 0.35 2.827 36% 77% 0.15 0.35 $80 1,081 0.46 3.285 32% 79% 0.12
0.39 $90 1,029 0.30 2.747 38% 78% 0.15 0.36 $90 1,029 0.43 3.191 34% 80% 0.12
0.40 $100 982 0.26 2.675 40% 80% 0.15 0.38 $100 982 0.39 3.106 35% 81% 0.12
EUR
Distribution
Meramec This table is based on play-specific coefficient of variation
Baseline Results (scaled factor prices)
% of wells and technical recoverable reserves economic at given price: % of wells and technical recoverable reserves economic at given price:
Well
Elasticity
Full Cycle Reserve
Elasticity
Well
Elasticity
Full Cycle Reserve
Elasticity
-0.08 0.15 0.20 0.24 0.28
0.32
0.36
0.38
0.39
0.40
$0
$10
$20
$30
$40
$50
$60
$70
$80
$90
$100
0% 10% 20% 30% 40% 50% 60% 70% 80% 90% 100%
$/b
arr
el, W
TI
Percent of Drill Sites that are Economic at Given Price(elasticities to the right)
Average EUR Variability Play Specific EUR Variability
Meramec
0.000.030.060.090.100.11
0.13
0.14
0.15
0.15
0.15
$0
$10
$20
$30
$40
$50
$60
$70
$80
$90
$100
0% 10% 20% 30% 40% 50% 60% 70% 80% 90% 100%
$/b
arr
el, W
TI
Percent of Recoverable Resources that are Economic (elasticities to the right)
Average EUR Variability Play Specific EUR Variability
Meramec
Page 152
Appendix D: Reserve Elasticity & Drill Site Elasticity, Dynamic Cost Scenario, Alternative Coefficients of Variation.
D-16
SCOOP Oil
min: 0.0000
median: 0.5431
mean: 0.9790
m: -0.6106
s: 1.0857
h: 1.5000
mean: 0.9790
stdev: 1.4685
a=b/e eur: 1.3590
transform: 0.8449
E[x|x>a]: 2.9266
Pr[x>a): 19.9%
Q[R|a]: 0.5826
Price EUR (x) Transform E[x|x>a] Pr[x>a) Q[R|a] Price EUR (x) Transform E[x|x>a] Pr[x>a) Q[R|a]
$20 1,624 1.01 3.319 16% 53% $20 1,624 1.03 3.843 15% 59%
0.56 $25 1,483 0.93 3.111 18% 56% 0.27 0.49 $25 1,483 0.96 3.605 17% 62% 0.20
0.60 $30 1,366 0.85 2.937 20% 59% 0.28 0.52 $30 1,366 0.90 3.407 19% 64% 0.21
0.61 $35 1,268 0.78 2.791 22% 62% 0.28 0.54 $35 1,268 0.84 3.240 20% 67% 0.21
0.61 $40 1,186 0.72 2.668 24% 64% 0.28 0.54 $40 1,186 0.78 3.098 22% 68% 0.21
0.61 $45 1,116 0.66 2.562 25% 66% 0.27 0.55 $45 1,116 0.74 2.977 23% 70% 0.21
0.61 $50 1,055 0.61 2.470 27% 68% 0.26 0.55 $50 1,055 0.69 2.871 24% 72% 0.20
0.59 $60 956 0.52 2.320 30% 71% 0.25 0.54 $60 956 0.61 2.697 27% 74% 0.19
0.58 $70 877 0.44 2.200 33% 74% 0.24 0.53 $70 877 0.55 2.557 29% 76% 0.19
0.56 $80 813 0.37 2.102 36% 76% 0.22 0.52 $80 813 0.49 2.443 31% 78% 0.17
0.54 $90 760 0.31 2.021 38% 78% 0.21 0.50 $90 760 0.43 2.348 33% 80% 0.17
0.53 $100 715 0.25 1.952 40% 80% 0.20 0.49 $100 715 0.38 2.267 35% 81% 0.16
EUR
Distribution
SCOOP Oil This table is based on play-specific coefficient of variation
Baseline Results (scaled factor prices)
% of wells and technical recoverable reserves economic at given price: % of wells and technical recoverable reserves economic at given price:
Well
Elasticity
Full Cycle Reserve
Elasticity
Well
Elasticity
Full Cycle Reserve
Elasticity
0.56
0.60 0.61
0.61 0.61
0.61
0.59
0.58
0.56
0.54
0.53
$0
$10
$20
$30
$40
$50
$60
$70
$80
$90
$100
0% 10% 20% 30% 40% 50% 60% 70% 80% 90% 100%
$/b
arr
el, W
TI
Percent of Drill Sites that are Economic at Given Price(elasticities to the right)
Average EUR Variability Play Specific EUR Variability
SCOOP Oil
0.27
0.280.28
0.280.27
0.26
0.25
0.24
0.22
0.21
0.20
$0
$10
$20
$30
$40
$50
$60
$70
$80
$90
$100
0% 10% 20% 30% 40% 50% 60% 70% 80% 90% 100%
$/b
arr
el, W
TI
Percent of Recoverable Resources that are Economic (elasticities to the right)
Average EUR Variability Play Specific EUR Variability
SCOOP Oil
Page 153
Appendix D: Reserve Elasticity & Drill Site Elasticity, Dynamic Cost Scenario, Alternative Coefficients of Variation.
D-17
Cana Woodford
min: 0.0000
median: 1.0129
mean: 1.8260
m: 0.0128
s: 1.0857
h: 1.5000
mean: 1.8260
stdev: 2.7390
a=b/e eur: 1.3590
transform: 0.2708
E[x|x>a]: 3.6792
Pr[x>a): 39.3%
Q[R|a]: 1.4470
Price EUR (x) Transform E[x|x>a] Pr[x>a) Q[R|a] Price EUR (x) Transform E[x|x>a] Pr[x>a) Q[R|a]
$20 1,325 0.25 3.627 40% 80% $20 1,325 0.38 4.212 35% 81%
(0.29) $25 1,424 0.31 3.779 38% 78% -0.11 (0.28) $25 1,424 0.44 4.391 33% 80% -0.09
(0.26) $30 1,497 0.36 3.891 36% 77% -0.10 (0.24) $30 1,497 0.48 4.522 32% 79% -0.08
(0.23) $35 1,552 0.39 3.975 35% 76% -0.09 (0.21) $35 1,552 0.50 4.621 31% 78% -0.07
(0.18) $40 1,591 0.42 4.035 34% 75% -0.07 (0.17) $40 1,591 0.52 4.690 30% 77% -0.06
(0.15) $45 1,620 0.43 4.079 33% 74% -0.06 (0.14) $45 1,620 0.54 4.742 30% 77% -0.05
(0.11) $50 1,639 0.44 4.108 33% 74% -0.04 (0.10) $50 1,639 0.55 4.776 29% 76% -0.04
(0.06) $60 1,657 0.45 4.136 33% 74% -0.02 (0.06) $60 1,657 0.56 4.808 29% 76% -0.02
0.00 $70 1,656 0.45 4.134 33% 74% 0.00 0.00 $70 1,656 0.56 4.806 29% 76% 0.00
0.06 $80 1,643 0.45 4.114 33% 74% 0.02 0.06 $80 1,643 0.55 4.783 29% 76% 0.02
0.11 $90 1,623 0.43 4.084 33% 74% 0.04 0.10 $90 1,623 0.54 4.747 29% 77% 0.03
0.15 $100 1,597 0.42 4.044 34% 75% 0.06 0.14 $100 1,597 0.53 4.701 30% 77% 0.05
EUR
Distribution
Cana Woodford This table is based on play-specific coefficient of variation
Baseline Results (scaled factor prices)
% of wells and technical recoverable reserves economic at given price: % of wells and technical recoverable reserves economic at given price:
Well
Elasticity
Full Cycle Reserve
Elasticity
Well
Elasticity
Full Cycle Reserve
Elasticity
(0.29)
(0.26)(0.23)
(0.18)(0.15)(0.11)
(0.06)
0.00
0.06
0.11
0.15
$0
$10
$20
$30
$40
$50
$60
$70
$80
$90
$100
0% 10% 20% 30% 40% 50% 60% 70% 80% 90% 100%
$/b
arr
el, W
TI
Percent of Drill Sites that are Economic at Given Price(elasticities to the right)
Average EUR Variability Play Specific EUR Variability
Cana Woodford
-0.11
-0.10-0.09
-0.07-0.06-0.04
-0.02
0.00
0.02
0.04
0.06
$0
$10
$20
$30
$40
$50
$60
$70
$80
$90
$100
0% 10% 20% 30% 40% 50% 60% 70% 80% 90% 100%
$/b
arr
el, W
TI
Percent of Recoverable Resources that are Economic (elasticities to the right)
Average EUR Variability Play Specific EUR Variability
Cana Woodford
Page 154
Appendix D: Reserve Elasticity & Drill Site Elasticity, Dynamic Cost Scenario, Alternative Coefficients of Variation.
D-18
Mississippian
min: 0.0000
median: 0.2274
mean: 0.4100
m: -1.4809
s: 1.0857
h: 1.5000
mean: 0.4100
stdev: 0.6150
a=b/e eur: 1.3590
transform: 1.6466
E[x|x>a]: 2.3654
Pr[x>a): 5.0%
Q[R|a]: 0.1178
Price EUR (x) Transform E[x|x>a] Pr[x>a) Q[R|a] Price EUR (x) Transform E[x|x>a] Pr[x>a) Q[R|a]
$20 524 0.77 1.158 22% 62% $20 524 0.83 1.345 20% 67%
0.13 $25 512 0.75 1.140 23% 63% 0.06 0.11 $25 512 0.81 1.324 21% 68% 0.04
0.21 $30 496 0.72 1.116 24% 64% 0.09 0.19 $30 496 0.78 1.296 22% 69% 0.07
0.29 $35 478 0.68 1.089 25% 66% 0.13 0.25 $35 478 0.75 1.265 23% 70% 0.10
0.34 $40 460 0.65 1.062 26% 67% 0.15 0.30 $40 460 0.72 1.234 23% 71% 0.11
0.37 $45 443 0.61 1.036 27% 68% 0.16 0.33 $45 443 0.69 1.204 24% 72% 0.12
0.39 $50 427 0.58 1.012 28% 69% 0.17 0.35 $50 427 0.66 1.176 25% 73% 0.13
0.43 $60 397 0.51 0.967 30% 72% 0.18 0.39 $60 397 0.61 1.124 27% 74% 0.14
0.46 $70 371 0.45 0.927 33% 74% 0.19 0.42 $70 371 0.55 1.078 29% 76% 0.15
0.46 $80 349 0.39 0.893 35% 76% 0.18 0.42 $80 349 0.51 1.038 31% 78% 0.14
0.48 $90 329 0.34 0.863 37% 77% 0.19 0.45 $90 329 0.46 1.003 32% 79% 0.15
0.47 $100 312 0.29 0.837 39% 79% 0.18 0.44 $100 312 0.42 0.972 34% 80% 0.14
EUR
Distribution
Mississippian This table is based on play-specific coefficient of variation
Baseline Results (scaled factor prices)
% of wells and technical recoverable reserves economic at given price: % of wells and technical recoverable reserves economic at given price:
Well
Elasticity
Full Cycle Reserve
Elasticity
Well
Elasticity
Full Cycle Reserve
Elasticity
0.13 0.21 0.29 0.34 0.37 0.39
0.43
0.46
0.46
0.48
0.47
$0
$10
$20
$30
$40
$50
$60
$70
$80
$90
$100
0% 10% 20% 30% 40% 50% 60% 70% 80% 90% 100%
$/b
arr
el, W
TI
Percent of Drill Sites that are Economic at Given Price(elasticities to the right)
Average EUR Variability Play Specific Variability
Mississippian
0.060.09
0.130.15
0.160.17
0.18
0.19
0.18
0.19
0.18
$0
$10
$20
$30
$40
$50
$60
$70
$80
$90
$100
0% 10% 20% 30% 40% 50% 60% 70% 80% 90% 100%
$/b
arr
el, W
TI
Percent of Recoverable Resources that are Economic(elasticities to the right)
Average EUR Variability Play Specific EUR Variability
Mississippian
Page 155
Appendix D: Reserve Elasticity & Drill Site Elasticity, Dynamic Cost Scenario, Alternative Coefficients of Variation.
D-19
Marmaton
min: 0.0000
median: 0.1115
mean: 0.2010
m: -2.1938
s: 1.0857
h: 1.5000
mean: 0.2010
stdev: 0.3015
a=b/e eur: 1.3590
transform: 2.3032
E[x|x>a]: 2.1114
Pr[x>a): 1.1%
Q[R|a]: 0.0225
Price EUR (x) Transform E[x|x>a] Pr[x>a) Q[R|a] Price EUR (x) Transform E[x|x>a] Pr[x>a) Q[R|a]
$20 462 1.31 0.869 10% 41% $20 462 1.29 1.001 10% 49%
0.69 $25 420 1.22 0.808 11% 45% 0.36 0.59 $25 420 1.22 0.932 11% 52% 0.27
0.74 $30 385 1.14 0.757 13% 48% 0.38 0.63 $30 385 1.15 0.875 13% 55% 0.28
0.73 $35 357 1.07 0.716 14% 51% 0.37 0.63 $35 357 1.09 0.828 14% 57% 0.27
0.75 $40 333 1.01 0.681 16% 53% 0.37 0.65 $40 333 1.03 0.788 15% 59% 0.28
0.77 $45 312 0.95 0.650 17% 55% 0.37 0.67 $45 312 0.98 0.753 16% 61% 0.28
0.72 $50 295 0.90 0.625 19% 58% 0.34 0.63 $50 295 0.94 0.724 17% 63% 0.26
0.74 $60 266 0.80 0.581 21% 61% 0.34 0.65 $60 266 0.85 0.675 20% 66% 0.26
0.72 $70 243 0.72 0.547 24% 64% 0.33 0.64 $70 243 0.78 0.635 22% 69% 0.25
0.68 $80 225 0.65 0.520 26% 67% 0.30 0.61 $80 225 0.72 0.604 24% 71% 0.23
0.66 $90 210 0.58 0.497 28% 69% 0.28 0.60 $90 210 0.67 0.578 25% 73% 0.22
0.66 $100 197 0.52 0.477 30% 71% 0.28 0.60 $100 197 0.62 0.555 27% 74% 0.21
EUR
Distribution
Marmaton This table is based on play-specific coefficient of variation
Baseline Results (scaled factor prices)
% of wells and technical recoverable reserves economic at given price: % of wells and technical recoverable reserves economic at given price:
Well
Elasticity
Full Cycle Reserve
Elasticity
Well
Elasticity
Full Cycle Reserve
Elasticity
0.69
0.74 0.73
0.75 0.77
0.72
0.74
0.72
0.68
0.66
0.66
$0
$10
$20
$30
$40
$50
$60
$70
$80
$90
$100
0% 10% 20% 30% 40% 50% 60% 70% 80% 90% 100%
$/b
arr
el, W
TI
Percent of Drill Sites that are Economic at Given Price(elasticities to the right)
Average EUR Variability Play Specific EUR Variability
Marmaton
0.36
0.380.37
0.370.37
0.34
0.34
0.33
0.30
0.28
0.28
$0
$10
$20
$30
$40
$50
$60
$70
$80
$90
$100
0% 10% 20% 30% 40% 50% 60% 70% 80% 90% 100%
$/b
arr
el, W
TI
Percent of Recoverable Resources that are Economic(elasticities to the right)
Average EUR Variability Play Specific EUR Variability
Marmaton
Page 156
Appendix D: Reserve Elasticity & Drill Site Elasticity, Dynamic Cost Scenario, Alternative Coefficients of Variation.
D-20
Tonkawa
min: 0.0000
median: 0.1381
mean: 0.2490
m: -1.9796
s: 1.0857
h: 1.5000
mean: 0.2490
stdev: 0.3735
a=b/e eur: 1.3590
transform: 2.1060
E[x|x>a]: 2.1754
Pr[x>a): 1.8%
Q[R|a]: 0.0383
Price EUR (x) Transform E[x|x>a] Pr[x>a) Q[R|a] Price EUR (x) Transform E[x|x>a] Pr[x>a) Q[R|a]
$20 545 1.26 1.037 10% 43% $20 545 1.25 1.195 11% 51%
0.62 $25 499 1.18 0.970 12% 46% 0.32 0.53 $25 499 1.18 1.120 12% 53% 0.24
0.66 $30 461 1.11 0.915 13% 49% 0.34 0.57 $30 461 1.12 1.057 13% 56% 0.25
0.70 $35 428 1.04 0.866 15% 52% 0.35 0.61 $35 428 1.06 1.002 14% 58% 0.26
0.69 $40 401 0.98 0.826 16% 54% 0.34 0.60 $40 401 1.01 0.957 16% 60% 0.25
0.72 $45 377 0.92 0.791 18% 56% 0.35 0.63 $45 377 0.96 0.917 17% 62% 0.26
0.69 $50 357 0.87 0.761 19% 58% 0.33 0.60 $50 357 0.92 0.883 18% 64% 0.25
0.70 $60 323 0.78 0.711 22% 62% 0.33 0.62 $60 323 0.84 0.825 20% 67% 0.25
0.66 $70 297 0.71 0.672 24% 65% 0.30 0.59 $70 297 0.77 0.780 22% 69% 0.23
0.67 $80 275 0.63 0.638 26% 67% 0.29 0.60 $80 275 0.71 0.742 24% 71% 0.23
0.64 $90 257 0.57 0.611 28% 70% 0.27 0.58 $90 257 0.66 0.710 26% 73% 0.21
0.62 $100 242 0.52 0.588 30% 72% 0.26 0.56 $100 242 0.61 0.684 27% 74% 0.20
EUR
Distribution
Tonkawa This table is based on play-specific coefficient of variation
Baseline Results (scaled factor prices)
% of wells and technical recoverable reserves economic at given price: % of wells and technical recoverable reserves economic at given price:
Well
Elasticity
Full Cycle Reserve
Elasticity
Well
Elasticity
Full Cycle Reserve
Elasticity
0.62
0.66 0.70
0.69 0.72
0.69
0.70
0.66
0.67
0.64
0.62
$0
$10
$20
$30
$40
$50
$60
$70
$80
$90
$100
0% 10% 20% 30% 40% 50% 60% 70% 80% 90% 100%
$/b
arr
el, W
TI
Percent of Drill Sites that are Economic at Given Price(elasticities to the right)
Average EUR Variability Play Specific EUR Variability
Tonkawa
0.32
0.340.35
0.340.35
0.33
0.33
0.30
0.29
0.27
0.26
$0
$10
$20
$30
$40
$50
$60
$70
$80
$90
$100
0% 10% 20% 30% 40% 50% 60% 70% 80% 90% 100%
$/b
arr
el, W
TI
Percent of Recoverable Resources that are Economic(elasticities to the right)
Average EUR Variability Play Specific EUR Variability
Tonkawa
Page 157
Appendix D: Reserve Elasticity & Drill Site Elasticity, Dynamic Cost Scenario, Alternative Coefficients of Variation.
D-21
Granite Wash
min: 0.0000
median: 0.4083
mean: 0.7360
m: -0.8959
s: 1.0857
h: 1.5000
mean: 0.7360
stdev: 1.1040
a=b/e eur: 1.3590
transform: 1.1077
E[x|x>a]: 2.6981
Pr[x>a): 13.4%
Q[R|a]: 0.3615
Price EUR (x) Transform E[x|x>a] Pr[x>a) Q[R|a] Price EUR (x) Transform E[x|x>a] Pr[x>a) Q[R|a]
$20 1,149 0.95 2.389 17% 55% $20 1,149 0.98 2.768 16% 61%
(0.06) $25 1,161 0.96 2.407 17% 55% -0.03 (0.06) $25 1,161 0.99 2.788 16% 61% -0.02
0.03 $30 1,156 0.96 2.400 17% 55% 0.02 0.03 $30 1,156 0.99 2.780 16% 61% 0.01
0.12 $35 1,141 0.95 2.377 17% 56% 0.06 0.10 $35 1,141 0.98 2.755 16% 61% 0.04
0.19 $40 1,120 0.93 2.346 18% 56% 0.09 0.17 $40 1,120 0.96 2.719 17% 62% 0.07
0.24 $45 1,097 0.91 2.312 18% 57% 0.11 0.21 $45 1,097 0.95 2.680 17% 62% 0.09
0.29 $50 1,072 0.89 2.275 19% 58% 0.14 0.26 $50 1,072 0.93 2.638 18% 63% 0.10
0.35 $60 1,021 0.84 2.199 20% 60% 0.16 0.31 $60 1,021 0.89 2.551 19% 65% 0.12
0.40 $70 973 0.80 2.128 21% 61% 0.18 0.35 $70 973 0.85 2.469 20% 66% 0.14
0.45 $80 927 0.76 2.059 23% 63% 0.20 0.40 $80 927 0.82 2.390 21% 67% 0.16
0.47 $90 886 0.71 1.997 24% 65% 0.21 0.41 $90 886 0.78 2.320 22% 69% 0.16
0.49 $100 848 0.67 1.940 25% 66% 0.22 0.44 $100 848 0.74 2.254 23% 70% 0.17
EUR
Distribution
Granite Wash This table is based on play-specific coefficient of variation
Baseline Results (scaled factor prices)
% of wells and technical recoverable reserves economic at given price: % of wells and technical recoverable reserves economic at given price:
Well
Elasticity
Full Cycle Reserve
Elasticity
Well
Elasticity
Full Cycle Reserve
Elasticity
(0.06)0.03 0.12 0.19 0.24 0.29
0.35
0.40
0.45
0.47
0.49
$0
$10
$20
$30
$40
$50
$60
$70
$80
$90
$100
0% 10% 20% 30% 40% 50% 60% 70% 80% 90% 100%
$/b
arr
el, W
TI
Percent of Drill Sites that are Economic at Given Price(elasticities to the right)
Average EUR Variability Play Specific EUR Variability
Granite Wash
-0.030.020.060.090.110.14
0.16
0.18
0.20
0.21
0.22
$0
$10
$20
$30
$40
$50
$60
$70
$80
$90
$100
0% 10% 20% 30% 40% 50% 60% 70% 80% 90% 100%
$/b
arr
el, W
TI
Percent of Recoverable Resources that are Economic(elasticities to the right)
Average EUR Variability Play Specific EUR Variability
Granite Wash
Page 158
Appendix D: Reserve Elasticity & Drill Site Elasticity, Dynamic Cost Scenario, Alternative Coefficients of Variation.
D-22
Cleveland
min: 0.0000
median: 0.1287
mean: 0.2320
m: -2.0503
s: 1.0857
h: 1.5000
mean: 0.2320
stdev: 0.3480
a=b/e eur: 1.3590
transform: 2.1711
E[x|x>a]: 2.1533
Pr[x>a): 1.5%
Q[R|a]: 0.0322
Price EUR (x) Transform E[x|x>a] Pr[x>a) Q[R|a] Price EUR (x) Transform E[x|x>a] Pr[x>a) Q[R|a]
$20 418 1.09 0.835 14% 50% $20 418 1.10 0.966 14% 57%
0.13 $25 410 1.07 0.824 14% 51% 0.06 0.11 $25 410 1.08 0.953 14% 57% 0.05
0.22 $30 399 1.04 0.807 15% 52% 0.11 0.19 $30 399 1.06 0.934 14% 58% 0.08
0.31 $35 386 1.01 0.788 16% 53% 0.15 0.27 $35 386 1.04 0.913 15% 59% 0.11
0.36 $40 373 0.98 0.769 16% 54% 0.18 0.31 $40 373 1.01 0.891 16% 60% 0.13
0.42 $45 360 0.95 0.750 17% 55% 0.20 0.36 $45 360 0.98 0.869 16% 61% 0.15
0.44 $50 348 0.92 0.732 18% 57% 0.21 0.38 $50 348 0.95 0.849 17% 62% 0.16
0.50 $60 325 0.85 0.698 20% 59% 0.23 0.44 $60 325 0.90 0.810 18% 64% 0.18
0.53 $70 305 0.79 0.668 21% 61% 0.24 0.46 $70 305 0.85 0.775 20% 66% 0.18
0.53 $80 288 0.74 0.643 23% 63% 0.24 0.47 $80 288 0.80 0.746 21% 68% 0.18
0.55 $90 273 0.69 0.620 24% 65% 0.24 0.49 $90 273 0.76 0.720 22% 69% 0.19
0.58 $100 259 0.64 0.599 26% 67% 0.25 0.52 $100 259 0.72 0.696 24% 71% 0.20
EUR
Distribution
Cleveland This table is based on play-specific coefficient of variation
Baseline Results (scaled factor prices)
% of wells and technical recoverable reserves economic at given price: % of wells and technical recoverable reserves economic at given price:
Well
Elasticity
Full Cycle Reserve
Elasticity
Well
Elasticity
Full Cycle Reserve
Elasticity
0.13 0.22 0.31 0.36 0.42 0.44
0.50
0.53
0.53
0.55
0.58
$0
$10
$20
$30
$40
$50
$60
$70
$80
$90
$100
0% 10% 20% 30% 40% 50% 60% 70% 80% 90% 100%
$/b
arr
el, W
TI
Percent of Drill Sites that are Economic at Given Price(elasticities to the right)
Average EUR Variability Play Specific EUR Variability
Cleveland
0.060.110.15
0.180.200.21
0.23
0.24
0.24
0.24
0.25
$0
$10
$20
$30
$40
$50
$60
$70
$80
$90
$100
0% 10% 20% 30% 40% 50% 60% 70% 80% 90% 100%
$/b
arr
el, W
TI
Percent of Recoverable Resources that are Economic(elasticities to the right)
Average EUR Variability Play Specific EUR Variability
Cleveland
Page 159
Appendix D: Reserve Elasticity & Drill Site Elasticity, Dynamic Cost Scenario, Alternative Coefficients of Variation.
D-23
Northern Wattenberg XL
min: 0.0000
median: 0.4033
mean: 0.7270
m: -0.9082
s: 1.0857
h: 1.5000
mean: 0.7270
stdev: 1.0905
a=b/e eur: 1.3590
transform: 1.1190
E[x|x>a]: 2.6894
Pr[x>a): 13.2%
Q[R|a]: 0.3538
Price EUR (x) Transform E[x|x>a] Pr[x>a) Q[R|a] Price EUR (x) Transform E[x|x>a] Pr[x>a) Q[R|a]
$20 1,318 1.09 2.629 14% 50% $20 1,318 1.12 2.237 13% 41%
0.90 $25 1,144 0.96 2.373 17% 55% 0.45 1.12 $25 1,144 0.96 2.014 17% 47% 0.65
0.88 $30 1,015 0.85 2.182 20% 59% 0.42 1.07 $30 1,015 0.82 1.848 21% 52% 0.60
0.84 $35 916 0.76 2.034 22% 63% 0.39 1.01 $35 916 0.70 1.720 24% 57% 0.55
0.81 $40 837 0.67 1.915 25% 66% 0.36 0.96 $40 837 0.60 1.618 27% 61% 0.51
0.77 $45 773 0.60 1.819 27% 69% 0.33 0.91 $45 773 0.51 1.536 31% 64% 0.46
0.74 $50 720 0.53 1.738 30% 71% 0.31 0.86 $50 720 0.43 1.468 33% 67% 0.43
0.71 $60 636 0.42 1.610 34% 75% 0.29 0.80 $60 636 0.29 1.360 39% 72% 0.39
0.65 $70 573 0.32 1.514 37% 78% 0.25 0.73 $70 573 0.17 1.279 43% 76% 0.33
0.62 $80 523 0.24 1.437 41% 80% 0.23 0.68 $80 523 0.07 1.216 47% 79% 0.30
0.58 $90 483 0.17 1.375 43% 82% 0.21 0.62 $90 483 -0.02 1.166 51% 82% 0.26
0.55 $100 450 0.10 1.324 46% 84% 0.19 0.58 $100 450 -0.10 1.124 54% 84% 0.24
Baseline Results (scaled factor prices)
% of wells and technical recoverable reserves economic at given price: % of wells and technical recoverable reserves economic at given price:
Well
Elasticity
Full Cycle Reserve
Elasticity
Well
Elasticity
Full Cycle Reserve
Elasticity
EUR
Distribution
Northern Wattenberg XL This table is based on play-specific coefficient of variation
0.90
0.88 0.84
0.81 0.77
0.74
0.71
0.65
0.62
0.58
0.55
$0
$10
$20
$30
$40
$50
$60
$70
$80
$90
$100
0% 10% 20% 30% 40% 50% 60% 70% 80% 90% 100%
$/b
arr
el, W
TI
Percent of Drill Sites that are Economic at Given Price(elasticities to the right)
Average EUR Variability Play Specific EUR Variability
Northern Wattenberg XL
0.45
0.420.39
0.360.33
0.31
0.29
0.25
0.23
0.21
0.19
$0
$10
$20
$30
$40
$50
$60
$70
$80
$90
$100
0% 10% 20% 30% 40% 50% 60% 70% 80% 90% 100%
$/b
arr
el, W
TI
Percent of Recoverable Resources that are Economic(elasticities to the right)
Average EUR Variability Play Specific EUR Variability
Northern Wattenberg XL
Page 160
Appendix D: Reserve Elasticity & Drill Site Elasticity, Dynamic Cost Scenario, Alternative Coefficients of Variation.
D-24
Northern Wattenberg
min: 0.0000
median: 0.1980
mean: 0.3570
m: -1.6193
s: 1.0857
h: 1.5000
mean: 0.3570
stdev: 0.5355
a=b/e eur: 1.3590
transform: 1.7741
E[x|x>a]: 2.3059
Pr[x>a): 3.8%
Q[R|a]: 0.0877
Price EUR (x) Transform E[x|x>a] Pr[x>a) Q[R|a] Price EUR (x) Transform E[x|x>a] Pr[x>a) Q[R|a]
$20 725 1.20 1.405 12% 46% $20 725 1.24 1.198 11% 36%
0.98 $25 627 1.06 1.262 14% 51% 0.50 1.22 $25 627 1.08 1.073 14% 42% 0.73
0.94 $30 555 0.95 1.155 17% 55% 0.46 1.16 $30 555 0.94 0.980 17% 48% 0.67
0.89 $35 501 0.85 1.075 20% 59% 0.42 1.08 $35 501 0.83 0.911 20% 52% 0.60
0.87 $40 457 0.77 1.010 22% 62% 0.40 1.05 $40 457 0.72 0.854 24% 56% 0.57
0.82 $45 422 0.70 0.957 24% 65% 0.37 0.98 $45 422 0.63 0.809 26% 60% 0.52
0.79 $50 393 0.63 0.913 26% 68% 0.34 0.93 $50 393 0.55 0.771 29% 63% 0.48
0.75 $60 347 0.52 0.844 30% 72% 0.32 0.87 $60 347 0.41 0.712 34% 68% 0.44
0.71 $70 312 0.42 0.790 34% 75% 0.29 0.81 $70 312 0.29 0.667 39% 72% 0.39
0.66 $80 285 0.34 0.749 37% 77% 0.26 0.73 $80 285 0.18 0.633 43% 76% 0.34
0.63 $90 263 0.26 0.715 40% 80% 0.23 0.69 $90 263 0.09 0.605 46% 78% 0.30
0.59 $100 245 0.20 0.687 42% 81% 0.21 0.64 $100 245 0.01 0.582 49% 81% 0.27
Baseline Results (scaled factor prices)
% of wells and technical recoverable reserves economic at given price: % of wells and technical recoverable reserves economic at given price:
Well
Elasticity
Full Cycle Reserve
Elasticity
Well
Elasticity
Full Cycle Reserve
Elasticity
EUR
Distribution
Northern Wattenberg This table is based on play-specific coefficient of variation
0.98
0.94 0.89
0.87 0.82
0.79
0.75
0.71
0.66
0.63
0.59
$0
$10
$20
$30
$40
$50
$60
$70
$80
$90
$100
0% 10% 20% 30% 40% 50% 60% 70% 80% 90% 100%
$/b
arr
el, W
TI
Percent of Drill Sites that are Economic at Given Price(elasticities to the right)
Average EUR Variaibility Play Specific EUR Variability
Northern Wattenberg
0.50
0.460.42
0.400.37
0.34
0.32
0.29
0.26
0.23
0.21
$0
$10
$20
$30
$40
$50
$60
$70
$80
$90
$100
0% 10% 20% 30% 40% 50% 60% 70% 80% 90% 100%
$/b
arr
el, W
TI
Percent of Recoverable Resources that are Economic(elasticities to the right)
Average EUR Variability Play Specific EUR Variability
Northern Wattenberg
Page 161
Appendix D: Reserve Elasticity & Drill Site Elasticity, Dynamic Cost Scenario, Alternative Coefficients of Variation.
D-25
Southern Wattenberg
min: 0.0000
median: 0.2191
mean: 0.3950
m: -1.5182
s: 1.0857
h: 1.5000
mean: 0.3950
stdev: 0.5925
a=b/e eur: 1.3590
transform: 1.6810
E[x|x>a]: 2.3488
Pr[x>a): 4.6%
Q[R|a]: 0.1089
Price EUR (x) Transform E[x|x>a] Pr[x>a) Q[R|a] Price EUR (x) Transform E[x|x>a] Pr[x>a) Q[R|a]
$20 656 1.01 1.340 16% 53% $20 656 1.02 1.138 15% 45%
0.55 $25 600 0.93 1.258 18% 56% 0.27 0.68 $25 600 0.92 1.066 18% 49% 0.39
0.61 $30 552 0.85 1.186 20% 59% 0.29 0.74 $30 552 0.82 1.005 21% 52% 0.41
0.65 $35 510 0.78 1.124 22% 62% 0.30 0.79 $35 510 0.73 0.950 23% 56% 0.43
0.65 $40 475 0.71 1.071 24% 65% 0.29 0.78 $40 475 0.65 0.905 26% 59% 0.41
0.65 $45 445 0.65 1.026 26% 67% 0.29 0.77 $45 445 0.58 0.867 28% 62% 0.40
0.67 $50 418 0.59 0.985 28% 69% 0.29 0.79 $50 418 0.50 0.832 31% 65% 0.40
0.65 $60 375 0.49 0.920 31% 72% 0.27 0.74 $60 375 0.38 0.777 35% 69% 0.37
0.61 $70 342 0.41 0.870 34% 75% 0.24 0.69 $70 342 0.28 0.734 39% 73% 0.33
0.62 $80 314 0.33 0.827 37% 77% 0.24 0.69 $80 314 0.18 0.699 43% 76% 0.32
0.57 $90 292 0.26 0.793 40% 79% 0.21 0.62 $90 292 0.10 0.671 46% 78% 0.28
0.56 $100 273 0.20 0.764 42% 81% 0.20 0.61 $100 273 0.02 0.647 49% 81% 0.26
Baseline Results (scaled factor prices)
% of wells and technical recoverable reserves economic at given price: % of wells and technical recoverable reserves economic at given price:
Well
Elasticity
Full Cycle Reserve
Elasticity
Well
Elasticity
Full Cycle Reserve
Elasticity
EUR
Distribution
Southern Wattenberg This table is based on play-specific coefficient of variation
0.55
0.61 0.65
0.65 0.65
0.67
0.65
0.61
0.62
0.57
0.56
$0
$10
$20
$30
$40
$50
$60
$70
$80
$90
$100
0% 10% 20% 30% 40% 50% 60% 70% 80% 90% 100%
$/b
arr
el, W
TI
Percent of Drill Sites that are Economic at Given Price(elasticities to the right)
Average EUR Variability Play Specific EUR Variability
Southern Wattenberg
0.27
0.290.30
0.290.29
0.29
0.27
0.24
0.24
0.21
0.20
$0
$10
$20
$30
$40
$50
$60
$70
$80
$90
$100
0% 10% 20% 30% 40% 50% 60% 70% 80% 90% 100%
$/b
arr
el, W
TI
Percent of Recoverable Resources that are Economic(elasticities to the right)
Average EUR Variability Play Specific EUR Variability
Southern Wattenberg
Page 162
Appendix D: Reserve Elasticity & Drill Site Elasticity, Dynamic Cost Scenario, Alternative Coefficients of Variation.
D-26
Greater Monument Butte
min: 0.0000
median: 0.1043
mean: 0.1880
m: -2.2606
s: 1.0857
h: 1.5000
mean: 0.1880
stdev: 0.2820
a=b/e eur: 1.3590
transform: 2.3648
E[x|x>a]: 2.0932
Pr[x>a): 0.9%
Q[R|a]: 0.0189
Price EUR (x) Transform E[x|x>a] Pr[x>a) Q[R|a] Price EUR (x) Transform E[x|x>a] Pr[x>a) Q[R|a]
$20 510 1.46 0.924 7% 35%
1.99 $25 389 1.21 0.750 11% 45% 1.08
1.62 $30 319 1.03 0.648 15% 52% 0.82
1.39 $35 273 0.89 0.580 19% 58% 0.67
1.23 $40 240 0.77 0.531 22% 62% 0.57
1.12 $45 215 0.67 0.493 25% 66% 0.50
1.00 $50 196 0.58 0.464 28% 69% 0.43
0.93 $60 167 0.43 0.420 33% 74% 0.38
0.80 $70 147 0.32 0.390 38% 78% 0.31
0.72 $80 132 0.22 0.367 41% 81% 0.27
0.62 $90 121 0.14 0.350 45% 83% 0.22
0.65 $100 111 0.06 0.334 48% 85% 0.22
Baseline Results (scaled factor prices)
% of wells and technical recoverable reserves economic at given price: % of wells and technical recoverable reserves economic at given price:
Well
Elasticity
Full Cycle Reserve
Elasticity
Well
Elasticity
Full Cycle Reserve
Elasticity
EUR
Distribution
Greater Monument Butte (Uinta) This table is based on play-specific coefficient of variation
1.99
1.62 1.39
1.23 1.12
1.00
0.93
0.80
0.72
0.62
0.65
$0
$10
$20
$30
$40
$50
$60
$70
$80
$90
$100
0% 10% 20% 30% 40% 50% 60% 70% 80% 90% 100%
$/b
arr
el, W
TI
Percent of Drill Sites that are Economic at Given Price(elasticities to the right)
Average EUR Variaibility Play Specific EUR Variability
Greater Monument Butte (Uinta)
1.080.82
0.670.57
0.500.43
0.38
0.31
0.27
0.22
0.22
$0
$10
$20
$30
$40
$50
$60
$70
$80
$90
$100
0% 10% 20% 30% 40% 50% 60% 70% 80% 90% 100%
$/b
arr
el, W
TI
Percent of Recoverable Resources that are Economic(elasticities to the right)
Average EUR Variability Play Specific EUR Variability
Greater Monument Butte (Uinta)
Page 163
Appendix D: Reserve Elasticity & Drill Site Elasticity, Dynamic Cost Scenario, Alternative Coefficients of Variation.
D-27
Wasatch SXL
min: 0.0000
median: 0.5547
mean: 1.0000
m: -0.5893
s: 1.0857
h: 1.5000
mean: 1.0000
stdev: 1.5000
a=b/e eur: 1.3590
transform: 0.8254
E[x|x>a]: 2.9459
Pr[x>a): 20.5%
Q[R|a]: 0.6027
Price EUR (x) Transform E[x|x>a] Pr[x>a) Q[R|a] Price EUR (x) Transform E[x|x>a] Pr[x>a) Q[R|a]
$20 2,760 1.48 4.984 7% 35%
1.10 $25 2,391 1.35 4.456 9% 40% 0.60
1.08 $30 2,117 1.23 4.060 11% 44% 0.57
1.05 $35 1,907 1.14 3.754 13% 48% 0.54
1.01 $40 1,740 1.05 3.510 15% 51% 0.51
0.98 $45 1,604 0.98 3.310 16% 54% 0.48
0.95 $50 1,491 0.91 3.142 18% 57% 0.45
0.90 $60 1,314 0.79 2.879 21% 61% 0.42
0.84 $70 1,182 0.70 2.681 24% 65% 0.38
0.80 $80 1,078 0.61 2.524 27% 68% 0.35
0.75 $90 995 0.54 2.398 30% 71% 0.32
0.72 $100 926 0.47 2.293 32% 73% 0.29
Baseline Results (scaled factor prices)
% of wells and technical recoverable reserves economic at given price: % of wells and technical recoverable reserves economic at given price:
Well
Elasticity
Full Cycle Reserve
Elasticity
Well
Elasticity
Full Cycle Reserve
Elasticity
EUR
Distribution
Wasatch SXL This table is based on play-specific coefficient of variation
1.10
1.08 1.05
1.01 0.98
0.95
0.90
0.84
0.80
0.75
0.72
$0
$10
$20
$30
$40
$50
$60
$70
$80
$90
$100
0% 10% 20% 30% 40% 50% 60% 70% 80% 90% 100%
$/b
arr
el, W
TI
Percent of Drill Sites that are Economic at Given Price(elasticities to the right)
Average EUR Variability Play Specific EUR Variability
Wasatch SXL
0.60
0.570.54
0.510.48
0.45
0.42
0.38
0.35
0.32
0.29
$0
$10
$20
$30
$40
$50
$60
$70
$80
$90
$100
0% 10% 20% 30% 40% 50% 60% 70% 80% 90% 100%
$/b
arr
el, W
TI
Percent of Recoverable Resources that are Economic(elasticities to the right)
Average EUR Variability Play Specific EUR Variability
Wasatch SXL
Page 164
Appendix D: Reserve Elasticity & Drill Site Elasticity, Dynamic Cost Scenario, Alternative Coefficients of Variation.
D-28
Uteland Butte SXL
min: 0.0000
median: 0.3883
mean: 0.7000
m: -0.9460
s: 1.0857
h: 1.5000
mean: 0.7000
stdev: 1.0500
a=b/e eur: 1.3590
transform: 1.1539
E[x|x>a]: 2.6632
Pr[x>a): 12.4%
Q[R|a]: 0.3310
Price EUR (x) Transform E[x|x>a] Pr[x>a) Q[R|a] Price EUR (x) Transform E[x|x>a] Pr[x>a) Q[R|a]
$20 13,112 3.24 18.313 0% 0%
$25 6,360 2.58 9.529 0% 0%
11.00 $30 4,245 2.20 6.693 1% 13% 11.00
3.94 $35 3,214 1.95 5.283 3% 19% 2.50
3.21 $40 2,604 1.75 4.437 4% 25% 1.94
2.73 $45 2,200 1.60 3.869 6% 30% 1.59
2.39 $50 1,913 1.47 3.462 7% 35% 1.35
2.04 $60 1,531 1.26 2.913 10% 43% 1.11
1.73 $70 1,287 1.10 2.558 13% 49% 0.89
1.51 $80 1,118 0.97 2.310 17% 54% 0.75
1.35 $90 993 0.86 2.124 19% 59% 0.65
1.24 $100 896 0.77 1.980 22% 62% 0.57
Baseline Results (scaled factor prices)
% of wells and technical recoverable reserves economic at given price: % of wells and technical recoverable reserves economic at given price:
Well
Elasticity
Full Cycle Reserve
Elasticity
Well
Elasticity
Full Cycle Reserve
Elasticity
EUR
Distribution
Uteland Butte SXL This table is based on play-specific coefficient of variation
11.00 3.94
3.21 2.73
2.39
2.04
1.73
1.51
1.35
1.24
$0
$10
$20
$30
$40
$50
$60
$70
$80
$90
$100
0% 10% 20% 30% 40% 50% 60% 70% 80% 90% 100%
$/b
arr
el, W
TI
Percent of Drill Sites that are Economic at Given Price(elasticities to the right)
Average EUR Variaibility Play Specific EUR Variability
Uteland Butte SXL
11.002.50
1.941.59
1.35
1.11
0.89
0.75
0.65
0.57
$0
$10
$20
$30
$40
$50
$60
$70
$80
$90
$100
0% 10% 20% 30% 40% 50% 60% 70% 80% 90% 100%
$/b
arr
el, W
TI
Percent of Recoverable Resources that are Economic(elasticities to the right)
Average EUR Variability Play Specific EUR Variability
Uteland Butte SXL
Page 165
Appendix D: Reserve Elasticity & Drill Site Elasticity, Dynamic Cost Scenario, Alternative Coefficients of Variation.
D-29
SW PA Wet Gas
min: 0.0000
median: 1.6269
mean: 2.9330
m: 0.4867
s: 1.0857
h: 1.5000
mean: 2.9330
stdev: 4.3995
a=b/e eur: 1.3590
transform: -0.1658
E[x|x>a]: 4.6373
Pr[x>a): 56.6%
Q[R|a]: 2.6239
Price EUR (x) Transform E[x|x>a] Pr[x>a) Q[R|a]
$20 2,119 0.24 5.811 40% 80%
(0.27) $25 2,266 0.31 6.037 38% 78% -0.10
(0.20) $30 2,356 0.34 6.176 37% 77% -0.08
(0.12) $35 2,403 0.36 6.248 36% 77% -0.05
(0.05) $40 2,419 0.37 6.272 36% 76% -0.02
0.02 $45 2,413 0.36 6.263 36% 77% 0.01
0.08 $50 2,391 0.35 6.229 36% 77% 0.03
0.16 $60 2,319 0.33 6.119 37% 78% 0.06
0.24 $70 2,228 0.29 5.979 39% 79% 0.09
0.30 $80 2,131 0.25 5.830 40% 80% 0.11
0.34 $90 2,036 0.21 5.684 42% 81% 0.12
0.37 $100 1,944 0.16 5.542 43% 82% 0.13
EUR
Distribution
SW PA Wet Gas
Baseline Results (scaled factor prices)
% of wells and technical recoverable reserves economic at given price:
Well
Elasticity
Full Cycle Reserve
Elasticity
(0.27)
(0.20)(0.12)(0.05)0.02 0.08
0.16
0.24
0.30
0.34
0.37
$0
$10
$20
$30
$40
$50
$60
$70
$80
$90
$100
0% 10% 20% 30% 40% 50% 60% 70% 80% 90% 100%
$/b
arr
el, W
TI
Percent of Drill Sites that are Economic at Given Price(elasticities to the right)
Average EUR Variability Play Specific EUR Variability
SW PA Wet Gas
-0.10
-0.08-0.05-0.020.010.03
0.06
0.09
0.11
0.12
0.13
1$0
$10
$20
$30
$40
$50
$60
$70
$80
$90
$100
0% 10% 20% 30% 40% 50% 60% 70% 80% 90% 100%
$/b
arr
el, W
TI
Percent of Recoverable Resources that are Economic(elasticities to the right)
Average EUR Variability Play Specific EUR Variability
SW PA Wet Gas
Page 166
Appendix D: Reserve Elasticity & Drill Site Elasticity, Dynamic Cost Scenario, Alternative Coefficients of Variation.
D-30
SW PA Super Rich
min: 0.0000
median: 1.1926
mean: 2.1500
m: 0.1761
s: 1.0857
h: 1.5000
mean: 2.1500
stdev: 3.2250
a=b/e eur: 1.3590
transform: 0.1203
E[x|x>a]: 3.9603
Pr[x>a): 45.2%
Q[R|a]: 1.7906
Price EUR (x) Transform E[x|x>a] Pr[x>a) Q[R|a]
$20 2,044 0.50 5.011 31% 72%
(0.16) $25 2,112 0.53 5.115 30% 71% -0.06
(0.05) $30 2,130 0.53 5.142 30% 71% -0.02
0.05 $35 2,116 0.53 5.121 30% 71% 0.02
0.13 $40 2,083 0.51 5.070 30% 72% 0.05
0.20 $45 2,038 0.49 5.002 31% 72% 0.08
0.25 $50 1,987 0.47 4.924 32% 73% 0.10
0.31 $60 1,879 0.42 4.760 34% 75% 0.12
0.37 $70 1,772 0.36 4.596 36% 76% 0.15
0.41 $80 1,672 0.31 4.442 38% 78% 0.16
0.44 $90 1,580 0.26 4.301 40% 80% 0.16
0.45 $100 1,497 0.21 4.173 42% 81% 0.16
EUR
Distribution
SW PA Super Rich
Baseline Results (scaled factor prices)
% of wells and technical recoverable reserves economic at given price:
Well
Elasticity
Full Cycle Reserve
Elasticity
(0.16)(0.05)0.05 0.13 0.20 0.25
0.31
0.37
0.41
0.44
0.45
$0
$10
$20
$30
$40
$50
$60
$70
$80
$90
$100
0% 10% 20% 30% 40% 50% 60% 70% 80% 90% 100%
$/b
arr
el, W
TI
Percent of Drill Sites that are Economic at Given Price(elasticities to the right)
Average EUR Variability Play Specific EUR Variability
SW PA Super Rich
-0.06-0.020.020.050.080.10
0.12
0.15
0.16
0.16
0.16
1$0
$10
$20
$30
$40
$50
$60
$70
$80
$90
$100
0% 10% 20% 30% 40% 50% 60% 70% 80% 90% 100%
$/b
arr
el, W
TI
Percent of Recoverable Resources that are Economic(elasticities to the right)
Average EUR Variability Play Specific EUR Variability
SW PA Super Rich
Page 167
Appendix D: Reserve Elasticity & Drill Site Elasticity, Dynamic Cost Scenario, Alternative Coefficients of Variation.
D-31
Utica Wet Gas
min: 0.0000
median: 1.6641
mean: 3.0000
m: 0.5093
s: 1.0857
h: 1.5000
mean: 3.0000
stdev: 4.5000
a=b/e eur: 1.3590
transform: -0.1866
E[x|x>a]: 4.6953
Pr[x>a): 57.4%
Q[R|a]: 2.6951
Price EUR (x) Transform E[x|x>a] Pr[x>a) Q[R|a]
$20 2,447 0.36 6.374 36% 77%
(0.53) $25 2,754 0.46 6.843 32% 73% -0.21
(0.52) $30 3,013 0.55 7.237 29% 71% -0.21
(0.50) $35 3,229 0.61 7.564 27% 68% -0.21
(0.46) $40 3,408 0.66 7.834 25% 66% -0.20
(0.41) $45 3,552 0.70 8.051 24% 65% -0.18
(0.36) $50 3,667 0.73 8.224 23% 64% -0.16
(0.28) $60 3,822 0.77 8.457 22% 63% -0.12
(0.16) $70 3,898 0.78 8.570 22% 62% -0.07
(0.05) $80 3,917 0.79 8.599 22% 62% -0.02
0.06 $90 3,896 0.78 8.567 22% 62% 0.03
(0.16) $100 3,948 0.80 8.645 21% 61% -0.07
EUR
Distribution
Utica Wet Gas
Baseline Results (scaled factor prices)
% of wells and technical recoverable reserves economic at given price:
Well
Elasticity
Full Cycle Reserve
Elasticity
(0.53)
(0.52)(0.50)
(0.46)(0.41)
(0.36)
(0.28)
(0.16)
(0.05)
0.06
(0.16)
$0
$10
$20
$30
$40
$50
$60
$70
$80
$90
$100
0% 10% 20% 30% 40% 50% 60% 70% 80% 90% 100%
$/b
arr
el, W
TI
Percent of Drill Sites that are Economic at Given Price(elasticities to the right)
Average EUR Variability Play Specific EUR Variability
Utica Wet Gas
-0.21
-0.21-0.21
-0.20-0.18
-0.16
-0.12
-0.07
-0.02
0.03
-0.07
1$0
$10
$20
$30
$40
$50
$60
$70
$80
$90
$100
0% 10% 20% 30% 40% 50% 60% 70% 80% 90% 100%
$/b
arr
el, W
TI
Percent of Recoverable Resources that are Economic(elasticities to the right)
Average EUR Variability Play Specific EUR Variability
Utica Wet Gas
Page 168
Appendix D: Reserve Elasticity & Drill Site Elasticity, Dynamic Cost Scenario, Alternative Coefficients of Variation.
D-32
Utica Condensate
min: 0.0000
median: 0.6579
mean: 1.1860
m: -0.4187
s: 1.0857
h: 1.5000
mean: 1.1860
stdev: 1.7790
a=b/e eur: 1.3590
transform: 0.6682
E[x|x>a]: 3.1149
Pr[x>a): 25.2%
Q[R|a]: 0.7849
Price EUR (x) Transform E[x|x>a] Pr[x>a) Q[R|a]
$20 2,015 1.03 4.091 15% 52%
0.10 $25 1,984 1.02 4.046 15% 53% 0.05
0.24 $30 1,924 0.99 3.957 16% 54% 0.12
0.34 $35 1,853 0.95 3.852 17% 55% 0.16
0.41 $40 1,779 0.92 3.743 18% 57% 0.20
0.47 $45 1,706 0.88 3.634 19% 58% 0.22
0.52 $50 1,636 0.84 3.530 20% 60% 0.24
0.56 $60 1,509 0.76 3.340 22% 63% 0.26
0.59 $70 1,399 0.69 3.175 24% 65% 0.27
0.61 $80 1,305 0.63 3.033 26% 68% 0.26
0.62 $90 1,223 0.57 2.909 28% 70% 0.26
0.61 $100 1,152 0.52 2.802 30% 72% 0.26
EUR
Distribution
Utica Condensate
Baseline Results (scaled factor prices)
% of wells and technical recoverable reserves economic at given price:
Well
Elasticity
Full Cycle Reserve
Elasticity
0.10 0.24 0.34 0.41 0.47 0.52
0.56
0.59
0.61
0.62
0.61
$0
$10
$20
$30
$40
$50
$60
$70
$80
$90
$100
0% 10% 20% 30% 40% 50% 60% 70% 80% 90% 100%
$/b
arr
el, W
TI
Percent of Drill Sites that are Economic at Given Price(elasticities to the right)
Average EUR Variability Play Specific EUR Variability
Utica Condensate
0.050.12
0.160.20
0.220.24
0.26
0.27
0.26
0.26
0.26
1$0
$10
$20
$30
$40
$50
$60
$70
$80
$90
$100
0% 10% 20% 30% 40% 50% 60% 70% 80% 90% 100%
$/b
arr
el, W
TI
Percent of Recoverable Resources that are Economic(elasticities to the right)
Average EUR Variability Play Specific EUR Variability
Utica Condensate
Page 169
Appendix D: Reserve Elasticity & Drill Site Elasticity, Dynamic Cost Scenario, Alternative Coefficients of Variation.
D-33
San Juan - Gallup
min: 0.0000
median: 0.2502
mean: 0.4510
m: -1.3856
s: 1.0857
h: 1.5000
mean: 0.4510
stdev: 0.6765
a=b/e eur: 1.3590
transform: 1.5588
E[x|x>a]: 2.4100
Pr[x>a): 6.0%
Q[R|a]: 0.1434
Price EUR (x) Transform E[x|x>a] Pr[x>a) Q[R|a]
$20 700 0.95 1.458 17% 55%
0.76 $25 616 0.83 1.333 20% 60% 0.36
0.74 $30 553 0.73 1.239 23% 64% 0.34
0.71 $35 504 0.65 1.165 26% 67% 0.31
0.70 $40 464 0.57 1.105 28% 70% 0.30
0.67 $45 431 0.50 1.055 31% 72% 0.28
0.66 $50 403 0.44 1.012 33% 74% 0.27
0.61 $60 360 0.34 0.946 37% 77% 0.24
0.59 $70 326 0.24 0.894 40% 80% 0.22
0.54 $80 300 0.17 0.854 43% 82% 0.19
0.53 $90 278 0.10 0.820 46% 84% 0.18
0.49 $100 260 0.04 0.792 49% 85% 0.16
EUR
Distribution
San Juan Gallup
Baseline Results (scaled factor prices)
% of wells and technical recoverable reserves economic at given price:
Well
Elasticity
Full Cycle Reserve
Elasticity
0.76
0.74 0.71
0.70 0.67
0.66
0.61
0.59
0.54
0.53
0.49
$0
$10
$20
$30
$40
$50
$60
$70
$80
$90
$100
0% 10% 20% 30% 40% 50% 60% 70% 80% 90% 100%
$/b
arr
el, W
TI
Percent of Drill Sites that are Economic at Given Price(elasticities to the right)
Average EUR Variability Play Specific EUR Variability
San Juan Gallup
0.36
0.340.31
0.300.28
0.27
0.24
0.22
0.19
0.18
0.16
1$0
$10
$20
$30
$40
$50
$60
$70
$80
$90
$100
0% 10% 20% 30% 40% 50% 60% 70% 80% 90% 100%
$/b
arr
el, W
TI
Percent of Recoverable Resources that are Economic(elasticities to the right)
Average EUR Variability Play Specific EUR Variability
San Juan Gallup
Page 170
Appendix D: Reserve Elasticity & Drill Site Elasticity, Dynamic Cost Scenario, Alternative Coefficients of Variation.
D-34
Tuscaloosa Marine Shale
min: 0.0000
median: 0.3789
mean: 0.6830
m: -0.9706
s: 1.0857
h: 1.5000
mean: 0.6830
stdev: 1.0245
a=b/e eur: 1.3590
transform: 1.1766
E[x|x>a]: 2.6466
Pr[x>a): 12.0%
Q[R|a]: 0.3168
Price EUR (x) Transform E[x|x>a] Pr[x>a) Q[R|a]
$20 2,844 1.86 4.751 3% 22%
2.53 $25 2,118 1.59 3.735 6% 31% 1.50
2.06 $30 1,711 1.39 3.155 8% 38% 1.15
1.75 $35 1,450 1.24 2.779 11% 44% 0.94
1.56 $40 1,266 1.11 2.511 13% 49% 0.80
1.40 $45 1,130 1.01 2.311 16% 53% 0.69
1.29 $50 1,024 0.92 2.155 18% 57% 0.62
1.15 $60 870 0.77 1.925 22% 63% 0.54
1.02 $70 763 0.64 1.764 26% 67% 0.45
0.93 $80 683 0.54 1.643 29% 71% 0.39
0.84 $90 622 0.46 1.550 32% 74% 0.34
0.79 $100 572 0.38 1.474 35% 76% 0.31
EUR
Distribution
Tuscaloosa Marine Shale
Baseline Results (scaled factor prices)
% of wells and technical recoverable reserves economic at given price:
Well
Elasticity
Full Cycle Reserve
Elasticity
2.53
2.06 1.75
1.56 1.40
1.29
1.15
1.02
0.93
0.84
0.79
$0
$10
$20
$30
$40
$50
$60
$70
$80
$90
$100
0% 10% 20% 30% 40% 50% 60% 70% 80% 90% 100%
$/b
arr
el, W
TI
Percent of Drill Sites that are Economic at Given Price(elasticities to the right)
Average EUR Variability Play Specific EUR Variability
Tuscaloosa Marine Shale
1.50
1.150.94
0.800.69
0.62
0.54
0.45
0.39
0.34
0.31
1$0
$10
$20
$30
$40
$50
$60
$70
$80
$90
$100
0% 10% 20% 30% 40% 50% 60% 70% 80% 90% 100%
$/b
arr
el, W
TI
Percent of Recoverable Resources that are Economic(elasticities to the right)
Average EUR Variability Play Specific EUR Variability
Tuscaloosa Marine Shale
Page 171
Appendix E: Breakeven Price, by EUR, New Wells vs. DUCs, 2014 Cost Scenario
E-1
Midland Basin Spraberry
Northern Delaware Bone Spring
EUR full cycle DUC ratio reduction
250 $ 128.41 70.41$ 55% -45%
500 70.69$ 41.68$ 59% -41%
750 51.47$ 32.14$ 62% -38%
1,000 41.87$ 27.37$ 65% -35%
mean 753 51.32$ 32.06$ 62% -38%
median 418 82.00$ 47.31$ 58% -42%
Midland Basin: Spraberry
minimum price
Baseline Results (2014 factor prices)
minimum (breakeven) price for the given EUR:
EUR full cycle DUC ratio reduction
250 $ 142.12 77.29$ 54% -46%
500 77.54$ 45.13$ 58% -42%
750 56.05$ 34.45$ 61% -39%
1,000 45.31$ 29.11$ 64% -36%
mean 676 60.75$ 36.79$ 61% -39%
median 375 99.05$ 55.84$ 56% -44%
Northern Delaware Basin: Bone Spring
Baseline Results (2014 factor prices)
minimum (breakeven) price for the given EUR:
minimum price
Page 172
Appendix E: Breakeven Price, by EUR, New Wells vs. DUCs, 2014 Cost Scenario
E-2
Southern Delaware Wolfcamp
Culberson LL Wolfcamp
EUR full cycle DUC ratio reduction
250 $ 189.06 100.24$ 53% -47%
500 100.70$ 56.29$ 56% -44%
750 71.28$ 41.67$ 58% -42%
1,000 56.58$ 34.38$ 61% -39%
mean 883 62.42$ 37.28$ 60% -40%
median 490 102.50$ 57.18$ 56% -44%
Southern Delaware Basin: Wolfcamp
Baseline Results (2014 factor prices)
minimum (breakeven) price for the given EUR:
minimum price
EUR full cycle DUC ratio reduction
250 $ 681.34 342.86$ 50% -50%
500 345.30$ 176.06$ 51% -49%
750 233.29$ 120.46$ 52% -48%
1,000 177.28$ 92.66$ 52% -48%
mean 1,955 95.20$ 51.92$ 55% -45%
median 1,084 164.26$ 86.20$ 52% -48%
Culberson LL: Wolfcamp
Baseline Results (2014 factor prices)
minimum (breakeven) price for the given EUR:
minimum price
Page 173
Appendix E: Breakeven Price, by EUR, New Wells vs. DUCs, 2014 Cost Scenario
E-3
Midland Basin Wolfcamp
Southern Midland Basin Wolfcamp
EUR full cycle DUC ratio reduction
250 $ 155.05 83.88$ 54% -46%
500 84.25$ 48.66$ 58% -42%
750 60.68$ 36.95$ 61% -39%
1,000 48.90$ 31.11$ 64% -36%
mean 746 60.93$ 37.08$ 61% -39%
median 414 98.94$ 55.96$ 57% -43%
Baseline Results (2014 factor prices)
minimum (breakeven) price for the given EUR:
minimum price
Midland Basin: Wolfcamp
EUR full cycle DUC ratio reduction
250 $ 138.81 75.68$ 55% -45%
500 75.97$ 44.41$ 58% -42%
750 55.07$ 34.02$ 62% -38%
1,000 44.62$ 28.84$ 65% -35%
mean 500 75.97$ 44.41$ 58% -42%
median 277 126.55$ 69.57$ 55% -45%
Southern Midland Basin: Wolfcamp
Baseline Results (2014 factor prices)
minimum (breakeven) price for the given EUR:
minimum price
Page 174
Appendix E: Breakeven Price, by EUR, New Wells vs. DUCs, 2014 Cost Scenario
E-4
Eagle Ford Condensate
Eagle Ford Oil
EUR full cycle DUC ratio reduction
250 $ 170.66 92.76$ 54% -46%
500 93.14$ 54.19$ 58% -42%
750 67.33$ 41.37$ 61% -39%
1,000 54.44$ 34.96$ 64% -36%
mean 801 64.05$ 39.74$ 62% -38%
median 444 102.91$ 59.05$ 57% -43%
Eagle Ford: Condensate Region
Baseline Results (2014 factor prices)
minimum (breakeven) price for the given EUR:
minimum price
EUR full cycle DUC ratio reduction
250 $ 117.81 66.37$ 56% -44%
500 66.58$ 40.86$ 61% -39%
750 49.52$ 32.39$ 65% -35%
1,000 41.01$ 28.15$ 69% -31%
mean 515 65.08$ 40.12$ 62% -38%
median 286 104.90$ 59.94$ 57% -43%
Eagle Ford: Oil Region
Baseline Results (2014 factor prices)
minimum (breakeven) price for the given EUR:
minimum price
Page 175
Appendix E: Breakeven Price, by EUR, New Wells vs. DUCs, 2014 Cost Scenario
E-5
Eagle Ford Combo
Bakken Core
EUR full cycle DUC ratio reduction
250 $ 241.13 123.02$ 51% -49%
500 123.38$ 64.34$ 52% -48%
750 84.21$ 44.86$ 53% -47%
1,000 64.64$ 35.14$ 54% -46%
mean 898 71.31$ 38.45$ 54% -46%
median 498 123.85$ 64.58$ 52% -48%
Eagle Ford:Combo Region
Baseline Results (2014 factor prices)
minimum (breakeven) price for the given EUR:
minimum price
EUR full cycle DUC ratio reduction
250 $ 165.49 89.80$ 54% -46%
500 90.30$ 52.46$ 58% -42%
750 65.25$ 40.30$ 62% -38%
1,000 52.73$ 33.81$ 64% -36%
mean 725 66.98$ 40.88$ 61% -39%
median 402 108.62$ 61.55$ 57% -43%
Baseline Results (2014 factor prices)
minimum (breakeven) price for the given EUR:
minimum price
Bakken: Core
Page 176
Appendix E: Breakeven Price, by EUR, New Wells vs. DUCs, 2014 Cost Scenario
E-6
Bakken Non-Core
Springer
EUR full cycle DUC ratio reduction
250 $ 144.77 81.51$ 56% -44%
500 81.92$ 50.29$ 61% -39%
750 60.99$ 39.90$ 65% -35%
1,000 50.52$ 34.71$ 69% -31%
mean 558 75.40$ 47.05$ 62% -38%
median 310 120.43$ 69.41$ 58% -42%
Baseline Results (2014 factor prices)
minimum (breakeven) price for the given EUR:
minimum price
Bakken: Non Core
EUR full cycle DUC ratio reduction
250 $ 192.87 101.40$ 53% -47%
500 101.86$ 56.13$ 55% -45%
750 71.56$ 41.07$ 57% -43%
1,000 56.42$ 33.55$ 59% -41%
mean 904 61.24$ 35.95$ 59% -41%
median 501 101.68$ 56.04$ 55% -45%
Baseline Results (2014 factor prices)
minimum (breakeven) price for the given EUR:
minimum price
Springer
Page 177
Appendix E: Breakeven Price, by EUR, New Wells vs. DUCs, 2014 Cost Scenario
E-7
STACK
SCOOP Condensate
EUR full cycle DUC ratio reduction
250 $ 259.67 127.71$ 49% -51%
500 128.02$ 62.04$ 48% -52%
750 84.24$ 40.25$ 48% -52%
1,000 62.37$ 29.38$ 47% -53%
mean 940 66.55$ 31.46$ 47% -53%
median 521 122.72$ 59.40$ 48% -52%
STACK
Baseline Results (2014 factor prices)
minimum (breakeven) price for the given EUR:
minimum price
EUR full cycle DUC ratio reduction
250 $ 670.07 322.26$ 48% -52%
500 323.69$ 149.79$ 46% -54%
750 208.44$ 92.51$ 44% -56%
1,000 150.86$ 63.91$ 42% -58%
mean 1,952 66.65$ 22.11$ 33% -67%
median 1,083 137.62$ 57.34$ 42% -58%
SCOOP Condensate
Baseline Results (2014 factor prices)
minimum (breakeven) price for the given EUR:
minimum price
Page 178
Appendix E: Breakeven Price, by EUR, New Wells vs. DUCs, 2014 Cost Scenario
E-8
Meramec
SCOOP Oil
EUR full cycle DUC ratio reduction
250 $ 373.15 184.84$ 50% -50%
500 185.82$ 91.67$ 49% -51%
750 123.48$ 60.71$ 49% -51%
1,000 92.32$ 45.24$ 49% -51%
mean 1,338 68.71$ 33.52$ 49% -51%
median 742 124.82$ 61.38$ 49% -51%
Baseline Results (2014 factor prices)
Meramec
minimum (breakeven) price for the given EUR:
minimum price
EUR full cycle DUC ratio reduction
250 $ 263.10 133.23$ 51% -49%
500 133.87$ 68.93$ 51% -49%
750 90.86$ 47.57$ 52% -48%
1,000 69.36$ 36.90$ 53% -47%
mean 979 70.75$ 37.58$ 53% -47%
median 543 123.65$ 63.86$ 52% -48%
Baseline Results (2014 factor prices)
SCOOP Oil
minimum (breakeven) price for the given EUR:
minimum price
Page 179
Appendix E: Breakeven Price, by EUR, New Wells vs. DUCs, 2014 Cost Scenario
E-9
Cana Woodford
Mississippian
EUR full cycle DUC ratio reduction
250 $ 722.20 346.16$ 48% -52%
500 347.95$ 159.93$ 46% -54%
750 223.41$ 98.06$ 44% -56%
1,000 161.18$ 67.16$ 42% -58%
mean 1,826 76.74$ 25.25$ 33% -67%
median 1,013 158.78$ 65.98$ 42% -58%
Baseline Results (2014 factor prices)
Cana Woodford
minimum (breakeven) price for the given EUR:
minimum price
EUR full cycle DUC ratio reduction
250 $ 116.90 60.29$ 52% -48%
500 60.58$ 32.27$ 53% -47%
750 41.84$ 22.97$ 55% -45%
1,000 32.48$ 18.32$ 56% -44%
mean 410 72.92$ 38.40$ 53% -47%
median 227 128.35$ 66.00$ 51% -49%
Baseline Results (2014 factor prices)
Mississippian
minimum (breakeven) price for the given EUR:
minimum price
Page 180
Appendix E: Breakeven Price, by EUR, New Wells vs. DUCs, 2014 Cost Scenario
E-10
Marmaton
Tonkawa
EUR full cycle DUC ratio reduction
250 $ 76.44 41.59$ 54% -46%
500 41.60$ 24.19$ 58% -42%
750 30.03$ 18.43$ 61% -39%
1,000 24.26$ 15.56$ 64% -36%
mean 201 93.48$ 50.14$ 54% -46%
median 112 162.95$ 85.12$ 52% -48%
Baseline Results (2014 factor prices)
Marmaton
minimum (breakeven) price for the given EUR:
minimum price
EUR full cycle DUC ratio reduction
250 $ 92.08 48.85$ 53% -47%
500 48.89$ 27.29$ 56% -44%
750 34.55$ 20.15$ 58% -42%
1,000 27.38$ 16.59$ 61% -39%
mean 249 92.42$ 49.02$ 53% -47%
median 138 162.53$ 84.20$ 52% -48%
Baseline Results (2014 factor prices)
Tonkawa
minimum (breakeven) price for the given EUR:
minimum price
Page 181
Appendix E: Breakeven Price, by EUR, New Wells vs. DUCs, 2014 Cost Scenario
E-11
Granite Wash
Cleveland
EUR full cycle DUC ratio reduction
250 $ 327.26 161.16$ 49% -51%
500 161.67$ 78.64$ 49% -51%
750 106.57$ 51.22$ 48% -52%
1,000 79.04$ 37.54$ 47% -53%
mean 736 108.67$ 52.27$ 48% -52%
median 408 198.98$ 97.21$ 49% -51%
Baseline Results (2014 factor prices)
Granite Wash
minimum (breakeven) price for the given EUR:
minimum price
EUR full cycle DUC ratio reduction
250 $ 97.98 48.90$ 50% -50%
500 48.90$ 24.39$ 50% -50%
750 32.60$ 16.28$ 50% -50%
1,000 24.47$ 12.23$ 50% -50%
mean 232 105.61$ 52.73$ 50% -50%
median 129 190.66$ 95.48$ 50% -50%
Baseline Results (2014 factor prices)
Cleveland
minimum (breakeven) price for the given EUR:
minimum price
Page 182
Appendix E: Breakeven Price, by EUR, New Wells vs. DUCs, 2014 Cost Scenario
E-12
Northern Wattenberg XL
Northern Wattenberg
EUR full cycle DUC ratio reduction
250 $ 159.01 86.86$ 55% -45%
500 87.28$ 52.21$ 60% -40%
750 63.40$ 39.35$ 62% -38%
1,000 51.47$ 33.43$ 65% -35%
mean 727 64.91$ 40.10$ 62% -38%
median 403 104.53$ 59.78$ 57% -43%
Baseline Results (2014 factor prices)
Denver Julesburg Basin: Northern Wattenberg XL
minimum (breakeven) price for the given EUR:
minimum price
EUR full cycle DUC ratio reduction
250 $ 93.78 54.33$ 58% -42%
500 54.47$ 34.75$ 64% -36%
750 41.40$ 28.25$ 68% -32%
1,000 34.87$ 25.01$ 72% -28%
mean 357 70.20$ 42.58$ 61% -39%
median 198 114.48$ 64.66$ 56% -44%
Baseline Results (2014 factor prices)
Denver Julesburg Basin: Northern Wattenberg
minimum (breakeven) price for the given EUR:
minimum price
Page 183
Appendix E: Breakeven Price, by EUR, New Wells vs. DUCs, 2014 Cost Scenario
E-13
Southern Wattenberg
Greater Monument Butte
EUR full cycle DUC ratio reduction
250 $ 102.28 58.46$ 57% -43%
500 58.60$ 36.71$ 63% -37%
750 44.08$ 29.49$ 67% -33%
1,000 36.83$ 25.88$ 70% -30%
mean 395 70.19$ 42.48$ 61% -39%
median 219 114.68$ 64.65$ 56% -44%
Baseline Results (2014 factor prices)
Denver Julesburg Basin: Southern Wattenberg
minimum (breakeven) price for the given EUR:
minimum price
EUR full cycle DUC ratio reduction
250 $ 55.34 39.29$ 71% -29%
500 39.41$ 31.38$ 80% -20%
750 34.09$ 28.74$ 84% -16%
1,000 31.44$ 27.42$ 87% -13%
mean 188 65.88$ 44.53$ 68% -32%
median 104 100.45$ 61.85$ 62% -38%
Baseline Results (2014 factor prices)
Uinta Basin: Greater Monument Butte/Uinta
minimum (breakeven) price for the given EUR:
minimum price
Page 184
Appendix E: Breakeven Price, by EUR, New Wells vs. DUCs, 2014 Cost Scenario
E-14
Wasatch SXL
Uteland Butte SXL
EUR full cycle DUC ratio reduction
250 $ 306.52 160.93$ 53% -47%
500 161.72$ 88.92$ 55% -45%
750 113.48$ 64.96$ 57% -43%
1,000 89.37$ 52.98$ 59% -41%
mean 1,000 89.37$ 52.98$ 59% -41%
median 555 147.37$ 81.80$ 56% -44%
Baseline Results (2014 factor prices)
Uinta Basin: Wasatch SXL
minimum (breakeven) price for the given EUR:
minimum price
EUR full cycle DUC ratio reduction
250 $ 239.37 138.77$ 58% -42%
500 139.36$ 89.07$ 64% -36%
750 106.04$ 72.52$ 68% -32%
1,000 89.39$ 64.25$ 72% -28%
mean 700 110.80$ 74.89$ 68% -32%
median 388 168.22$ 103.41$ 61% -39%
Baseline Results (2014 factor prices)
Uteland Butte SXL
minimum (breakeven) price for the given EUR:
minimum price
Page 185
Appendix E: Breakeven Price, by EUR, New Wells vs. DUCs, 2014 Cost Scenario
E-15
SW PA Wet Gas
SW PA Super Rich
EUR full cycle DUC ratio reduction
250 $ 581.60 299.23$ 51% -49%
500 301.10$ 159.92$ 53% -47%
750 207.66$ 113.54$ 55% -45%
1,000 160.94$ 90.35$ 56% -44%
mean 2,933 68.56$ 44.50$ 65% -35%
median 1,627 106.92$ 63.54$ 59% -41%
Baseline Results (2014 factor prices)
Appalachia Basin: SW PA Wet Gas
minimum (breakeven) price for the given EUR:
minimum price
EUR full cycle DUC ratio reduction
250 $ 466.02 240.91$ 52% -48%
500 242.44$ 129.88$ 54% -46%
750 167.94$ 92.91$ 55% -45%
1,000 130.70$ 74.42$ 57% -43%
mean 2,150 70.93$ 44.75$ 63% -37%
median 1,193 112.62$ 65.45$ 58% -42%
Baseline Results (2014 factor prices)
Appalachia Basin: SW PA Super Rich
minimum (breakeven) price for the given EUR:
minimum price
Page 186
Appendix E: Breakeven Price, by EUR, New Wells vs. DUCs, 2014 Cost Scenario
E-16
Utica Wet Gas
Utica Condensate
EUR full cycle DUC ratio reduction
250 $ 1,173.57 591.03$ 50% -50%
500 593.96$ 302.73$ 51% -49%
750 400.95$ 206.80$ 52% -48%
1,000 304.48$ 158.88$ 52% -48%
mean 3,000 111.67$ 63.14$ 57% -43%
median 1,664 189.05$ 101.55$ 54% -46%
Baseline Results (2014 factor prices)
Appalachia Basin: Utica Wet Gas
minimum (breakeven) price for the given EUR:
minimum price
EUR full cycle DUC ratio reduction
250 $ 377.08 195.49$ 52% -48%
500 196.38$ 105.61$ 54% -46%
750 136.21$ 75.70$ 56% -44%
1,000 106.14$ 60.76$ 57% -43%
mean 1,186 92.00$ 53.74$ 58% -42%
median 658 153.04$ 84.06$ 55% -45%
Baseline Results (2014 factor prices)
Appalachia Basin: Utica Condensate
minimum (breakeven) price for the given EUR:
minimum price
Page 187
Appendix E: Breakeven Price, by EUR, New Wells vs. DUCs, 2014 Cost Scenario
E-17
San Juan - Gallup
Tuscaloosa Marine Shale
EUR full cycle DUC ratio reduction
250 $ 98.69 54.48$ 55% -45%
500 54.61$ 32.51$ 60% -40%
750 39.96$ 25.22$ 63% -37%
1,000 32.64$ 21.59$ 66% -34%
mean 451 59.39$ 34.89$ 59% -41%
median 250 98.69$ 54.48$ 55% -45%
Baseline Results (2014 factor prices)
Other Regions: San Juan - Gallup
minimum (breakeven) price for the given EUR:
minimum price
EUR full cycle DUC ratio reduction
250 $ 186.63 105.07$ 56% -44%
500 105.62$ 64.84$ 61% -39%
750 78.63$ 51.44$ 65% -35%
1,000 65.14$ 44.74$ 69% -31%
mean 683 83.93$ 54.07$ 64% -36%
median 379 131.48$ 77.68$ 59% -41%
Baseline Results (2014 factor prices)
Other Regions: Tuscaloosa Marine Shale
minimum (breakeven) price for the given EUR:
minimum price
Page 188
Appendix F: Tail-End Economics, 2016 Cost Scenario.
F-1
Midland Basin Spraberry
100% $20 $30 $40 $50 $60 $70 $80 $90 $100
100 77% 85% 90% 92% 94% 95% 96% 97% 98%
250 93% 96% 98% 99% 100% 100% 100% 100% 100%
500 98% 100% 100% 100% 100% 100% 100% 100% 100%
750 100% 100% 100% 100% 100% 100% 100% 100% 100%
1,000 100% 100% 100% 100% 100% 100% 100% 100% 100%
1,250 100% 100% 100% 100% 100% 100% 100% 100% 100%
1,500 100% 100% 100% 100% 100% 100% 100% 100% 100%
1,750 100% 100% 100% 100% 100% 100% 100% 100% 100%
2,000 100% 100% 100% 100% 100% 100% 100% 100% 100%
0 $20 $30 $40 $50 $60 $70 $80 $90 $100
100 188 153 128 108 91 77 64 53 43
250 100 65 39 19 2 0 0 0 0
500 33 0 0 0 0 0 0 0 0
750 0 0 0 0 0 0 0 0 0
1,000 0 0 0 0 0 0 0 0 0
1,250 0 0 0 0 0 0 0 0 0
1,500 0 0 0 0 0 0 0 0 0
1,750 0 0 0 0 0 0 0 0 0
2,000 0 0 0 0 0 0 0 0 0
Oil Price ($/barrel)
Oil Price ($/barrel)
EUR
(1
00
0 b
arre
ls/w
ell)
EUR
(1
00
0 b
arre
ls/w
ell)
Table Showing Tail End Recovery Factor
Table Showing Months of Lost Production
Midland Basin: Spraberry
Page 189
Appendix F: Tail-End Economics, 2016 Cost Scenario.
F-2
Northern Delaware Bone Spring
76% $20 $30 $40 $50 $60 $70 $80 $90 $100
100 76% 83% 87% 89% 91% 93% 94% 94% 95%
250 91% 94% 96% 97% 97% 98% 98% 99% 99%
500 96% 98% 99% 99% 99% 100% 100% 100% 100%
750 98% 99% 100% 100% 100% 100% 100% 100% 100%
1,000 99% 100% 100% 100% 100% 100% 100% 100% 100%
1,250 99% 100% 100% 100% 100% 100% 100% 100% 100%
1,500 100% 100% 100% 100% 100% 100% 100% 100% 100%
1,750 100% 100% 100% 100% 100% 100% 100% 100% 100%
2,000 100% 100% 100% 100% 100% 100% 100% 100% 100%
216 $20 $30 $40 $50 $60 $70 $80 $90 $100
100 216 192 173 158 146 135 126 117 110
250 146 122 103 88 76 65 56 47 40
500 93 69 50 35 23 12 3 0 0
750 62 38 19 4 0 0 0 0 0
1,000 40 16 0 0 0 0 0 0 0
1,250 23 0 0 0 0 0 0 0 0
1,500 9 0 0 0 0 0 0 0 0
1,750 0 0 0 0 0 0 0 0 0
2,000 0 0 0 0 0 0 0 0 0
Northern Delaware Basin: Bone Springs
Table Showing Tail End Recovery Factor
Oil Price ($/barrel)
EUR
(1
00
0 b
arre
ls/w
ell)
Table Showing Months of Lost Production
Oil Price ($/barrel)
EUR
(1
00
0 b
arre
ls/w
ell)
Page 190
Appendix F: Tail-End Economics, 2016 Cost Scenario.
F-3
Southern Delaware Wolfcamp
100% $20 $30 $40 $50 $60 $70 $80 $90 $100
100 73% 81% 86% 89% 91% 93% 94% 95% 96%
250 92% 95% 97% 98% 99% 100% 100% 100% 100%
500 98% 100% 100% 100% 100% 100% 100% 100% 100%
750 100% 100% 100% 100% 100% 100% 100% 100% 100%
1,000 100% 100% 100% 100% 100% 100% 100% 100% 100%
1,250 100% 100% 100% 100% 100% 100% 100% 100% 100%
1,500 100% 100% 100% 100% 100% 100% 100% 100% 100%
1,750 100% 100% 100% 100% 100% 100% 100% 100% 100%
2,000 100% 100% 100% 100% 100% 100% 100% 100% 100%
0 $20 $30 $40 $50 $60 $70 $80 $90 $100
100 199 169 145 126 110 97 84 74 64
250 106 76 52 33 17 4 0 0 0
500 36 5 0 0 0 0 0 0 0
750 0 0 0 0 0 0 0 0 0
1,000 0 0 0 0 0 0 0 0 0
1,250 0 0 0 0 0 0 0 0 0
1,500 0 0 0 0 0 0 0 0 0
1,750 0 0 0 0 0 0 0 0 0
2,000 0 0 0 0 0 0 0 0 0
Southern Delaware Basin: Wolfcamp
Table Showing Tail End Recovery Factor
Oil Price ($/barrel)
EUR
(1
00
0 b
arre
ls/w
ell)
Table Showing Months of Lost Production
Oil Price ($/barrel)
EUR
(1
00
0 b
arre
ls/w
ell)
Page 191
Appendix F: Tail-End Economics, 2016 Cost Scenario.
F-4
Culberson LL Wolfcamp
100% $20 $30 $40 $50 $60 $70 $80 $90 $100
100 68% 80% 89% 96% 100% 100% 100% 100% 100%
250 100% 100% 100% 100% 100% 100% 100% 100% 100%
500 100% 100% 100% 100% 100% 100% 100% 100% 100%
750 100% 100% 100% 100% 100% 100% 100% 100% 100%
1,000 100% 100% 100% 100% 100% 100% 100% 100% 100%
1,250 100% 100% 100% 100% 100% 100% 100% 100% 100%
1,500 100% 100% 100% 100% 100% 100% 100% 100% 100%
1,750 100% 100% 100% 100% 100% 100% 100% 100% 100%
2,000 100% 100% 100% 100% 100% 100% 100% 100% 100%
0 $20 $30 $40 $50 $60 $70 $80 $90 $100
100 146 100 60 25 0 0 0 0 0
250 0 0 0 0 0 0 0 0 0
500 0 0 0 0 0 0 0 0 0
750 0 0 0 0 0 0 0 0 0
1,000 0 0 0 0 0 0 0 0 0
1,250 0 0 0 0 0 0 0 0 0
1,500 0 0 0 0 0 0 0 0 0
1,750 0 0 0 0 0 0 0 0 0
2,000 0 0 0 0 0 0 0 0 0
Culberson LL: Wolfcamp
Table Showing Tail End Recovery Factor
Oil Price ($/barrel)
EUR
(1
00
0 b
arre
ls/w
ell)
Table Showing Months of Lost Production
Oil Price ($/barrel)
EUR
(1
00
0 b
arre
ls/w
ell)
Page 192
Appendix F: Tail-End Economics, 2016 Cost Scenario.
F-5
Midland Basin Wolfcamp
100% $20 $30 $40 $50 $60 $70 $80 $90 $100
100 76% 84% 88% 91% 93% 95% 96% 97% 97%
250 93% 96% 98% 99% 100% 100% 100% 100% 100%
500 99% 100% 100% 100% 100% 100% 100% 100% 100%
750 100% 100% 100% 100% 100% 100% 100% 100% 100%
1,000 100% 100% 100% 100% 100% 100% 100% 100% 100%
1,250 100% 100% 100% 100% 100% 100% 100% 100% 100%
1,500 100% 100% 100% 100% 100% 100% 100% 100% 100%
1,750 100% 100% 100% 100% 100% 100% 100% 100% 100%
2,000 100% 100% 100% 100% 100% 100% 100% 100% 100%
0 $20 $30 $40 $50 $60 $70 $80 $90 $100
100 189 156 131 110 94 79 66 55 45
250 95 62 37 17 0 0 0 0 0
500 25 0 0 0 0 0 0 0 0
750 0 0 0 0 0 0 0 0 0
1,000 0 0 0 0 0 0 0 0 0
1,250 0 0 0 0 0 0 0 0 0
1,500 0 0 0 0 0 0 0 0 0
1,750 0 0 0 0 0 0 0 0 0
2,000 0 0 0 0 0 0 0 0 0
Midland Basin: Wolfcamp
Table Showing Months of Lost Production
Oil Price ($/barrel)
EUR
(1
00
0 b
arre
ls/w
ell)
Table Showing Tail End Recovery Factor
Oil Price ($/barrel)
EUR
(1
00
0 b
arre
ls/w
ell)
Page 193
Appendix F: Tail-End Economics, 2016 Cost Scenario.
F-6
Southern Midland Basin Wolfcamp
100% $20 $30 $40 $50 $60 $70 $80 $90 $100
100 74% 82% 86% 90% 92% 94% 95% 96% 97%
250 93% 96% 98% 99% 100% 100% 100% 100% 100%
500 99% 100% 100% 100% 100% 100% 100% 100% 100%
750 100% 100% 100% 100% 100% 100% 100% 100% 100%
1,000 100% 100% 100% 100% 100% 100% 100% 100% 100%
1,250 100% 100% 100% 100% 100% 100% 100% 100% 100%
1,500 100% 100% 100% 100% 100% 100% 100% 100% 100%
1,750 100% 100% 100% 100% 100% 100% 100% 100% 100%
2,000 100% 100% 100% 100% 100% 100% 100% 100% 100%
0 $20 $30 $40 $50 $60 $70 $80 $90 $100
100 191 160 136 116 100 85 73 62 51
250 92 62 38 18 2 0 0 0 0
500 18 0 0 0 0 0 0 0 0
750 0 0 0 0 0 0 0 0 0
1,000 0 0 0 0 0 0 0 0 0
1,250 0 0 0 0 0 0 0 0 0
1,500 0 0 0 0 0 0 0 0 0
1,750 0 0 0 0 0 0 0 0 0
2,000 0 0 0 0 0 0 0 0 0
EUR
(1
00
0 b
arre
ls/w
ell)
Southern Midland Basin: Wolfcamp
Table Showing Months of Lost Production
Oil Price ($/barrel)
EUR
(1
00
0 b
arre
ls/w
ell)
Table Showing Tail End Recovery Factor
Oil Price ($/barrel)
Page 194
Appendix F: Tail-End Economics, 2016 Cost Scenario.
F-7
Eagle Ford Condensate
100% $20 $30 $40 $50 $60 $70 $80 $90 $100
100 70% 79% 84% 88% 90% 92% 93% 94% 95%
250 90% 94% 96% 97% 98% 99% 99% 100% 100%
500 97% 98% 99% 100% 100% 100% 100% 100% 100%
750 99% 100% 100% 100% 100% 100% 100% 100% 100%
1,000 100% 100% 100% 100% 100% 100% 100% 100% 100%
1,250 100% 100% 100% 100% 100% 100% 100% 100% 100%
1,500 100% 100% 100% 100% 100% 100% 100% 100% 100%
1,750 100% 100% 100% 100% 100% 100% 100% 100% 100%
2,000 100% 100% 100% 100% 100% 100% 100% 100% 100%
10 $20 $30 $40 $50 $60 $70 $80 $90 $100
100 216 186 163 145 130 117 106 96 87
250 131 102 79 61 46 33 21 11 2
500 68 38 15 0 0 0 0 0 0
750 30 0 0 0 0 0 0 0 0
1,000 4 0 0 0 0 0 0 0 0
1,250 0 0 0 0 0 0 0 0 0
1,500 0 0 0 0 0 0 0 0 0
1,750 0 0 0 0 0 0 0 0 0
2,000 0 0 0 0 0 0 0 0 0
EUR
(1
00
0 b
arre
ls/w
ell)
Eagle Ford: Condensate Region
Table Showing Months of Lost Production
Oil Price ($/barrel)
EUR
(1
00
0 b
arre
ls/w
ell)
Table Showing Tail End Recovery Factor
Oil Price ($/barrel)
Page 195
Appendix F: Tail-End Economics, 2016 Cost Scenario.
F-8
Eagle Ford Oil
100% $20 $30 $40 $50 $60 $70 $80 $90 $100
100 73% 82% 86% 89% 91% 93% 94% 95% 95%
250 90% 94% 96% 97% 98% 98% 99% 99% 99%
500 96% 98% 99% 99% 100% 100% 100% 100% 100%
750 98% 99% 100% 100% 100% 100% 100% 100% 100%
1,000 99% 100% 100% 100% 100% 100% 100% 100% 100%
1,250 100% 100% 100% 100% 100% 100% 100% 100% 100%
1,500 100% 100% 100% 100% 100% 100% 100% 100% 100%
1,750 100% 100% 100% 100% 100% 100% 100% 100% 100%
2,000 100% 100% 100% 100% 100% 100% 100% 100% 100%
0 $20 $30 $40 $50 $60 $70 $80 $90 $100
100 219 191 170 154 141 129 119 110 102
250 146 118 97 81 68 56 46 37 29
500 90 63 42 26 13 1 0 0 0
750 58 31 10 0 0 0 0 0 0
1,000 35 8 0 0 0 0 0 0 0
1,250 18 0 0 0 0 0 0 0 0
1,500 3 0 0 0 0 0 0 0 0
1,750 0 0 0 0 0 0 0 0 0
2,000 0 0 0 0 0 0 0 0 0
EUR
(1
00
0 b
arre
ls/w
ell)
Eagle Ford: Oil Region
Table Showing Months of Lost Production
Oil Price ($/barrel)
EUR
(1
00
0 b
arre
ls/w
ell)
Table Showing Tail End Recovery Factor
Oil Price ($/barrel)
Page 196
Appendix F: Tail-End Economics, 2016 Cost Scenario.
F-9
Eagle Ford Combo
100% $20 $30 $40 $50 $60 $70 $80 $90 $100
100 72% 77% 80% 83% 85% 87% 88% 89% 90%
250 90% 92% 93% 94% 95% 95% 96% 96% 97%
500 95% 96% 97% 98% 98% 98% 99% 99% 99%
750 97% 98% 99% 99% 99% 99% 100% 100% 100%
1,000 98% 99% 99% 100% 100% 100% 100% 100% 100%
1,250 99% 99% 100% 100% 100% 100% 100% 100% 100%
1,500 99% 100% 100% 100% 100% 100% 100% 100% 100%
1,750 100% 100% 100% 100% 100% 100% 100% 100% 100%
2,000 100% 100% 100% 100% 100% 100% 100% 100% 100%
1 $20 $30 $40 $50 $60 $70 $80 $90 $100
100 228 214 203 193 184 176 169 162 156
250 159 146 134 124 116 108 101 94 88
500 108 94 83 73 64 56 49 42 36
750 77 64 52 42 34 26 19 12 6
1,000 56 42 31 21 12 4 0 0 0
1,250 39 26 14 4 0 0 0 0 0
1,500 26 12 1 0 0 0 0 0 0
1,750 14 1 0 0 0 0 0 0 0
2,000 4 0 0 0 0 0 0 0 0
EUR
(1
00
0 b
arre
ls/w
ell)
Eagle Ford: Combo Region
Table Showing Months of Lost Production
Oil Price ($/barrel)
EUR
(1
00
0 b
arre
ls/w
ell)
Table Showing Tail End Recovery Factor
Oil Price ($/barrel)
Page 197
Appendix F: Tail-End Economics, 2016 Cost Scenario.
F-10
Bakken Core
73% $20 $30 $40 $50 $60 $70 $80 $90 $100
100 73% 84% 90% 94% 96% 98% 100% 100% 100%
250 95% 100% 100% 100% 100% 100% 100% 100% 100%
500 100% 100% 100% 100% 100% 100% 100% 100% 100%
750 100% 100% 100% 100% 100% 100% 100% 100% 100%
1,000 100% 100% 100% 100% 100% 100% 100% 100% 100%
1,250 100% 100% 100% 100% 100% 100% 100% 100% 100%
1,500 100% 100% 100% 100% 100% 100% 100% 100% 100%
1,750 100% 100% 100% 100% 100% 100% 100% 100% 100%
2,000 100% 100% 100% 100% 100% 100% 100% 100% 100%
174 $20 $30 $40 $50 $60 $70 $80 $90 $100
100 174 126 91 63 40 20 3 0 0
250 50 2 0 0 0 0 0 0 0
500 0 0 0 0 0 0 0 0 0
750 0 0 0 0 0 0 0 0 0
1,000 0 0 0 0 0 0 0 0 0
1,250 0 0 0 0 0 0 0 0 0
1,500 0 0 0 0 0 0 0 0 0
1,750 0 0 0 0 0 0 0 0 0
2,000 0 0 0 0 0 0 0 0 0
Table Showing Tail End Recovery Factor
Oil Price ($/barrel)
EUR
(1
00
0 b
arre
ls/w
ell)
Bakken: Core
Table Showing Months of Lost Production
Oil Price ($/barrel)
EUR
(1
00
0 b
arre
ls/w
ell)
Page 198
Appendix F: Tail-End Economics, 2016 Cost Scenario.
F-11
Bakken Non-Core
100% $20 $30 $40 $50 $60 $70 $80 $90 $100
100 75% 85% 90% 93% 96% 97% 99% 100% 100%
250 94% 98% 100% 100% 100% 100% 100% 100% 100%
500 100% 100% 100% 100% 100% 100% 100% 100% 100%
750 100% 100% 100% 100% 100% 100% 100% 100% 100%
1,000 100% 100% 100% 100% 100% 100% 100% 100% 100%
1,250 100% 100% 100% 100% 100% 100% 100% 100% 100%
1,500 100% 100% 100% 100% 100% 100% 100% 100% 100%
1,750 100% 100% 100% 100% 100% 100% 100% 100% 100%
2,000 100% 100% 100% 100% 100% 100% 100% 100% 100%
0 $20 $30 $40 $50 $60 $70 $80 $90 $100
100 177 133 100 75 54 36 20 6 0
250 67 22 0 0 0 0 0 0 0
500 0 0 0 0 0 0 0 0 0
750 0 0 0 0 0 0 0 0 0
1,000 0 0 0 0 0 0 0 0 0
1,250 0 0 0 0 0 0 0 0 0
1,500 0 0 0 0 0 0 0 0 0
1,750 0 0 0 0 0 0 0 0 0
2,000 0 0 0 0 0 0 0 0 0
Table Showing Tail End Recovery Factor
Oil Price ($/barrel)
EUR
(1
00
0 b
arre
ls/w
ell)
Bakken: Non Core
Table Showing Months of Lost Production
Oil Price ($/barrel)
EUR
(1
00
0 b
arre
ls/w
ell)
Page 199
Appendix F: Tail-End Economics, 2016 Cost Scenario.
F-12
Springer
100% $20 $30 $40 $50 $60 $70 $80 $90 $100
100 77% 85% 89% 92% 93% 95% 96% 96% 97%
250 93% 96% 98% 99% 99% 100% 100% 100% 100%
500 98% 100% 100% 100% 100% 100% 100% 100% 100%
750 100% 100% 100% 100% 100% 100% 100% 100% 100%
1,000 100% 100% 100% 100% 100% 100% 100% 100% 100%
1,250 100% 100% 100% 100% 100% 100% 100% 100% 100%
1,500 100% 100% 100% 100% 100% 100% 100% 100% 100%
1,750 100% 100% 100% 100% 100% 100% 100% 100% 100%
2,000 100% 100% 100% 100% 100% 100% 100% 100% 100%
0 $20 $30 $40 $50 $60 $70 $80 $90 $100
100 193 161 138 119 104 90 79 69 59
250 108 77 53 35 19 6 0 0 0
500 44 13 0 0 0 0 0 0 0
750 7 0 0 0 0 0 0 0 0
1,000 0 0 0 0 0 0 0 0 0
1,250 0 0 0 0 0 0 0 0 0
1,500 0 0 0 0 0 0 0 0 0
1,750 0 0 0 0 0 0 0 0 0
2,000 0 0 0 0 0 0 0 0 0
Table Showing Tail End Recovery Factor
Oil Price ($/barrel)
EUR
(1
00
0 b
arre
ls/w
ell)
Springer
Table Showing Months of Lost Production
Oil Price ($/barrel)
EUR
(1
00
0 b
arre
ls/w
ell)
Page 200
Appendix F: Tail-End Economics, 2016 Cost Scenario.
F-13
STACK
72% $20 $30 $40 $50 $60 $70 $80 $90 $100
100 72% 80% 85% 88% 90% 92% 94% 95% 96%
250 92% 95% 97% 99% 100% 100% 100% 100% 100%
500 99% 100% 100% 100% 100% 100% 100% 100% 100%
750 100% 100% 100% 100% 100% 100% 100% 100% 100%
1,000 100% 100% 100% 100% 100% 100% 100% 100% 100%
1,250 100% 100% 100% 100% 100% 100% 100% 100% 100%
1,500 100% 100% 100% 100% 100% 100% 100% 100% 100%
1,750 100% 100% 100% 100% 100% 100% 100% 100% 100%
2,000 100% 100% 100% 100% 100% 100% 100% 100% 100%
195 $20 $30 $40 $50 $60 $70 $80 $90 $100
100 195 167 144 125 109 95 82 71 61
250 96 67 44 25 9 0 0 0 0
500 20 0 0 0 0 0 0 0 0
750 0 0 0 0 0 0 0 0 0
1,000 0 0 0 0 0 0 0 0 0
1,250 0 0 0 0 0 0 0 0 0
1,500 0 0 0 0 0 0 0 0 0
1,750 0 0 0 0 0 0 0 0 0
2,000 0 0 0 0 0 0 0 0 0
EUR
(1
00
0 b
arre
ls/w
ell)
STACK
Table Showing Months of Lost Production
Oil Price ($/barrel)
EUR
(1
00
0 b
arre
ls/w
ell)
Table Showing Tail End Recovery Factor
Oil Price ($/barrel)
Page 201
Appendix F: Tail-End Economics, 2016 Cost Scenario.
F-14
SCOOP Condensate
100% $20 $30 $40 $50 $60 $70 $80 $90 $100
100 70% 75% 79% 82% 84% 86% 88% 89% 91%
250 93% 95% 96% 97% 98% 99% 100% 100% 100%
500 100% 100% 100% 100% 100% 100% 100% 100% 100%
750 100% 100% 100% 100% 100% 100% 100% 100% 100%
1,000 100% 100% 100% 100% 100% 100% 100% 100% 100%
1,250 100% 100% 100% 100% 100% 100% 100% 100% 100%
1,500 100% 100% 100% 100% 100% 100% 100% 100% 100%
1,750 100% 100% 100% 100% 100% 100% 100% 100% 100%
2,000 100% 100% 100% 100% 100% 100% 100% 100% 100%
0 $20 $30 $40 $50 $60 $70 $80 $90 $100
100 192 175 161 148 136 125 115 106 97
250 81 64 50 36 25 14 4 0 0
500 0 0 0 0 0 0 0 0 0
750 0 0 0 0 0 0 0 0 0
1,000 0 0 0 0 0 0 0 0 0
1,250 0 0 0 0 0 0 0 0 0
1,500 0 0 0 0 0 0 0 0 0
1,750 0 0 0 0 0 0 0 0 0
2,000 0 0 0 0 0 0 0 0 0
EUR
(1
00
0 b
arre
ls/w
ell)
SCOOP Condensate
Table Showing Months of Lost Production
Oil Price ($/barrel)
EUR
(1
00
0 b
arre
ls/w
ell)
Table Showing Tail End Recovery Factor
Oil Price ($/barrel)
Page 202
Appendix F: Tail-End Economics, 2016 Cost Scenario.
F-15
Meramec
100% $20 $30 $40 $50 $60 $70 $80 $90 $100
100 71% 77% 81% 84% 87% 89% 91% 92% 94%
250 93% 96% 97% 99% 100% 100% 100% 100% 100%
500 100% 100% 100% 100% 100% 100% 100% 100% 100%
750 100% 100% 100% 100% 100% 100% 100% 100% 100%
1,000 100% 100% 100% 100% 100% 100% 100% 100% 100%
1,250 100% 100% 100% 100% 100% 100% 100% 100% 100%
1,500 100% 100% 100% 100% 100% 100% 100% 100% 100%
1,750 100% 100% 100% 100% 100% 100% 100% 100% 100%
2,000 100% 100% 100% 100% 100% 100% 100% 100% 100%
- $20 $30 $40 $50 $60 $70 $80 $90 $100
100 188 166 147 131 116 103 92 81 71
250 74 51 33 16 2 0 0 0 0
500 0 0 0 0 0 0 0 0 0
750 0 0 0 0 0 0 0 0 0
1,000 0 0 0 0 0 0 0 0 0
1,250 0 0 0 0 0 0 0 0 0
1,500 0 0 0 0 0 0 0 0 0
1,750 0 0 0 0 0 0 0 0 0
2,000 0 0 0 0 0 0 0 0 0
EUR
(1
00
0 b
arre
ls/w
ell)
Table Showing Tail End Recovery Factor
Oil Price ($/barrel)
Meramec
Table Showing Months of Lost Production
Oil Price ($/barrel)
EUR
(1
00
0 b
arre
ls/w
ell)
Page 203
Appendix F: Tail-End Economics, 2016 Cost Scenario.
F-16
SCOOP Oil
100% $20 $30 $40 $50 $60 $70 $80 $90 $100
100 73% 82% 87% 90% 93% 95% 96% 97% 98%
250 93% 97% 99% 100% 100% 100% 100% 100% 100%
500 100% 100% 100% 100% 100% 100% 100% 100% 100%
750 100% 100% 100% 100% 100% 100% 100% 100% 100%
1,000 100% 100% 100% 100% 100% 100% 100% 100% 100%
1,250 100% 100% 100% 100% 100% 100% 100% 100% 100%
1,500 100% 100% 100% 100% 100% 100% 100% 100% 100%
1,750 100% 100% 100% 100% 100% 100% 100% 100% 100%
2,000 100% 100% 100% 100% 100% 100% 100% 100% 100%
- $20 $30 $40 $50 $60 $70 $80 $90 $100
100 185 149 122 99 81 64 50 37 26
250 76 40 12 0 0 0 0 0 0
500 0 0 0 0 0 0 0 0 0
750 0 0 0 0 0 0 0 0 0
1,000 0 0 0 0 0 0 0 0 0
1,250 0 0 0 0 0 0 0 0 0
1,500 0 0 0 0 0 0 0 0 0
1,750 0 0 0 0 0 0 0 0 0
2,000 0 0 0 0 0 0 0 0 0
EUR
(1
00
0 b
arre
ls/w
ell)
Table Showing Tail End Recovery Factor
Oil Price ($/barrel)
SCOOP Oil
Table Showing Months of Lost Production
Oil Price ($/barrel)
EUR
(1
00
0 b
arre
ls/w
ell)
Page 204
Appendix F: Tail-End Economics, 2016 Cost Scenario.
F-17
Cana Woodford
100% $20 $30 $40 $50 $60 $70 $80 $90 $100
100 74% 77% 79% 81% 83% 84% 85% 87% 88%
250 93% 94% 95% 96% 96% 97% 98% 98% 98%
500 99% 100% 100% 100% 100% 100% 100% 100% 100%
750 100% 100% 100% 100% 100% 100% 100% 100% 100%
1,000 100% 100% 100% 100% 100% 100% 100% 100% 100%
1,250 100% 100% 100% 100% 100% 100% 100% 100% 100%
1,500 100% 100% 100% 100% 100% 100% 100% 100% 100%
1,750 100% 100% 100% 100% 100% 100% 100% 100% 100%
2,000 100% 100% 100% 100% 100% 100% 100% 100% 100%
- $20 $30 $40 $50 $60 $70 $80 $90 $100
100 187 177 169 161 153 146 139 133 127
250 87 77 68 60 53 46 39 33 27
500 11 1 0 0 0 0 0 0 0
750 0 0 0 0 0 0 0 0 0
1,000 0 0 0 0 0 0 0 0 0
1,250 0 0 0 0 0 0 0 0 0
1,500 0 0 0 0 0 0 0 0 0
1,750 0 0 0 0 0 0 0 0 0
2,000 0 0 0 0 0 0 0 0 0
EUR
(1
00
0 b
arre
ls/w
ell)
Table Showing Tail End Recovery Factor
Oil Price ($/barrel)
Cana Woodford
Table Showing Months of Lost Production
Oil Price ($/barrel)
EUR
(1
00
0 b
arre
ls/w
ell)
Page 205
Appendix F: Tail-End Economics, 2016 Cost Scenario.
F-18
Mississippian
100% $20 $30 $40 $50 $60 $70 $80 $90 $100
100 74% 82% 86% 90% 93% 95% 96% 98% 99%
250 97% 100% 100% 100% 100% 100% 100% 100% 100%
500 100% 100% 100% 100% 100% 100% 100% 100% 100%
750 100% 100% 100% 100% 100% 100% 100% 100% 100%
1,000 100% 100% 100% 100% 100% 100% 100% 100% 100%
1,250 100% 100% 100% 100% 100% 100% 100% 100% 100%
1,500 100% 100% 100% 100% 100% 100% 100% 100% 100%
1,750 100% 100% 100% 100% 100% 100% 100% 100% 100%
2,000 100% 100% 100% 100% 100% 100% 100% 100% 100%
- $20 $30 $40 $50 $60 $70 $80 $90 $100
100 162 132 108 86 68 52 37 23 11
250 28 0 0 0 0 0 0 0 0
500 0 0 0 0 0 0 0 0 0
750 0 0 0 0 0 0 0 0 0
1,000 0 0 0 0 0 0 0 0 0
1,250 0 0 0 0 0 0 0 0 0
1,500 0 0 0 0 0 0 0 0 0
1,750 0 0 0 0 0 0 0 0 0
2,000 0 0 0 0 0 0 0 0 0
EUR
(1
00
0 b
arre
ls/w
ell)
Table Showing Tail End Recovery Factor
Oil Price ($/barrel)
Mississippian
Table Showing Months of Lost Production
Oil Price ($/barrel)
EUR
(1
00
0 b
arre
ls/w
ell)
Page 206
Appendix F: Tail-End Economics, 2016 Cost Scenario.
F-19
Marmaton
94% $20 $30 $40 $50 $60 $70 $80 $90 $100
100 74% 82% 86% 89% 91% 92% 93% 94% 95%
250 91% 94% 95% 97% 97% 98% 98% 99% 99%
500 97% 98% 99% 99% 100% 100% 100% 100% 100%
750 98% 99% 100% 100% 100% 100% 100% 100% 100%
1,000 99% 100% 100% 100% 100% 100% 100% 100% 100%
1,250 100% 100% 100% 100% 100% 100% 100% 100% 100%
1,500 100% 100% 100% 100% 100% 100% 100% 100% 100%
1,750 100% 100% 100% 100% 100% 100% 100% 100% 100%
2,000 100% 100% 100% 100% 100% 100% 100% 100% 100%
110 $20 $30 $40 $50 $60 $70 $80 $90 $100
100 214 189 170 155 142 131 121 113 105
250 139 114 96 80 68 57 47 38 30
500 82 58 39 24 11 0 0 0 0
750 49 25 6 0 0 0 0 0 0
1,000 26 1 0 0 0 0 0 0 0
1,250 8 0 0 0 0 0 0 0 0
1,500 0 0 0 0 0 0 0 0 0
1,750 0 0 0 0 0 0 0 0 0
2,000 0 0 0 0 0 0 0 0 0
EUR
(1
00
0 b
arre
ls/w
ell)
Table Showing Tail End Recovery Factor
Oil Price ($/barrel)
Marmaton
Table Showing Months of Lost Production
Oil Price ($/barrel)
EUR
(1
00
0 b
arre
ls/w
ell)
Page 207
Appendix F: Tail-End Economics, 2016 Cost Scenario.
F-20
Tonkawa
96% $20 $30 $40 $50 $60 $70 $80 $90 $100
100 76% 82% 87% 89% 91% 93% 94% 95% 95%
250 92% 95% 96% 97% 98% 99% 99% 100% 100%
500 97% 99% 100% 100% 100% 100% 100% 100% 100%
750 99% 100% 100% 100% 100% 100% 100% 100% 100%
1,000 100% 100% 100% 100% 100% 100% 100% 100% 100%
1,250 100% 100% 100% 100% 100% 100% 100% 100% 100%
1,500 100% 100% 100% 100% 100% 100% 100% 100% 100%
1,750 100% 100% 100% 100% 100% 100% 100% 100% 100%
2,000 100% 100% 100% 100% 100% 100% 100% 100% 100%
72 $20 $30 $40 $50 $60 $70 $80 $90 $100
100 201 176 155 139 125 113 103 93 85
250 120 94 74 57 44 32 21 12 3
500 58 32 12 0 0 0 0 0 0
750 22 0 0 0 0 0 0 0 0
1,000 0 0 0 0 0 0 0 0 0
1,250 0 0 0 0 0 0 0 0 0
1,500 0 0 0 0 0 0 0 0 0
1,750 0 0 0 0 0 0 0 0 0
2,000 0 0 0 0 0 0 0 0 0
EUR
(1
00
0 b
arre
ls/w
ell)
Table Showing Tail End Recovery Factor
Oil Price ($/barrel)
Tonkawa
Table Showing Months of Lost Production
Oil Price ($/barrel)
EUR
(1
00
0 b
arre
ls/w
ell)
Page 208
Appendix F: Tail-End Economics, 2016 Cost Scenario.
F-21
Granite Wash
98% $20 $30 $40 $50 $60 $70 $80 $90 $100
100 74% 76% 79% 82% 84% 85% 87% 88% 89%
250 89% 91% 92% 93% 94% 95% 95% 95% 96%
500 95% 96% 96% 97% 97% 98% 98% 98% 98%
750 97% 97% 98% 98% 98% 99% 99% 99% 99%
1,000 98% 98% 99% 99% 99% 99% 99% 99% 99%
1,250 98% 99% 99% 99% 99% 99% 100% 100% 100%
1,500 99% 99% 99% 99% 100% 100% 100% 100% 100%
1,750 99% 99% 99% 100% 100% 100% 100% 100% 100%
2,000 99% 99% 100% 100% 100% 100% 100% 100% 100%
99 $20 $30 $40 $50 $60 $70 $80 $90 $100
100 236 231 222 214 207 201 195 190 185
250 183 173 164 157 150 143 138 133 128
500 140 130 121 113 106 100 94 89 84
750 114 104 95 87 81 74 69 63 59
1,000 96 86 77 69 62 56 51 45 41
1,250 82 72 63 55 48 42 37 31 27
1,500 71 60 52 44 37 31 25 20 15
1,750 61 51 42 34 27 21 15 10 5
2,000 53 42 34 26 19 13 7 2 0
EUR
(1
00
0 b
arre
ls/w
ell)
Table Showing Tail End Recovery Factor
Oil Price ($/barrel)
Granite Wash
Table Showing Months of Lost Production
Oil Price ($/barrel)
EUR
(1
00
0 b
arre
ls/w
ell)
Page 209
Appendix F: Tail-End Economics, 2016 Cost Scenario.
F-22
Cleveland
93% $20 $30 $40 $50 $60 $70 $80 $90 $100
100 74% 79% 82% 85% 87% 88% 89% 90% 91%
250 90% 92% 93% 94% 95% 96% 96% 97% 97%
500 95% 96% 97% 98% 98% 98% 99% 99% 99%
750 97% 98% 98% 99% 99% 99% 99% 99% 100%
1,000 98% 99% 99% 99% 99% 100% 100% 100% 100%
1,250 99% 99% 99% 100% 100% 100% 100% 100% 100%
1,500 99% 99% 100% 100% 100% 100% 100% 100% 100%
1,750 99% 100% 100% 100% 100% 100% 100% 100% 100%
2,000 99% 100% 100% 100% 100% 100% 100% 100% 100%
151 $20 $30 $40 $50 $60 $70 $80 $90 $100
100 232 219 208 198 190 183 176 170 165
250 172 158 147 138 130 122 116 110 104
500 126 113 102 92 84 77 70 64 59
750 99 86 75 66 57 50 43 37 32
1,000 80 67 56 47 38 31 24 18 13
1,250 65 52 41 32 24 16 10 4 0
1,500 53 40 29 20 12 4 0 0 0
1,750 43 30 19 10 1 0 0 0 0
2,000 34 21 10 1 0 0 0 0 0
EUR
(1
00
0 b
arre
ls/w
ell)
Table Showing Tail End Recovery Factor
Oil Price ($/barrel)
Cleveland
Table Showing Months of Lost Production
Oil Price ($/barrel)
EUR
(1
00
0 b
arre
ls/w
ell)
Page 210
Appendix F: Tail-End Economics, 2016 Cost Scenario.
F-23
Northern Wattenberg XL
100% $20 $30 $40 $50 $60 $70 $80 $90 $100
100 75% 83% 88% 91% 93% 95% 96% 97% 98%
250 93% 97% 99% 100% 100% 100% 100% 100% 100%
500 100% 100% 100% 100% 100% 100% 100% 100% 100%
750 100% 100% 100% 100% 100% 100% 100% 100% 100%
1,000 100% 100% 100% 100% 100% 100% 100% 100% 100%
1,250 100% 100% 100% 100% 100% 100% 100% 100% 100%
1,500 100% 100% 100% 100% 100% 100% 100% 100% 100%
1,750 100% 100% 100% 100% 100% 100% 100% 100% 100%
2,000 100% 100% 100% 100% 100% 100% 100% 100% 100%
- $20 $30 $40 $50 $60 $70 $80 $90 $100
100 185 149 122 101 83 67 54 41 31
250 83 48 21 0 0 0 0 0 0
500 6 0 0 0 0 0 0 0 0
750 0 0 0 0 0 0 0 0 0
1,000 0 0 0 0 0 0 0 0 0
1,250 0 0 0 0 0 0 0 0 0
1,500 0 0 0 0 0 0 0 0 0
1,750 0 0 0 0 0 0 0 0 0
2,000 0 0 0 0 0 0 0 0 0
EUR
(1
00
0 b
arre
ls/w
ell)
Table Showing Tail End Recovery Factor
Oil Price ($/barrel)
Denver Julesburg Basin: Northern Wattenberg XL
Table Showing Months of Lost Production
Oil Price ($/barrel)
EUR
(1
00
0 b
arre
ls/w
ell)
Page 211
Appendix F: Tail-End Economics, 2016 Cost Scenario.
F-24
Northern Wattenberg
97% $20 $30 $40 $50 $60 $70 $80 $90 $100
100 74% 82% 87% 90% 92% 93% 94% 95% 96%
250 92% 95% 97% 98% 99% 99% 100% 100% 100%
500 98% 99% 100% 100% 100% 100% 100% 100% 100%
750 99% 100% 100% 100% 100% 100% 100% 100% 100%
1,000 100% 100% 100% 100% 100% 100% 100% 100% 100%
1,250 100% 100% 100% 100% 100% 100% 100% 100% 100%
1,500 100% 100% 100% 100% 100% 100% 100% 100% 100%
1,750 100% 100% 100% 100% 100% 100% 100% 100% 100%
2,000 100% 100% 100% 100% 100% 100% 100% 100% 100%
57 $20 $30 $40 $50 $60 $70 $80 $90 $100
100 202 172 149 131 115 102 91 80 71
250 117 86 64 45 30 17 5 0 0
500 52 22 0 0 0 0 0 0 0
750 14 0 0 0 0 0 0 0 0
1,000 0 0 0 0 0 0 0 0 0
1,250 0 0 0 0 0 0 0 0 0
1,500 0 0 0 0 0 0 0 0 0
1,750 0 0 0 0 0 0 0 0 0
2,000 0 0 0 0 0 0 0 0 0
EUR
(1
00
0 b
arre
ls/w
ell)
Table Showing Tail End Recovery Factor
Oil Price ($/barrel)
Denver Julesburg Basin: Northern Wattenberg
Table Showing Months of Lost Production
Oil Price ($/barrel)
EUR
(1
00
0 b
arre
ls/w
ell)
Page 212
Appendix F: Tail-End Economics, 2016 Cost Scenario.
F-25
Southern Wattenberg
96% $20 $30 $40 $50 $60 $70 $80 $90 $100
100 74% 81% 85% 88% 90% 91% 92% 93% 94%
250 91% 94% 95% 97% 97% 98% 98% 99% 99%
500 97% 98% 99% 100% 100% 100% 100% 100% 100%
750 99% 100% 100% 100% 100% 100% 100% 100% 100%
1,000 100% 100% 100% 100% 100% 100% 100% 100% 100%
1,250 100% 100% 100% 100% 100% 100% 100% 100% 100%
1,500 100% 100% 100% 100% 100% 100% 100% 100% 100%
1,750 100% 100% 100% 100% 100% 100% 100% 100% 100%
2,000 100% 100% 100% 100% 100% 100% 100% 100% 100%
82 $20 $30 $40 $50 $60 $70 $80 $90 $100
100 210 187 169 154 141 130 120 112 104
250 131 108 90 75 62 51 42 33 25
500 71 48 30 15 3 0 0 0 0
750 36 13 0 0 0 0 0 0 0
1,000 12 0 0 0 0 0 0 0 0
1,250 0 0 0 0 0 0 0 0 0
1,500 0 0 0 0 0 0 0 0 0
1,750 0 0 0 0 0 0 0 0 0
2,000 0 0 0 0 0 0 0 0 0
EUR
(1
00
0 b
arre
ls/w
ell)
Table Showing Tail End Recovery Factor
Oil Price ($/barrel)
Denver Julesburg Basin: Southern Wattenberg
Table Showing Months of Lost Production
Oil Price ($/barrel)
EUR
(1
00
0 b
arre
ls/w
ell)
Page 213
Appendix F: Tail-End Economics, 2016 Cost Scenario.
F-26
Greater Monument Butte
97% $20 $30 $40 $50 $60 $70 $80 $90 $100
100 75% 87% 93% 97% 99% 100% 100% 100% 100%
250 98% 100% 100% 100% 100% 100% 100% 100% 100%
500 100% 100% 100% 100% 100% 100% 100% 100% 100%
750 100% 100% 100% 100% 100% 100% 100% 100% 100%
1,000 100% 100% 100% 100% 100% 100% 100% 100% 100%
1,250 100% 100% 100% 100% 100% 100% 100% 100% 100%
1,500 100% 100% 100% 100% 100% 100% 100% 100% 100%
1,750 100% 100% 100% 100% 100% 100% 100% 100% 100%
2,000 100% 100% 100% 100% 100% 100% 100% 100% 100%
27 $20 $30 $40 $50 $60 $70 $80 $90 $100
100 159 104 64 33 7 0 0 0 0
250 24 0 0 0 0 0 0 0 0
500 0 0 0 0 0 0 0 0 0
750 0 0 0 0 0 0 0 0 0
1,000 0 0 0 0 0 0 0 0 0
1,250 0 0 0 0 0 0 0 0 0
1,500 0 0 0 0 0 0 0 0 0
1,750 0 0 0 0 0 0 0 0 0
2,000 0 0 0 0 0 0 0 0 0
EUR
(1
00
0 b
arre
ls/w
ell)
Table Showing Tail End Recovery Factor
Oil Price ($/barrel)
Uinta Basin: Greater Monument Butte/Uinta
Table Showing Months of Lost Production
Oil Price ($/barrel)
EUR
(1
00
0 b
arre
ls/w
ell)
Page 214
Appendix F: Tail-End Economics, 2016 Cost Scenario.
F-27
Wasatch SXL
99% $20 $30 $40 $50 $60 $70 $80 $90 $100
100 77% 83% 87% 89% 91% 92% 93% 94% 95%
250 91% 94% 95% 96% 97% 97% 98% 98% 98%
500 96% 97% 98% 98% 99% 99% 99% 99% 99%
750 97% 98% 99% 99% 99% 99% 100% 100% 100%
1,000 98% 99% 99% 99% 100% 100% 100% 100% 100%
1,250 99% 99% 99% 100% 100% 100% 100% 100% 100%
1,500 99% 99% 100% 100% 100% 100% 100% 100% 100%
1,750 99% 100% 100% 100% 100% 100% 100% 100% 100%
2,000 99% 100% 100% 100% 100% 100% 100% 100% 100%
60 $20 $30 $40 $50 $60 $70 $80 $90 $100
100 233 214 199 187 178 169 162 155 149
250 177 158 144 132 122 114 106 100 94
500 135 116 102 90 80 72 64 58 52
750 111 92 77 65 56 47 40 33 27
1,000 93 74 60 48 38 30 22 16 10
1,250 80 61 46 34 25 16 9 2 0
1,500 69 50 35 23 14 5 0 0 0
1,750 59 40 26 14 4 0 0 0 0
2,000 51 32 18 6 0 0 0 0 0
EUR
(1
00
0 b
arre
ls/w
ell)
Table Showing Tail End Recovery Factor
Oil Price ($/barrel)
Uinta Basin: Wasatch SXL
Table Showing Months of Lost Production
Oil Price ($/barrel)
EUR
(1
00
0 b
arre
ls/w
ell)
Page 215
Appendix F: Tail-End Economics, 2016 Cost Scenario.
F-28
Uteland Butte SXL
98% $20 $30 $40 $50 $60 $70 $80 $90 $100
100 93% 93% 93% 93% 93% 93% 93% 93% 93%
250 93% 93% 94% 95% 96% 96% 97% 97% 97%
500 93% 96% 97% 97% 98% 98% 98% 98% 99%
750 71% 97% 98% 98% 98% 99% 99% 99% 99%
1,000 51% 98% 98% 99% 99% 99% 99% 99% 99%
1,250 40% 98% 99% 99% 99% 99% 99% 99% 99%
1,500 32% 99% 99% 99% 99% 99% 99% 99% 100%
1,750 26% 99% 99% 99% 99% 99% 100% 100% 100%
2,000 22% 99% 99% 99% 99% 100% 100% 100% 100%
192 $20 $30 $40 $50 $60 $70 $80 $90 $100
100 243 236 236 236 236 236 236 236 236
250 259 236 233 227 222 218 214 210 207
500 270 219 211 205 200 196 192 189 186
750 280 206 199 193 188 183 179 176 173
1,000 289 197 190 184 179 174 170 167 164
1,250 296 190 183 177 171 167 163 160 157
1,500 302 184 177 171 166 161 158 154 151
1,750 307 180 172 166 161 157 153 149 146
2,000 311 175 168 162 157 152 148 145 142
EUR
(1
00
0 b
arre
ls/w
ell)
Table Showing Tail End Recovery Factor
Oil Price ($/barrel)
Uteland Butte SXL
Table Showing Months of Lost Production
Oil Price ($/barrel)
EUR
(1
00
0 b
arre
ls/w
ell)
Page 216
Appendix F: Tail-End Economics, 2016 Cost Scenario.
F-29
SW PA Wet Gas
100% $20 $30 $40 $50 $60 $70 $80 $90 $100
100 62% 68% 72% 76% 79% 82% 84% 86% 87%
250 92% 94% 96% 98% 99% 100% 100% 100% 100%
500 100% 100% 100% 100% 100% 100% 100% 100% 100%
750 100% 100% 100% 100% 100% 100% 100% 100% 100%
1,000 100% 100% 100% 100% 100% 100% 100% 100% 100%
1,250 100% 100% 100% 100% 100% 100% 100% 100% 100%
1,500 100% 100% 100% 100% 100% 100% 100% 100% 100%
1,750 100% 100% 100% 100% 100% 100% 100% 100% 100%
2,000 100% 100% 100% 100% 100% 100% 100% 100% 100%
- $20 $30 $40 $50 $60 $70 $80 $90 $100
100 204 187 171 157 144 133 122 112 103
250 73 55 40 26 13 1 0 0 0
500 0 0 0 0 0 0 0 0 0
750 0 0 0 0 0 0 0 0 0
1,000 0 0 0 0 0 0 0 0 0
1,250 0 0 0 0 0 0 0 0 0
1,500 0 0 0 0 0 0 0 0 0
1,750 0 0 0 0 0 0 0 0 0
2,000 0 0 0 0 0 0 0 0 0
EUR
(1
00
0 b
arre
ls/w
ell)
Table Showing Tail End Recovery Factor
Oil Price ($/barrel)
Appalachia Basin: SW PA Wet Gas
Table Showing Months of Lost Production
Oil Price ($/barrel)
EUR
(1
00
0 b
arre
ls/w
ell)
Page 217
Appendix F: Tail-End Economics, 2016 Cost Scenario.
F-30
SW PA Super Rich
100% $20 $30 $40 $50 $60 $70 $80 $90 $100
100 64% 71% 76% 80% 83% 86% 88% 90% 92%
250 94% 96% 98% 100% 100% 100% 100% 100% 100%
500 100% 100% 100% 100% 100% 100% 100% 100% 100%
750 100% 100% 100% 100% 100% 100% 100% 100% 100%
1,000 100% 100% 100% 100% 100% 100% 100% 100% 100%
1,250 100% 100% 100% 100% 100% 100% 100% 100% 100%
1,500 100% 100% 100% 100% 100% 100% 100% 100% 100%
1,750 100% 100% 100% 100% 100% 100% 100% 100% 100%
2,000 100% 100% 100% 100% 100% 100% 100% 100% 100%
- $20 $30 $40 $50 $60 $70 $80 $90 $100
100 195 173 153 136 121 107 94 82 71
250 58 35 16 0 0 0 0 0 0
500 0 0 0 0 0 0 0 0 0
750 0 0 0 0 0 0 0 0 0
1,000 0 0 0 0 0 0 0 0 0
1,250 0 0 0 0 0 0 0 0 0
1,500 0 0 0 0 0 0 0 0 0
1,750 0 0 0 0 0 0 0 0 0
2,000 0 0 0 0 0 0 0 0 0
EUR
(1
00
0 b
arre
ls/w
ell)
Table Showing Tail End Recovery Factor
Oil Price ($/barrel)
Appalachia Basin: SW PA Super Rich
Table Showing Months of Lost Production
Oil Price ($/barrel)
EUR
(1
00
0 b
arre
ls/w
ell)
Page 218
Appendix F: Tail-End Economics, 2016 Cost Scenario.
F-31
Utica Wet Gas
100% $20 $30 $40 $50 $60 $70 $80 $90 $100
100 74% 76% 77% 79% 80% 81% 82% 83% 84%
250 90% 91% 92% 92% 93% 93% 93% 94% 94%
500 96% 96% 96% 97% 97% 97% 97% 98% 98%
750 97% 98% 98% 98% 98% 98% 99% 99% 99%
1,000 98% 98% 99% 99% 99% 99% 99% 99% 99%
1,250 99% 99% 99% 99% 99% 99% 100% 100% 100%
1,500 99% 99% 99% 100% 100% 100% 100% 100% 100%
1,750 100% 100% 100% 100% 100% 100% 100% 100% 100%
2,000 100% 100% 100% 100% 100% 100% 100% 100% 100%
0% $20 $30 $40 $50 $60 $70 $80 $90 $100
100 228 223 218 214 210 206 202 198 195
250 164 159 154 150 145 141 138 134 131
500 115 110 105 101 97 93 89 85 82
750 87 82 77 72 68 64 60 57 54
1,000 67 62 57 52 48 44 40 37 33
1,250 51 46 41 37 32 28 25 21 18
1,500 38 33 28 24 20 16 12 8 5
1,750 27 22 17 13 9 5 1 0 0
2,000 18 13 8 4 0 0 0 0 0
EUR
(1
00
0 b
arre
ls/w
ell)
Table Showing Tail End Recovery Factor
Oil Price ($/barrel)
Appalachia Basin: Utica Wet Gas
Table Showing Months of Lost Production
Oil Price ($/barrel)
EUR
(1
00
0 b
arre
ls/w
ell)
Page 219
Appendix F: Tail-End Economics, 2016 Cost Scenario.
F-32
Utica Condensate
99% $20 $30 $40 $50 $60 $70 $80 $90 $100
100 76% 80% 83% 86% 87% 89% 90% 91% 92%
250 91% 93% 94% 95% 95% 96% 97% 97% 97%
500 96% 97% 97% 98% 98% 98% 99% 99% 99%
750 98% 98% 99% 99% 99% 99% 99% 100% 100%
1,000 98% 99% 99% 99% 100% 100% 100% 100% 100%
1,250 99% 99% 99% 100% 100% 100% 100% 100% 100%
1,500 99% 100% 100% 100% 100% 100% 100% 100% 100%
1,750 99% 100% 100% 100% 100% 100% 100% 100% 100%
2,000 100% 100% 100% 100% 100% 100% 100% 100% 100%
46 $20 $30 $40 $50 $60 $70 $80 $90 $100
100 226 213 202 192 184 177 170 164 159
250 164 151 140 131 122 115 108 102 97
500 117 104 93 84 75 68 61 55 50
750 89 77 66 56 48 41 34 28 23
1,000 70 57 46 37 29 21 15 9 3
1,250 55 42 31 22 13 6 0 0 0
1,500 43 30 19 9 1 0 0 0 0
1,750 32 19 8 0 0 0 0 0 0
2,000 23 10 0 0 0 0 0 0 0
EUR
(1
00
0 b
arre
ls/w
ell)
Table Showing Tail End Recovery Factor
Oil Price ($/barrel)
Appalachia Basin: Utica Condensate
Table Showing Months of Lost Production
Oil Price ($/barrel)
EUR
(1
00
0 b
arre
ls/w
ell)
Page 220
Appendix F: Tail-End Economics, 2016 Cost Scenario.
F-33
San Juan - Gallup
99% $20 $30 $40 $50 $60 $70 $80 $90 $100
100 74% 83% 87% 91% 93% 94% 96% 96% 97%
250 92% 96% 98% 99% 100% 100% 100% 100% 100%
500 99% 100% 100% 100% 100% 100% 100% 100% 100%
750 100% 100% 100% 100% 100% 100% 100% 100% 100%
1,000 100% 100% 100% 100% 100% 100% 100% 100% 100%
1,250 100% 100% 100% 100% 100% 100% 100% 100% 100%
1,500 100% 100% 100% 100% 100% 100% 100% 100% 100%
1,750 100% 100% 100% 100% 100% 100% 100% 100% 100%
2,000 100% 100% 100% 100% 100% 100% 100% 100% 100%
28 $20 $30 $40 $50 $60 $70 $80 $90 $100
100 193 160 135 114 98 83 70 59 49
250 100 66 41 21 4 0 0 0 0
500 29 0 0 0 0 0 0 0 0
750 0 0 0 0 0 0 0 0 0
1,000 0 0 0 0 0 0 0 0 0
1,250 0 0 0 0 0 0 0 0 0
1,500 0 0 0 0 0 0 0 0 0
1,750 0 0 0 0 0 0 0 0 0
2,000 0 0 0 0 0 0 0 0 0
EUR
(1
00
0 b
arre
ls/w
ell)
Table Showing Tail End Recovery Factor
Oil Price ($/barrel)
Other Regions: San Juan - Gallup
Table Showing Months of Lost Production
Oil Price ($/barrel)
EUR
(1
00
0 b
arre
ls/w
ell)
Page 221
Appendix F: Tail-End Economics, 2016 Cost Scenario.
F-34
Tuscaloosa Marine Shale
100% $20 $30 $40 $50 $60 $70 $80 $90 $100
100 78% 86% 91% 93% 95% 96% 97% 98% 98%
250 94% 97% 99% 100% 100% 100% 100% 100% 100%
500 99% 100% 100% 100% 100% 100% 100% 100% 100%
750 100% 100% 100% 100% 100% 100% 100% 100% 100%
1,000 100% 100% 100% 100% 100% 100% 100% 100% 100%
1,250 100% 100% 100% 100% 100% 100% 100% 100% 100%
1,500 100% 100% 100% 100% 100% 100% 100% 100% 100%
1,750 100% 100% 100% 100% 100% 100% 100% 100% 100%
2,000 100% 100% 100% 100% 100% 100% 100% 100% 100%
- $20 $30 $40 $50 $60 $70 $80 $90 $100
100 183 146 119 98 81 66 54 42 32
250 93 56 29 8 0 0 0 0 0
500 25 0 0 0 0 0 0 0 0
750 0 0 0 0 0 0 0 0 0
1,000 0 0 0 0 0 0 0 0 0
1,250 0 0 0 0 0 0 0 0 0
1,500 0 0 0 0 0 0 0 0 0
1,750 0 0 0 0 0 0 0 0 0
2,000 0 0 0 0 0 0 0 0 0
EUR
(1
00
0 b
arre
ls/w
ell)
Table Showing Tail End Recovery Factor
Oil Price ($/barrel)
Other Regions: Tuscaloosa Marine Shale
Table Showing Months of Lost Production
Oil Price ($/barrel)
EUR
(1
00
0 b
arre
ls/w
ell)
Page 222
G-1
Appendix G: Notes on the Lognormal Distribution
Here we set forth the basic facts concerning the lognormal distribution that we have relied on to
characterize the variation in well productivity within the population of drill sites located within each
individual shale oil play.
Two-parameter lognormal distribution,
It is assumed that EUR follows a lognormal distribution that ranges from zero to infinity. The
distribution is completely determined by two parameters: and . By
definition, the random variable itself follows a normal distribution with mean and standard
deviation . The following facts are well known:1
mode(EUR) :
median(EUR):
mean(EUR): [denoted ]
Note: median = mean
variance(EUR):
[denoted ]
coef. of var:
[denoted ]
Note: the coefficient of variation depends only on the variance.
Quantiles: lognormal distribution versus std. normal distribution 2
Let and be quantiles of order of and , respectively.
Then .
Proof:
. QED
1 J. Aitchison and J.A. C. Brown, The Lognormal Distribution, Cambridge Univ. Press, 1966, p. 8.
2 J. Aitchison and J.A.C. Brown op. cit., p. 9.
Page 223
G-2
Three-parameter (shifted) lognormal distribution,
The entire lognormal distribution will be shifted to the right if it is believed that EUR is bounded
away from zero. The UGSG follows this approach, assuming that the minimum EUR is approximately
20,000 barrels for all shale oil plays.3
If , then
If is known, the variate is immediately known and we have all the properties of the two variate
and no new theory arises:
for
Because USGS treats as a known parameter, this formulation guides their analysis.
Location parameters are each increased by 4
mean:
median:
mode:
Also quantiles of order are displaced from to .
All moments around the mean are unchanged.
coef. of var:
Estimation of and , given :
Expert judgement provides:
(median)
Thus,
and
3 USGS, Oil and Gas Assessment Team, “Variability of Distributions of Well-Scale Estimated Ultimate Recovery for
Continuous (Unconventional) Oil and Gas Resources in the United States, Open-File Report 2012-1118. 4 J. Aitchison and J.A.C. Brown, op. cit., p. 15.
Page 224
G-3
from which it follows:
.
Thus:
.5
Estimation of and , given (general quantile approach):
Expert judgment provides:
Thus:
,
thus:
.6
But, how to estimate the mean ? You need expert judgment regarding either the mean, mode, or
median of the lognormal distribution:
Ex. #1: Given the mode , it follows that:
, which gives: .
Ex. #2: Given the mean , it follows that:
, which gives: .
Ex. #3: Given the median , it follows that: .
The third method, based on expert judgment of the median, is how USGS estimates .7
5 This corresponds to the estimation equation for found in USGS, op. cit., p. 2.
6 This is the general form of Eq. 6.21 in J. Aitchison and J.A.C. Brown, op. cit., p. 58.
Page 225
G-4
Parameters of the “shifted truncated” lognormal distribution
USGS makes various calculations based on a finite, discretized spreadsheet representation of the
estimated lognormal distribution. For that purpose, it is necessary for them to impose an upper bound
on EUR, which they refer to as . Their distribution is therefore truncated at the upper bound,
and probability densities are recalibrated to ensure that the truncated density function still integrates to
unity. The mean and variance of this truncated distribution deviate from the mean and variance of the
non-truncated distribution. These transformations are described in Aitchison and Brown, and have been
adopted by USGS.8
Our calculations are not based on a discretized spreadsheet representation of the estimated
lognormal distribution. Rather, we integrate over the full range of the distribution and do not apply the
truncation transformations. We also do not impose a lower found on the estimated lognormal
distribution—assuming instead that EUR at a given drill site may approach arbitrarily close to zero (albeit
with miniscule probability). In practice, whether the lower bound is assumed to be zero or 20,000
barrels has negligible effect on the results, and the analytics are greatly simplified if the lower bound is
assumed to be zero, as explained in the next section.
Calibrating the Variance to Match Expert Judgment:
Our procedure involves identifying the mean EUR of the lognormal distribution based on expert
industry judgment (we could use the USGS estimate, but it is dated) and estimating the coefficient of
variation (which is independent of the mean) based on the data provided by USGS. The remaining
parameter of interest (standard deviation) can then be deduced. With the two-parameter distribution
(zero lower bound), this is trivial. We have already shown:
,
from which it follows:
7 Their estimating equation is presented in USGS, op. cit., p. 2 (top).
8 See Eq. 9.3 of J. Aitchison and J.A.C. Brown, op. cit., p. 87, which is the source of the two equations presented in
USGS, op. cit., p. 2.
Page 226
G-5
.
For a shifted lognormal distribution with positive threshold ( ), this problem entails the solution of
two nonlinear equations in and , which are derived in the next section. As mentioned previously,
however, because the USGS lower bound is close to zero, the resulting difference is negligible so we
have applied the simpler method shown above. A comparison of the results of the two methods is
tabulated later.
Calibrating the moments of a “shifted lognormal” distribution:
Objective: Given the minimum value (), median value (med), and coefficient of variation () of
a lognormal distribution, find the mean and standard deviation.
We know:
And:
Also, by defintion:
Divide through by to obtain:
Thus:
Which implies:
. (I)
Since we have two unknowns ( ), we need another equation to complete the solution.
Start from the identity:
From which:
Page 227
G-6
And
(II)
Now, equate the two expressions for sigma (I and II):
After substituting for :
Finally:
This is one equation in one unknown (mean) that must be solved numerically. Having solved for mean,
the stdev is found through the relation:
The parameters of the corresponding normal distribution are then obtained from (I) and (II).
Page 228
G-7
Estimated Coefficients of Variation: Comparison of Methods9
Table G1: Estimates of the non-shifted, non-truncated lognormal distribution.
Table G2: Estimates of the shifted, non-truncated lognormal distribution.
9 AU (Assessment Unit) names, provinces, plus min, med, and max of the respective lognormal distributions are as
given in USGS, op. cit., p. 7.
AU Name Province min med max m s mean stdev coef var.
1 Eastern Expulsion Threshold Williston Basin 2008 0.000 0.120 5.000 -2.120 1.207 0.249 0.451 1.814
2 Nesson-Little Knife Structural Williston Basin 2008 0.000 0.090 4.000 -2.408 1.228 0.191 0.359 1.875
3 Cane Creek Shale Oil Paradox Basin 2011 0.000 0.080 3.000 -2.526 1.173 0.159 0.274 1.720
4 Northwest Explusion Threshold Williston Basin 2008 0.000 0.065 4.000 -2.733 1.333 0.158 0.350 2.217
5 Elm Coulee-Billings Nose Williston Basin 2008 0.000 0.080 2.000 -2.526 1.042 0.138 0.193 1.400
6 Marias River Shale Continuous Oil Montana Thrust Belt 2002 0.000 0.080 1.600 -2.526 0.969 0.128 0.160 1.249
7 Niobrara Continuous Oil Southwestern Wyoming 2002 0.000 0.080 1.600 -2.526 0.969 0.128 0.160 1.249
8 Niobrara Continuous Oil Hanna, Laramie, Shirley 2005 0.000 0.040 1.600 -3.219 1.194 0.082 0.145 1.777
9 Central Basin-Poplar Dome Williston Basin 2008 0.000 0.025 2.000 -3.689 1.418 0.068 0.174 2.543
10 Gothic, Chimney Rock, Hovenweep Paradox Basin 2011 0.000 0.030 1.500 -3.507 1.266 0.067 0.133 1.991
11 Woodford Shale Oil Anadarko Basin 2010 0.000 0.030 1.500 -3.507 1.266 0.067 0.133 1.991
12 Deep Uinta Overpressured Cont. Oil Uinta-Piceance 2000 0.000 0.045 0.450 -3.101 0.745 0.059 0.051 0.862
13 Spraberrry Continuous Oil Permian Basin 2007 0.000 0.045 0.400 -3.101 0.707 0.058 0.047 0.805
14 Eagle Ford Shale Oil Gulf Coast Mesozoic 2010 0.000 0.030 1.000 -3.507 1.135 0.057 0.093 1.620
15 Austin Pearsall-Giddings Area Oil Gulf Coast Mesozoic 2010 0.000 0.040 0.500 -3.219 0.817 0.056 0.054 0.975
16 Niobrara Continuous Oil Powder River Basin 2002 0.000 0.028 0.500 -3.576 0.933 0.043 0.051 1.178
17 Mowry Continuous Oil Powder River Basin 2002 0.000 0.025 0.350 -3.689 0.854 0.036 0.037 1.036
18 Mowry Fractured Shale Cont. Oil Big Horn Basin 2008 0.000 0.025 0.350 -3.689 0.854 0.036 0.037 1.036
19 Fractured Niobrara Limestone (Silo) Denver Basin 2001 0.000 0.022 0.400 -3.817 0.939 0.034 0.041 1.189
20 Niobrara-Cedell (Wattenberg Area) Denver Basin 2001 0.000 0.008 0.100 -4.828 0.817 0.011 0.011 0.975
mean = 1.475
st.dev. = 0.495
Normal Distribution Shifted LognormalUSGS estimates
AU Name Province min med max m s mean stdev coef var.
1 Eastern Expulsion Threshold Williston Basin 2008 0.002 0.120 5.000 -2.137 1.212 0.248 0.450 1.815
2 Nesson-Little Knife Structural Williston Basin 2008 0.002 0.090 4.000 -2.430 1.235 0.191 0.358 1.876
3 Cane Creek Shale Oil Paradox Basin 2011 0.002 0.080 3.000 -2.551 1.181 0.159 0.273 1.719
4 Northwest Explusion Threshold Williston Basin 2008 0.002 0.065 4.000 -2.765 1.343 0.157 0.350 2.224
5 Elm Coulee-Billings Nose Williston Basin 2008 0.002 0.080 2.000 -2.551 1.049 0.137 0.192 1.397
6 Marias River Shale Continuous Oil Montana Thrust Belt 2002 0.001 0.080 1.600 -2.538 0.973 0.128 0.159 1.247
7 Niobrara Continuous Oil Southwestern Wyoming 2002 0.001 0.080 1.600 -2.538 0.973 0.128 0.159 1.247
8 Niobrara Continuous Oil Hanna, Laramie, Shirley 2005 0.001 0.040 1.600 -3.244 1.202 0.081 0.144 1.777
9 Central Basin-Poplar Dome Williston Basin 2008 0.002 0.025 2.000 -3.772 1.445 0.067 0.174 2.578
10 Gothic, Chimney Rock, Hovenweep Paradox Basin 2011 0.002 0.030 1.500 -3.576 1.288 0.066 0.132 2.000
11 Woodford Shale Oil Anadarko Basin 2010 0.003 0.030 1.500 -3.612 1.299 0.066 0.132 2.004
12 Deep Uinta Overpressured Cont. Oil Uinta-Piceance 2000 0.003 0.045 0.450 -3.170 0.765 0.059 0.050 0.847
13 Spraberrry Continuous Oil Permian Basin 2007 0.001 0.045 0.400 -3.124 0.713 0.058 0.046 0.801
14 Eagle Ford Shale Oil Gulf Coast Mesozoic 2010 0.002 0.030 1.000 -3.576 1.156 0.057 0.092 1.617
15 Austin Pearsall-Giddings Area Oil Gulf Coast Mesozoic 2010 0.002 0.040 0.500 -3.270 0.833 0.056 0.054 0.964
16 Niobrara Continuous Oil Powder River Basin 2002 0.002 0.028 0.500 -3.650 0.955 0.043 0.050 1.164
17 Mowry Continuous Oil Powder River Basin 2002 0.002 0.025 0.350 -3.772 0.879 0.036 0.037 1.020
18 Mowry Fractured Shale Cont. Oil Big Horn Basin 2008 0.002 0.025 0.350 -3.772 0.879 0.036 0.037 1.020
19 Fractured Niobrara Limestone (Silo) Denver Basin 2001 0.002 0.022 0.400 -3.912 0.968 0.034 0.040 1.172
20 Niobrara-Cedell (Wattenberg Area) Denver Basin 2001 0.003 0.008 0.100 -5.298 0.960 0.011 0.010 0.892
mean = 1.469
st.dev. = 0.510
Shifted LognormalNormal DistributionUSGS estimates
Page 229
G-8
Table G3: Estimates of the shifted, truncated lognormal distribution (USGS method).
AU Name Province min med max m s factor 1a factor 2b E[x] E[x2] mean stdev coef var.
1 Eastern Expulsion Threshold Williston Basin 2008 0.002 0.120 5.000 -2.137 1.212 0.971 0.748 0.239 0.197 0.241 0.374 1.552
2 Nesson-Little Knife Structural Williston Basin 2008 0.002 0.090 4.000 -2.430 1.235 0.969 0.733 0.183 0.120 0.185 0.294 1.591
3 Cane Creek Shale Oil Paradox Basin 2011 0.002 0.080 3.000 -2.551 1.181 0.973 0.768 0.152 0.076 0.154 0.230 1.487
4 Northwest Explusion Threshold Williston Basin 2008 0.002 0.065 4.000 -2.765 1.343 0.961 0.658 0.149 0.096 0.151 0.272 1.800
5 Elm Coulee-Billings Nose Williston Basin 2008 0.002 0.080 2.000 -2.551 1.049 0.980 0.840 0.133 0.046 0.135 0.169 1.258
6 Marias River Shale Continuous Oil Montana Thrust Belt 2002 0.001 0.080 1.600 -2.538 0.973 0.984 0.875 0.125 0.036 0.126 0.144 1.144
7 Niobrara Continuous Oil Southwestern Wyoming 2002 0.001 0.080 1.600 -2.538 0.973 0.984 0.875 0.125 0.036 0.126 0.144 1.144
8 Niobrara Continuous Oil Hanna, Laramie, Shirley 2005 0.001 0.040 1.600 -3.244 1.202 0.972 0.755 0.078 0.021 0.079 0.121 1.526
9 Central Basin-Poplar Dome Williston Basin 2008 0.002 0.025 2.000 -3.772 1.445 0.951 0.580 0.062 0.020 0.064 0.127 1.979
10 Gothic, Chimney Rock, Hovenweep Paradox Basin 2011 0.002 0.030 1.500 -3.576 1.288 0.965 0.698 0.062 0.015 0.064 0.106 1.659
11 Woodford Shale Oil Anadarko Basin 2010 0.003 0.030 1.500 -3.612 1.299 0.964 0.690 0.061 0.015 0.064 0.105 1.654
12 Deep Uinta Overpressured Cont. Oil Uinta-Piceance 2000 0.003 0.045 0.450 -3.170 0.765 0.991 0.943 0.056 0.005 0.059 0.047 0.807
13 Spraberrry Continuous Oil Permian Basin 2007 0.001 0.045 0.400 -3.124 0.713 0.992 0.953 0.056 0.005 0.057 0.044 0.768
14 Eagle Ford Shale Oil Gulf Coast Mesozoic 2010 0.002 0.030 1.000 -3.576 1.156 0.975 0.783 0.053 0.009 0.055 0.078 1.410
15 Austin Pearsall-Giddings Area Oil Gulf Coast Mesozoic 2010 0.002 0.040 0.500 -3.270 0.833 0.989 0.925 0.053 0.005 0.055 0.050 0.909
16 Niobrara Continuous Oil Powder River Basin 2002 0.002 0.028 0.500 -3.650 0.955 0.985 0.883 0.040 0.004 0.042 0.045 1.073
17 Mowry Continuous Oil Powder River Basin 2002 0.002 0.025 0.350 -3.772 0.879 0.988 0.911 0.033 0.002 0.035 0.034 0.954
18 Mowry Fractured Shale Cont. Oil Big Horn Basin 2008 0.002 0.025 0.350 -3.772 0.879 0.988 0.911 0.033 0.002 0.035 0.034 0.954
19 Fractured Niobrara Limestone (Silo) Denver Basin 2001 0.002 0.022 0.400 -3.912 0.968 0.984 0.878 0.031 0.002 0.033 0.036 1.077
20 Niobrara-Cedell (Wattenberg Area) Denver Basin 2001 0.003 0.008 0.100 -5.298 0.960 0.986 0.886 0.008 0.000 0.011 0.009 0.821
a. Factor 1 = F ((lnmax -m-2s2)/s)/F ((lnmax -m)/s), where F ( ) represents the standardized Normal distribution function. mean = 1.278
b. Factor 2 = F ((lnmax -m-s2)/s)/F ((lnmax -m)/s). st.dev. = 0.363
Shifted Truncated LognormalTruncation LognormalUSGS estimates
Page 230
G-9
Derivation of the Percentage of Drilling Sites and Resources that are Economically Viable
The portion of technically recoverable resources that constitute reserves at any given price level
is composed of the reserves of all drill sites that are economically viable; i.e., where . This
is quantified by integrating the recoverable resource over all drill sites that exceed the threshold:
, (G1)
where represents the number of potential drilling sites in the play and represents the
lognormal density of EUR.
The volume of technically recoverable resources is found by integrating over all drill sites:
. (G2)
Reserves as a percentage of the potentially recoverable resource base is given by the ratio:
(G3)
We multiply and divide the numerator by the term to obtain:
, (G4)
where
.
Equation (G4) can be written equivalently as:
, (G5)
where:
.
Since follows a lognormal distribution, the conditional mean is given by:10
. (G6)
10
J. Aitchison and J.A.C. Brown, op.cit., Eq. 9.3, p. 87.
Page 231
G-10
After substituting this into (G5), and observing that
= ,
we have:
. (G7)