The Price of Correlation Risk: Evidence from Equity Options Joost Driessen y Pascal Maenhout z Grigory Vilkov x November 2007 Abstract We study whether di/erences in exposure to market-wide correlation shocks can account for cross-sectional di/erences in expected returns. Consistent with correlation increases lowering diversication benets and investor welfare, we present evidence of a large and signicant corre- lation risk premium. We use data on S&P100 index options, options on all index components, and stock returns. First, we provide indirect evidence of priced correlation risk based on the prices of index and individual variance risk. Second, a trading strategy exploiting priced corre- lation risk generates a high alpha and Sharpe ratio and is an attractive investment for CRRA investors when ignoring frictions. Third, exposure to correlation risk explains the cross-section of index and individual option returns very well. Index options hedge correlation risk, o/ering a risk-based explanation for their high prices and low returns relative to individual options. Finally, incorporating realistic transaction costs and margin requirements, we nd that the cor- relation risk premium cannot be exploited, providing a limits to arbitrage interpretation of our ndings of a high price of correlation risk. We would like to thank Yacine At-Sahalia, David Bates, Jonathan Berk, Oleg Bondarenko, Michael Brandt, Menachem Brenner, John Campbell, Mike Chernov, Greg Du/ee, Darrell Du¢ e, Rob Engle, Jan Ericsson, Gerard Gennotte, Jens Jackwerth, Chris Jones, Frank de Jong, Hayne Leland, Toby Moskowitz, Anthony Neuberger, Pe- dro Santa-Clara, Josh Rosenberg, Mark Rubinstein, Ken Singleton, Otto van Hemert, Robert Whitelaw, Zhipeng Zhang and especially Bernard Dumas for comments and stimulating discussions. We are particularly grateful for the detailed and constructive comments of an anonymous referee and the Editor. We received helpful comments from seminar participants at Berkeley Haas School of Business, BI Oslo, Cornell Johnson School, HEC Lausanne, INSEAD, LBS-LSE-Oxford Asset Pricing Workshop, MIT Sloan, NY Fed, NYU Stern, Stanford GSB, Tilburg, University of Amsterdam, University of Bonn, University of Frankfurt, University of Rotterdam, Warwick Business School, Yale SOM, CEPR Summer Symposium Gerzensee, EFA 2005, the Duke-UNC Asset Pricing Conference and WFA 2006. We gratefully acknowledge the nancial support of INSEAD R&D. y University of Amsterdam, Finance Group, Faculty of Economics and Econometrics, Roetersstraat 11, 1018 WB Amsterdam, the Netherlands. Email: [email protected]. z INSEAD, Finance Department, Boulevard de Constance, 77305 Fontainebleau Cedex, France. Email: pas- [email protected]. x INSEAD, Finance Department, Boulevard de Constance, 77305 Fontainebleau Cedex, France. Email: grig- [email protected]. 1
Transcript
The Price of Correlation Risk: Evidence from Equity Options�
Joost Driesseny Pascal Maenhoutz Grigory Vilkovx
November 2007
Abstract
We study whether di¤erences in exposure to market-wide correlation shocks can account for
cross-sectional di¤erences in expected returns. Consistent with correlation increases lowering
diversi�cation bene�ts and investor welfare, we present evidence of a large and signi�cant corre-
lation risk premium. We use data on S&P100 index options, options on all index components,
and stock returns. First, we provide indirect evidence of priced correlation risk based on the
prices of index and individual variance risk. Second, a trading strategy exploiting priced corre-
lation risk generates a high alpha and Sharpe ratio and is an attractive investment for CRRA
investors when ignoring frictions. Third, exposure to correlation risk explains the cross-section
of index and individual option returns very well. Index options hedge correlation risk, o¤ering
a risk-based explanation for their high prices and low returns relative to individual options.
Finally, incorporating realistic transaction costs and margin requirements, we �nd that the cor-
relation risk premium cannot be exploited, providing a limits to arbitrage interpretation of our
�ndings of a high price of correlation risk.
�We would like to thank Yacine Aït-Sahalia, David Bates, Jonathan Berk, Oleg Bondarenko, Michael Brandt,Menachem Brenner, John Campbell, Mike Chernov, Greg Du¤ee, Darrell Du¢ e, Rob Engle, Jan Ericsson, GerardGennotte, Jens Jackwerth, Chris Jones, Frank de Jong, Hayne Leland, Toby Moskowitz, Anthony Neuberger, Pe-dro Santa-Clara, Josh Rosenberg, Mark Rubinstein, Ken Singleton, Otto van Hemert, Robert Whitelaw, ZhipengZhang and especially Bernard Dumas for comments and stimulating discussions. We are particularly grateful for thedetailed and constructive comments of an anonymous referee and the Editor. We received helpful comments fromseminar participants at Berkeley Haas School of Business, BI Oslo, Cornell Johnson School, HEC Lausanne, INSEAD,LBS-LSE-Oxford Asset Pricing Workshop, MIT Sloan, NY Fed, NYU Stern, Stanford GSB, Tilburg, University ofAmsterdam, University of Bonn, University of Frankfurt, University of Rotterdam, Warwick Business School, YaleSOM, CEPR Summer Symposium Gerzensee, EFA 2005, the Duke-UNC Asset Pricing Conference and WFA 2006.We gratefully acknowledge the �nancial support of INSEAD R&D.
yUniversity of Amsterdam, Finance Group, Faculty of Economics and Econometrics, Roetersstraat 11, 1018 WBAmsterdam, the Netherlands. Email: [email protected].
zINSEAD, Finance Department, Boulevard de Constance, 77305 Fontainebleau Cedex, France. Email: [email protected].
xINSEAD, Finance Department, Boulevard de Constance, 77305 Fontainebleau Cedex, France. Email: [email protected].
1
The Price of Correlation Risk: Evidence from Equity Options
Abstract
We study whether di¤erences in exposure to market-wide correlation shocks can account for
cross-sectional di¤erences in expected returns. Consistent with correlation increases lowering di-
versi�cation bene�ts and investor welfare, we present evidence of a large and signi�cant correlation
risk premium. We use data on S&P100 index options, options on all index components, and stock
returns. First, we provide indirect evidence of priced correlation risk based on the prices of index
and individual variance risk. Second, a trading strategy exploiting priced correlation risk generates
a high alpha and Sharpe ratio and is an attractive investment for CRRA investors when ignoring
frictions. Third, exposure to correlation risk explains the cross-section of index and individual
option returns very well. Index options hedge correlation risk, o¤ering a risk-based explanation
for their high prices and low returns relative to individual options. Finally, incorporating realistic
transaction costs and margin requirements, we �nd that the correlation risk premium cannot be
exploited, providing a limits to arbitrage interpretation of our �ndings of a high price of correlation
risk.
Correlations play a central role in �nancial markets. There is considerable evidence that cor-
relations between asset returns change over time1 and that stock-return correlations increase when
returns are low.2 A market-wide increase in correlations negatively a¤ects investor welfare by
lowering diversi�cation bene�ts and by increasing market volatility, so that states of nature with
unusually high correlations may be expensive. It is therefore natural to ask whether market-wide
correlation risk is priced in the sense that assets that pay o¤ well when market-wide correlations
are higher than expected (thus providing a hedge against correlation risk) earn lower returns than
can be justi�ed by their exposure to other priced risk factors. Index options are an obvious example
of such assets and will appear expensive when correlation risk is priced.
This is the �rst paper to analyze whether cross-sectional di¤erences in exposure to market-wide
correlation risk can account for cross-sectional di¤erences in expected returns. Our �rst contribution
is to provide evidence of a large correlation risk premium. We show that the di¤erential pricing
of index and individual stock options contains unique information on the price of correlation risk.
In particular, our analysis of the cross-section of index and individual option returns, as well as
the study of variance risk premia in index and individual options highlights an important tension
between index and individual option prices. Demonstrating this tension and o¤ering a risk-based
explanation for it forms the second contribution of this paper.
The bulk of recent work on empirical option pricing studies index options. Although there
is growing evidence that individual option prices and returns behave di¤erently empirically, most
work focuses on Black-Scholes (1973) and Merton (1973a) implied volatility functions.3 We add
formal evidence that individual options, unlike index options, do not embed a negative variance risk
premium, nor earn economically signi�cant returns in excess of a one-factor model. By considering
individual options on all index components, our analysis emphasizes that a challenge in option
pricing concerns explaining the di¤erence between expected index and individual option returns.
This is challenging since the index process is the weighted average of the individual processes. A
risk-based explanation for the contrast between index and individual options requires that aggre-
gated individual processes be exposed to a risk factor that is lacking from the individual processes.
1See Bollerslev, Engle and Woolridge (1988) and Moskowitz (2003), among others. Brandt and Diebold (2003)and Engle and Sheppard (2005) present recent innovations in the estimation of dynamic correlations.
2Financial crises are often viewed as episodes of unusually high correlations. Roll (1988) analyzes the 1987 crashand Jorion (2000) studies the Russia/LTCM crisis. Longin and Solnik (2001) use extreme value theory to studywhether international equity correlations increase in volatile times.
3See for instance Bakshi and Kapadia (2003b), Bakshi, Kapadia and Madan (2003), Bollen and Whaley (2004),Branger and Schlag (2004), Dennis and Mayhew (2002) and Dennis, Mayhew and Stivers (2005).
1
Priced correlation risk makes this possible. Intuitively, index options are expensive and earn low
returns, unlike individual options, because they o¤er a valuable hedge against correlation increases
and insure against the risk of a loss in diversi�cation bene�ts.4 ;5 Our results thereby also o¤er a
novel view on the source of the large volatility risk premium that recent work on index options has
disclosed.
We use data on S&P100 index options and on individual options on all the S&P100 index
components, combined with prices of the underlying stocks from January 1996 until the end of
December 2003. We provide evidence for a correlation risk premium in three di¤erent ways.
First, we present a general decomposition of index variance risk. Index variance changes are
due to changes in individual variances and changes in correlations, so that index variance risk is
priced to the extent that individual variance risk and correlation risk are priced. We �nd a large
negative index variance risk premium, in line with results in the recent literature.6 Unlike recent
work, we also estimate variance risk premia in all individual options on all S&P100 components
and �nd no evidence of a negative risk premium on individual variance risk.7 As the decomposition
shows, these two �ndings are only consistent with each other in a risk-based model if exposure to
correlation shocks is priced. Therefore, the stylized facts about index and individual variance risk
provide model-free indirect evidence for priced correlation risk.
Second, we derive a simple option-based trading strategy aimed at exploiting priced correlation
risk. The strategy sells index straddles and buys individual straddles and stocks in order to hedge
individual variance risk and stock market risk, respectively. This trading strategy o¤ers an attrac-
tive risk-return trade-o¤. Its Sharpe ratio is 77% higher than the one for bearing stock market risk
in our sample. Correcting for standard risk factors, we �nd a large excess return of more than 10%
per month. This is direct evidence of a large correlation risk premium. We demonstrate that this
4Rubinstein (2000) revisits the 1987 crash and lists correlation risk as a potential reason why stock market declinesand increases in volatility coincide, noting that "Correlation increases in market declines, which increases volatilityand reduces opportunities for diversi�cation."
5Garleanu, Pedersen and Poteshman (2005) develop a model where risk-averse market makers cannot perfectlyhedge a book of options, so that demand pressure increases the price of options. The authors document empiricallythat end users are net long index options, which could explain their high prices, but the model is agnostic about thesource of the exogenous demand by end users. Our �ndings suggest that the demand for index options may well bedriven by investors�desire to hedge against correlation risk.
6The relevant literature includes Ait-Sahalia and Kimmel (2005), Andersen, Benzoni and Lund (2002), Bakshi andKapadia (2003a), Bollerslev, Gibson and Zhou (2004), Bondarenko (2004), Broadie, Chernov and Johannes (2005),Buraschi and Jackwerth (2001), Carr and Wu (2004), Coval and Shumway (2001), Eraker, Johannes and Polson(2003), Eraker (2004), Jones (2006) and Pan (2002). Bates (2003) surveys earlier work.
7 In fact, we obtain weak evidence of a positive variance risk premium in individual options, which strengthens theevidence of a correlation risk premium.
2
strategy has more attractive risk-return properties than the option-based trading strategies that
have been suggested in the literature (like selling index puts or selling market variance), especially
when considering higher moments of the return distributions. In a portfolio choice setting we �nd
that the correlation strategy generates a utility gain for a CRRA investor that is substantially
larger than what can be obtained with existing option-based strategies (selling market variance or
selling index puts).
Finally, we estimate the correlation risk premium from the cross-section of index and individual
option returns. Because of the large dispersion in their sensitivities to market-wide correlation
shocks, these assets constitute a particularly well-chosen cross-section. Furthermore, recent work
has shown that expected index option returns are very large in absolute value and extremely
challenging to explain (e.g. Bondarenko (2003a and 2003b), Buraschi and Jackwerth (2001), Coval
and Shumway (2001) and Jones (2006)). We show that di¤erences in exposure to the correlation risk
factor account for 70% of the cross-sectional variation in CAPM residuals of index and individual
option returns. The estimated correlation risk premium is large and highly signi�cant. Exposure
to individual variance risk is not priced in this cross-section, in line with our other results.
In sum, our �ndings strongly suggest that correlation risk is priced. Merton�s ICAPM (1973b)
may provide a theoretical explanation for this �nding to the extent that market-wide correlation
levels have predictive power for market variance. As an alternative hypothesis, the large correla-
tion risk premium we document may be interpreted as re�ecting mispricing of index options due
to investor irrationality and lack of arbitrage. For example, some investors may be overly cautious
about correlation risk and this may lead to an irrationally high correlation risk premium. Simul-
taneously, rational arbitrageurs may face market frictions, which prevent them from exploiting the
high correlation risk premium. To explore this limits to arbitrage hypothesis, we analyze the impact
on the pro�tability and feasibility of our correlation trading strategy of market frictions in the form
of transaction costs and margin requirements as in Santa-Clara and Saretto (2007). We show that
transaction costs have an important impact on the pro�tability of the trading strategy. Its Sharpe
ratio no longer exceeds the equity Sharpe ratio and the optimal portfolio weight for the correla-
tion strategy becomes statistically insigni�cant. The impact of transaction costs on the correlation
strategy is large because of the high bid-ask spreads for individual options. Furthermore, margin
requirements make the correlation trading strategy infeasible for risk-tolerant investors, who stand
to gain most from the strategy. Thus, if the large correlation risk premium re�ects mispricing of
3
index options, rational investors facing realistic market frictions cannot arbitrage the mispricing
away and cannot exploit the correlation risk premium.
Very few papers have studied trading strategies based on individual options. A notable excep-
tion is Goyal and Saretto (2007), who analyze trading strategies using the cross-section of individual
options and who obtain very high Sharpe ratios. Their paper is complementary to ours, since they
study in detail the cross-sectional predictability of individual option returns, while we focus on
the di¤erence between index and individual option returns (without modeling the cross-sectional
di¤erences of individual stock options).
Our paper is also related to work on option-implied correlations. Several articles have inves-
tigated the correlation structure of interest rates of di¤erent maturities. Longsta¤, Santa-Clara
and Schwartz (2003), De Jong, Driessen and Pelsser (2004) and Han (2006) provide evidence that
interest rate correlations implied by cap and swaption prices di¤er from realized correlations. Collin-
Dufresne and Goldstein (2001) propose a term structure model where bond return correlations are
stochastic. Campa and Chang (1998) and Lopez and Walter (2000) study the predictive content
of implied correlations obtained from foreign exchange options for future realized correlations be-
tween exchange rates. Skintzi and Refenes (2003) describe how index and individual stock options
can be used to �nd implied equity correlations for the Dow Jones Industrial Average index. They
study the statistical properties and the dynamics of the implied correlation measure with one year
of data, but do not analyze the key implications for index option pricing. In fact, none of these
articles investigates or estimates a risk premium on correlation risk. The negative correlation risk
premium we �nd implies higher expected correlation paths under the risk-neutral measure than
under the actual measure. This divergence in expected correlations under the two measures can
explain why option-implied correlations exceed average realized correlations.
Finally, it is interesting to note that practitioners have recognized the possibility of trading
priced correlation risk, by implementing a strategy known as �dispersion trading�. This strategy
typically involves short positions in index options and long positions in individual options. Very
recently, a new contract aimed at directly exploiting the correlation risk premium has been intro-
duced, namely the correlation swap.
The paper is organized as follows. Section 1 presents the general decomposition of index
variance risk. The data are described in section 2. Section 3 provides empirical evidence on
variance and correlation risk premia, based on the framework of section 1. Section 4 develops
4
and empirically implements a correlation trading strategy. In section 5 we study whether priced
correlation risk can explain the empirical cross-section of option returns. Section 6 discusses the
impact of transaction costs and margin requirements on the feasibility and the pro�tability of the
We show in a general framework how market variance risk can be decomposed into individual
variance risk and correlation risk. The risk premium for bearing market variance risk can similarly
be decomposed. This section also brie�y discusses the model-free implied variance estimator used
in our empirical analysis in section 3.
1.1 The Determinants of Market Variance Risk
We study (priced) market variance risk from a new perspective by explicitly acknowledging that
market variance risk can be decomposed into individual variance risk and correlation risk, unlike
existing work, which does not entertain the possibility of priced correlation risk.
The stock market index is composed of N stocks. The price of stock i, Si, follows an Ito
process with instantaneous variance �2i , which itself also follows an Ito process.8 The instantaneous
correlation between Wiener processes Bi and Bj that drive stocks i and j is
Et [dBidBj ] = �ij (t) dt; i 6= j: (1)
While we impose more structure on the dynamics of �ij (t) in section 4, we now only assume
that �ij (t) follows an Ito process and that the conditions on �i (t) and �ij (t) for the resulting
variance-covariance matrix to be positive-de�nite are satis�ed for all t.
Given a set of index weights fwig, the instantaneous index variance �2I (t) at time t is
�2I (t) =NPi=1w2i �
2i (t) +
NPi=1
Pj 6=iwiwj�i (t)�j (t) �ij (t) : (2)
It is clear from (2) that index variance changes are driven by shocks to individual variances �2i (t)
and to correlations �ij (t). We are interested in the extent to which exposure to these shocks
8We omit time as an argument for notational convenience throughout, except when placing particular emphasis.
5
is priced. If the price of correlation risk is negative (because states with higher than expected
correlation are associated with a deterioration in investment opportunities and investor welfare),
assets with payo¤s that covary positively with correlation provide a hedge against unexpected
correlation increases and earn negative excess returns relative to what is justi�ed by their exposure
to standard risk factors. An index option has by construction a large positive exposure to index-
wide correlation risk and thus constitutes a prime example of such an asset. Formally, a negative
correlation risk premium manifests itself in a higher drift for the instantaneous correlation under the
risk-neutral measure Q than under the physical measure P , thus driving a wedge between expected
correlations under the two distributions. Intuitively, an index option will then seem expensive
relative to a benchmark without priced correlation risk like Black-Scholes. The concept of priced
variance risk follows the same reasoning.
The total index variance risk premium is EQt�d�2I
��EPt
�d�2I
�.9 Given constant index weights
fwig and de�ning �i � w2i +Pj 6=iwiwj
�j�i�ij , applying Ito�s lemma to (2) shows that
EQt�d�2I
�� EPt
�d�2I
�=
NPi=1�i
nEQt
�d�2i
�� EPt
�d�2i
�o+
NPi=1
Pj 6=iwiwj�i�j
nEQt
�d�ij
�� EPt
�d�ij
�o(3)
In words, the index variance risk premium re�ects all individual variance risk premia EQt�d�2i
��
EPt�d�2i
�, as well as correlation risk premia EQt
�d�ij
��EPt
�d�ij
�.10 The factor �i multiplying the
individual variance risk premium represents the contribution of stock i�s return variance to the
index variance, scaled by its own variance. This is intuitive since the �i�s are used as weights when
summing the individual variance risk premia to obtain their importance for the index variance risk
premium.
Below, we �rst present a detailed study of index and individual variance risk premia, i.e. the
left-hand side and the �rst sum on the right-hand side of equation (3). This analysis provides
indirect evidence on the importance of the �nal sum in equation (3), i.e. on correlation risk premia.
In particular, since the time-series average of �i is empirically positive for all stocks that make up
the S&P100 index over our 8 year sample, any evidence of a negative index variance risk premium
and of nonnegative individual variance risk premia implies a negative correlation risk premium.
9This de�nition represents the total variance risk premium, i.e. including compensation for market risk if varianceshocks are correlated with market risk (the �leverage e¤ect�). In the empirical analysis, we correct for this in orderto obtain the risk premium for �pure�variance risk.10The simplifying assumption of constant index weights is innocuous. Simulations show that allowing for stochastic
index weights has a negligible impact on the empirical results with N = 100.
6
Subsequently, we test directly for a correlation risk premium by analyzing a correlation trading
strategy and we investigate empirically whether a common correlation risk factor and a common
individual variance risk factor can account for cross-sectional variation in option returns.
Before turning to the data description and the empirical results, we present the model-free
methodology used to estimate variance risk premia.
1.2 Model-Free Implied Variances and Variance Risk Premia
Consider the risk-neutral expected integrated variance of the return on asset a 2 fI; 1; :::; i; :::; Ng
over a discrete interval of length � starting at time t:
�2a (t) = EQt
�Z t+�
t�2a (s) ds
�(4)
We follow the methodology of Britten-Jones and Neuberger (2000), Carr and Madan (1998) and
Dumas (1995), who build on the work of Breeden and Litzenberger (1978), to estimate the risk-
neutral expected integrated variance �2a (t) de�ned in (4) from index options for a = I and from
individual options for a = i. As derived in Britten-Jones and Neuberger, their procedure gives
the correct estimate of the option-implied (i.e. risk-neutral) integrated variance over the life of the
option contract when prices are continuous but volatility is stochastic, in contrast to the widely
used, but incorrect, Black-Scholes implied volatility. Furthermore, Jiang and Tian (2005) show that
the method also yields an accurate measure of the (total) risk-neutral expected integrated variance
in a jump-di¤usion setting. The measure is therefore considered �model-free�, and can be labeled
the model-free implied variance (MFIV ).
We denote the price of a � -maturity call option on asset a with strike price K at time t
by Ca (K; t). The main result of Britten-Jones and Neuberger is that the risk-neutral expected
integrated variance �2a (t) de�ned in (4) equals the model-free implied variance, which is de�ned as
�2MF;a (t) � 2Z 1
0
Ca (K; t)�max (S (t)�K; 0)K2
dK (5)
Jiang and Tian show that the integral over a continuum of strikes in (5) can be approximated
accurately by a sum over a �nite number of strikes. Finally, Bollerslev, Gibson and Zhou (2004),
Bondarenko (2004) and Carr and Wu (2004) establish that the di¤erence between the model-free
implied variance and the realized variance can be used to estimate the variance risk premium. In
7
particular, the null of a zero total variance risk premium implies a zero di¤erence between average
realized and average model-free implied variance.
Finally, it is noteworthy that MFIV equals the no-arbitrage variance swap rate. Equation (5)
can therefore be used to synthetically create variance swaps from options across strikes K. This
interpretation will prove useful in the subsequent tests in section 3.2.
2 Data Description
We use daily data from OptionMetrics for S&P100 index options and for individual options on all
the stocks included in the S&P100 index from January 1996 until December 2003.11
The S&P100 is a value-weighted index with quarterly rebalancing. During our sample period,
the new index shares for the quarter are �xed (unless the number of �oating shares changes during
the quarter by more than 5%) based on the market values at the closing prices of the third Friday of
the last month in the previous quarter. In addition, 47 changes in the list of constituent companies
took place in our sample. These also occur on the rebalance dates. At each rebalance date,
we construct index component weights using market values based on stock prices from CRSP.
We keep these weights �xed until the next rebalance date. This introduces a small discrepancy
between actual S&P100 daily weights and our �xed weights because the (actual) value-based weights
�uctuate daily due to price changes. As we have 100 companies in the index, any such discrepancy
due to changes in prices is small and can be neglected for our purposes (see also footnote 10).
From the OptionMetrics database, we select all put and call options on the index and on the
index components. We work with best bid and ask closing quotes rather than the interpolated
volatility surfaces constructed by OptionMetrics. In sections 3, 4 and 5 we use the midquotes for
these option data (average of bid and ask), and we assess the e¤ect of bid-ask spreads in section 6.
We discard options with zero open interest, with zero bid prices and with missing implied volatility
or delta (which occurs for options with non-standard settlement or for options with intrinsic value
above the current mid price). We focus on short-maturity options, which are known to trade most
liquidly and consider all options with remaining maturity between 14 and 60 days. When multiple
maturities are available within this interval, we select the maturity that generates the largest average
number of call and put options with matching strike prices (to enable us to construct straddles).
11 Interestingly, Standard and Poor�s mentions on its website that a requirement for companies to be included inthe S&P100 index is that they have listed options. This makes the S&P100 a natural index to consider for our study.
8
We also eliminate options of extreme moneyness (Black-Scholes delta below 0.15 for calls and above
-0.05 for puts) as outliers, which �lters out options with extremely high implied volatilities. From
section 3 onwards, when constructing straddle returns and a cross-section of option returns, we
eliminate calls and puts without a matching option of the other type for the straddle construction.
The options are American-style. However, for short-maturity options, the early exercise premium
is typically negligible. Using a binomial tree, we �nd indeed that this premium is between 0.3%
and 1.1% of the 1-month option price for puts (depending on volatility and moneyness), and thus
has a small impact on option returns. For call options, the early exercise premium is zero with
a continuous dividend yield (which is an appropriate assumption for index options). Santa-Clara
and Saretto (2007) �nd that returns on American and European index options are very similar.
Any early exercise premium in individual call options (due to discrete dividends) will actually
bias against �nding evidence for a correlation risk premium, since our correlation strategy buys
individual options (see section 4) and because MFIV would be too high in this case for individual
options.
To construct the model-free implied variances, we require observations over time and across
strikes of prices of S&P100 index options and individual stock options. Across the strike dimension,
we use out-of-the-money (OTM) options, namely calls with Black-Scholes delta below 0:5 and puts
with delta above �0:5. We implement the model-free implied variance measure of section 1.2
following the procedure in Jiang and Tian (2005), suitably adjusted for put options when needed.12
We calculate model-free implied variance on each day for each underlying that has at least 3
available options outstanding, with the restriction that at least one put and call are included.
We use daily returns from CRSP for individual stocks and from OptionMetrics for the S&P100
to estimate the realized variance. For each day, we calculate the realized variance over the same
period as the one over which implied variance is calculated for that day, i.e. ranging from 14 to
60 days, requiring that no more than 10 returns are missing from the sample. Since the window
spans on average 1 month, this means that we require on average at least 12 observations out of
22 trading days.
We annualize both model-free and realized variance using 252 trading days in a calendar year.
12One subtlety regarding the index weights emerges. If the expiration of the index option occurs after the nextrebalance date, the index variance will re�ect both the �old�and the �new�index weights. We calculate the projectedweights of the index components using current market values. Moreover, in the period between rebalance dates theremay be announcements of deletions from and additions to the index, which take e¤ect at the next rebalance. Weincorporate this migration in the projected weights. We weight the old �xed weights and the new projected weightsusing the relative time to maturity of the index option before the rebalance date and after the rebalance date.
9
We use the T-Bill rate of appropriate maturity (interpolated when necessary) from OptionMetrics
as the riskfree rate.
3 Evidence on Variance and Correlation Risk Premia
Based on the general framework of section 1, we test for the presence of variance risk premia in
index options, in individual options on all constituent stocks and in the cross-section of individual
variance swap returns. These tests are conducted using the model-free implied variance of section
1.2. In light of the general decomposition of index variance risk in equation (3), this analysis
provides indirect evidence on the importance of priced correlation risk. Section 4 presents direct
evidence of a risk premium on correlation risk by developing and implementing a simple option-
based trading strategy that exploits priced correlation risk. Finally, in section 5 we test whether
correlation and individual variance risk is priced in a well-chosen cross-section of assets (individual
and index options).
3.1 Implied versus Realized Variances
The recent empirical literature on equity options primarily studies index options. Individual options
have attracted much less attention. The majority of the recent work on individual options focuses
on Black-Scholes implied volatility functions (Bakshi and Kapadia (2003b), Bakshi, Kapadia and
Madan (2003), Bollen and Whaley (2004), Branger and Schlag (2004), Dennis and Mayhew (2002),
Dennis, Mayhew and Stivers (2005) and Garleanu, Pedersen and Poteshman (2005)). A common
�nding is that implied volatility functions are �atter for individual options than for index options.
While implied volatility functions provide very interesting information, they do not permit a formal
test of the presence of variance risk premia. This section presents such a formal test, based on the
model-free methodology described in section 1.2. Moreover, our OptionMetrics sample is more
recent and spans 8 years (January 1996 up until December 2003) and includes options on all stocks
that were included in the S&P100 over that period. Carr and Wu (2004) also use OptionMetrics
and a related methodology, but focus on a subsample of 35 individual options.
We start with the index variance. Figure 1 plots the time-series of (the square root of) the
implied index variance and of (the square root of) the realized historical variance. The well-
established �nding that option-implied index variance is higher than realized index variance also
holds for our recent sample. While all calculations are done for variances, we take square roots
10
of the computed variances for interpretation purposes. Table 1 reports an average (annualized)
realized index volatility of 20.80%, while the MFIV average is 24.69%. The null hypothesis that
implied and realized index variance are on average equal is very strongly rejected, based on a t-test
with Newey-West (1987) autocorrelation consistent standard errors for 22 lags (t-statistic of 6.81).
Turning to the equally-weighted average of the individual variances in Figure 2, there is, quite
remarkably, less systematic di¤erence between the two volatility proxies. On average, the square
root of realized variance (41.44%) actually exceeds the square root of implied variance (38.97%).
The null hypothesis that, on average across all stocks in the index, the implied and realized variance
are equal is rejected (t-statistic of 3.2), which suggests a signi�cantly positive variance risk premium
in individual options. However, when conducting the test in ratio form the null that RVMFIV = 1
is only marginally rejected at the 5% con�dence level. More importantly, carrying out the test for
all stocks individually, the null of a zero variance risk premium (RV = MFIV ) is not rejected at
the 5% con�dence level for 98 stocks out of the 127 stocks that are included in the sample for this
analysis. Of the remaining 29 stocks, only 7 exhibit a signi�cant positive di¤erence between implied
and realized variance. We therefore �nd no evidence for the presence of a negative variance risk
premium in individual stock options. If anything, there is weak evidence of a positive risk premium
for variance risk in individual options.
This is quite surprising, given the well-known empirical regularity for index options. Bakshi
and Kapadia (2003b) found a di¤erence of 1% to 1.5% (depending on the treatment of dividends)
between the average implied and the average historical volatility in their 1991-1995 sample of 25
individual stock options. They also stressed that the di¤erence is smaller than for index options.
The discrepancy between our results and theirs may not only re�ect the di¤erence in sample, but
also the di¤erence in methodology to calculate the option-implied variance. Bollen and Whaley
(2004) also report that the average deviation between (Black-Scholes) implied volatility and realized
volatility is approximately zero for the 20 individual stocks in their sample. Finally, Carr and Wu
(2004) use a similar methodology to ours and also report much smaller average variance risk premia
for individual stocks than for S&P indices. The mean variance risk premia are insigni�cant for 32
out of the 35 individual stocks they study.13
These �ndings provide indirect evidence of a negative correlation risk premium. As can be seen
13Carr and Wu (2004) also report that estimates of mean log variance risk premia are signi�cantly negative for 21out of 35 individual stocks. However, mean log variance risk premia are expected to be negative (because of Jensen�sinequality), even under the null of a zero variance risk premium, and thus lead to a biased test.
11
from equation (3), when individual variance risk is not priced (or carries a positive risk premium),
index variance risk only carries a negative risk premium to the extent that the price of correlation
risk is negative. Our results strongly suggest that this is the case.
3.2 The Cross-Section of Individual Variance Swap Returns
We found that the total individual variance risk premium in individual options is not signi�cantly
negative for almost all index components. To gain further insight into this important result, we now
study cross-sectional pricing of individual variance risk in stock options. This analysis complements
the approach above and investigates explicitly whether exposure of individual variances to market
risk or to a common variance factor is priced in individual options.
We consider the cross-section of returns on synthetic individual variance swaps, which are
natural assets to consider for a study of priced variance risk. Each variance swap can be synthetically
created from a cross-section of options on the underlying stock.
Denoting the realized return variance of asset a from t to t + � by RVa(t) �R t+�t �2a (s) ds
and using the model-free implied variance MFIVa(t) � �2MF;a (t) de�ned in section 1.2, the return
on a variance swap from t to t + � is ra(t) � RVa(t)MFIVa(t)
� 1 (Bondarenko (2004) and Carr and
Wu (2004)). The variance swap return is driven by unexpected variance shocks and on average
re�ects the variance risk premium. We construct the time-series of 1-month variance swap returns
for all stocks with at least 18 monthly observations during the sample period, approximating
RVa(t) �R t+�t �2a (s) ds using daily return observations. To enhance the practical feasibility of the
variance swap as a (synthetically) tradable instrument, we focus on monthly observations, selecting
options that have 1 month to maturity, and construct a time-series of non-overlapping returns.
As factors to explain the cross-section we consider the excess return on the market (prox-
ied by S&P100) and a common individual variance component. The latter is calculated as the
cross-sectional weighted average (using index weights) of the returns on individual variance swapsPNi=1wiri(t). We follow the standard two-step procedure, estimating �rst the factor loadings and
then regressing average returns on factor loadings to estimate factor risk premia.
We �nd that exposure to market risk does not explain the cross-section of individual variance
swap returns, as almost all of the �rst-step betas are statistically insigni�cant. The common
individual variance risk factorPNi=1wiri(t) is not priced either in individual options. The individual
variance risk premium is found to be insigni�cant. The point estimate is actually positive (0.077
12
with a t-statistic of 1.74), which is in line with the �nding above that realized individual variance
exceeds option-implied variance. Including both factors simultaneously leads to the same �nding.
In sum, covariance of individual variance shocks with either market risk or with a systematic
individual variance risk factor does not command a risk premium in individual options, consistent
with the results in the previous subsection. Combined with the �nding of priced market variance
risk in index options, this provides more indirect evidence of priced correlation risk.
4 Risk and Return of a Correlation Trading Strategy
Motivated by the results of a signi�cantly negative risk premium for index variance risk, but not for
individual variance risk, we now explicitly examine whether exposure to correlation risk is priced.
We do this by constructing a trading strategy that only loads on correlation risk. Examining
the risk-return properties of this trading strategy provides direct evidence on the extent to which
correlation risk carries a risk premium that cannot be explained by exposure to standard risk
factors.
4.1 Trading Correlation Risk
We derive a correlation trading strategy based on the general framework of section 1 and make
some additional simplifying assumptions allowing us to implement the trading strategy empirically.
First, we assume that a single state variable � (t) drives all pairwise correlations in (1):
�ij (t) = �ij� (t) : (6)
This is a natural assumption, given our interest in priced correlation risk. If the risk of correlation
changes carries a risk premium, we expect this to be compensation for the risk of market-wide
correlation changes. The speci�c process for � can be left unspeci�ed, except that d� � E [d�] =
�(�)dB�, where the Brownian motion dB� may be correlated with other risk factors, and that
suitable conditions on �(�) and the drift of � such that the resulting variance-covariance matrix
be positive-de�nite are assumed to be satis�ed. As a second simpli�cation, we assume an equally-
weighted stock market index, i.e. I = 1N
PNi=1 Si, when initiating the trading strategy.
13
Each stock�s instantaneous variance �2i (t) follows an Ito process, with di¤usion term & i (�i) dB�i :
d�2i � E�d�2i
�= & i (�i) dB�i (7)
Denoting the price of an at-the-money (ATM) straddle on asset a 2 fI; 1; :::; i; :::; Ng by Oa (i.e.,
the sum of the put price and call price), we focus on unexpected straddle returns:
dOiOi
� E�dO
Oi
�=SiOi
@Oi@Si
�idBi +1
Oi
@Oi
@�2i& i (�i) dB�i (8)
anddOIOI
� E�dOIOI
�=
NPi=1
SiOI
@OI@Si
�idBi +NPi=1
1
OI
@OI
@�2i& i (�i) dB�i +
1
OI
@OI@�
�(�)dB�: (9)
The correlation trading strategy aims to short the index straddle in order to exploit the correlation
risk premium, while hedging the exposure to stock return shocks dBi and to individual volatility
shocks dB�i .14 We �rst hedge the individual variance risk. When shorting index straddles worth
100% of initial wealth, the portfolio weight yi in individual straddle i is then obtained by solving
� 1
OI
@OI
@�2i& i (�i) + yi
1
Oi
@Oi
@�2i& i (�i) = 0 (10)
These weights are the same across stocks if we assume that the parameters of the variance processes
are common across stocks.15
Delta-hedging for each return shock dBi, the portfolio weight zi for each stock satis�es
� SiOI
@OI@Si
�i + yiSiOi
@Oi@Si
�i + zi�i = 0 (11)
which will again be the same across all stocks so that delta-hedging can be implemented with the
stock market index.
The resulting strategy thus shorts index straddles worth all initial wealth and invests a fraction
yi of initial wealth in each individual straddle and zi of initial wealth in each individual stock, the
remainder being invested in the riskfree asset so that the portfolio weights sum to 100%. This
14Note that while dB� does not enter equation (8) directly, dB� may still impact individual straddle returns throughcorrelation between dB� and dBi or dB�i . However, as we hedge exposure to both dBi and dB�i , this has no e¤ecton the analysis.15Our correlation strategy could be re�ned by incorporating the apparent mispricing of individual options as
documented in Goyal and Saretto (2007), by overweighting and underweighting speci�c individual straddles.
14
strategy only has (negative) exposure to correlation shocks and thus collects the correlation risk
premium if correlation risk is priced. The simplest way to implement the strategy is to use Black-
Scholes deltas and vegas for @Oi /@Si and @Oi�@�2i , evaluated at the implied volatility of the
options in the straddle.
The trading strategy resembles a so-called �dispersion trade�, which sells index options and
buys individual options. However, our strategy also takes positions in equity to hedge stock market
risk. Furthermore, the portfolio weights yi and zi vary over time with �(t), since the delta and vega
of the index straddle depend on �. We calculate these numerically for di¤erent levels of �, using
1-month average lagged historical correlations as an estimate for � at each point in time. For each
pair of stocks, we calculate the historical correlation at time t over a 1-month window, imposing the
same requirements as for the calculation of realized variances. The historical pairwise correlations
can then be aggregated into a cross-sectional weighted average across all pairs of stocks, using the
appropriate weights from the S&P100 index.
4.2 Empirical Results
Implementing the correlation trading strategy empirically, we �nd that its portfolio weight in
individual straddles according to equation (10), aggregated across all index components, equals on
average 101.12% of initial wealth. By construction the strategy also sells 100% of initial wealth
worth of index straddles, while the fraction invested in the stock index (from equation (11)) is
-32.54% of initial wealth. The remaining 131.42% is invested in the riskless asset. Shorting 100% of
index straddles and buying 101.12% of individual straddles corresponds on average to buying 0.58
individual straddles (aggregated across all stocks) per shorted index straddle, when normalizing
the initial value of all underlying assets (the index as well as its components) to 1.
Table 2 reports the �rst 4 moments for the trading strategy return in excess of the riskfree
rate, estimated from monthly non-overlapping returns of holding options to their maturity date.
The excess return is 10.37% per month and the annualized Sharpe ratio is 0.73. Compared to
the annualized Sharpe ratio for the S&P100 index itself (0.41 over the sample period), the Sharpe
ratio on the trading strategy is 77% higher. Although the trading strategy is theoretically speaking
hedged against return and volatility shocks and only exposed to correlation shocks, the hedge is
expected to be imperfect, since the trading strategy is model-based and the parameters are not
chosen to minimize in-sample hedging errors. Moreover, the theoretical hedge requires (costly)
15
continuous rebalancing. It is therefore important to analyze the excess returns in more detail,
as Sharpe ratios may not fully reveal the risk of a strategy based on derivatives (Ingersoll et al.
(2007)). We do this in several di¤erent ways.
First, we estimate the CAPM beta and alpha of the strategy. The CAPM beta is 0.028 (t-
statistic of 0.02) and the CAPM alpha is 10.59% per month (t-stat of 1.96). The beta estimate
shows that the trading strategy successfully hedges market risk, even though rebalancing is done
only at a monthly frequency. The zero beta is especially noteworthy in light of the extreme betas
of alternative derivatives-based trading strategies. For example, an equally-weighted portfolio of
1-month index put options with Black-Scholes deltas ranging from -0.8 to -0.2 has a CAPM beta
of -15.83. The CAPM alpha generated by the correlation trading strategy is highly signi�cant
economically and indicates that the high return on the trading strategy cannot be justi�ed by
exposure to stock market risk. The t-statistic of 1.96 re�ects the relatively short sample.
In the Fama-French model (Fama and French (1993)) and the 4-factor model that adds mo-
mentum (Jegadeesh and Titman (1993)), the loadings on any of the factors are insigni�cant and
the strategy has similar alphas as for the CAPM (10.59% and 10.63% with t-statistics of 1.93 and
1.82, respectively). Finally, we also control for systematic liquidity risk. Pastor and Stambaugh
(2003) construct equity portfolios on the basis of exposure to a systematic liquidity risk measure.
We use the return di¤erence between high and low liquidity-risk portfolios as a liquidity risk factor.
These data are available at a monthly frequency covering calendar months, while our analysis uses
monthly returns between option expiration dates. Maximizing the overlap between these stag-
gered time-series, we �nd that the exposure of the trading strategy to liquidity risk is positive,
but insigni�cant. Correcting the trading strategy return for market risk, the Fama-French factors,
momentum and the liquidity risk factor gives an alpha of 10.83% per month with a t-statistic of
1.91.
Secondly, to put the higher moments into perspective, we compare with the summary statistics
for two strategies that have been analyzed extensively in the recent literature on index options,
namely writing 1-month index straddles and writing 1-month index puts. The index straddle allows
the investor to exploit the market variance risk premium. Recent work has argued that this risk
premium is very large and that investors can bene�t by selling index variance (e.g. Coval and
Shumway (2001) and Bondarenko (2004)). The attractiveness of selling index puts has also been
widely documented (e.g. Bondarenko (2003b)). We �nd that the Sharpe ratio of our correlation
16
trading strategy exceeds the ones for both alternative strategies by roughly 15%. More importantly,
selling correlation risk involves substantially less negative skewness and kurtosis than selling market
variance. The di¤erence with the short index put position is even more pronounced. While the
correlation strategy has skewness and kurtosis of -0.28 and 3.15, the third and fourth moment for
the short put strategy are -3.26 and 16.67, respectively. Finally, it can be noted that the correlation
trading strategy return has less kurtosis in our sample than the underlying index return itself.
The risk-adjusted excess returns for the alternative strategies are also interesting. While the
CAPM alpha for the index straddle is similar in magnitude to the alpha for the correlation trading
strategy and somewhat higher for the index put, the estimates are noisier and the alphas are
insigni�cant with a t-statistic of 1.47 for the straddle and 1.79 for the index put. This �nding
is robust to correcting for additional risk factors (size, value, momentum and/or liquidity risk).
Intuitively, it is straightforward to understand the di¤erence between the results for the index
straddle and for the correlation strategy. By adding individual straddles to the index straddle the
correlation strategy hedges out the individual variance risk. Since individual variance risk has a
negligible risk premium, both strategies have similar alphas, but the correlation strategy has lower
risk leading to a higher t-statistic for its alpha. Further, by shorting index straddles and buying
individual straddles part of the gamma of the option position is neutralized, which explains why
the correlation strategy has lower skewness and kurtosis than the short index straddle.
The analysis of alphas and Sharpe ratios above neglects the considerable degree of skewness and
kurtosis often exhibited by option strategies. We therefore consider the portfolio choice problem of
a CRRA investor, because CRRA preferences penalize for negative skewness and high kurtosis (in
contrast to mean-variance preferences). Speci�cally, we estimate the optimal portfolio weights in
the derivatives-based trading strategies for a CRRA investor with a 1-month horizon, who can also
invest in the underlying equity index and in the riskfree asset. Based on these portfolio weights, we
also report the certainty equivalent wealth that this investor, when already investing in the market
index and the riskless asset, is willing to pay in order to gain access to the correlation trading
strategy. Table 3 reports the results, starting with the certainty equivalents for the two alternative
strategies, namely the short index straddle and the short index put. The alternative strategies
generate certainty equivalent wealth gains of 1.29% and 0.77% per month respectively for an investor
with = 1, illustrating the attractiveness of these strategies. For this coe¢ cient of risk aversion, the
certainty equivalent for the correlation trading strategy is 36% higher than for the index straddle
17
and 129% than for the index put. For any level of risk aversion considered in Table 3, we �nd
certainty equivalents for the correlation strategy that exceed the certainty equivalents for the short
index straddle by at least 26% and for the short index put by at least 49%. While the derivatives
weights are statistically insigni�cant for both alternative strategies (t-statistics between 1.28 and
1.68), the portfolio weights for the correlation strategy are substantially larger and (marginally)
statistically signi�cant, with t-statistics between 1.88 and 1.99 (depending on risk aversion). For
example, an investor with = 2 invests 18.85% of his wealth in the correlation strategy. Given that
the S&P 100 index options are de�ned on $100 times the index value, an investor with $100,000 of
�nancial wealth would sell 5.89 index straddles to implement the correlation strategy (on average
over the 1996-2003 sample period).
The �nal column ( = 1:8) of Table 3 is of particular interest. It considers the investor who op-
timally holds the market (equity weight of approximately 100%) when derivatives are not available.
This investor�s optimal portfolio weight in the correlation strategy and the corresponding gain in
certainty equivalent wealth provide quantitative measures of the extent to which the observed risk-
return tradeo¤ of the strategy could arise in an equilibrium with a CRRA representative investor
(if the optimal weight is zero) or instead whether the correlation risk premium represents a �good
deal� (Santa-Clara and Saretto (2007)). The investor stands to gain 1.05% of initial wealth per
month from the correlation strategy (31% and 85% higher than for the index straddle and put,
respectively), based on an optimal correlation-strategy weight of 21% of initial wealth (t-statistic
of 1.93) and a positive (but insigni�cant) equity weight. It is clear that the risk-return tradeo¤
of the correlation trading strategy is a �good deal�for a = 1:8 investor and could not arise in a
simple no-trade equilibrium with this CRRA investor as representative agent.
Overall, the results for the correlation trading strategy indicate that the compensation for
bearing correlation risk is substantial. The risk-return tradeo¤ is considerably more generous than
what can be obtained with short positions in index puts or in market variance.
5 The Cross-Section of Individual and Index Option Returns
We now examine whether a correlation risk factor can account for cross-sectional variation in
index and individual option returns. A cross-section of index and individual options is an ideal
testing ground for this hypothesis, since returns on index options are driven by index variance
shocks and thus by correlation shocks, while individual option returns are likely to be much less
18
dependent on correlation shocks. We use the return on the trading strategy developed above as a
correlation risk factor to explain the cross-section of expected index and individual option returns.
Our test procedure is identical to standard procedures used in asset pricing to test for the presence
of priced risk factors, and avoids the need for speci�c parametric modeling assumptions that are
otherwise needed when testing option pricing models. Rather than developing a speci�c model of
priced correlation risk, we test a generic prediction shared by all option pricing models with priced
correlation risk, namely that di¤erences in exposure to correlation risk justify di¤erences in expected
returns. Simultaneously, we also test whether individual variance risk is priced, complementing
earlier analyses in the paper.
Our cross-section contains 24 short-maturity options and is constructed as follows. We include
both calls and puts and consider 3 di¤erent moneyness ranges, with deltas ranging from -0.8 to -0.2
for puts and from 0.2 to 0.8 for calls.16 This results in 6 index options and 6 (portfolios of) individual
options. To obtain a larger cross-section, we further divide each individual option portfolio into
three volatility categories by sorting options on the implied volatility of their underlying asset,
resulting in 18 portfolios of stock options. Sorting individual options on volatility to construct a
cross-section of option returns is natural since the volatility risk premium is in many option-pricing
models a function of the volatility level. We calculate non-overlapping monthly option returns as
holding-period returns, i.e. the return at time t+ � on an option written at t is given by the option
payo¤ at maturity (t + �) divided by the option price at t. Within each delta-volatility portfolio,
we average the individual option returns cross-sectionally using the index weights for each day.
We use the standard two-step procedure for cross-sectional asset pricing, estimating �rst the
factor loadings for all assets and then regressing average returns cross-sectionally on these loadings
to obtain factor risk premia. The standard errors for the cross-sectional regression are calculated
with the methodology of Shanken (1992) to correct for the estimation error in the �rst-step betas.
We start by testing the CAPM, with the excess return on the market (proxied by the S&P100) as
factor. The S&P100 is arguably a narrow de�nition of the market, but natural for our setting as it
is the underlying asset for the index options we study.
16We categorize options according to Black-Scholes deltas rather than strike-to-spot ratios to ensure that theindividual and index options are comparable in terms of economic moneyness. The strike-to-spot ratio of an indexoption cannot easily be compared with the one of individual options, as the underlying assets obviously have verydi¤erent volatilities for example.
19
5.1 CAPM Results
For index options, the CAPM betas range from -17 to 22 and are all highly signi�cant. The betas
for individual options are somewhat smaller (ranging from -16 to 15), but also very signi�cant.
Consistent with existing empirical work, a one-factor pricing model like the CAPM generates very
large mispricing for index options, with time-series alphas of up to -31% per month and cross-
sectional alphas of up to -30% per month. All alphas are negative for index options and average
-17% per month. While the alphas are all economically signi�cant, options returns are quite noisy
resulting in only 2 signi�cant time-series alphas (out of 6) and 3 signi�cant cross-sectional alphas.
For individual options, the results are quite di¤erent. No time-series or cross-sectional alpha
is signi�cant, even though the formation of portfolios (with averaging of individual option returns
across more than 30 stocks) would be expected to lead to more precise estimates for individual
options than for index options. Economically speaking, the contrast between index and individual
options is clear: while the average index-option alpha is -17% per month, the average individual-
option alpha is much smaller (-3.55%).
In summary, unlike for index options, the CAPM does quite well for individual options and we
�nd no statistical evidence against it. This is consistent with our earlier �ndings of an insigni�cant
di¤erence between average realized and average risk-neutral variance for 98 out of the 127 stocks
(section 3.1) and of an insigni�cant variance risk premium in the cross-section of individual variance
swap returns (section 3.2).17
5.2 Results for Correlation and Individual Variance Risk Factors
We now add the correlation and individual variance risk factors to the CAPM and estimate a
three-factor model. The return on the correlation trading strategy is taken as the correlation risk
factor. For the individual variance risk factor, we use the return on the index-weighted portfolio of
individual straddles.
In the �rst-step time-series regressions of option returns, we �nd very similar market betas as
for the CAPM. All index option returns exhibit large and signi�cantly negative loadings on the
correlation risk factor. The correlation betas range from -0.36 (ITM index call) to -1.61 (OTM
index call), with an average of -0.96. All index options have correlation betas with t-statistics
17Bollen and Whaley (2004) present simulated returns of a delta-hedged trading strategy that shorts options (onthe S&P500 and on 20 individual stocks). Unlike for index options, they �nd small abnormal returns for stockoptions, in line with our results for a larger sample (all stocks in the index) and using a di¤erent methodology.
20
above 5.35 in absolute value. Individual options have smaller correlation loadings, with an average
of -0.24. Only 6 out of 18 individual-option portfolio returns have signi�cant correlation betas. In
contrast, index and individual options exhibit similar sensitivities to individual variance risk, with
loadings between 0.42 and 1.89 (average of 1.07) for index options and between 0.07 and 1.63 for
individual options (average of 0.73). All but three are statistically signi�cant.
For index options, the three-factor model generates time-series alphas that are all statistically
insigni�cant and that have a mean of -1.78% and a mean absolute value of 4.43%. The CAPM
generated negative alphas for all index options with an average of -17.15%. Accounting for exposure
to correlation risk and individual variance risk leads to a notable reduction in mispricing and index
options no longer seem signi�cantly �overpriced�. The improvement for individual options is small,
as the CAPM already performs quite well (the mean absolute alpha goes from 5.97% to 5.03%).
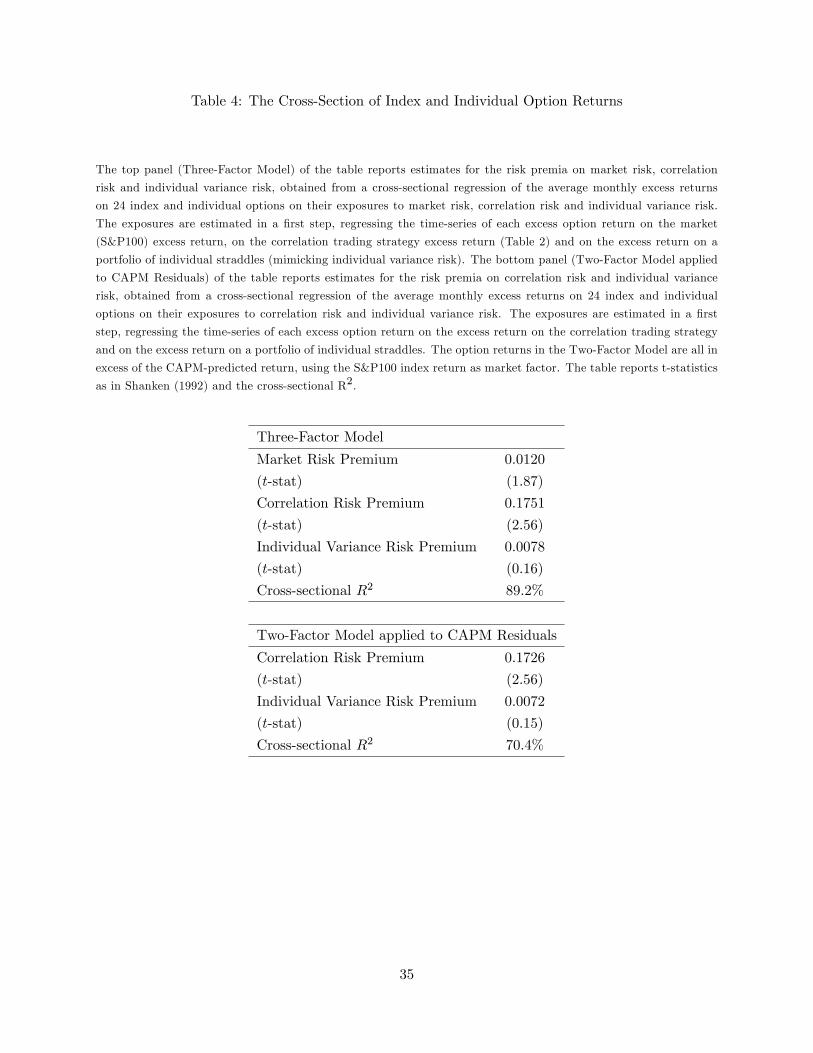
Table 4 presents the results for the cross-sectional regression of average index and individual
option returns on their factor loadings. The risk premium for the correlation factor is estimated to
be 17.5% per month (t-statistic of 2.56). While this is higher than the average return on the trading
strategy (10.37%), the di¤erence between the two estimates of the correlation risk premium is not
statistically signi�cant. In contrast, the price of individual variance risk is small and statistically
insigni�cant. Note that the positive risk premium for the correlation factor corresponds to a
negative price of correlation risk, since the trading strategy sells correlation and pays o¤ well when
correlations are low. Given that the correlation factor betas for index options are always negative,
the positive estimate in Table 4 leads to negative excess returns for index options relative to the
CAPM, i.e. consistent with the de�nition in section 1, the price of correlation risk is negative in
the sense that assets with payo¤s that covary positively with correlation (e.g. index options) earn
negative excess returns.
As a robustness check, we now apply the correlation and individual variance risk factors to
CAPM residuals, rather than regressing option returns simultaneously on the market, correlation
and individual variance risk factors. Given the estimated factor loadings, we obtain the correla-
tion and individual variance risk premia from the cross-section of average CAPM excess returns.
This alternative analysis of priced correlation risk is conservative in the sense that any correlation
between the market return and the correlation risk factor is now automatically attributed to the
market return (and its associated risk premium). We �nd identical results for the factor loadings
on correlation and individual variance risk. The point estimates and t-statistics for the factor risk
21
premia in Table 4 are also very similar to the results for the three-factor model. The high cross-
sectional R2 of 70.4% is remarkable, given that the cross-section concerns CAPM residuals and
that the model imposes linearity.
In conclusion, we �nd that individual variance risk is not priced in the cross-section of index
and individual options, consistent with the results in 3.1 and 3.2. We also obtain strong evidence
that exposure to correlation risk accounts for a substantial part of the cross-sectional variation in
average excess returns that cannot be explained by standard market risk.
6 The Impact of Transaction Costs and Margins
Our evidence points to a correlation risk premium that is both economically and statistically
signi�cant. Understanding the source and size of this risk premium is important. While unreported
results indicate that market-wide correlations predict market variance, so that these correlations18
may be a priced state variable in Merton�s ICAPM (in particular the extension in Chen (2003)),
a general equilibrium model with priced correlation risk is needed to shed more light on the size
of the correlation risk premium. Since developing such a general equilibrium model is beyond the
scope of this paper, we instead analyze the impact of realistic trading frictions on the feasibility and
pro�tability of the correlation trading strategy to explore whether limits to arbitrage may prevent
investors from exploiting this correlation risk premium fully. In a recent paper, Santa-Clara and
Saretto (2007) study the impact of transaction costs and margin requirements on the execution
and pro�tability of index-option trading strategies and �nd that limits to arbitrage in the form of
realistic trading frictions severely impact the risk-return tradeo¤ of these strategies.
It is interesting to apply their analysis to our setting for the following reasons. First, we found
in Section 4 that our correlation trading strategy outperforms two standard trading strategies
based on index options when ignoring trading frictions. Second, the quantitative impact of trading
frictions may be di¤erent, because our strategy involves not only index options, but also individual
options. For comparison reasons, we also report the impact of frictions on the two alternative
index-option trading strategies we consider, since the sample period as well as the type of index
options (S&P500 versus S&P100) are di¤erent from the analysis in Santa-Clara and Saretto (2007).
We �rst account for transaction costs in the form of bid-ask spreads by using closing bid
18An interesting related question is why individual variance risk is not priced, which is also related to the pricingof idiosyncratic risk, analyzed by Ang et al. (2006) in the cross-section of stock returns and in the time-series sensein Goyal and Santa-Clara (2003).
22
and ask quotes rather than mid quotes. As the correlation trading strategy sells index options and
buys individual options, we calculate bid-to-maturity returns for index options and ask-to-maturity
returns for individual options. Bid-ask spreads lower the excess return on the trading strategy by
roughly 50%, namely from 10.4% (raw monthly excess return) and 10.6% (CAPM alpha) to 5.3%
and 5.5%, respectively. The CAPM alpha is no longer statistically signi�cant, with a t-statistic of
0.77. The annualized Sharpe ratio is also substantially lower when accounting for bid-ask spreads
and drops from 0.73 in Table 2 to 0.41, which is very similar to the Sharpe ratio of the equity index
in the absence of trading frictions. The impact of transaction costs on the alternative index-option
trading strategies is less pronounced. For example, the raw excess return on the index straddle
shrinks by only 2%, consistent with the �ndings of Santa-Clara and Saretto (2007) (taking into
account that we hold options to maturity, thus avoiding roundtrip transaction costs on options).
After transaction costs, the Sharpe ratios of the index straddle and put now exceed the one for the
correlation strategy (0.52 and 0.58 versus 0.41). The impact of transaction costs on our strategy
is larger than for the two alternative index-option strategies because of the larger bid-ask spreads
for individual options.
Table 5 reports the optimal portfolio allocation to the correlation trading strategy and to the
two alternative index-option trading strategies, as well as the associated certainty equivalent wealth
gains, for a CRRA investor facing transaction costs in the form of bid-ask spreads. As in Table 3,
the investor can also invest in the riskfree asset and in the underlying equity index. The transaction
costs for the riskless asset and the equity index are expected to be an order of magnitude smaller
than for the options strategies and are for simplicity assumed to be zero.
Not surprisingly, transaction costs have a major impact on the optimal allocation by CRRA
investors in the correlation strategy. The portfolio shares are roughly 57% of the optimal weights
without frictions (Table 3) and are now statistically insigni�cant. They remain, however, econom-
ically quite large for low . The point estimate for the certainty equivalent shows that the log
investor still gains 0.47% of wealth per month from having access to the trading strategy, but
there is no statistical evidence that the gain is signi�cantly di¤erent from zero. Furthermore, since
this certainty equivalent was 1.76% without frictions, it is clear that the economic impact of bid-
ask spreads is substantial. As discussed above, the impact of transaction costs on the alternative
index-option strategies is smaller. The optimal portfolio weights are only 25% smaller and the
certainty equivalents are reduced by roughly 40% for index straddles and by approximately 60%
23
for the index put portfolio. The certainty equivalent for the index straddle is now larger than for
the correlation trade. However, for the index straddle and put strategies the associated portfolio
weights are statistically insigni�cant (as before).
Another potentially important trading friction for options concerns margin requirements, as
shown by Santa-Clara and Saretto (2007) for strategies based on index options. Our trading
strategy shorts index options as well, but is simultaneously long individual options and also has
a large component invested in the riskless asset, justifying an additional analysis of the e¤ect of
margins on the strategy�s feasibility. We �rst calculate the required initial margin for the strategy
based on its short position in index options and using the (stringent) CBOE margin rules for options
described in Santa-Clara and Saretto (2007, p. 12).19 The initial margin can then be compared
to the total riskfree investment held by the investor to see whether the initiation of the strategy is
feasible. We also calculate for each 1-month period in our sample the largest margin requirement
that occurs over the life of the trading strategy, using the description of margin updates in Santa-
Clara and Saretto (2007). This gives the maximum margin over the sample period, which can again
be compared to the holdings of the riskfree asset to check whether the position can be maintained.
Finally, we calculate the (total) portfolio weight allocated by the CRRA investor to the riskless
asset, obtained as the sum of the direct holdings of the riskfree asset and of the indirect holdings
through the correlation trading strategy (as reported in Section 4.2, the correlation strategy holds
131.42% in the riskless asset in case of a 100% portfolio weight for the strategy). We conduct the
analysis with and without transaction costs, in order to isolate the e¤ect of both types of trading
frictions.
The main �nding in Table 6 is that the optimal position in the correlation trading strategy
is feasible for highly risk-averse investors, but not for investors with � 2. Importantly, it is
precisely this relatively risk-tolerant investor who stands to gain most from the strategy and for
whom the optimal portfolio weight is economically signi�cant when ignoring margin requirements.
This conclusion obtains whether we incorporate transaction costs or not, indicating the relevance
of margin requirements. The trading strategy is feasible for the = 5 investor, precisely because
her optimal weight in the strategy is small.
In summary, the analysis of trading frictions reveals that the correlation risk premium cannot
be captured by investors who are subject to realistic transaction costs and margin requirements.
19We conservatively do not allow for netting out of short positions in index options against long positions inindividual options for margin purposes, as this would only be possible for market-maker accounts.
24
Limits to arbitrage could therefore explain the economic presence of a correlation risk premium
that may otherwise, i.e. when ignoring frictions, seem very large. While studying the equilibrium
price of correlation risk in a general equilibrium model is an interesting topic for future research,
the results in this section suggest that our �nding of a large correlation risk premium may also
be consistent with a hypothesis of index-option mispricing. According to this hypothesis, the
correlation risk premium need not (only) be the equilibrium compensation for correlation risk, but
may also re�ect ine¢ ciencies in the market for index options leading to �overpriced�index options,
which cannot be arbitraged away in the presence of realistic market frictions.
7 Conclusion
We show empirically that correlation risk is priced in the sense that assets that pay o¤ well when
market-wide correlations are higher than expected earn negative excess returns. This result is
consistent with increases in market-wide correlations leading to a deterioration of investment op-
portunities in the form of smaller diversi�cation bene�ts. The negative excess return on correlation-
sensitive assets can therefore be interpreted as an insurance premium.
We provide evidence of a large correlation risk premium in a number of di¤erent ways. First,
while index options re�ect a large negative variance risk premium, we �nd no signi�cant negative
premium on variance risk in individual options on all index components. Second, a trading strategy
that sells correlation risk by selling index options and buying individual options earns excess returns
of 10% per month and has a large Sharpe ratio. This strategy has more attractive risk-return
properties (especially higher moments) than other option-based strategies. Third, the return on
this correlation trading strategy explains 70% of the cross-sectional variation in index and individual
option returns that is not accounted for by market risk.
As a second contribution, we demonstrate that priced correlation risk constitutes the missing
link between unpriced individual variance risk and priced market variance risk, and enables us
to o¤er a risk-based explanation for the discrepancy between index and individual option returns.
Index options are expensive, unlike individual options, because they allow investors to hedge against
positive market-wide correlation shocks and the ensuing loss in diversi�cation bene�ts.
When introducing realistic market frictions in the form of transaction costs and margin re-
quirements, we �nd that the correlation trading strategy cannot be exploited by investors facing
these frictions. This provides a potential limits to arbitrage interpretation for our �nding of a
25
large correlation risk premium. Simultaneously, it should be noted that the market-makers who
are active in markets for both index and individual options can be expected to earn the correlation
risk premium, since end-users of options have been shown to be net long index options and net
short individual options (Garleanu, Pedersen and Poteshman (2005)) and since market-makers are
only margined on their net positions.
Correlation risk is relevant in many areas of �nancial economics. Subsequent to our work,
Buraschi, Porchia and Trojani (2006) study the e¤ect of correlation risk on dynamic portfolio choice
and Krishnan, Petkova and Ritchken (2006) show that correlation risk is priced in the cross-section
of stock returns. Another interesting application concerns the pricing of basket credit derivatives,
such as collateralized debt obligations.
26
References
[1] Ait-Sahalia, Y. and R. Kimmel, 2005, �Maximum Likelihood Estimation of Stochastic Volatil-
ity Models,�working paper, Princeton University.
[2] Andersen, T., L. Benzoni and J. Lund, 2002, �An Empirical Investigation of Continuous-Time
Models for Equity Returns,�Journal of Finance 57, 1239-1284.
[3] Ang, A., R. Hodrick, Y. Xing and X. Zhang, 2006, �The Cross-Section of Volatility and
Expected Returns,�Journal of Finance 61, 259-299.
[4] Bakshi, G. and N. Kapadia, 2003a, �Delta-Hedged Gains and the Negative Market Volatility
Risk Premium,�Review of Financial Studies 16, 527-566.
[5] Bakshi, G. and N. Kapadia, 2003b, �Volatility Risk Premiums Embedded in Individual Equity
Options: Some New Insights,�Journal of Derivatives, 45-54.
[6] Bakshi, G., N. Kapadia and D. Madan, 2003, �Stock Return Characteristics, Skew Laws, and
Di¤erential Pricing of Individual Equity Options,�Review of Financial Studies 16, 101-143.
[7] Bates, D., 2003, �Empirical Option Pricing: A Retrospection,�Journal of Econometrics 116,
387-404.
[8] Black, F., 1976, �Studies of Stock Price Volatility Changes,�Proceedings of the 1976 Meetings
of the American Statistical Association, Business and Economics Statistics Section, 177-181.
[9] Black, F. and M. Scholes, 1973, �The Pricing of Options and Corporate Liabilities,�Journal
of Political Economy 81, 637-654.
[10] Bollen, N. and R. Whaley, 2004, �Does Net Buying Pressure A¤ect the Shape of Implied
Volatility Functions?,�Journal of Finance 59, 711-754.
[11] Bollerslev, T., R. Engle and J. Woolridge, 1988, �A Capital Asset Pricing Model with Time-
Varying Covariances,�Journal of Political Economy 96, 116-131.
[12] Bollerslev, T., M. Gibson and H. Zhou, 2004, �Dynamic Estimation of Volatility Risk Premia
and Investor Risk Aversion from Option-Implied and Realized Volatilities,� working paper,
Duke University.
27
[13] Bondarenko, O., 2003a, �Statistical Arbitrage and Securities Prices,� Review of Financial
Studies 16, 875-919.
[14] Bondarenko, O., 2003b, �Why are Puts So Expensive?,�working paper, University of Illinois,
Chicago.
[15] Bondarenko, O., 2004, �Market Price of Variance Risk and Performance of Hedge Funds,�
working paper, University of Illinois, Chicago.
[16] Brandt, M. and F. Diebold, 2003, �A No-Arbitrage Approach to Range-Based Estimation of
Return Covariances and Correlations,�forthcoming in Journal of Business.
[17] Branger, N. and C. Schlag, 2004, �Why is the Index Smile So Steep?,�Review of Finance 8,
109-127.
[18] Breeden, D. and R. Litzenberger, 1978, �Prices of State Contingent Claims Implicit in Option
Prices,�Journal of Business 51, 621-652.
[19] Britten-Jones, M. and A. Neuberger, 2000, �Option Prices, Implied Price Processes, and Sto-
chastic Volatility,�Journal of Finance 55, 839-866.
[20] Broadie, M., M. Chernov and M. Johannes, 2005, �Model Speci�cation and Risk Premiums:
Evidence from Futures Options,�forthcoming in Journal of Finance.
[21] Buraschi, A. and J. Jackwerth, 2001, �The Price of a Smile: Hedging and Spanning in Option
Markets,�Review of Financial Studies 14, 495-527.
[22] Buraschi, A., P. Porchia and F. Trojani, 2006, �Correlation Hedging,�working paper, Imperial
College.
[23] Campa, J. and P. Chang, 1998, �The forecasting ability of correlations implied in foreign
exchange options,�Journal of International Money and Finance 17, 855-880.
[24] Carr, P. and D. Madan, 1998, �Towards a Theory of Volatility Trading,�in Jarrow, R. (ed.),
Volatility: New Estimation Techniques for Pricing Derivatives, RISK Publications, London.
[25] Carr, P. and L. Wu, 2004, �Variance Risk Premia,�working paper, Bloomberg L.P.
28
[26] Chen, J., 2003, �Intertemporal CAPM and the Cross-Section of Stock Returns,� working
paper, University of Southern California.
[27] Collin-Dufresne, P. and R. Goldstein, 2001, �Stochastic Correlation and the Relative Pricing
of Caps and Swaptions in a Generalized-A¢ ne Framework,�working paper, Carnegie Mellon
University.
[28] Coval, J. and T. Shumway, 2001, �Expected Option Returns,�Journal of Finance 56, 983-1009.
[29] De Jong, F., J. Driessen and A. Pelsser, 2004, �On the Information in the Interest Rate Term
Structure and Option Prices,�Review of Derivatives Research 7, 99-127.
[30] Dennis, P. and S. Mayhew, 2002, �Risk-Neutral Skewness: Evidence from Stock Options,�
Journal of Financial and Quantitative Analysis 37, 471-493.
[31] Dennis, P., S. Mayhew and C. Stivers, 2005, �Stock Returns, Implied Volatility Innovations,
and the Asymmetric Volatility Phenomenon,� forthcoming in the Journal of Financial and
Quantitative Analysis.
[32] Dumas, B., 1995, �The Meaning of the Implicit Volatility Function in Case of Stochastic
Volatility,�unpublished note, HEC.
[33] Engle, R. and K. Sheppard, 2005, �Evaluating the Speci�cation of Covariance Models for Large
Portfolios,�working paper, NYU.
[34] Eraker, B., M. Johannes and N. Polson, 2003, �The Impact of Jumps in Volatility and Re-
turns,�Journal of Finance 58, 1269-1300.
[35] Eraker, B., 2004, �Do Stock Prices and Volatility Jump? Reconciling Evidence from Spot and
Option Prices,�Journal of Finance 59, 1367-1403.
[36] Fama, E. and K. French, 1993, �Common Risk Factors in the Returns on Stocks and Bonds,�
Journal of Financial Economics 33, 3-56.
[37] Garleanu, N., L. Pedersen and A. Poteshman, 2005, �Demand-Based Option Pricing,�working
paper, Wharton School of Business.
[38] Goyal, A. and P. Santa-Clara, 2003, �Idiosyncratic Risk Matters!,� Journal of Finance 58,
975-1007.
29
[39] Goyal, A. and A. Saretto, 2007, �Option Returns and the Cross-Sectional Predictability of