27
[email protected] www.eforenergy.org ISSN nº WP 02/2013 The Price of Energy Efficiency in the Spanish Car Market Ibon Galarraga Ana Ramos Josu Lucas Xavier Labandeira 2172/8437

WP 02/2013
The Price of Energy Efficiencyin the Spanish Car Market
Ibon GalarragaAna RamosJosu LucasXavier Labandeira
2172/8437

1
The Price of Energy Efficiency in the Spanish Car Market
Ibon Galarraga a,b,d,*, Ana Ramos c,d, Josu Lucas a, Xavier Labandeira c,d
a Basque Centre for Climate Change, Alameda de Urquijo 4, 48008 Bilbao, Spain b University of the Basque Country (UPV-EHU), 48940 Leioa, Spain c Rede, Universidade de Vigo, Facultade de CC.EE., Campus As Lagoas s/n, 36310 Vigo, Spain d Economics for Energy, Doutor Cadaval 2, 3E, 36202 Vigo, Spain
Abstract
Due to climate change, energy dependence and other energy-related issues, most developed countries are attempting to reduce fossil-fuel use in the transport sector. Accordingly, there are several instruments that have been in place for many years, such as mandatory design standards, taxes on fuels, car purchase and ownership, and energy efficiency labels. Yet it is still not clear whether consumers value energy efficiency as a characteristic of vehicles. In this paper we use the European labelling system for light vehicles, which classifies automobiles according to their relative fuel consumption levels, as a novel, alternative indicator for energy efficiency. Moreover, we use a unique database that incorporates official commercial prices along with prices obtained through ‘mystery shopping’ at a selection of Spanish car retailers. We apply the hedonic price method to this database to estimate the price functions for vehicles and thereby obtain the marginal price of high-rated vehicles in terms of energy efficiency. Our results show that automobiles labelled A and B are sold at prices 2.1 to 9.0 percent higher than those of vehicles with similar characteristics but lower energy-efficiency labels.
Keywords: Spain, transport, energy, efficiency, hedonic methods
JEL classification: Q41, Q48, R41
* Corresponding author [email protected]
Ibon Galarraga acknowledges the support of the Fundación Ramón Areces under the project PAEE (Políticas de apoyo a la eficiencia energética: impuestos vs subvenciones) and the REPSOL Foundation for its support through the Low Carbon Programme (www.lowcarbonprogramme.org), under which this work has been conducted. This paper was made possible by financial support from the Spanish Ministry of the Economy and Competitiveness through its research project ECO2009-14586-C2-01 (Xavier Labandeira and Ana Ramos). The usual disclaimer applies.

2
1. Introduction
The transport sector is responsible for more than 20 percent of the total greenhouse gas (GHG)
emissions in the European Union, with roughly two thirds of that amount being caused by road
transport (IPCC, 2007; EU, 2011). Transport also has significant local environmental impacts, with
millions of citizens severely affected by air and noise pollution brought about by cars in both
developed and emerging countries. Furthermore, the fact that this sector is a major consumer of
energy and mostly relies on oil-related products has turned it into a preferential target for other
environmental and energy-security policies [for instance, in 2007 97 percent of the final energy
consumption of the Spanish transport sector was oil-related (Pérez and Monzón, 2008)].
However, despite significant policy efforts in this area in recent decades, resulting in a great many
instruments and approaches, most developed and emerging countries have seen an increase in both
vehicle numbers and the distances travelled by their occupants. Again in the case of Spain, the
motorisation rate (number of vehicles per capita) grew from 0.32 to 0.48 in only twenty years (EU,
2011), while passenger cars continue to be the dominant option for land transport. It therefore seems
that conventional policy instruments, mostly comprising mandatory design standards and taxes on
fuels, car purchase and ownership, have been unable to cope with the growing size of the energy
sector and with its ubiquitous energy and environmental problems (see e.g. Proost and Van Dender,
2012). Thus, there is growing interest among policymakers and other agents in the design and effects
of different alternatives for tackling this problem.
In this context, there has been an increasing advocacy and implementation of information
programmes in recent years. In particular, labelling and certification systems have sought to reduce
market barriers such as incomplete information or bounded rationality, which prevent consumers from
taking optimal decisions regarding energy efficiency. In particular, labelling systems for light-duty
vehicles are intended to provide clear, accessible information to enable consumers to compare the
fuel performances of similar vehicles. In the European Union (EU) this scheme is regulated by
European Directive 1999/94/CE (European Commission, 2000), which requires Member States to
impose a labelling system for light-duty vehicles that shows the absolute level of CO2 (carbon
dioxide) emissions and the fuel consumption of each new car when it is sold. Additionally, this

3
Directive recommends the use of a voluntary label with differentiated energy-efficiency classes (from
A as the most energy efficient to G as the least) that can facilitate comparisons between vehicles of
the same size. The Spanish government transposed this mandate via Royal Decree 837/2002, which
establishes that labels classify vehicles according to the difference between their own consumption
levels and the average consumption of the group of the corresponding size. Average consumption is
actually computed as follows:
!"#$!%# !"#$%&'()"# = ! ∗ !(!∗!)
where a and b are parameters that must be reviewed and updated every year, and differ for gasoline
and diesel cars. S is vehicle size, measured as length by width. Appendix A shows the current
Spanish labelling format.
Energy efficient labels thus represent a novel instrument well suited to analysing the purchasing
decisions of consumers. In this sense, the hedonic price method has traditionally been a preferred
approach for studying willingness to pay (WTP) for certain attributes of products, such as fuel
economy or energy efficiency in the case of vehicles (Liu and Helfand, 2012). However, the
interpretation of the regression coefficients is problematic due to the high degree of correlation that
usually exists between the attributes of a product. That is why we believe that energy efficiency labels
could be suitable for estimating the implicit price of fuel consumption. Additionally, the use of this
indicator provides insights into whether or not there is a price premium associated with energy-
efficiency labels in vehicles, as has been suggested for other products such as buildings and
household appliances. In particular, expected car fuel savings may be taken as a reference for such
an analysis in the transport sector.
By using detailed data on car characteristics and prices, this study seeks to analyse the price effects
of high-rated vehicles, in energy efficiency terms, on the Spanish market for new cars. The paper
further contributes to the literature in this area via its use of retail prices as a better approximation to
the real transaction price. To the best of our knowledge, previous research efforts using the hedonic
approach have used official prices as those that lead to equilibrium in the market. However, there is
casual evidence that, at least in the Spanish car market, retailers apply significant discounts on their

4
own prices and thus the final price could be very different from the official one. To take this into
account, our database consists of a sample of around 3,000 vehicle observations that provide
detailed information on the characteristics and both the official and ‘real’ prices of cars. To anticipate
the potentials and limitations of this approach and thus avoid the regulatory limitations of the past, it
is particularly important to determine whether consumers value energy-efficiency characteristics
when purchasing a new vehicle. Moreover, we compute an approximation to the present value of the
fuel savings to determine whether Spanish consumers value energy efficiency rationally.
The rest of the paper is organised as follows. Section 2 reviews the literature to date in this field, and
then briefly describes the hedonic pricing method and the data used. Section 4 presents and
discusses the main results arising from the estimation of the model, and Section 5 compares the
WTP of consumers with the present value of fuel savings and thus deals with the rationality of agents
when purchasing energy-efficient vehicles. Finally, Section 6 summarises the main conclusions and
implications of the paper.
2. Literature Several papers have assessed the preferences of consumers regarding ‘cleaner’ cars through stated
preferences. For instance Achtnicht (2012) estimates the WTP for cars with lower CO2 (carbon
dioxide) emissions per km, and finds that this is considered an important attribute by German car
buyers, especially by women, older people and those with higher levels of education. Caulfield et al.
(2010) focus on the car purchase decision to determine whether fuel costs and existing taxes
influence the choices of Irish consumers. Ewing and Sarigöllü (2000) report a positive attitude
towards clean cars among Canadian consumers due to their environmental benefits, even though
they are unwilling to give up the customary levels of car performance. Baltas and Saridakis (2013)
using compensatory choice modelling show that a number of variables, such as purpose of car use,
prepurchase information sources, consumers predisposition towards buying an ecological car, or
consumers involvement and attachment to cars, significantly affect the choice of car.

5
Given the different characteristics or attributes of automobiles, consumers’ preferences for cleaner
cars could be also evaluated through revealed preferences, and particularly through the use of the
hedonic pricing method. The first hedonic pricing studies for automobiles set out to establish a new
method for computing price indices: the so-called ‘quality-adjusted price index’. Given the
technological advances in the automobile market, it was deemed necessary to differentiate price
changes associated with changes in the quality of attributes from those made when all characteristics
remained the same. Court (1939) and Griliches (1961, 1964) first deal with this issue by presenting
different models for computing adjusted-price indices for a period of time. More recently, this method
has been used with the same purposes but with new model specifications by, for instance, Matas and
Raymond (2009), Reis and Santos Silva (2002) and Izquierdo et al. (2001). Other authors employ the
hedonic price method to estimate the implicit price of each car attribute, for instance energy efficiency
or fuel economy (generally measured in miles per gallon). In particular, there is an initial group of
papers that study the effects of gasoline price increases on the preferences of consumers for more
energy-efficient cars after the oil crisis. In this context, Kahn (1986), Atkinson and Halvorsen (1984),
Ohta and Griliches (1983) and Goodman (1983) focus mainly on used cars in the US, and find mixed
results.
As observed in the introduction, interest in energy efficiency has undergone a revival in practical and
academic terms in the last few years, largely due to energy dependency and environmental and
climate change concerns. In this sense, Chugh et al. (2011) use the hedonic pricing method to test
the hypothesis that Indian consumers rationally value fuel economy by comparing the marginal price
of fuel economy with the present value of fuel savings. To avoid correlation with unobservable
variables, they use ordinary least squares (OLS) and instrumental variables (IV) with average fuel
economy (in miles per gallon) of the same car brand as the instrument for fuel economy. Their results
from IV show an implicit price of fuel economy that ranges from 1 to 10 percent of the total price in
the period from 2002 to 2006 which, compared to the present value of energy savings, does not
support undervaluation of the fuel economy of cars. Kiso (2010), on the other hand, applies an
alternative hedonic model to 2001 US data on new vehicles to avoid omitted variable bias. Using data
on gasoline prices and the estimated miles travelled per year, the paper constructs a proxy for the
marginal price of fuel economy, which is shown to be between 5 and 10 percent of the retail price.
Moreover, as expected, the paper reports a higher cost of fuel economy in larger vehicles. Also using

6
data from the US new vehicle market in the same year, Espey and Nair (2005) estimate four models
with OLS using different specifications of fuel economy. Although their results coincide with Chugh et
al. (2011) in that WTP for more fuel-efficient vehicles exceeds energy savings, they suggest that
buyers behave rationally because the difference is explained by the environmental and energy
concerns of consumers. Yet, by contrast with to the aforementioned papers, Arguea and Hsiao
(1993) find mixed evidence of car price increases associated with more mileage per gallon in 1969-
1986.
In this paper we follow a similar hedonic approach to estimate the implicit price of fuel consumption or
energy efficiency, using the EU labelling system as an indicator for fuel economy that avoids
problems associated with multicollinearity and omitted variables. To the best of our knowledge, the
only piece of research that evaluates the WTP for energy-efficient vehicles through labelling is an
ongoing research project by Alberini et al. (2013) that considers the Swiss car rating system.
3. Estimation 3.1. Hedonic price model
The hedonic price method is based on the assumption that a product can be represented as a vector
containing its characteristics or attributes. By extension, the price of that product can be expressed
as a function of the attributes
! ! = ! (!!, !!,… , !!) (1)
where !! etc. represent each of the attributes of the good. In equilibrium, the price of each attribute is
equal to the cost for the manufacturer of producing that characteristic (Court, 1939; Griliches, 1961;
Rosen 1974). Therefore, in a competitive equilibrium the hedonic price method enables the implicit
price of each characteristic of a vehicle to be estimated. It is given by the partial derivative of the
vehicle price function with respect to each attribute. Thus, ! !(!)! !!
reports consumers’ WTP for an extra
unit of the attribute z! or, similarly, the manufacturer’s marginal cost of producing such an additional

7
unit. Although this approach bases its conclusions on real transaction prices, given the difficulties of
using that price researchers have tended to use manufacturers’ official prices as an approximation to
the transaction price. As indicated above, however, the two prices do not necessarily coincide.
Therefore, we propose the use of commercial retail prices as a more adequate approximation to the
transaction price.
3.2. The data
We employ a database developed especially for this study with micro-information on more than 3,000
observations of low, medium and high range vehicles on sale in Spain. Each automobile is identified
by its unique model description in the database, which allows us to match different data sources to
collect a detailed set of information. For instance, we have information on the type of car fuel, size,
horsepower, extra equipment, brand, number of seats, fuel consumption, etc. (see Appendix B for a
full list of the characteristics contained in the database). The main advantage of this database over
those used in previous research efforts in this area is the inclusion of data on both the manufacturer’s
official prices and actual retail prices. This means that when applying the hedonic price method two
sources of prices can be used that should be very close to equilibrium prices. Data on official prices
and on vehicle characteristics are taken from specialist car magazines and official car makers’
websites, while a subsample of retailer prices, containing 372 observations, was gathered by survey
company CDS, Estudios de Mercado y Opinión S.L. using the so-called ‘mystery shopping’
approach1. Retail prices were surveyed for the 15 most representative brands at different authorised
dealers throughout Spanish territory2. Moreover, to avoid market changes, all prices were gathered
between September and November 2012.
The official prices obtained included only value added tax (VAT), while the retail prices also included
vehicle registration taxes3 and retailers’ management costs, so price homogenization was required.
To that end we subtracted the corresponding registration tax and the average retailers’ management
1 This method can obtain reliable information on a specific service or product, gathered by an agent who pretends to be a normal consumer. 2 Surveys were carried out in a selection of the most representative Spanish mainland regions: Andalusia, Catalonia, Basque Country, Galicia and Madrid. 3 Vehicle registration taxes depend on CO2 emissions in Spain.
8
costs from the retail prices. As a final step, each observation was matched with its corresponding
energy-efficiency label using information provided by IDAE (Spanish Institute for Energy
Diversification and Savings). In fact, IDAE has developed a database with data on CO2 emissions,
consumption and the corresponding energy-efficiency label for each model of vehicle sold in Spain4.
Energy labels classify each vehicle based on the difference between its fuel consumption and the
average consumption by cars of a similar size. This has allowed us to match each vehicle with its
corresponding label to obtain a database with all the relevant characteristics needed to estimate the
price function.
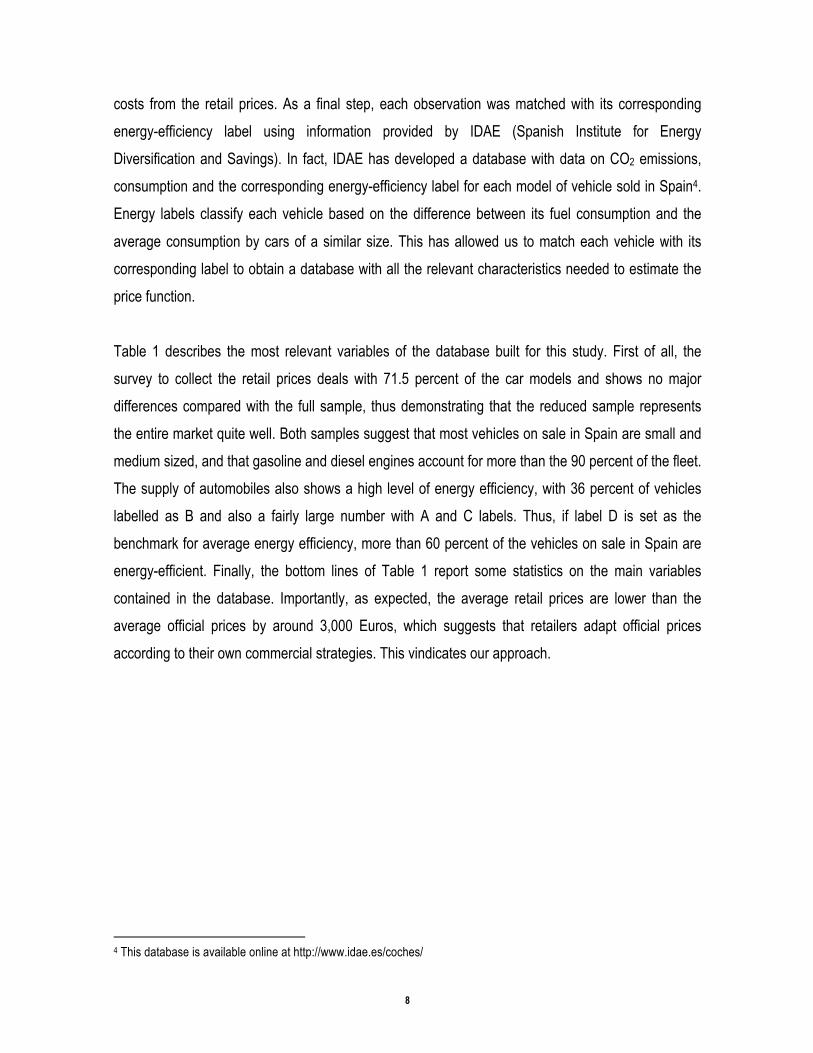
Table 1 describes the most relevant variables of the database built for this study. First of all, the
survey to collect the retail prices deals with 71.5 percent of the car models and shows no major
differences compared with the full sample, thus demonstrating that the reduced sample represents
the entire market quite well. Both samples suggest that most vehicles on sale in Spain are small and
medium sized, and that gasoline and diesel engines account for more than the 90 percent of the fleet.
The supply of automobiles also shows a high level of energy efficiency, with 36 percent of vehicles
labelled as B and also a fairly large number with A and C labels. Thus, if label D is set as the
benchmark for average energy efficiency, more than 60 percent of the vehicles on sale in Spain are
energy-efficient. Finally, the bottom lines of Table 1 report some statistics on the main variables
contained in the database. Importantly, as expected, the average retail prices are lower than the
average official prices by around 3,000 Euros, which suggests that retailers adapt official prices
according to their own commercial strategies. This vindicates our approach.
4 This database is available online at http://www.idae.es/coches/
9
Table 1. Description of the database Full sample Subsample with retail prices Observations 3078 372 Number of brands 32, representing 100% of the market 15, representing 71,55 % of the market Distribution by market segments
Big sedan 17.81% Small sedan 24.89% Sport 9.43% Luxury 5.45% Mini 3.16% Big mini-van 3.00% Medium mini-van 5.58% Small (Reference) 16.28% Big Four-wheel-drive 7.50% Medium Four-wheel-drive 1.40% Small Four-wheel-drive 5.87%
Big sedan 13.24% Small sedan 19.46% Sport 14.05% Luxury 3.24% Mini 1.89% Big mini-van 8.65% Medium mini-van 3.51% Small (Reference) 14.05% Big Four-wheel-drive 2.00% Medium Four-wheel-drive 0.00% Small Four-wheel-drive 1.89%
Distribution by type of fuel
Gasoline 44.41% Diesel 52.83% Bioethanol (Gasoline/Ethanol) 0.88% Gasoline-hybrid 1.27% Diesel-hybrid 0.23% Electric 0.26% LPG 0.03% Natural gas 0.10%
Gasoline 34.40% Diesel 60.21% Bioethanol (Gasoline/Ethanol) 4.03% Gasoline-hybrid 0.54% Diesel-hybrid 0.27% Electric 0.54% LPG 0.00% Natural gas 0.00%
Distribution by energy-efficiency label
A 26.38% B 36.00% C 16.05% D 9.42% E 5.62% F 2.89% G 3.25%
A 22.31% B 36.56% C 13.98% D 10.48% E 11.29% F 2.96% G 1.88%
Mean S.D Mean S.D Price (€) 36435.86 29661.1 33168.95 20219.89 Mixed consumption (l/100km)
6.29 2.00 6.45 1.92
CO2 emissions (g CO2/ km)
152.5 45.55 158.87 46.07
CC (cm3) 167.89 93.44 175.12 88.92 Weight (kg.) 1484.07 312.07 1555.77 364.39 Maximum speed (km/h)
203.56 29.92 204.87 26.74
Source: The authors
3.3. The regression model
Since the number of non-gasoline/diesel cars in our database is almost negligible and energy
efficiency labels do not have any effect on alternatives such as gas-fuelled or electric vehicles, we
restrict our estimation to gasoline and diesel cars. As customary in this field we use a semi-log model

10
for the price function of vehicles (Equation 2), which is estimated using the official and retail price
samples separately.
ln !! = ! + !!"! + !!!"#$ℎ!! + !!!!! + !!!"#! + !!!"#$%&&'! + !!!"#$! + !!!"#! +!!!!,! + !!!!!,!"!!
!!! + !!!!"!!! !!,!" + !!!!!,!" + !!!!!,!" +!
!!!!!!! !!!!!,!" +!
!!!
!!!!!,!" + !!!!!!!
!!!! !!,!" + !! (2)
The dependent variable in Equation 2 is the logarithm of the price for observation i, with α as the
constant of the model. To estimate the price effects of labelling we first attempted to use a discrete
variable for the levels of each label. However, using the statistic variance inflation factor (VIF), which
measures the correlation between explanatory variables (Wooldridge, 2009), we found high levels of
multicollinearity that affected the coefficients of the label variables. Therefore we created a dummy
variable (AB), valued at one if the car has a class A or B label and zero otherwise, which does not
suffer from multicollinearity. Hence, the coefficient of interest in equation (2) is β, which measures the
marginal price of energy efficiency (defined as having A or B labels). Even though labels are a
function of size, their effect would be overestimated if we did not control for the increase in price due
to larger vehicles. Thus, we use weight (in tonnes) as a proxy for the length and width of the car. We
also include the variables CC, RPS, maxspeed, acel and cap for cubic centimeters (measuring
engine size), revolutions per second, maximum speed, acceleration and boot capacity (in 100l)
respectively. Finally, Equation 2 contains dummies for the type of fuel (D1), commercial vehicle
segment (D2), market brands (D3), number of seats (D4), number of airbags (D5), number of gears
in manual gearboxes, including automatic transmission (D6), type of drive system (D7) and six
dummies for extra equipment (D8), all described in full in Appendix B. We believe that this extensive
set of characteristics and the use of labels as an indicator of energy efficiency will enable the
coefficient for energy efficiency to be interpreted correctly.
Two additional model specifications are implemented to check the results: the first replaces the
variable AB by fuel consumption (in l/km), whereas the second uses a new dummy variable instead
of AB, called A, which takes a value of 1 if the vehicle has a class A label and 0 otherwise. Although
the first of these alternatives might result in multicollinearity, the objective is to use two similar
indicators of energy efficiency to validate our results. We would expect the coefficient for fuel

11
consumption to have a similar magnitude but the opposite sign to the coefficient for AB, while the
coefficient for A should have the same sign but a larger magnitude than AB due to the exclusion of
the effect of label B from the combined effect. Finally, we regress the original model separately for
each commercial segment so that we can identify differences in WTP depending on the type of
vehicle. Since each commercial segment is determined by its own characteristics, we expect different
implicit prices for energy efficiency.
4. Results Table 2 displays the results for the estimation of Equation 2. Column 2 depicts the results using
official prices, whereas column 6 shows the results with retail prices (columns 3 and 7 are the
corresponding standard errors). Most coefficients are significant, and have the expected sign in both
models. The R-squared, moreover, suggests that most price variability is explained by the model.
The main objective of this research was to estimate the marginal effect of high-rated vehicles, which
is explained by the coefficient of variable AB. In fact, both models suggest that energy-efficient
vehicles (those with class A and B labels) are more expensive than the rest. In particular, all other
variables being equal, the amounts associated with energy-efficient vehicles are 1.3 and 9.04 percent
of the price for official and retail prices, respectively. Moreover, our results indicate that consumers
value-energy efficient vehicles, that is, that they are willing to pay more for vehicles with A or B
labels.
However, there is a substantial difference between the figures of the two results. This might be
partially explained by the type of observations included in each sample: the sample with retail prices
contains only observations for the 15 best-selling brands on the Spanish market, while the official
price sample contains all the models available on that market. The latter includes several luxury
brands that provide vehicles with clearly distinctive characteristics that could be biasing the results if
the dummy for luxury is unable to control their full effect. Consequently, we re-estimated the model
using official prices but considering only the 15 best-selling brands in Spain. Column 4 in Table 2
reports the corresponding results: basically the coefficient of interest for official prices, β, increases to
2.1 percent. The remaining difference could be due to the origin of the prices: official prices are

12
supply-side prices, while retail prices are closer to being demand-side prices (i.e. are prices at
equilibria and thus better incorporate demand factors). This could indicate that consumers value
energy efficiency more highly than producers.
Table 2. Estimated results for vehicles labelled as A or B Official prices Official prices Retail prices Full sample Reduced
sample
Coefficient S.D Coefficient S.D Coefficient S.D Gasoline -0.0565*** (0.00941) -0.0601*** (0.0104) -0.0930* (0.0292) CC 0.00265*** (8.15e-05) 0.00260*** (7.70e-05) 0.00302*** (0.000268) RPS -0.00065** (0.00031) -0.00037** (0.000336) -0.00334*** (0.00128) Maxspeed 0.00110*** (0.000318) 0.000696** (0.000281) 0.000334 (0.000775) Acel 0.000795 (0.00167) -0.000338 (0.00168) 0.00921 (0.00754) AB 0.0135** (0.00606) 0.0210*** (0.00702) 0.0904*** (0.0292) Weight 0.36532*** (0.02341) 0.43968*** (0.02737) 0.226*** (0.0948) Cap 0.00169 (0.00279) -0.00589** (0.00256) -0.0186** (0.00897) Automatic 0.0620*** (0.00900) 0.0755*** (0.0103) 0.117** (0.0477) A/C 0.0401*** (0.00816) 0.0354*** (0.0104) 0.106*** (0.0278) Constant 8.818*** (0.0783) 8.831*** (0.0764) 9.098*** (0.232) Dummy for brand Y Y Y Dummy for commercial segment
Y Y Y
Dummy for extra equipment
Y Y Y
Dummy for #seats Y Y Y Dummy for #airbags
Y Y Y
Dummy for traction type
Y Y Y
Dummy for #speeds
Y Y Y
Observations 2,961 2,124 352 R-squared 0.965 0.970 0.978
Note: Robust standard errors in parentheses ***p<0.01, **p<0.05, *p<0.1 Source: The authors.
In short, our results not only provide the first empirical evidence of the WTP for energy-efficient
vehicles among Spanish consumers but also contribute to the international literature in this area,
yielding values that fall within the usual range found in evidence to date. The results for the rest of the
variables are as expected and are very similar for the two price specifications: gasoline vehicles are 6
to 9 percent cheaper than diesel, engine size (measured in cubic centimeters (CC)), weight and
maximum speed (maxspeed) increase prices in the regression of official prices. Table 2 also displays

13
the marginal cost of some of the dummies included in the model, such as air conditioning and
automatic transmission relative to conventional five-speed gearboxes.
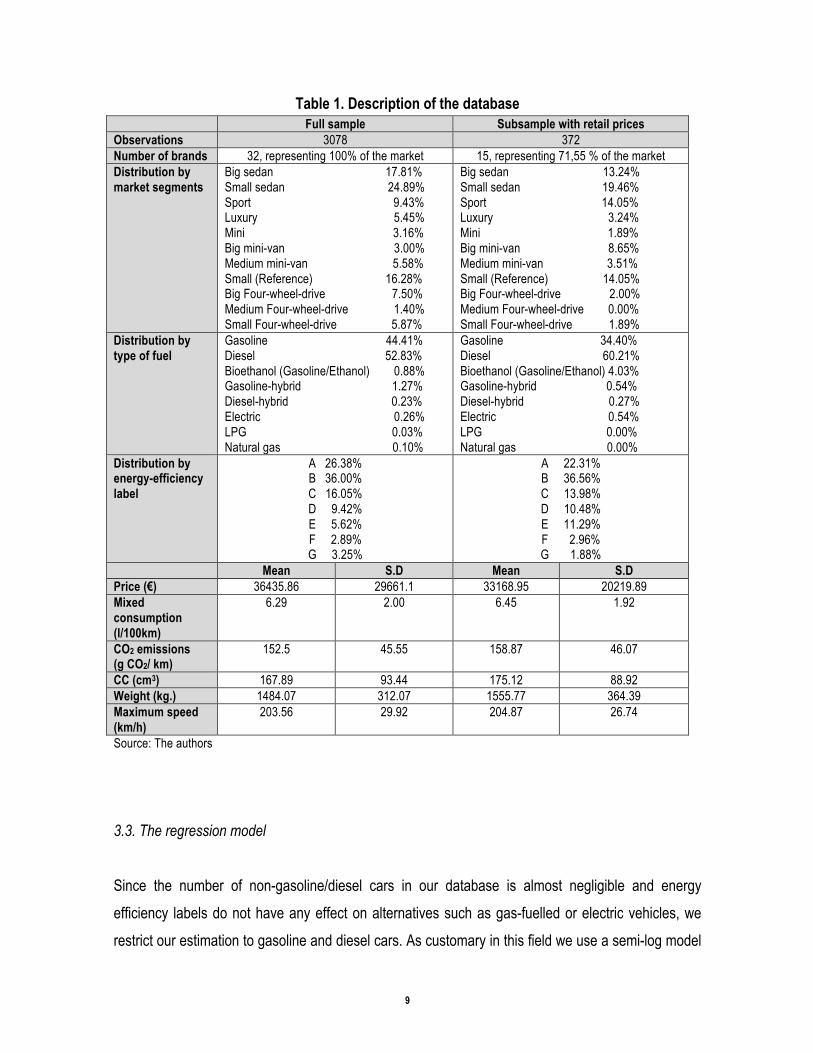
Table 3 shows results for the first alternative model, which uses fuel consumption as an indicator of
energy-efficiency. Most of the coefficients remain unchanged in the two samples when variable AB is
replaced by fuel consumption in the reduced official-price sample. The coefficient for fuel economy
does not have the expected sign in the official-price sample because, all else being equal, an
increase in fuel consumption should decrease the WTP. However, this is not the case in the retail-
price sample, in which the value assigned to fuel consumption not only has a negative sign but is on
the same order of magnitude as in previous results. Again, this difference could be explained by the
source of the prices: an increase in fuel consumption in l/km is an undesirable characteristic for
consumers, but it might not be so for producers. The fact that the implicit price of fuel consumption is
lower than the price for high-rated vehicles could indicate that there is a price premium associated
with labels, as mentioned above. Finally, the VIF shows a higher level of multicollinearity for the
coefficient for fuel consumption than the AB coefficient.
Table 4 displays the results for the second alternative specification, which replaces the variable AB
by the variable A (for vehicles labelled as A). In this case, as expected, the coefficient for A is higher
than the coefficient for AB in both models. This regression shows the robustness of our results to
alternative model specifications: The WTP of consumers for vehicles labelled A is again higher than
for those labelled A or B.
14
Table 3. Estimated results for vehicles’ fuel consumption (in l/100km.)
Official reduced
prices sample
Retail prices
Coefficient S.D Coefficient S.D Gasoline -0.0823*** (0.0134) -0.0510 (0.0518) CC 0.00241*** (7.86e-05) 0.00312*** (0.000280) RPS -0.000371 (0.000330) -0.00228 (0.00140) Maxspeed 0.000702*** (0.000264) 0.000106 (0.000779) Acel -0.000556 (0.00166) 0.00238 (0.00842) Consumption 0.0131*** (0.00404) -0.0307** (0.0146) Weight 0.399*** (0.0283) 0.285*** (0.0995) cap -0.00424* (0.00248) -0.0195** (0.00884) aut 0.0742*** (0.0103) 0.118** (0.0462) A/C 0.0372*** (0.0104) 0.101*** (0.0290) Constant 9.091*** (0.0760) 9.511*** (0.226) Dummy for brand Y Y
Dummy for commercial segment
Y Y
Dummy for extra equipment
Y Y
Dummy for #seats Y Y
Dummy for #airbags Y Y
Dummy for traction type
Y Y
Dummy for #speeds Observations 2,122 352 R-squared 0.970 0.978
Robust standard errors in parentheses *** p<0.01, ** p<0.05, * p<0.1 Source: The authors.

15
Table 4. Estimated results for vehicles labelled as A Official
reduced prices
samples Retail prices
Coefficient S.D Coefficient S.D Gasoline -0.0642*** (0.0103) -0.151*** (0.0523) CC 0.00259*** (7.39e-05) 0.00266*** (0.000236) RPS -0.000254 (0.000331) -0.000869 (0.00133) Maxspeed 0.000729*** (0.000277) 0.00114 (0.000766) Acel -0.000998 (0.00165) 0.0134* (0.00728) A 0.0464*** (0.00550) 0.146*** (0.0276) Weight 0.440*** (0.0272) 0.206** (0.0906) Cap -0.00657*** (0.00254) -0.0132 (0.00801) Aut 0.0738*** (0.0101) 0.157*** (0.0476) A/C 0.0322*** (0.0102) 0.0668** (0.0299) Constant 8.838*** (0.0745) 8.867*** (0.204) Dummy for brand
Y Y
Dummy for commercial segment
Y Y
Dummy for extra equipment
Y Y
Dummy for #seats
Y Y
Dummy for #airbags
Y Y
Dummy for traction type
Y Y
Dummy for #speeds
Y Y
Observations 2,124 352 R-squared 0.971 0.980
Robust standard errors in parentheses *** p<0.01, ** p<0.05, * p<0.1 Source: The authors.
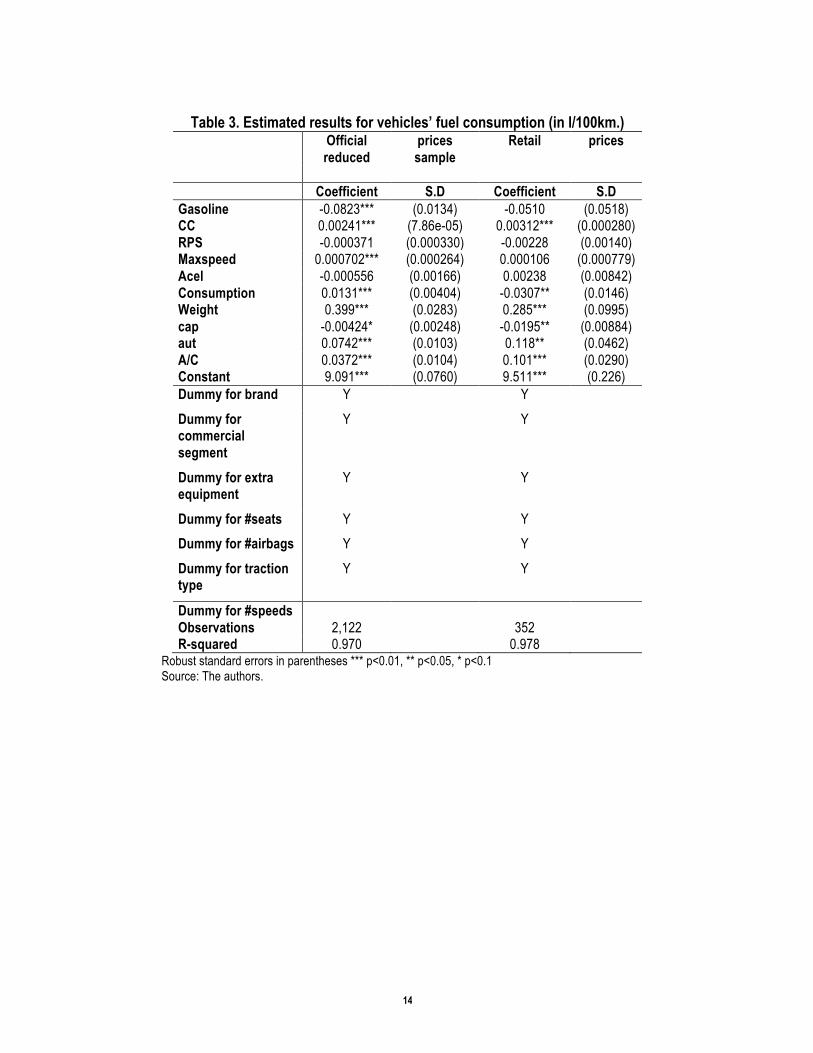
Finally, using the full official-price sample, Table 5 reports WTP results for A-labelled vehicles in each
commercial segment. A priori, one would expect bigger vehicles with higher fuel consumption to have
the highest energy-efficiency implicit price, as the expected fuel savings are larger. However, our
results do not support this hypothesis: the sports and luxury segments show the largest WTP for
vehicles labelled as A, but the coefficient for energy efficiency is not statistically significant for SUVs,
the other segment with high consumption. Cars in the small category show the second highest WTP
16
for energy efficiency, followed by minivans and sedans. Hence, our estimates do not indicate a clear
link between the commercial segment of vehicles and WTP for energy efficiency.
Table 5. Estimated results in each commercial segment (using vehicles labelled A) Sedan Sport &
Luxury Mini Small Minivan Four-wheel-drive
(SUV)
Coef. (A) 0.0116** 0.0619*** 0.0196 0.0403*** 0.0322** 0.0438 S.D. (0.00535) (0.0200) (0.0165) (0.0105) (0.0156) (0.0276)
Robust standard errors in parentheses *** p<0.01, ** p<0.05, * p<0.1 Source: The authors.
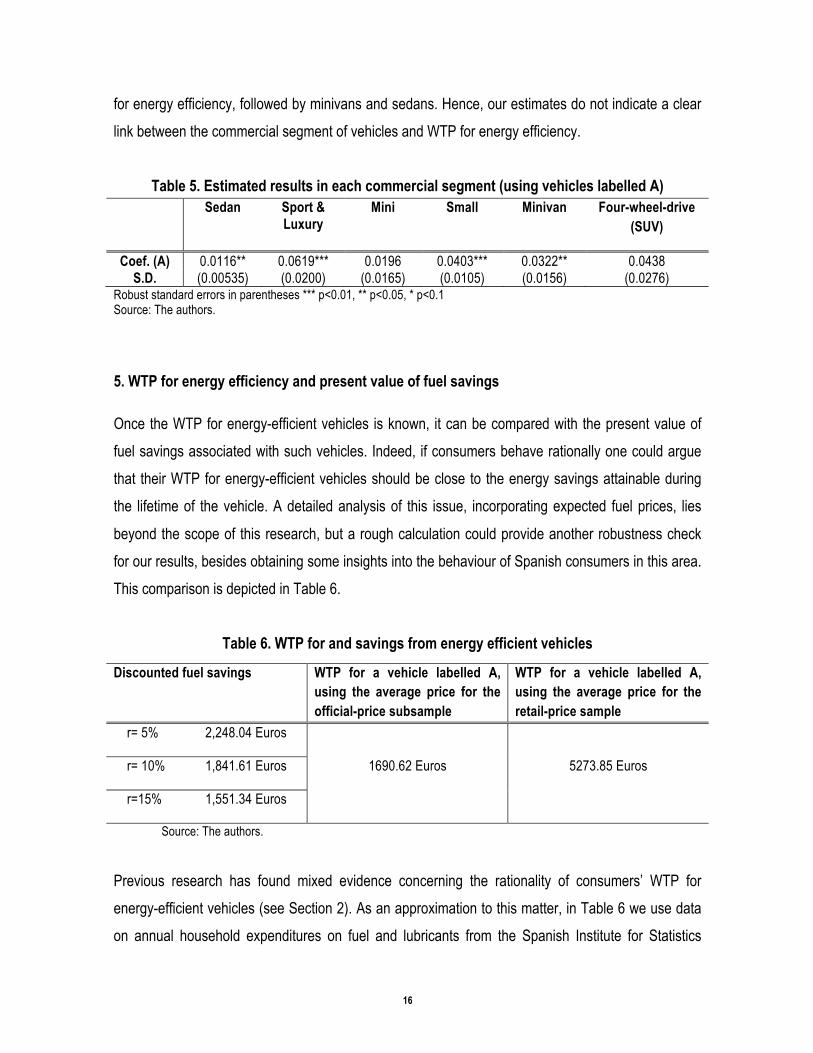
5. WTP for energy efficiency and present value of fuel savings Once the WTP for energy-efficient vehicles is known, it can be compared with the present value of
fuel savings associated with such vehicles. Indeed, if consumers behave rationally one could argue
that their WTP for energy-efficient vehicles should be close to the energy savings attainable during
the lifetime of the vehicle. A detailed analysis of this issue, incorporating expected fuel prices, lies
beyond the scope of this research, but a rough calculation could provide another robustness check
for our results, besides obtaining some insights into the behaviour of Spanish consumers in this area.
This comparison is depicted in Table 6.
Table 6. WTP for and savings from energy efficient vehicles
Discounted fuel savings
WTP for a vehicle labelled A, using the average price for the official-price subsample
WTP for a vehicle labelled A, using the average price for the retail-price sample
r= 5% 2,248.04 Euros
1690.62 Euros 5273.85 Euros r= 10% 1,841.61 Euros
r=15% 1,551.34 Euros
Source: The authors.
Previous research has found mixed evidence concerning the rationality of consumers’ WTP for
energy-efficient vehicles (see Section 2). As an approximation to this matter, in Table 6 we use data
on annual household expenditures on fuel and lubricants from the Spanish Institute for Statistics

17
(INE). The figure is for 2012 is 1030 Euros. Given that vehicles with class A labels consume 25
percent less than those with class D, taken as a reference, we observe that the expected energy
savings over a vehicle lifetime of 10 years range from 2248.04 to 1551.34 Euros, using discount rates
from 5 to 15 percent respectively. These expected energy savings are checked against the WTP
obtained from our alternative regression using the dummy for vehicles labelled as A.
By employing two price approximations as boundaries, we obtain several interesting results. For the
retail price sample, the WTP exceeds the present value of fuel savings, independently of the discount
rate. Although this finding coincides with the results of Chugh et al., (2011) and Espey and Nair
(2005), given the magnitude of the difference between the two values it could be reflecting an
overestimation of the WTP when retail prices are used. Other explanations might be worth
considering to unravel this issue in future research. The impact of commercial strategies of dealers
might be playing a significant role in the car market in Spain. And thus, supply side factors are
prevailing when retail prices are considered. In this sense, Van der Vooren et al. (2013) offer some
insights regarding such supply-side effects, showing how the product portfolio of Dutch firms has
changed due to energy labelling.
On the other hand, when the official-price subsample is used the values are considerably closer to
the WTP. With a discount rate ranging from 5 to 10 percent, the expected energy savings are greater
than the WTP, which may indicate that consumers undervalue energy efficiency or the so-called
energy efficiency paradox exists. That is, even when investments in energy efficiency seem
economically rational some consumers chose not to undertake them. Other reasons such as
information barriers (not overcome by the labels), lack of liquidity (and/or credit) as well as
uncertainty about future fuel prices might also contribute to explaining this result. Only with a discount
rate of 15 percent is the WTP greater than the present value of fuel savings.
Galarraga et al. (2011b) also find some evidence of the energy efficiency paradox for the case of
refrigerators in Spain. The paper estimates that the WTP is about one third of the energy savings that
a consumer obtains during the lifetime of a refrigerator with the highest energy-efficiency label.

18
Interestingly, independently of the values of the discount rate, the expected energy savings are
relatively close to the WTP results obtained for cars using official prices. This can be interpreted as
proof of the accuracy of the WTP estimated for energy-efficient vehicles using official prices, and the
economic rationality of Spanish consumers when purchasing energy-efficient vehicles, that is, small
presence of the energy efficiency paradox. The difference between the WTP and the present value of
energy savings is significantly lower in the case of cars than in the case of refrigerators. This is
probably due to the fact that the capacity of influencing on the future energy consumption on cars is
much higher, and thus the potential of future savings are valued more.
6. Conclusions
Governments face growing pressure to limit energy-related emissions and consumption from an ever
larger number of vehicles and from increasing car use. A mix of various policy instruments has been
implemented to attain this general objective, such as taxes on fuel and car purchases, design
standards and subsidies. These measures may be expanded and intensified given the major part
played by transport in global energy consumption, and to tackle severe environmental problems.
However, given the taste of consumers for more, larger and more powerful cars, and the potential
limitations associated with some of the conventional regulatory instruments in this area, new
approaches may be needed. In this sense, information programmes such as energy-efficiency labels
may play an important role in both developed and emerging countries. Among other things, they may
address the apparent lack of perception among consumers of the benefits of improved energy-
efficiency in cars. It is against this background that an EU energy-efficiency rating system for cars
has been implemented, with labels ranging from A (most energy efficient) to G (least energy
efficient).
In this paper, we use this labelling system to estimate the value that Spanish consumers place on
energy-efficient cars. To estimate the implicit price of a high-rated car in terms of energy efficiency,
i.e. the WTP of consumers for a car labelled A or B, we employ a database developed especially for
this study with more than 3000 observations containing a rich set of characteristics of vehicles on the
Spanish market. Besides official prices, the database incorporates a subsample of retail prices for

19
cars obtained in situ through ‘mystery shopping’. All this information is matched with the IDAE’s
official database information about vehicle energy-efficiency labels.
That database is used with a hedonic price approach to estimate a model of car prices that are set as
function of different attributes of cars. Among other results, the paper reports a statistically significant
coefficient of the variable that measures the effect of (very high) energy-efficiency labels: A and B
labelled cars are found to be supplied at a price between 2.1 and 9.04 percent higher than that of
similar but less energy-efficient cars, using two different price approximations (official listing and
‘mystery shopping’). These results are first contrasted with alternative model specifications using fuel
consumption and A-labelled vehicles. Subsequently, to evaluate the rationality of consumers, the
results are compared with an approximation of the present value of energy savings. When official
prices are used, the WTP for vehicles labelled as A is very close to the expected energy savings,
which suggests that Spanish consumers rationally value energy efficiency in cars. When retail prices
are used instead, the difference is quite substantial, which might indicate either an overestimation of
the WTP in this case or a supply side distortion in the market due to aggressive commercial
strategies of Spanish dealers. This question remains to be answered by future research. Using both
official and retails prices seems promising area for further analysis as it offers new insights for
coming research.
Before concluding the paper, we believe that it is important to set our results in the context of the
recent literature on energy efficiency labelling in other goods. Energy efficiency certification systems
are becoming a widespread tool for incentivising the purchase of products other than vehicles,
including buildings and household appliances. Indeed, applying the hedonic price method to these
other products provides similar results: products with high energy-efficiency labels are sold (or
rented) at higher prices. For instance, Eichholtz et al. (2010) analyse the case of commercial
buildings in the US, and find that rental (selling) rates associated with certified office buildings are 3
(16) percent higher per square foot than for similar but uncertified ones. These results are similar to
those of Fuerst and McAllister (2011), who find that the price of commercial buildings in the US is 25
and 26 percent higher respectively for buildings with LEED and Energy Star certificates, while for
rents the differences are +5 and +4 percent respectively. Again using the hedonic price method,
Galarraga et al. (2011a) estimate the marginal price of energy-efficient dishwashers in Spain (those

20
labelled A or A+), and find that the label explains as much as 15.6 percent of the price. Galarraga et
al. (2011b) find that the figure is 8.9 percent for the case of the refrigerators market of the Basque
Autonomous Community (Spain).
To sum up, we believe that this paper provides support for the use of information-based approaches
in the area of energy and environmental regulation of transport, where measures are greatly needed.
However, given that there are several significant policy instruments available to promote energy
efficiency, it is very important to introduce such approaches with proper consideration for the
synergies and negative interactions that they might bring about in such a context. Energy labels or
certificates, on the other hand, could be used as the basis for designing other policy initiatives in this
area, such as taxes levied on the energy inefficiency of the stock (Hanemann et al., 2012) or
emission based car taxation (Rogan et al., 2011). The results of this article, and their possible
derivations, may be particularly useful for an informed discussion of these and other policy issues in
this important area.

21
References
Achtnicht, M., 2012. German Car Buyers’ Willingness to Pay to Reduce CO2 Emissions. Climatic Change, 113: 679-697.
Alberini, A., Filippini, M., Bareit, M., 2012. Price Premium for Energy Efficient Cars: A Hedonic Price Approach. Mimeo, ETH.
Arguea, N.M., Hsiao, C., 1993. Econometric Issues of Estimating Hedonic Price Functions with an Application to the U.S. Market for Automobiles. Journal of Econometrics, 56: 243-267.
Atkinson, S.E., Halvorsen, R., 1984. A New Hedonic Technique for Estimating Attribute Demand: An Application to the Demand for Automobile Fuel Efficiency. Review of Economics and Statistics, 66: 417-426.
Baltas, G., Saridakis, Ch., 2013. An Empirical Investigation of the Impact of Behavioural and Psychographic Consumer Characteristics on Car Preferences: An Integrated Model of Car Type Choice. Transportation Research Part A: Policy and Practice, 54: 92-110.
Caulfield, B., Farrell, S., McMahon, B., 2010. Examining Individuals Preferences for Hybrid Electric and Alternative Fuelled Vehicles. Transport Policy, 17: 381-387.
Chugh, R., Cropper, M., Narain, U., 2011. The Cost of Fuel Economy in the Indian Passenger Vehicle Market. Energy Policy 39: 7174-7183.
Court, A., 1939. Hedonic Price Indexes with Automotive Examples, in General Motors (ed.), The Dynamics of the Automobile Demand. GM corporation, New York.
Eichholtz, P., Kok, N., Quigley, J.M., 2010. Doing Well by Doing Good? Green Office Buildings. American Economic Review, 100: 2494-2511.
Espey, M., Nair, S., 2005. Automobile Fuel Economy: What is it Worth? Contemporary Economic Policy, 23: 317-323.
European Commission, 2000. Directive 1999/94/CE of the European Parliament and of the Council of 13 December 1990, relating to the availability of consumer information on fuel economy and CO2 emissions in respect of the marketing of new passenger cars.
European Union, 2011. EU Transport in figures. Publications Office of the European Union, Luxembourg.
Ewing, G., Sarigöllü, E., 2000. Assessing Consumer Preferences for Clean-fuel Vehicles: a Discrete Choice Experiment. Journal of Public Policy and Marketing, 19: 106-118.
Fuerst, F., McAllister, P., 2011. Green Noise or Green Value? Measuring the Effects of Environmental Certification on Office Values. Real Estate Economics 39: 45-69.
Galarraga, I., González-Eguino, M., Markandya, A., 2011a. Willingness to Pay and Price Elasticities of Demand for Energy-efficient Appliances: Combining the Hedonic Approach and Demand Systems. Energy Economics, 33: S66- S74.

22
Galarraga, I, Heres, D. and González-Eguino, M., 2011b. Price premium for high-efficiency refrigerators and calculation of price-elasticities for close-substitutes: Combining Hedonic Pricing and Demand Systems. Journal of Cleaner Production, vol. 19, 2075-2081.
Griliches, Z., 1961. Hedonic price indexes for automobile: an econometric of quality change. Report of the Price Statistics Review Committee.
Griliches, Z., 1964. Notes on the Measurement of Price and Quality Changes. Studies in Income and Wealth, 28: 381-418.
Goodman, A.C., 1983. Willingness to Pay for Car Efficiency: A Hedonic Price Approach. Journal of Transport Economics and Policy, 17: 247-266.
Gago, A., Hanemann, M., Labandeira, X., Ramos, A., 2013. Climate Change, Buildings and Energy Prices, in Fouquet, R. (ed) Handbook on Energy and Climate Change. Edward Elgar, Cheltenham.
IPCC, 2007. Mitigation of Climate Change. Contribution of WGIII to the Fourth Assessment Report. Cambridge University Press, Cambridge.
Izquierdo, M., Licandro, O., Maydeu, A., 2001. Mejoras de Calidad e Índice de Precios del Automóvil en España. Estudios Económicos, 72. Servicio de Estudios del Banco de España, Madrid.
Kahn, J.A., 1986. Gasoline Price and the Used Automobile Market: A Rational Expectations Asset Price Approach. Quarterly Journal of Economics, 101: 323-340.
Kiso, T., 2010. Pricing Automobile Fuel Economy: A New Hedonic Approach. Working paper, Department of Agricultural and Resource Economics, University of Maryland.
Liu, Y., Helfand, G. E., 2012. A Hedonic Test of the Effects of Alternative Motor Fuel Act. Transportation Research Part A: Policy and Practice, 46 (10): 1707-1715.
Matas, A., Raymond, J.L., 2009. Hedonic Prices for Cars: An Application to the Spanish Car Market, 1981-2005. Applied Economics, 41: 2887-2904.
Ohta, M., Griliches, Z., 1983. Automobile Prices and Quality: Did the Gasoline Price Increase Change Consumer Tastes in the U.S.? NBER working paper 1211.
Pérez, P., Monzón, A., 2008. Consumo de Energía por el Transporte en España y Tendencias de Emisión. Observatorio Ambiental, 11: 127-147.
Proost, S., Van Dender, K., 2012. Energy and Environment Challenges in the Transport Sector. Economics of Transportation, 1: 77-87.
Reis, H.J., Santos Silva, J.M., 2002. Hedonic Price Indexes for New Passenger Cars in Portugal (1997-2001). Working Paper, 10-02. Banco de Portugal.
Rogan, F., Dennehy, E., Daly, H., Howley, M., Ó Gallachóir, B.P., 2011. Impacts of an Emission Based Private Car Taxation Policy. First Year Ex-post Analysis. Transportation Research Part A: Policy and Practice, 45(7): 583-597.
Rosen, S., 1974. Hedonic Prices and Implicit Markets: Product Differentiation in Pure Competition. Journal of Political Economy, 82: 34-55.

23
Van der Vooren, A., Alkemade, F., Hekkert, M.P., 2013. Environmental Performance and Firm Strategies in the Dutch Automotive Sector. Transportation Research Part A: Policy and Practice, 54: 111-126.
Wooldridge, J. E., 2009. Introductory Econometrics: A Modern Approach. South-Western, Mason.

24
APPENDIX A
Mandatory label
Description of fuel consumption and CO2 emissions labels
1. In the Spanish territory, fuel consumption and CO2 emissions labels must have the following format:
A guide containing fuel consumption and CO2 emissions together with a detailed description of all new vehicles models’ characteristics can be obtained at all points of sale by free.
Commercial brand/model: Fuel type:
Official consumption (ACCORDING TO THE TERMS OF THE DIRECTIVE 80/1268/CEE)
Kind of driving L/100Km.
In the city
On the road
Weighted average OFFICIAL SPECIFIC CO2 EMISSIONS
(ACCORDING TO THE TERMS OF THE DIRECTIVE 80/1268/CEE)
g/Km.
Fuel consumption and CO2 emissions depend not only on vehicles’ performance; driving behavior as well as other no technical factors also influence them. CO2 is the main component of the greenhouse gases, which are responsible for the global warming.
Source: Royal Decree 837/2002

25
Voluntary label
Energy Efficiency Commercial brand Hummer Vehicle model H2 6.2 V8 AUT. Fuel type Gasoline Transmission A Fuel consumption (liters per 100 kilometers)
17,4 liters/100Km
Equivalence (Kilometers per liter)
5,75 km/liter
CO2 emissions (grams per kilometer)
412g/km
Consumption comparative (with respect to the average of vehicles with the same size, for sale in Spain) Low consumption
High consumption
Valid until 02/12/2010 > A guide containing fuel consumption and CO2 emissions together with a detailed description of all new vehicles models’ characteristics can be obtained at all points of sale by free. > Fuel consumption and CO2 emissions depend not only on vehicles’ performance; driving behavior as well as other no technical factors also influence them. CO2 is the main component of the greenhouse gases, which are responsible for the global warming.
Source: Royal Decree 837/2002

26
APPENDIX B
Table B.1. Description of Dummies Characteristic Description D1. Type of fuel 1 dummy =1 if Gasoline
=0 if Diesel D2. Commercial segment 11 dummies for commercial segment: Big sedan
Small sedan Sport Luxury Mini Big minivan Medium minivan Small (Reference) Big Four-wheel-drive Medium Four-wheel-drive Small Four-wheel-drive
D3. Brand 32 dummies for the 32 most representative brands on the Spanish market for light-duty vehicles
D4. Number of seats 7 dummies for: 2 seats 4 seats 5 seats (Reference) 6 seats 7 seats 5 seats convertible in 7 2+2 seats
D5. Number of Airbags 5 dummies for: 2 airbags (Reference) 4 airbags 5 airbags 6 airbags 7 airbags
D6. Number of gears 4 dummies for: 5-speed gearbox (Reference) 6-speed 7-speed Automatic
D7. Drive system 3 dummies for : Front-wheel drive (Reference) Rear-wheel drive 4x4
D8. Extra equipment Air Conditioner (A/C) 1=yes /0=no Electronic stability control 1=yes /0=no Rim 1=yes /0=no Navigation system 1=yes /0=no Xenon arc lamps 1=yes /0=no Parktronic 1=yes /0=no
Source: The authors.


