The Pricing of Multiclass Commercial Mortgage-Backed Securities Author(s): Paul D. Childs, Steven H. Ott, Timothy J. Riddiough Source: The Journal of Financial and Quantitative Analysis, Vol. 31, No. 4 (Dec., 1996), pp. 581 -603 Published by: University of Washington School of Business Administration Stable URL: http://www.jstor.org/stable/2331361 Accessed: 30/03/2010 20:52 Your use of the JSTOR archive indicates your acceptance of JSTOR's Terms and Conditions of Use, available at http://www.jstor.org/page/info/about/policies/terms.jsp. JSTOR's Terms and Conditions of Use provides, in part, that unless you have obtained prior permission, you may not download an entire issue of a journal or multiple copies of articles, and you may use content in the JSTOR archive only for your personal, non-commercial use. Please contact the publisher regarding any further use of this work. Publisher contact information may be obtained at http://www.jstor.org/action/showPublisher?publisherCode=uwash. Each copy of any part of a JSTOR transmission must contain the same copyright notice that appears on the screen or printed page of such transmission. JSTOR is a not-for-profit service that helps scholars, researchers, and students discover, use, and build upon a wide range of content in a trusted digital archive. We use information technology and tools to increase productivity and facilitate new forms of scholarship. For more information about JSTOR, please contact [email protected]. University of Washington School of Business Administration is collaborating with JSTOR to digitize, preserve and extend access to The Journal of Financial and Quantitative Analysis. http://www.jstor.org
Transcript
The Pricing of Multiclass Commercial Mortgage-Backed SecuritiesAuthor(s): Paul D. Childs, Steven H. Ott, Timothy J. RiddioughSource: The Journal of Financial and Quantitative Analysis, Vol. 31, No. 4 (Dec., 1996), pp. 581-603Published by: University of Washington School of Business AdministrationStable URL: http://www.jstor.org/stable/2331361Accessed: 30/03/2010 20:52
Your use of the JSTOR archive indicates your acceptance of JSTOR's Terms and Conditions of Use, available athttp://www.jstor.org/page/info/about/policies/terms.jsp. JSTOR's Terms and Conditions of Use provides, in part, that unlessyou have obtained prior permission, you may not download an entire issue of a journal or multiple copies of articles, and youmay use content in the JSTOR archive only for your personal, non-commercial use.
Please contact the publisher regarding any further use of this work. Publisher contact information may be obtained athttp://www.jstor.org/action/showPublisher?publisherCode=uwash.
Each copy of any part of a JSTOR transmission must contain the same copyright notice that appears on the screen or printedpage of such transmission.
JSTOR is a not-for-profit service that helps scholars, researchers, and students discover, use, and build upon a wide range ofcontent in a trusted digital archive. We use information technology and tools to increase productivity and facilitate new formsof scholarship. For more information about JSTOR, please contact [email protected].
University of Washington School of Business Administration is collaborating with JSTOR to digitize, preserveand extend access to The Journal of Financial and Quantitative Analysis.
JOURNAL OF FINANCIAL AND QUANTITATIVE ANALYSIS VOL. 31, NO. 4, DECEMBER 1996
The Pricing of Multiclass Commercial
Mortgage-Backed Securities
Paul D. Childs, Steven H. Ott, and Timothy J. Riddiough*
Abstract
This paper considers the pricing of multiclass commercial mortgage-backed securities. A contingent-claims pricing methodology that overcomes state variable dimensionality problems is developed to examine mortgage pools with many distinct underlying assets and whose loan cash flow values are subject to interest rate uncertainty. Security structure and the correlation structure of collateralizing assets within a pool are found to be important determinants of tranche price and required yield spread. By disentangling default loss risk from default-related call risk, we show it is possible that mezzanine investment classes
may require lower yield spreads than higher priority investment classes. Of particular interest is the finding that reduced cash flow volatility obtained through pool diversification
may actually decrease the value of the first-loss (junior) tranche. When examining the
relationship of pool size and tranche value, we find that five to 10 distinct mortgages are
required to realize most of the effects of asset diversification.
I. Introduction
More than $100 billion of commercial mortgages have been securitized in
the last several years, representing approximately 10 percent of the total $1 tril-
lion commercial mortgage market (see, e.g., Commercial Real Estate Quarterly,
published by Nomura Securities International, Inc, (1996)). By comparison, and
suggestive of the growth potential of the commercial mortgage-backed security
(CMBS) market, the residential mortgage-backed security (RMBS) market had
a similar 10 percent market share in the late 1970s?whereas today one out of
every two mortgages is securitized and the total RMBS market capitalization is
approximately $1.5 trillion.1
* Childs and Ott, Department of Finance, College of Business and Economics, University of Ken- tucky, Lexington, KY 40506-0034; Riddiough, Department of Urban Studies and Planning, Center for Real Estate, Massachusetts Institute of Technology, Cambridge, MA 02139-4307. The financial support of the Real Estate Research Institute is gratefully acknowledged. We are also grateful to Jim Follain, Mike Giliberto, Laura Quigg, Howard Thompson, to finance workshop participants at MIT and the University of North Carolina, to session participants at the 1995 AREUEA meetings, to par? ticipants at the 1996 Real Estate Research Institute conference, and to Jonathan Karpoff (the editor) and Eduardo Schwartz (the referee) for helpful comments. We alone are responsible for the contents and conclusions found in this paper.
!The residential MBS statistics are from Federal Reserve Board Reports?Mortgage Debt Outstanding.
581
582 Journal of Financial and Quantitative Analysis
There are important differences between the investment risks of residential and commercial mortgage-backed securities. Perhaps the biggest difference is that
early return of principal with residential-backed pools is due primarily to prepay- ment, whereas default is typically the major reason for early principal repayment with commercial mortgage pools. Individual mortgages within a RMBS pool are callable at par, but mortgages are insured against default so that credit risk is a
secondary concern in security valuation. Interest rate uncertainty and expectations
regarding future levels of interest rates are, therefore, major factors in the borrower
mortgage termination decision. The interest rate state variable applies across the
entire economy?which means, from a modeling perspective, that interest rates
alone can be used to determine the call behavior for all borrowers in a particular
mortgage pool (e.g., Dunn and McConnell (1981), McConnell and Singh (1994)). In contrast, default is typically the major source of risk to CMBS investors.
Unlike residential mortgages, most commercial mortgages originated within the
last 15 years contain prepayment lockout or penalty provisions that significantly reduce or eliminate call risk. Default, however, is not readily insurable with
the commercial mortgage. Moreover, wide use of the nonrecourse clause lim?
its individual borrower liability to the real estate asset in the event of default.
Consequently, and in sharp contrast to the RMBS, CMBS value is contingent on
movements in underlying collateral asset value for each mortgage in the pool, in
addition to being sensitive to changes in the term structure of interest rates.
The purpose of this paper is to employ a contingent-claims methodology to
price multiclass commercial mortgage-backed securities that are of varying size
and whose mortgages are collateralized with imperfectly correlated assets. As
compared to RMBS valuation, the inclusion of property specific state variables for
each pooled mortgage adds considerable complexity to the valuation problem. We
will also consider a single factor interest rate process as a relevant state variable.
Consequently, there are up to N+1 state variables to consider: N > 1 property price variables and one interest rate process variable. Furthermore, by allowing for an
arbitrary correlation structure among collateral assets, we extend related models
of the multiple-asset security that specify either perfect positive correlation or
complete independence among collateral assets in the pool (e.g., Boot and Thakor
(1993)). To illustrate security valuation, we consider a stylized collateralized mortgage
obligation (CMO) security structure in which return of principal due to scheduled
loan amortization or early loan termination is distributed top-down to security- holders. That is, the most senior tranche has strict priority on all principal pay? ment cash flows until completely paid down. Once the face value of the senior
tranche is zero, all principal flows to the next highest ranking tranche until it too is
paid down, and so on. A further distinction between residential and commercial
mortgage-backed CMOs is that?due to the inability to insure against default on
commercial mortgages?the face amount of the lowest priority tranche is reduced
by the shortfall between loan balance and recovery when default occurs. Default
risk is, therefore, shifted down through the structure to the lower priority securities.
If default rates are high enough, there may be insufficient principal balance in the
first-loss securities to cover all losses, and shortfalls will have to be allocated to
successively higher tranches.
Childs, Ott, and Riddiough 583
Methodologically, neither a purely forward nor purely backward approach is entirely satisfactory when attempting to price the CMBS. The advantages of a forward (Monte Carlo) approach are its ability to handle multiple state variables and its ability to distribute cash flows to various payment classes, the priority of which
depends on historical allocations. A forward-looking approach is unsatisfactory, however, in its determination of optimal borrower default decision-making, which
requires the calculation ofthe value of waiting to default. Alternatively, contingent- claims models of whole commercial loan valuation like that of Titman and Torous
(1989) determine borrower default behavior endogenously and produce default risk
premiums that match observed premium levels quite nicely. However, valuation
problems with more than three state variables are intractable using their method, since numerical computation time increases exponentially with the number of state
variables. Moreover, a purely backward approach is not well suited to allocating
path-dependent cash flows to various CMBS tranches.2
Instead, we employ a combined backward/forward approach to CMBS valua?
tion that simultaneously reflects endogenous default decision-making by individual
borrowers and accurately allocates cash flows to various tranches, while avoiding the dimensionality problems associated with numerous state variables. In the first
stage of a two-stage modeling process, we determine the optimal default bound?
aries for individual borrowers whose mortgages are part ofthe CMBS pool. When
current property value exceeds the boundary value, the borrower continues repay-
ing the loan according to contract terms. Alternatively, hitting the boundary results
in default with the property value flowing into the pool as return of principal.3 The
second stage in CMBS valuation is to use a Monte Carlo approach to simulate state
variable paths. Utilizing the previously computed default boundary, realized paths determine cash flows that are allocated to the various tranches. Realized tranche
values are then calculated over a large number of Monte Carlo trials to determine
respective tranche prices. Finally, given the tranche price, a yield-to-maturity is
calculated and compared to the yield on a benchmark riskless bond to produce a
promised yield spread. We find that CMBS pricing is especially sensitive to several structural and
parameter value inputs. As expected, security design in terms of relative percentage tranche size is important. For parameter values used in this study, senior tranches
whose share is 70 percent or less of the total pool are found to be immune from
default loss, but not from the effect of early return of principal due to default.
Indeed, the senior security is exposed to cash flow timing risk, which results in
small but persistently positive yield spreads. Given our CMO payment structure,
2Assuming away the dimensionality issue for the moment, one could conceivably handle the allocation problem by first working backward through the pricing grid to determine boundary values, and then moving forward in the same grid to allocate and value cash flows. See Kau et al. (1993) for an application of this type with respect to pricing adjustable rate mortgages, whose cash flows depend on past interest rate state variable realizations.
3Our approach has some similarities with that of McConnell and Singh (1994), which determines a critical interest rate at which mortgage prepayment optimally occurs for each refinancing cost class at every point in time throughout the life of the mortgage. In contrast, we must determine a critical property price at which default occurs at each point in time throughout the life of the mortgages and for each feasible spot rate of interest that may occur at a given time t. Thus, McConnell and Singh determines critical interest rates over the mortgage term, whereas we determine a three-dimensional surface of critical property prices as a function of interest rates and time.
584 Journal of Financial and Quantitative Analysis
mezzanine level security classes are better protected against this cash flow timing risk in addition to being well protected against default loss risk. This generates the
surprising result that, insome scenarios, the senior securityholders may actually
require higher yield spreads than certain lower priority security classes. Lower priority tranches are found to be quite sensitive to variation in property
value and, therefore, to default risk. The correlation structure among collateral
assets in the pool, in particular, is found to be an important determinant of tranche
value. We find that better pool diversification (i.e., lower overall pooled cash
flow volatility) may actually lower tranche value to low priority classes that are
expected to be out-of-the-money with respect to full return of principal. This
occurs because the payoff function to low-rated security classes is convex over
the relevant range of likely asset value outcomes, thus suggesting that higher cash
flow volatility may actually increase security value. We also address the question of how large the securitized pool must be to realize most of the effects of asset
value diversification. In a pool in which loans have similar contractual features and
size characteristics, and where the underlying collateral asset values are at least
weakly positively correlated, we find that only five to 10 mortgages are needed for
the mezzanine and low-rated securities to largely realize diversification effects.
The remainder ofthe paper is organized as follows. The next section develops the pricing model and numerical solution methodology. Allocation of cash flows
among the prioritized payment classes also is discussed. Section III details the
pricing results, where we focus attention primarily on the relative effects of security
design and asset diversification. In the final section, we compare observed and
modeled yield spreads to summarize our findings.
II. Model Specification and Pricing Methodology
A. Mortgages and Underlying State Variables
Consider a pool that is composed of N > 1 commercial mortgages. Each
mortgage is secured by a single income-producing property. Property value, P, is
determined by the following system of log-normal stochastic differential equations,
(1) dP = p(P)dt + S(P)dZPi
where p(P) = [(af ? 6i)Pi\ is an JV-dimensional vector with ai denoting the total
expected return to property i and St the rate of dividend payout to the particular prop?
erty; S(P) isanNxN matrix with elements such that cov[ dPi, dPj] = pijO-iO-jPiPjdt,
Pij being the instantaneous correlation coefficient for changes in Pi and Pj, and
where at denotes the standard deviation of property returns to property i\ and ZP is
an N-dimensional standardized Wiener process. The covariance matrix of changes in state variables, SS', is restricted to be positive semi-definite.
Commercial mortgage values also depend on interest rates, which are assumed
to move stochastically. We model the entire term structure of interest rates using
Childs, OU, and Riddiough 585
the single-factor, square root model of Cox, Ingersoll, and Ross (1985b).4 The
specific form of the process is as follows,
(2) dr = k(v ? r)dt + or^/rdzr,
where r is the current spot rate of interest, k is the speed of reversion parameter, v is the long-run value towards which the spot rate is expected to revert, or is an
interest rate volatility parameter, and zr is a standardized Wiener process. Changes in interest rates may be also be correlated with changes in property prices. Denote
this instantaneous correlation coefficient as prj>v For simplicity, we let the market
price of interest rate risk equal zero.
Basic mortgage contractual provisions are as follows. Assume that each mort?
gage is nonrecourse and that there is no cross-collateralization among individual
mortgages in the pool with other mortgages either within or outside the pool.5 Consistent with Titman and Torous (1989), it is also assumed that prepayment will
not occur due to lock-out provisions specified in the mortgage contract. Default
is, therefore, the only early termination risk to consider with respect to security valuation. The mortgages are fixed rate and fixed payment, each with a continu?
ous rate of mortgage payment. The rate of mortgage payment in part depends on
the loan size relative to the property value, the contract rate of interest, the loan
term, and the period of time over which the loan amortizes.6 For simplicity, we
will assume that all mortgage contracts and initial property values in the pool are
identical.
B. Determination of Borrower Default Behavior
As a first step in CMBS pricing, individual borrower default decision criteria
must be established. Because each mortgage is independently collateralized by a unique asset, default decisions are made noncooperatively among borrowers in
the pool. Thus, each borrower will minimize each mortgage value by defaulting if property value falls to or below mortgage value (inclusive of the value of the
default option). In this subsection, we present mortgage value dynamics and the
boundary conditions under which default occurs.
Consider mortgage i,i= 1,...,N, whose value, Ml, is contingent on collateral
property price, Pi9 the risk-free spot interest rate, r, and current time t, where time
left until loan maturity is r = T ? t. Standard arguments that incorporate the state
4McConnell and Singh (1994) has examined the sensitivity of residential MBS price to alternative single factor interest rate model specifications and found that pricing differences are small, as long as the current term structure is adequately duplicated. In our application, in which the mortgage termination decision is even less sensitive to changes in interest rates (as compared to prepayment decisions with residential loans), particular model specification matters even less. Hence, we choose a process that is likely to be familiar to most readers.
5Cross-collateralization is sometimes known to occur in CMBS. This type of contract could be han- dled using our pricing methodology by recognizing that multiple mortgages, once cross-collateralized, can be treated as one "bundled" mortgage with its own unique set of risk characteristics. See Childs et al. (1996) for further background.
6The rate of mortgage payment also depends on state variable parameters and default boundary conditions as they impact mortgage value, factors that we discuss shortly.
586 Journal of Financial and Quantitative Analysis
variables shown in equations (1) and (2) result in the following mortgage pricing
equation,
(3) 1/2(72P2M|,.P. + OiPiOr^prjMif, + 1 /2ofrMlrr
+ (r~8i)PiMiP. + K(v--r)Mir + Mit + mi = rM\
where subscripts on Ml denote partial derivatives, m,- is the continuous rate of
payment for mortgage /, and each property is assumed to be a traded security.7 At the beginning of the loan term (t = 0), we assume that the mortgage coupon rate is set such that the mortgage value, Ml(Pt, r, 0), equals the initial loan balance,
Fi(0). In other words, a stated coupon rate of interest, c? is chosen such that the
continuous rate of mortgage payment, m,-, results in debt that is valued at par at
loan origination. Default boundary conditions are now specified as follows.8 At loan maturity
(i.e., t = T), mortgage value is mm{Fi(T),Pi}, where Ft(T) = Ml(Pi,r,T)>0 is
the balloon payment required at loan maturity. Thus, the maturity default condition
is
(4) Final Payment: Pt > Ft(T),
Default: Pt < P*(r,T) = Ft(T),
where Pf(r, T) is the critical property value at or below which default optimally occurs. Prior to loan maturity, the default-free boundary condition that determines
whether continued payment or default occurs is
(5) Continued Payment: Pt > Ml (Ph r, t),
Default: Pt < P*(r,0 = M^P^rj),
where Pf(r,t) is determined endogenously. Note that, in lieu of satisfaction of
the stated loan terms, debtholders receive the property value as return of principal when the default condition holds.
Thus, for any feasible pair (r, t), there exists an iV-dimensional vector of
critical property values, P*(r, t) = [P*(r, t)]. This vector of critical property prices, which is found using the traditional backward pricing equation approach, can now
be used to determine the return of individual mortgage principal and interest as it
flows into the total mortgage pool.
7 "Standard arguments" include assumptions requiring that the assets are continuously tradable at no cost, and that they can be sold short. These assumptions obviously do not perfectly describe commercial real estate asset and debt markets. However, if markets are dynamically complete, an alternative (and perhaps more realistic) set of assumptions could be used to determine a (slightly modified) pricing equation. See, for example, Grenadier ((1995), p. 304) for a discussion of similar issues in the context of asset leasing markets.
8 See Titman and Torous (1989) for a complete set of boundary conditions needed to fully specify the pricing problem. Like Titman and Torous, we ignore the costs of borrower and lender default in the pricing of commercial real estate debt. Although these respective costs may be significant, their effects are offsetting so that the net impact on debt value may be trivial. In lieu of any empirical evidence to the contrary, we choose to keep the analysis as simple as possible. Including these costs, if desired, would be straightforward.
Childs, Ott, and Riddiough 587
C. Realized Mortgage Cash Flows
The accounting of individual mortgage and aggregated pool cash flows is
discussed in this subsection. Since repayment decisions are made independently on
each mortgage within the pool, pooled cash flows are simply the sum of individual
mortgage cash flows. In classifying and prioritizing these cash flows, a continuous
time approach is presented to be consistent with the theoretical determination of
mortgage price and default boundary discussed above. It is important to note
the distinction between continuous rates of scheduled mortgage payment and the
discrete payments that follow from either a balloon payment at the end of the
loan term or a property value recovery due to default. Much of the following discussion is structured based on this dichotomy between continuous flows and
discrete payments. Let A(t) be the set of indexed numbers associated with mortgages that are still
active at time t.9 Let Fn(t) be the remaining loan balance of mortgage n, where
n ? A(t).10 At this time, the total rate of continuous cash flow to the pool is the sum
ofthe mortgage payment rates coming from active individual mortgages. That is,
(6a) TFPL(0 = ^ mn.
nGA(t)
The total rate of cash flow can be decomposed into a rate of interest cash flow (IF)
and, if the loan is amortizing, a rate of principal cash flow (PF). These flow rates
at time t can be expressed as
(6b) IFPL(r) = 5] cnFn(t),
nGA(t)
(6c) PFPL(0 = TFPL(0 - IFPL(0.
Now consider the receipt of discrete cash payments. Each mortgage has at
most one discrete cash payment that occurs during the life of the loan. If the loan
repay s as scheduled and is not fully amortizing, a balloon payment ofthe remaining loan balance is made at time T. If, on the other hand, a particular loan defaults at
some time *jf < T, the property is recovered with value P*(r, fy and an accounting loss of Ln(4) = Fn(4)
- Pn(r, 4) is realized.11 For any other time t ? ff, Ln(t) = 0.
Thus, for a particular active mortgage n at some time t, 0 < t < T, the discrete
payment to the mortgage is
Fn(t), ift = T and if mortgage n G A(T)
(7) DPn(0 = {P*n(r,ti), if t = 4<T
0, ifr^ rfandif t? T.
9For example, ifN = 6, then A{t) = {1,3,4,6} would indicate that mortgages indexed as 2 and 5 have previously defaulted.
10This loan balance is given by Fn(i) = (mn/cn)[\ - e'0^7'^], where cn is the endogenously determined mortgage rate of interest and f > T is the term over which the loan is amortized.
11 Because the analysis is done in continuous time, no interest will have accumulated from the last payment date to the default date. If the analysis were to occur in discrete time, the loss would also be adjusted for the interest owed since the last payment. An accounting of interest owed in discrete time?an amount that is added to the realized loss?is important since this interest must be made available to tranche investors who are promised their scheduled interest payment over the relevant time increment.
588 Journal of Financial and Quantitative Analysis
Summing the individual discrete payments and accompanying losses occurring at
time t results in pooled discrete payments and losses, which can be stated as
(8) DPPL(0 = ]TDPn(0,
nGA(t)
(9) LPL(r) = ]TLn(0.
n?A{t)
D. Allocation of Pooled Cash Flows to Each Security
We will consider a CMBS with three principal-based investment classes
(tranches)?which we label as senior, mezzanine, and junior?and a residual in?
terest only (10) class.12 Cash flow accounting of principal and interest to the
various tranches is somewhat involved. In general, the highest priority tranche
receives interest on the remaining tranche face value and all pooled principal until
retired (where principal includes scheduled amortization from nondefaulted loans
and unscheduled property recoveries from loan defaults). Lower priority tranches
receive interest only until each sequentially becomes the highest ranking remain?
ing tranche. The residual 10 tranche?whose cash flow is affected by historical
principal allocations?is not part ofthe principal allocation scheme since its stated
face value is zero.
Commercial mortgage-backed security investors, unlike their residential MBS
counterparts, must account for shortfalls in return of principal due to borrower
default. Although principal is allocated top-down, default loss?the difference
between mortgage loan balance and property value at the time of default?is al?
located bottom-up. Default losses, therefore, reduce the face value of the lowest-
rated principal-based tranche, which, in turn, reduces scheduled interest payments
going forward. If default losses cumulatively exceed the face value of the lowest
rated tranche, losses are then allocated to the next highest ranking tranche until
fully allocated.13
We will now formalize the accounting of prioritized cash flows. The face
value ofthe pooled mortgage debt is FPL(0 = Y^i Fi(f)> 0<t<T. Att = 0, this
amount is allocated among the three principal-based investment classes that we
consider?senior, mezzanine, and junior?such that Fs(t)+FM(t)+Fj(t) < FPL(t). This relationship will continue to hold for all t > 0 due to allocations of principal and default losses.14 Let cs, cM, and cj be the coupon rates for the principal-based tranches. These coupon rates must satisfy max{cs, cm, cj} < min{ei,..., cx} to
guarantee that sufficient pooled interest cash flow is available for distribution as
interest to the principal-based tranches.
12Of course, other structures are possible. For example, a finer tranche structure is certainly feasible and is quite often employed. If the pool is over-collateralized, a residual principal tranche will also be included.
13We have considered the possibility that there could be excess principal once the pool is retired. This would occur if mortgage values are such that default occurs when property values in sum exceed the mortgage balances. We have performed simulations that verify that state realizations of this type do not occur given the interest rate process assumed in equation (2).
14This inequality is strict when the pool is "overcollateralized," in the sense that issued principal claims are less than the aggregate pool balance. We do not consider a residual principal tranche, so the face value relationship above holds with equality in our subsequent analysis.
Childs, Ott, and Riddiough 589
The rate of continuous cash flow to the pool as of time t can now be sequen?
tially allocated to the various tranches from top to bottom. This rate of continuous
income flow is composed of principal and interest, of which we consider principal first,
(10a) PF5? = (PFPL?*
iW)>0.
[ 0, otherwise
(10b) ?FM(t) = (PFPL?> iW> = 0 and *??(*) >0
(0, otherwise
(10c) PFy(0 = JPFPLW' if Ps(t) = FM(t) = 0
{0, otherwise.
Notice that the entire rate of principal cash flow is to the senior tranche until it is
retired. Once paid off, priority of principal allocation shifts to the next most senior
tranche, and so on.
The total rate of continuous cash flow to any principal-based tranche is simply the sum of the flow rate of payments from interest and principal. Thus,
(11a) TFe(0 = cQFQ(t) + ?FQ(t), for Q e {S,M,J}.
The rate of cash flow to the residual interest-only tranche also must be ac-
counted for. This rate of cash flow is
(11b) TFIO = IFPL - csFs(t) - cMFM(t) - cjFj(t).
The 10 cash flow rate will generally decline over time as the total pool balance
declines through scheduled amortization and return of principal through defaults.
Next consider the discrete cash payments. Discrete principal payments are
allocated to the most senior tranche first. Any discrete principal payment amounts
in excess ofthe remaining face value ofthe more senior tranche goes toward paying down the next most senior tranche. Formally, this prioritization is expressed as
(12a) DP5(f) = min{F5(f),DPPL(f)},
(12b) DPM(0 = min{FM(0,DPPL(f)-DP5(f)},
(12c) DP7(f) = DPPL(f) - DP5(0 - DPM(0,
(12d) DPIO(r) = 0.
As previously discussed, losses associated with loan default must be allocated
to the most junior tranche first. If the default loss allocation exceeds the remaining face value, the tranche is simply eliminated and any remaining loss is shifted to the
next higher ranking tranche. The formal prioritization of losses occurs as follows,
(13a) Lj(t) = min{F7(r),LPL(r)},
(13b) LM(t) = mm{FM(t),LPL(t)-Lj(t)},
(13c) Ls(t) = LPL(r) - Lj(t) - LM(t).
Finally, the face values of the respective tranches can be adjusted once the
above allocations are known. The face value ofa tranche at time t is the original face
590 Journal of Financial and Quantitative Analysis
value less the cumulative continuously paid principal to date, less the cumulative
where s e [0, t] indicates the points in time at which discrete payments occur.15
E. Tranche Valuation and Numerical Solution Technique
Respective CMBS tranches can now be valued. Based on the CMO cash
flow allocation structure defined above, expectations regarding tranche cash flow
at each point in time over the debt term can be formed. These expected cash flows
reflect boundary conditions previously discussed in terms of the scheduled rate
of cash flow principal and interest and the discrete return of principal through a
balloon payment or through mortgage default. By Lemma 4 of Cox, Ingersoll, and
Ross (1985a), the value of a particular tranche or residual piece at time t can be
expressed as
(15) VQ(P,r,t) = Ep,, Tp
- J r(u)du -
J r(u)du / TFQ(s)e
* ds + ]T DPQ(s)e >
J rcr?n s?l*,r\
where Q ? {S,M,J,10} indexes the payment class under consideration, and the
expectation is taken with respect to the risk-adjusted state variable processes. To implement the valuation ofthe mortgage-backed securities, we extend the
two-stage technique of McConnell and Singh (1994) to handle N+1 state variables.
In the first stage, individual mortgages are valued using dynamic programming. The second stage utilizes Monte Carlo simulation to value the securities, given the
mortgage rates and default boundaries obtained from the first stage. This technique is now explained in more detail.
Since borrower default decisions are made on a loan-by-loan basis indepen?
dently ofthe other borrowers, individual mortgage value and the respective default
boundary depend only on interest rates and the collateral property price. Thus,
the first stage is made up of N dynamic programming problems, each with two
(potentially correlated) stochastic variables. Notice that computation time is, at
worst, linear in the number of properties. Each dynamic program uses the method
of Hull and White (1990) and iterates over the mortgage rate until the loan is priced at par.16 For each time and interest rate pair, cubic interpolation is used to find the
default boundary P*(r, t).
15The discrete payments and losses are nonzero at most N times over the life ofthe pool, so the sum of cumulative discrete payments and losses over [0, t] is well defined.
16McConnell and Singh (1994) use the implicit finite difference method in their dynamic program? ming stage. In our problem, an extra stochastic variable (property price) is required, which significantly complicates the problem. The multidimensional technique found in Section V of Hull and White (1990) is well suited for our problem due to its relative ease of implementation and the fact that the method is stable and converges to the "true" contingent-claim value. Additional technical background regarding our valuation technique is shown in the Appendix.
Childs, Ott, and Riddiough 591
The second stage uses the Af respective mortgage rates (which are all the
same in our simulations) and V x W element matrices (V = T/At, W = (rmax -
r^^/Ar) of critical property prices to perform a Monte Carlo simulation in which
expected cash flow allocations and subsequent tranche values for the CMBS are
determined.17 For each trial, a path of N property price and one interest rate
states?all of which may be correlated with one another?is created by sampling the risk-adjusted versions of the distributions specified in equations (1) and (2). Default occurs if realized property value fails to the default boundary; otherwise
payments occur as scheduled.18 Cash flows are allocated and tranche balances are
calculated as discussed in the previous subsection. To determine current payment class values, cash flows are discounted to the present based on the path of spot interest rates. Thus, for each completed trial (i.e., state variable sample path realizations and cash flow allocations through time T), a realized investment value
is obtained for each of three standard investment classes and the residual 10 tranche.
A total of 10,000 Monte Carlo trials are generated to ensure sufficient convergence to the "true" tranche values (as expressed in equation (15)).19
For ease of comparison, rather than state security class values, Vq, given a
coupon rate of payment, cQ, for each tranche, we will state the required yield spread above that associated with a benchmark riskless bond. Determining the promised
yield-to-maturity to a particular security requires making an internal rate of return
calculation based on the tranche value obtained in equation (15), with future cash
flows to each tranche being generated under the assumption that they are received
as promised (i.e., no defaults occur). Calculating the benchmark yield for each
security class requires using the simulation to estimate expected cash flow at each
payment date over the security's life, where the "riskless" bond price is calculated
by assuming the expected cash flows are certain cash flows. The benchmark yield-
to-maturity is calculated using the "riskless" bond price and the expected cash
flows.20 To test for sensitivity of payment class value, yield spreads are generated for a variety of CMBS security structures, mortgage contract specifications, and
state variable parameter values.
nrmin js generally positive rather than zero since, given the mean-reverting process of Cox, Ingersoll, and Ross (1985b), the Hull and White (1990) method that we implement during the first stage has only nondownward branching when r becomes small enough. The quantity r"1** is also finite, for analogous reasons.
18 As part of the first stage, interpolation is done across property prices to establish the boundary of the continuation region for each interest rate in the grid. A similar interpolation is performed for interest rates that do not fall exactly on the interest rate node value.
19To ensure the accuracy ofthe numerical solutions at 10,000 trials, simulations with up to 50,000 were performed?which yielded no qualitative differences in the results. Solutions to the CMBS tranche values are obtained using a discretized version ofthe two-step procedure described previously. In doing so, we consider 48 time steps per year. Because all of the individual mortgages are priced at par, initial pool value equals the face value of the mortgages comprising the pool. We have verified that the value of the individual tranches add up to the total pool value. Indeed, in all parameter value cases considered in this paper, the sum of all tranche values obtained through Monte Carlo analysis are within 0.10 percent ofthe total pool value determined in the first stage ofthe numerical analysis.
20Note that the benchmark riskless yield is computed based on the expected effects of default on the timing ofthe cash flows. This expected cash flow approach provides a superior measure of yield spread as compared to simply calculating a benchmark yield based on anticipation of promised cash flows. For example, in an upward sloping term structure environment, use ofa benchmark based on promised as opposed to expected cash flows will generally downwardly bias the measure of yield spread.
592 Journal of Financial and Quantitative Analysis
III. Pricing Results
A. Mortgage Contract, Parameter Value, and Security Design
Specification
Valuation solutions are obtained by making the following model input as?
sumptions. We examine a pool of N = 6 commercial mortgages, where all mort?
gage contract specifications are identical to one another.21 Each of these mort?
gages is originated at a 75-percent loan-to-value ratio. The loan term-to-maturity is seven years, with payments amortized over a 25-year term. Properties securing these mortgages are assumed to have a dividend payout rate of 8.5 percent. Two
alternative property volatility structures are considered: 07 = 0.15 and 07 = 0.20, i = \,...,N. We also examine three relatively straightforward correlation struc?
tures among properties: py = 0, py = 0.5, and py = 1, for i ^ j, i,j = l,...,N. Two interest rate/property price correlation cases are also considered: pr,pt
= 0
and prtp. = 0.2, i = 1,...,N9 respectively. Lastly, required yield spreads are calcu?
lated under two different term structure of interest rate environments: one that we
refer to as steep and the other that we refer to asflat. Fixing n = 0.25, v - 0.09,
or = 0.075 (see equation (2)), a lower initial spot rate of interest, ro = 0.06, will
provide a steeper term structure while a higher initial spot rate of interest, r0 = 0.09,
generates a flatter term structure. All ofthe loan contract/parameter combinations
considered are consistent with values observed in the marketplace.22 For each of these loan contract/parameter value combinations, a required yield
spread is calculated for three principal-based investment classes and an interest-
only investment class. Security structure, expressed as a percent ofthe pool allo?
cated to each principal-based investment class, is Fs(0):Fm(0):Fj(0) = 70:10:20,
70:20:10, and 70:25:5. A 70-percent share for the senior tranche is commonplace, so we hold this number constant. We vary the relative share between the mezza?
nine and junior tranches to examine price sensitivity as the junior piece becomes
increasingly risky (i.e., as its share percentage declines). Coupon rates paid to
each ofthe respective tranches depend on the shape ofthe term structure of inter?
est rates, and are chosen such that the senior tranche approximately prices at par.
21 Typical pool sizes range from one to several hundred mortgages. We choose N = 6 to balance two
opposing considerations. On one hand, because fundamental valuation behavior can be reflected with only a small number of pooled mortgages (e.g., pool diversification effects are largely realized with five to 10 mortgages), we can keep AT relatively small. On the other hand, we want to consider a pool that is larger than N = 3 to demonstrate the model's ability to efficiently handle many state variables.
22Loan-to-value ratios in the 75-percent range with seven-year terms-to-maturity are commonplace in the commercial mortgage marketplace, as are partially amortizing loans. This contract structure is also consistent with studies of whole loan commercial mortgage pricing (e.g., Titman and Torous (1989), Childs et al. (1996)). A dividend payout rate of 8.5 percent is consistent with recent commercial mortgage capitalization rates as reported by the American Council of Life Insurers (see Holland et al. (1995)). Property volatilities in the 15- to 20-percent range are in line with recent experience (again, see Holland et al. (1995)). Hartzell et al. (1986) examines the correlation structure of alternative property types (e.g., office, retail, industrial, etc.) and finds correlations that are generally between 0 and 0.50. We consider perfect positive correlation among property types as an extreme case with which to compare these other structures. The correlation between changes in short-term interest rates and commercial real estate prices has been found to be near zero (e.g., Goetzmann and Ibbotson (1990)). As a result, we consider correlations of 0 and 0.20. Alternative term structures are in line with recent experience and are considered because default risk premiums are shown to differ purely based on the shape ofthe yield curve (again, see Titman and Torous (1989)).
Childs, Ott, and Riddiough 593
The coupon rates are cs = 0.075, cm = 0.080, and cj = 0.080 in the steep term
structure case, and are c$ = 0.090, cM = 0.095, and cj = 0.095 in the flat term
structure case.23
B. Numerical Results
We first discuss senior tranche yield spreads. Table 1 shows yield spreads are small, ranging from eight to 20 basis points. At a 70-percent pool share, this payment class is, for all practical purposes, immune from default loss risk, which results in a relative lack of yield spread variability over property volatility and property correlation structure. The positive spreads are due to the stochastic
nature of interest rates. As seen from the default boundary condition specified in
equation (5), higher probabilities of borrower default correspond to low interest
rate realizations. Given the greater propensity of borrower default for low interest
rate outcomes, the senior securityholder experiences a return of principal that
resembles interest rate call risk. This effect is factored into the security's yield. Therefore, although the senior tranche may be immune from default loss, it is not
immune to the effects ofthe early return of principal that follow from loan default.
This call risk effect is also responsible for the slight decrease in yield spread as pool diversification decreases (i.e., as pij ?? 1) and the slight increase in yield
spread as interest rate/property value correlation increases (i.e., as prj>{ ?? 0.2) Since there is a substantial probability that the entire pool pays off as promised when pij = 1, the loans that comprise the pool are slightly less vulnerable to
economy-wide interest rate effects on default risk. On the other hand, a well
diversified pool results in a potentially wide dispersion of property values and,
therefore, greater potential sensitivity to the impact of interest rate on borrower
default and ultimately security cash flows. In the case of interest rate/property value
correlation, positive correlation means that lower property prices are more likely to be accompanied with higher debt values. This results in higher probabilities of
yields to compensate for this increased "call" risk.
Required yield spreads for the mezzanine tranche are shown in Table 2. First
notice that the spread increases as the mezzanine tranche share increases. Because
almost all of the default risk in the pool is shifted to the lower 30 percent of
the pool (encompassing both the mezzanine and junior tranches), an increasing mezzanine share reduces the default "buffer" provided by the first-loss piece to
result in a higher risk security. Also, observe the rather sharp differences in required
yield spread as a function of property value correlation structure. For certain
parameter value combinations, these spreads are seen to vary by more than 200
basis points strictly as a function of collateral asset correlation structure. Because
the mezzanine tranche is buffered against default loss risk, its return-of-principal
payoff function is typically concave over the relevant region. Increased property
23 As discussed earlier, the tranche coupon rates are restricted to be less than the equilibrium rate paid on any of the mortgages in the pool. The minimum endogenously-determined risky whole mortgage rate in the steep term structure environment is 0.0819, and in the flat term structure environment is 0.0958. Both of these rates result from parameter values 07 = 0.15 and prj>. = 0.
594 Journal of Financial and Quantitative Analysis
TABLE 1
Required Spreads above Benchmark Yield as a Function of Term Structure Environment, Asset Price-lnterest Rate Correlation, prP., Asset Price Volatility, <7;y, and Asset Price
Correlation, pjf. Senior Tranche
Required yield spreads above the benchmark yield are reported for a variety of state variable parameter values. The benchmark yield is determined assuming that the expected cash flows to the security match those of an otherwise identical riskless bond, and varies as a function of the term structure of interest rates and other parameter values used in a given simulation. Parameter values apply to every property in the pool (of which there are N = 6). A security structure in which the senior tranche is allocated 70 percent of the pool is assumed. All mortgages in the pool are seven years in term, partially amortizing over a 25-year term, and have 75-percent initial loan-to-value ratios. The payout rate on each property, 6,-, is assumed to equal 0.085. Interest rate parameter values are as follows: Steep term structure: k - 0.25, v = 0.09, or = 0.075, r0 = 0.06; flat term structure: k = 0.25,i/ = 0.09, ar = 0.075, Tq = 0.09. Time increments are At = 1/48. The coupon rates paid to the senior, mezzanine, and junior tranches are 0.075, 0.08, and 0.08, respectively, for the steep term structure; and, 0.09, 0.095, and 0.095, respectively, for the flat term structure.
diversification?resulting in decreased pooled cash flow volatility?is, therefore, beneficial in terms of increasing the likelihood of full return of principal.
Interestingly, when the junior security has a 20-percent pool share and when
the pool is well diversified in the sense that p^ = 0, / ^ j, yield spreads are
actually lower than spreads associated with the senior security. This is due to
two related structural effects. First, in this case, the mezzanine security is fully
protected against default losses. Second, due to the senior tranche having priority on return of principal, the mezzanine security is also insulated from cash flow tim?
ing uncertainty that follows from default-induced return of principal. The result
is a security that is (essentially) fully protected against both default loss risk and
default-related call risk.
Other parameter value effects on mezzanine tranche pricing are as follows.
Primarily due to the impact of default loss risk, required yield spreads are higher when property volatility increases from cr; = 0.15 to 07 = 0.20. A similar outcome
results when pr>p. increases from 0 to 0.2. There are also significant differences
depending on the shape of the yield curve. To see this, recall that both term
structures have the same long-term rate parameter of v - 0.09. The initial spot rate
is much lower in the steeper term structure environment; hence, expected discount
rates over the life of the seven-year loan are higher in the flatter term structure.
Required Spreads above Benchmark Yield as a Function of Term Structure Environment, Asset Price-lnterest Rate Correlation, prPj, Security Structure, Asset Price Volatility, ay,
and Asset Price Correlation, p7y: Mezzanine Tranche
Required yield spreads above the benchmark yield are reported for a variety of state variable parameter values and security structures. The benchmark yield is determined assuming that the expected cash flows to the security match those of an otherwise identical riskless bond, and varies as a function of the term structure of interest rates and other parameter values used in a given simulation. Parameter values apply to every property in the pool (of which there are N = 6). For each of these parameter value constellations, three security structures are examined: 70:10:20, 70:20:10, and 70:25:5 percentage splits between the senior, mezzanine, and junior tranches, respectively. All mortgages in the pool are seven years in term, partially amortizing over a 25-year term, and have 75-percent initial loan-to-value ratios. The payout rate on each property, 6,-, is assumed to equal 0.085. Interest rate parameter values are as follows: Steep term structure: k = 0.25, v = 0.09, oy = 0.075, rQ = 0.06; flat term structure: k, = 0.25, ^ = 0.09, oy = 0.075, r0 = 0.09. Time increments are At = 1/48. The coupon rates paid to the senior, mezzanine, and junior tranches are 0.075, 0.08, and 0.08, respectively, for the steep term structure; and, 0.09, 0.095, and 0.095, respectively, for the flat term structure.
paribus, since the present value impact of default loss is lower when discount rates
are higher. Now consider the junior (or first-loss) tranche results shown in Table 3. This
tranche is quite sensitive to security structure, where decreasing the pool share
results in a higher likelihood that it will be out-of-the-money in terms of receiving substantial repayment of principal. Also note that the magnitude of these spreads
596 Journal of Financial and Quantitative Analysis
is typically rather high, with required yields-to-maturity that can easily exceed returns expected to the underlying collateral asset.
TABLE 3
Required Spreads above Benchmark Yield as a Function of Term Structure Environment, Asset Price-lnterest Rate Correlation, prPj, Security Structure, Asset Price Volatility, o-^,
and Asset Price Correlation, Pif Junior Tranche
Required yield spreads above the benchmark yield are reported for a variety of state variable parameter values and security structures. The benchmark yield is determined assuming that the expected cash flows to the security match those of an otherwise identical riskless bond, and varies as a function of the term structure of interest rates and other parameter values used in a given simulation. Parameter values apply to every property in the pool (of which there are N = 6). For each of these parameter value constellations, three security structures are examined: 70:10:20, 70:20:10, and 70:25:5 percentage splits between the senior, mezzanine and junior tranches, respectively. All mortgages in the pool are seven years in term, partially amortizing over a 25-year term, and have 75-percent initial loan-to-value ratios. The payout rate on each property, 6j, is assumed to equal 0.085. Interest rate parameter values are as follows: Steep term structure: k = 0.25, v = 0.09, ar = 0.075, r0 = 0.06; flat term structure: k = 0.25,1/ = 0.09, ar = 0.075, r0 = 0.09. Time increments are At = 1/48. The coupon rates paid to the senior, mezzanine, and junior tranches are 0.075, 0.08, and 0.08, respectively, for the steep term structure; and, 0.09, 0.095, and 0.095, respectively, for the flat term structure.
Perhaps the most notable aspect of our results concerns the effect of property value correlation on junior tranche yield. As the pool becomes better diversified,
required yields generally increase substantially.24 The intuition for this result
24This volatility effect with subordinated debt was first recognized by Black and Cox (1976). The difference between our finding and theirs is that correlation structure between multiple assets is re-
Childs, Ott, and Riddiough 597
follows from a recognition that the return-of-principal payoff function for the junior tranche has characteristics similar to an out-of-the-money call option. Expected losses do not change as a function of correlation structure, but the variance of
these losses does change. The cost of increased pool cash flow volatility is slight, due to payoff function convexity and the fact that the junior piece is expected to
be out-of-the-money with respect to full return of principal. However, the benefit
to higher pool cash flow volatility is that there is an increased probability of low
losses?which results in a higher expected payoff and, therefore, decreases the
required yield to this security. Not surprisingly, the correlation structure effect is
strongest when the first-loss piece has the low 5-percent share.
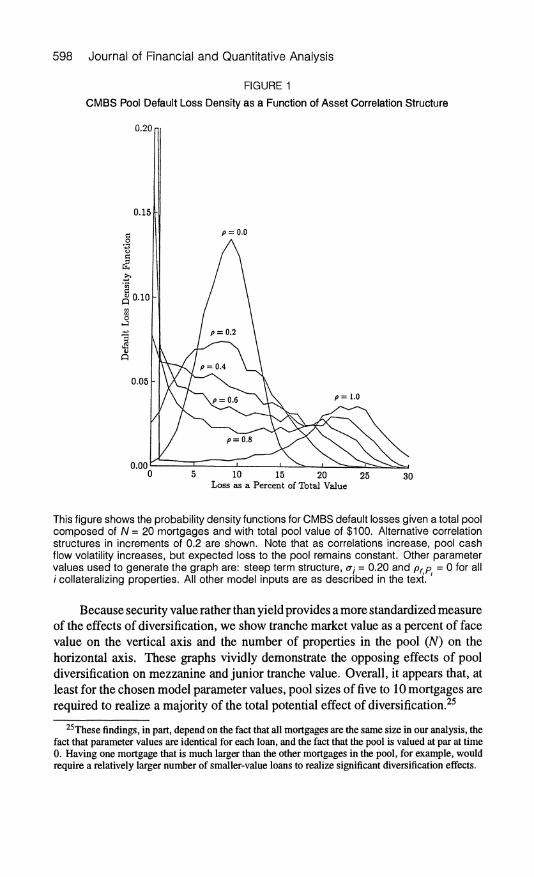
To see the out-of-the-money option analogy more precisely, in Figure 1, we
show the loss density function on a $100, Af = 20, CMBS pool for alternative
property value correlation structures. Due to the central limit theorem, the zero
correlation case turns out to be approximately normally distributed with a loss
density mode of about $8. As correlations between collateralizing assets increase, the loss density function shows greater variance?and eventually becomes bimodal
as asset correlations approach one. Indeed, given a pool composed of perfectly correlated collateral assets (or equivalently, a single-asset CMBS), default risk is
literally all or nothing?where the probability of zero losses is quite high. As
a result, first-loss tranche value is higher?and, therefore, required spreads are
lower?when cash flow volatility as determined by property value correlation
structure is higher.
Lastly, yields-to-maturity for the 10 residual tranche are shown in Table 4.
Except for property volatility, cr,?which has a powerful effect on the expected
timing of loan termination?yield spreads are relatively insensitive to alterna?
tive mortgage/CMBS pool design or economic environment. For example, given tranche coupon rates used in this study, allocation of cash flow within the vari?
ous principal-based tranches has little effect on 10 price. Similarly, yield spread is
fairly insensitive to differences in property value correlation, although the property value correlation/call risk effect described with senior security pricing is respon- sible for having a slight impact on pricing.
Summing up, these results suggest that the correlation structure of proper? ties underlying the pooled mortgages plays a significant and rather unique role
in CMBS pricing, especially when compared to more well-known asset-backed
securities. Because of the prioritization of losses on a bottom-up basis, better pool diversification can actually reduce first-loss tranche value due to principal payoff function convexity and the out-of-the-money nature of this security. On the other
hand, the investors in higher priority pieces will generally find that better pool di?
versification increases value since lower cash flow volatility reduces the likelihood
that losses will ever be allocated to their tranche.
Given these rather substantial diversification effects, a natural follow-up ques? tion is: how many individual mortgages in a CMBS pool are required to realize
most of the effects from asset diversification? We answer this question with Fig? ure 2, given several different security design and correlation structure combina?
tions.
sponsible for our pricing outcomes, whereas volatility of a single asset drives the pricing results in the Black and Cox model.
598 Journal of Financial and Quantitative Analysis
FIGURE 1
CMBS Pool Default Loss Density as a Function of Asset Correlation Structure
0.20 ni
10 15 20 Loss as a Percent of Total Value
25 30
This figure shows the probability density functions for CMBS default losses given a total pool composed of A/= 20 mortgages and with total pool value of $100. Alternative correlation structures in increments of 0.2 are shown. Note that as correlations increase, pool cash flow volatility increases, but expected loss to the pool remains constant. Other parameter values used to generate the graph are: steep term structure, 07 = 0.20 and prp = 0 for all / collateralizing properties. All other model inputs are as described in the text
'
Because security value rather than yield provides a more standardized measure
of the effects of diversification, we show tranche market value as a percent of face
value on the vertical axis and the number of properties in the pool (AO on the
horizontal axis. These graphs vividly demonstrate the opposing effects of pool diversification on mezzanine and junior tranche value. Overall, it appears that, at
least for the chosen model parameter values, pool sizes of five to 10 mortgages are
required to realize a majority ofthe total potential effect of diversification.25
25These findings, in part, depend on the fact that all mortgages are the same size in our analysis, the fact that parameter values are identical for each loan, and the fact that the pool is valued at par at time 0. Having one mortgage that is much larger than the other mortgages in the pool, for example, would require a relatively larger number of smaller-value loans to realize significant diversification effects.
Childs, Ott, and Riddiough 599
TABLE 4
Required Spreads above Benchmark Yield as a Function of Term Structure Environment, Asset Price-lnterest Rate Correlation, prPj, Asset Price Volatility, a\j, and Asset Price
Correlation, p7y: Interest-Only Tranche
All Security Structures
?~ij Pij
0 0.15 0.5
1
0 0.20 0.5
1
Range for Benchmark Yield
Required yield spreads above the benchmark yield are reported for a variety of state variable parameter values. The benchmark yield is determined assuming that the expected cash flows to the security match those of an otherwise identical riskless bond, and varies as a function of the term structure of interest rates and other parameter values used in a given simulation. Parameter values apply to every property in the pool (of which there are N = 6). The interest-only tranche is allocated residual interest after the principal-based tranches receive their coupon interest. As a result, yield spread is independent of percent allocation between the mezzanine and junior tranches when their stated coupon rates are equal (which is the case in these simulations). All mortgages in the pool are seven years in term, partially amortizing over a 25-year term, and have 75-percent initial loan-to-value ratios. The payout rate on each property, 6j, is assumed to equal 0.085. Interest rate parameter values are as follows: Steep term structure: k, = 0.25, v - 0.09, oy = 0.075, r0 = 0.06; Flat term structure: k = 0.25, v = 0.09, ar = 0.075, r0 = 0.09. Time increments are At = 1/48. The coupon rates paid to the senior, mezzanine, and junior tranches are 0.075, 0.08, and 0.08, respectively, for the steep term structure; and, 0.09, 0.095, and 0.095, respectively, for the flat term structure.
IV. Summary and Discussion
This paper considers the valuation of a new and increasingly important class
of structured debt: the commercial mortgage-backed security. These securities
present a unique set of valuation issues that differ sharply from those associated
with most other asset-backed securities?most notably, the residential MBS. An
appropriate determination of default risk is critical to accurate CMBS pricing, which means that property value underlying each mortgage in the pool must be
considered as a state variable. To value such a security, we employ a combined
backward/forward simulation approach. This allows us to exploit the indepen? dence of borrower default decisions and, consequently, to overcome dimensional?
ity problems associated with a large number of state variables.
Using data adopted from Duff & Phelps (1994) and Corcoran (1995), Table
5 shows that our model provides prices and yields that are generally in line with
yields observed in the marketplace, although with some apparent differences. For
example, given the parameter values employed in this study, our analysis indicates
that senior investment classes that are allocated 70 percent or less ofthe loan pool are essentially free from default loss risk, which suggests pricing comparable to
600 Journal of Financial and Quantitative Analysis
FIGURE 2
The Effect of Pool Size and Asset Correlation Structure on Tranche Value
5 10 15 Number of Properties
*5 80
| 60 4> S 40
?a 20 >
o,
Correlation = 0.5, 70:10:20 Mezzanine
y Senior
Junior
5 10 15 Number of Properties
Correlation = 0, 70:20:10 Senior
5 10 15 Number of Properties
5 10 15 Number of Properties
Correlation = 0, 70:25:5
5 10 15 Number of Properties
5 10 15 Number of Properties
Six graphs are shown for different combinations of security structure and correlation struc? ture among properties. The number of properties in the pool is shown on the horizontal axis and tranche value as a percent of face value is shown on the vertical axis. Other parameters used to obtain these graphs are: steep term structure, 07 = 0.20 and prp. = 0 for all / collateralizing properties. All other model inputs are as described in the text.'
a AAA-rated corporate bond. Currently observed yield spreads of 70-100 basis
points on senior CMBS investment classes suggest that there may be other non-
default risks to consider or that pricing may be conservative given investor and
rating agency unfamiliarity with this new debt security. To the extent that the
latter effect is relevant, we should observe a gradual narrowing of spreads over
comparable duration Treasury bond yields. In the course of our analysis, we consider varying structures for the more
junior payment classes, and find ranges of prices that vary substantially over a
Childs, Ott, and Riddiough 601
For equivalent pool share percentages, this table compares observed market yield spreads with those predicted by the model for various investment classes. Observed yield spread ranges are from a Duff & Phelps (1994) report on CMBS, as adopted by Corcoran (1995). Yield spreads are interpolated, since the investment class percentage cutoffs from the stylized security employed by Corcoran do not exactly match the pool shares used in this paper. Yield spreads are based on an assumption of a multiasset pool of newly originated loans. Model yield spread ranges are adopted from Tables 1, 2, and 3 in this paper under the assumption that property value correlations are equal to 0.5.
plausible range of model input parameter values and that generally coincide with
reported yields by the dealers of these securities. Although most simulations
produce expected effects, the impact of property diversification on security value
contradicts the conventional wisdom with respect to the first-loss payment class.
Indeed, investment banks and rating agencies have recently touted the general
positive effects of increased pool diversification on CMBS value. Our results
suggest that better diversification may actually decrease first-loss tranche value, a
finding that, in our opinion, merits close examination by those who are intimately involved in this new and developing market.
Appendix
This appendix briefly outlines the valuation technique. The first step of the
valuation is to use dynamic programming for each mortgage to determine mort?
gage rates and default boundaries. Then, using the mortgage rates and default
boundaries as inputs to a second stage, the next step is a Monte Carlo simulation
that values the tranches ofthe CMBS.
Each dynamic program has two stochastic state variables: interest rate and
the property price of an individual property. To improve efficiency, we transform
the state variables to constant variance variables before building the lattice. First, consider the dynamics of the short-term interest rate in a risk-neutral world. We
assume that the interest rate, r, is a CIR square root process,
dr = k(u ? r)dt + or\lrdzr-
The transformed variable Xx = *Jr has constant variance. A straightforward
application of Ito's Lemma provides the dynamics for Xx,
dXx =
where,
(y -a2Xx\dt+-j-dzr,
4kv? o; k ol\ =- and a2 = -.
602 Journal of Financial and Quantitative Analysis
Each of the property prices Pi, i = \,...,N, follows geometric Brownian
motion. The usual transformX2j = lnPf produces a constant variance variable. In
a risk-neutral world, the dynamics of X2t are
dX2i = (r-6i--ondt + atdz2i,
The interest rate and property price may be correlated, so E[dzxdz2i] = pidt. We use the trinomial method of Hull and White (1990) to discretize the
valuation problem. The normal branching of each individual process is26
for j = 1,..., N + 1. The grid spacing is determined by
The marginal probabilities associated with each possible state outcome are given in Hull and White (1990).
The tree for both interest rate and property price is produced using the same
grid spacing as defined above. Nine branches emanate from each node correspond?
ing to the nine pair-wise combinations of up, over, and down from the individual
processes. The joint probabilities are the product of the marginal probabilities
adjusted to account for correlation between the processes, as outlined in Hull and
White (1994). To recover actual state variable values at any node, simply invert
the transforms to find r = X2 and P, = ePti.
This fully defined tree allows mortgage valuation for a given mortgage coupon rate. We iterate over the mortgage coupon payment to find the mortgage interest
rate that prices the mortgage at its face value. Additionally, for each discrete time
period, we approximate the continuous default boundary by interpolating near the
property price/interest rate nodes where default occurs.
Next, given the mortgage rates and default boundaries from the first step, a Monte Carlo simulation is used to value the tranches of the CMBS. Multi?
ple property price/interest rate paths are simulated based on the risk-neutralized
stochastic processes for the state variables that reflect any correlation between in?
dividual property prices and/or the interest rate. As part of this process, we must
take (N + 1) standard normal uncorrelated deviates and transform them to have
the appropriate correlation. Let ? be the (N + 1) x (N + 1) variance-covariance
26For the interest rate process, alternative branching occurs at the top node and bottom nodes of the
grid. See Hull and White (1990) for a complete description.
Childs, Ott, and Riddiough 603
matrix for the Af property prices and the interest rate. Let T = [rjk] be a lower
triangular decomposition of S such that S = TT'.27 Let Z be an (N + 1) vector
of independent standard normal variates. We utilize the T matrix to transform the
independent draws Z to a vector of draws Y that has the appropriate correlation
and standard deviation,
;"
Yj = 5>;*Z*, farj=l,...,(tf+l). k=\
Given the interest rate, property prices, mortgage rate, and default boundary at any time period, the cash flows from the mortgage coupons and any default
proceeds can be allocated to the individual tranches ofthe CMBS. Cash flows are
discounted at the spot rate of interest to determine the value of each tranche at time
zero.
References
Black, F, and J. C. Cox. "Valuing Corporate Securities: Some Effects of Bond Indenture Provisions." Journal of Finance, 31 (May 1976), 351-367.
Boot, A. W A., and A. V. Thakor. "Security Design." Journal of Finance, 48 (Sept. 1993), 1349-1378. Childs, R D.; S. H. Ott; and T. J. Riddiough. "The Value of Recourse and Cross-Default Clauses in
Commercial Mortgage Contracting." Journal of Banking and Finance, 20 (April 1996), 511-536. Corcoran, P J. "Debt and Equity in the New Real Estate Markets." Real Estate Finance, (Fall 1995),
73-82. Cox, J. C; J. E. Ingersoll; and S. A. Ross. "An Intertemporal General Equilibrium Model of Asset
Prices." Econometrica, 53 (March 1985a), 363-384. _"A Theory ofthe Term Structure of Interest Rates." Econometrica, 53 (March
1985b), 385-407. Duff & Phelps Rating Company. "The Rating of Commercial Mortgage-Backed Securities." (Oct.
1994). Dunn, K. B., and J. J. McConnell. "Valuation of GNMA Mortgage-Backed Securities." Journal of
Finance, 36 (June 1981), 599-616. Grenadier, S. R. "Valuing Lease Contracts: A Real-Options Approach." Journal of Financial Eco?
nomics, 38 (July 1995), 297-331. Goetzmann, W. N., and R. G. Ibbotson. "The Performance of Real Estate as an Asset Class." Journal
of Applied Corporate Finance, 13 (Fall 1990), 65-76. Hartzell, D.; J. Hekman; and M. Miles. "Diversification Categories in Investment Real Estate."
AREUEA Journal, 14 (Summer 1986), 230-259. Holland, S. A.; S. H. Ott; and T. J. Riddiough. "Uncertainty and the Rate of Commercial Real Estate
Development." Unpubl. Manuscript, The Economics Institute (1995). Hull, J., and A. White. "Valuing Derivative Securities Using the Explicit Difference Method." Journal
of Financial and Quantitative Analysis, 25 (March 1990), 87-100. _"Numerical Procedures for Implementing Term Structure Models II: Two-
Factor Models." Journal of Derivatives, 2 (Winter 1994), 37-48. Kau, J. B.; D. C. Keenan; W S. Muller; and J. F. Epperson. "Option Theory and Floating-Rate
Securities with a Comparison of Adjustable and Fixed-Rate Mortgages." Journal of Business, 66 (Oct. 1993), 595-618.
McConnell, J. J., and M. Singh. "Rational Prepayments and the Valuation of Collateralized Mortgage Obligations." Journal of Finance, 49 (July 1994), 891-921.
Nomura Securities International, Inc.?Global Real Estate Research. "Commercial Real Estate Quar? terly." (Jan. 1996).
Titman, S., and W N. Torous. "Valuing Commercial Mortgages: An Empirical Investigation of the Contingent-Claims Approach to Pricing Risky Debt." Journal ofFinance, 44 (June 1989), 345-373.
Tong, Y. L. The Multivariate Normal Distribution. New York, NY: Springer-Verlag (1990).
27See Proposition 8.1.1 in Tong (1990) for a formula for the T matrix.