180
THE PRINCIPAL CONCEPTS FOR A LONG-TERM MAPPING PROGRAM IN THE MARITIME PROVINCES ANGUS C. HAMILTON REJEAN CASTONGUAY May 1978 TECHNICAL REPORT NO. 53

THE PRINCIPAL CONCEPTS FOR A LONG-TERM MAPPING PROGRAM IN THE MARITIME
PROVINCES
ANGUS C. HAMILTONREJEAN CASTONGUAY
May 1978
TECHNICAL REPORT NO. 53

PREFACE
In order to make our extensive series of technical reports more readily available, we have scanned the old master copies and produced electronic versions in Portable Document Format. The quality of the images varies depending on the quality of the originals. The images have not been converted to searchable text.

THE PRii~ClPAL COI'ICEPTS FOR A LOi~G-TERI~
HAPPING PROGRAM IN THE MARITIHE PROVINCES
A Report
by
The Department of Surveying Engineering
University of New Brunswick
for
The Land Registration and Information Service
Council fo Maritime Premiers
December, 1976
Reprinted: May, 1978

Preface and Acknowleqments
This study is one of a series of background studies
undertaken for the Council of Maritime Premiers by the Department
of Surveying Engineering at the request of the Land Registration
and Information Service.
Mr. R.H. Castonguay of the L.R.I.S. staff collaborated
in the preparation of the report, however the responsibility for
the contents rests with me.
Brig. L.J. Harris collaborated on the study as a
consultant. His long experience in cartography has been extremely
valuable in the investigation related to the traditional mapping
practice and the computer-assisted technology.
The study team is grateful to all the map users who
responded to the long questionnaire on the regional and local
mapping needs in the Maritime Provinces.
Le~ A.C. Hamilton.
December, 1976

PROGRESS UPDATE
In the fall of 1977, an Ad Hoc Committee was formed to review
the study on "The Principal Concepts for a Long-term Napping Program in the Maritime Provinces".
The Committee had representatives from the provinces of New
Brunswick, Nova Scotia and Prince Edward Island, the Provincial Associ at ions of Land Surveyors and Professional Engineers ,consulting,
surveying, mapping and engineering firms, the Land Registration and Information Service and the study team.
The Committee met twice. The report was reviewed and the
recommendations were discussed, modified and restructured. A list of recommendations, as finally adopted by the Committee, is enclosed.
Hay 78

RECOMMENDATIONS FROt~ LONG TERM ~lAPPING MEETINGS
Recommendations Regardi rig Genera 1 ~1appi ng Program of the ~la ritime Provinces
--Digital map files for high density urban areas be compiled at a content and quality level consistent with 1:1 000 standard map scale.
--Digital map files for lower density cities, suburbs, towns, villages and urbanized rural communities be compiled at the content and quality level consistent with 1:2 000 standard map scale.
--A series of seminars and workshops be held with concerned groups before adapting specifications on 'quality level' of regional digital map files. The two quality level choices are the equivalent to the 1:10 000 and 1:20 000 standard map scales.
--The planes of the provincial plane coordinate systems be adopted as the map projection planes within the Maritime provinces.
--The reference grid representing the provincial plane coordinate system be the predominant grid in all medium and large scale maps.
Recommendations·Regarding the·cartographic Framework and Identifiers
--The decimal degree be adopted for gee-packaging in the Maritime provinces.
--The Universal Transverse Mercator plane coordinate system and the ellipsoidal coordinate system be subsidiary referencing systems.
--All large scale maps be provided with a predominant reference grid spacing corresponding to a ground distance of 100 metres.
--All medium scale maps be provided with a predominant reference grid spacing corresponding to a ground distance of 1000 metres.
--A serial identifier and a serial name be adopted for every public map series (those offered for sale to the public).
Recommendations Regarding·Revision
--The medium scale photo base be revised on a nominal 10-year revision cycle with a long term goal of a true 10-year revisi'Jn cycle.
--The large scale map revision be revised on a nominal 5 year rev1s1on cycle with a medium term goal of a true 5 year revision cycle and a long term goal of continuous revision.
--A graphical revision procedure for the existing large scale map series be developed as soon as possible. The resultant maps should be at least as accurate as the original map.

Recommendations Regarding Coordination and Responsibility
--Production of new maps and digital files remain the responsibility of a centralized unit.
--The revision of the medium scale map series provided by LRIS remain centralized.
--The standard specifications not require data from field completion but include field inspection.
--Whenever large scale maps of a municipality are being produced or revised, the municipality be given the opportunity to provide data by field completion.
--In order to achieve revision requirements, serious consideration be given to regional map revision strategy keeping in mind the maintenance of standard quality maps.
--The design of the digital files corresponding to the medium scale maps should try to provide for the flow of data to and from the various federal map series and other digital data.
--It is anticipated that if data from one specific project mapping will be of significant value to the. regional mapping program, a cooperative or joint venture be considered.

1
2
3
4
5
PRINCIPAL CONCEPTS FOR A LONG-TERM ~tAPPING PROJECT IN THE MARITIME PROVINCES
INTROOUCTION
TRADITIONAL MAPPING PRACTICE
2.1 BASIC CONCEPTS
2.1.1 The Principle of the Basic or Parent Scale
1
10
10
10
2.1.2 Hap Reproduction--Multi-color and Monochrome Maps •• 13
2.2 MAPPING PROGRAMS AND MAPPING PRACTICE IN GREAT BRITAIN AND SWEOEN • • • • •
2.2.1 Great Britain
20
• 20
2.2.2 Sweden ••• • • • 2 8
2.3 SUMMARY OF RELEVANT FACTORS AND CONCLUSIONS FROM THE REVIEW OF PRACTICE AND PROGRAMS ••••••••••••••• 32
RATIONALIZATION AND THE CONCEPT OF AN INFORMATION "EXCHANGE" • 33
3.1 A MODEL FOR THE RATIONALIZATION OF MAPPING •• 33
3,2 DIGITAL TECHNOLOGY AND METHODOLOGY 36
3.3 AN INTEGRATED POSITION INFORMATION EXCHANGE: A MODEL , • 38
3.4 CONCLUSIONS •
3.5 RECOMMENDATION
MAPPING NEEDS IN THE MARITIME PROVINCES
4.1 QUESTIONNAIRE ON MAPPING REQUIREMENTS
4. 2 ANALYSI~ OF THE RESPONSES ••
4.3 CONCLUSIONS FROM THE ANALYSIS OF THE RESPONSES TO THE QUESTIONNAIRE •
4.4 RECOMMENDATION
THE MAPPING PROGRAM RECOMMENDED FOR THE MARITIME PROVINCES
5.1 TilE APPLICATION OF THE "PARENT SCALE" PRINCIPLE
5,2 LARGE SCALE REQUIREMENTS
5.2.1 Requirements in Ulgh Density Cities
5.2.2 Requirements in Low Density Cities, Towns, Villages
40
43
• 44
44
• 45
• • 45
• 46
47
• 47
• 4 7
• 48
and Rural Residential Communities • 49
5.2.3 Requirements in Agricultural Areas 51
5.2.4 Project Requirements • 52
5.3 MEDIUM SCALE REQUIREMENTS • • 53
5.4 MEIJIUM/S~·1ALJ. SCALF. REQUUa;~ll:NTS; TIH; ~TS 1:50 000 HAPPING , 55
5.5 RECOMMENDATIONS •••••••.•• , ••• , 56

6 THE CARTOGRAPHIC ~KAMEWORK •
6.1 DEFINITION, REQUIREHENTS, F:XTEKNAL FACTORS, CONSTRAINTS AND ASSUMPTIONS
6.1 .1 Definition and Requirements
6 .1. 2 Extern<~l Factor,; and Constraints
6.1. 3 Assumptions
6,2 MAP PROJECTION PLANE
6.3 COORDINATE SYSTF:MS
6. 3. 1
6. 3. 2
Review of the Coordinate Systems in the Maritime Provinces
Plane Coordinate System Needs
6.4 REfERENCING SYSTEMS ,
6. 5 PACKAGING •
6. 5. 1
6.5.2
6.5.3
The Packaging Concept
Geo-graphical Packaging
6.5.2.1
6.5.2.2
6. 5. 2. 3
6.5.2.4
Production Aspects
a) Product~on difficulties when packaging is based on a plane coordinate system
b) Production difficulties when packaging is based on an ellipsoidal coordinate system
User's Aspects
a) Coordinate requirements
b) Map planning
c) Map use
Other Aspects
a) Surround
b) Indexing
c) Flexibility •
d) Redefinition, readjustment and metric conversion influence on packaging
Conclusion
Geo-digital Packaging
6.5.3.1
6.5.3.2
Alternatives for Ceo-digital Packaging
a) Geo-digital packaging based on plane coordinates
b) Geo-digital packaging based on ellipsoidal coordinates
Conclusion •
• 58
58
• 58
• 59
• 60
61
66
• 66
• 66
• 6 8
• 7 1
• 7 1
• 7 3
• 7 3
• 7 3
90
93
93
93
96
98
98
• 100
• 102
• 104
• 105
107
• 110
• 110
• 111
• 111

8
6.5.4 Package Num her i ng . . . . 6.5.4.1 Arbitrary Numbering
6. 5. 4. 2 Mat r. i x Numbering
6. 5. 4. 3 Ceo-cocte Numbering
6. 5. 4. 4 Co nc.l us ion
6. 5. 5 Packages and ~lap Sizes
6. 5. 5. 1 Paper ~;co no my
6. 5. 5. 2 Ge o- packaging Yield and Efficiency
6. 5. 5. 3 Other Factors
6. 5. 5. 4 Conelusion
6.5.6 Evaluation of the Packaging Alternatives
6.5.7 Recommendations
7 SPECIFICATIONS THAT SHOULD BE SUBJECT TO PERIODIC REVIEW AND MODIFICATION •
7. 1
7.2
7.3
7.4
7.5
7.6
7. 7
7.8
MAP CONTENT
SYMBOLS
PRESENTATION OF REFERENCING SYSTEMS
7.3.1
7. 3. 2
The Size of the Reference Grid of Graticule •
The Number of Reference Systems and the State of Presentation
NON-PARENT SCALES
REPRODUCTION METHODS •
REVISION • •
7.6.1 Medium Scale Map Rev]sion
7.6.1.1 Map revision frequency
7.6.1.2 Map revision responsibility
7 • 6 • 1 • 3 Map revision technique
7.6.2 Large Scale Map Revision
7.6.2.1 Map revision frequency
7.6.2.2 Map revision responsibility
7.6.2.3 Map revision technique
MAP SERIES IDENTIFIER
CARTOGRAPHIC EVALUATION AND DESIGN OFFICER
SUMMARY OF RECOMMENDATIONS
111
112
• 112
113
114
• 115
115
115
117
117
117
118
128
• 128
•• 131
• 135
• 135
• 138
142,
• 14 2
142
• 14 6
146
• 151
• 152
153
•• 153
• 153
155
• 159
161
162

APPENDICES
A. THE PREPARATION, UISTRIHUTlUN, MONITORING AND PROCESSING OF THE QUESTIONNAIRE 0~ HAPPING NECUS IN THE MARITIME PROVINCES
B. ANALYSIS OF THE REGIONAL QUESTIONNAIRE
C. ANALYSIS OF THE LOCAL QUESTIONNAIRE
D. URBAN TERRITORY PROJECT MARITIME PROVJNCES--256 CITIES, TOWNS ANU VILLAGES
E. THE PLACE OF MINIATURIZATION IN HAP PRODUCTION

PART A

1 lNTRODU:TION
The large and medium scale map series presently being produced
in the three Maritime Provinces were initiated prior to the formation of
LRIS, consequently, there are differences between the provinces in the
scales, in the numbering system, in the sheet boundary system, in the
map surrounds and in map content. Because of these differences the full
cost savings possible from the unification of the production facilities
under LRIS cannot be realized.
Only some ten years ago computer-assisted (digital) map
production was possible but it was practical only for military agencies;
now in addition to military agencies, large civilian organizations have
computer-assisted map production programs. In view of this the time has
come for medium-sized agencies, such as the LRIS, to explore the potential
for this new technology. The decision to embark on a digital mapping program
should not be taken lightly; the equipment and the skilled resources needed
are so costly that without extensive and careful planning the program will
not be cost effective. There is also another important aspect to consider.
This is the fact that plotting accuracy by automated methods is appreciably
higher than by manual methods. The implication of this is that the specifi
cations for all stages of map production will need to be revised. Thus in
view of the need to resolve the differences between map series noted above
and of the prospect of the introduction of digital mapping methods the
necessity of identifying the principal concepts for a long-term mapping program
in the Maritimes was recognized.
Map requirements vary widely from country to country; they
are dependent, for e~ample, on the state of development of a country, on
the level of economic activity, on the land registration system, on the
assesment method and on the traditions of the society with respect to
map use; in other words, it is a complex question. In view of this
In mapping jargon the scale of a map is the ratio of distance on the map sheet to the true distance. Maps of cities may be at scales 1:1000, 1:1200 or 1:2000, these are large scales; maps showing an entire province or country may be at scales ranging from 1:250 000 to 1 :5 000 000, these are small scales. This is because the fraction 1:5 000 000 is much smaller than 1:1000.

- 2 -
complexity, it would be surprising if the first series of maps proposed
for a region were to meet the need ideally or for all time. Similarly
due to differences of climate, terrain, culture, industry, or population
density, it is highly unlikely that a mapping program that has proven
suitable in one country or in one region can be transferred to a different
type of country or region without considerable adaptation. Even in those
countries which have a long history of production and of usage of large
scale maps, it is the practice to review their programs periodically and
to adapt to the changing technology and to changing requirements.
This study has, as a consequence, the following objectives:
i. to examine the long-term mapping needs of the region;
ii. to examine alternative methods to achieve these needs in light
of the new technology; and then,
iii. to develop the principal concepts and preliminary specifications
for a long-term mapping program in the Maritime Provinces in
light of changing requirements, new technology, and other national
and regional developments.
Map-making is both an art and a science; many of the earliest
maps had very little science but a large element of artistic creativity.
Some modern maps have a large component of science, some have a large
art component. Some .are strong in both art and science; others are deficient
in both. In the Middle Ages maps were used primarily for exploration
and navigation. Early explorers, such as Champlain, were also map
makers. Champlain's work is interesting as an example of a dichotomy
in mapping of which one can see remnants to this day. Champlain had
detailed drawings of his encampments showing the location of fences.
buildings, barricades. etc •• at a scale of approximately 100 feet to one
inch (1:1200); at the other extreme, he made small-scale maps depicting
on one sheet the entire eastern coastline of North America as it was known
at that time. He made maps. or plans, at very large scales and exploration
maps at small scales, but it was obviously beyond his resources or his
immediate needs to make maps at the intermediate scales. Our society in

.1
the Maritime Provinces appears to be becoming more and more a series of
encampments surrounded by developing hinterlands. To an increasing degree,
there is a need to know the location of every element of our environment and
spatial referencing is the only method by which a quick and effective
correlation can be made of all the elements - environmental or geographical
in our complex civilization.
Although maps have been made for many thousands of years, it is
only in the last two to three hundred years that national governments
have initiated systematic national survey and mapping programs and created
organizations to undertake this work. Previously, surveys were carried
out for roads, for example, by specialists, as in the days of the Roman
Empire; and the surveys of properties \~ere undertaken by individual
surveyors. The needs of science, military defence, and taxation combined
to accelerate the establishment of national governmental organizations
and the execution of systematic national programs of surveys and mapping.
Thus, in Great Britain and France, scientific reasons motivated the
joint effort to undertake the trigonometrical survey to join the ~aris
observatory to Greenwich in the early 1780's, while the defence of the
realm against France caused the extension of this triangulation along
the south of England with some mapping under the direction of the
Honorable Board of Ordnance in 1791. Ever since the Army had prepared
a military sketch map for the building of roads in the Scottish Highlands
after the 1745 up·rising, the ide,, of ct·eating a national mapping organi
zation had been in the minds of many in Great Britain. The efforts of
William Roy, who had been engaged on the Scottish Survey as a young officer,
resulted in the establishing of a national trigonometrical survey organi·
zation in 1791. The production of the one inch to one mile map of England
and Wales (1801-1824) resulted from the desires cf landowners, indus
trialists, and even of recreation (fox hunting). The enlargement of the
scale to six inches to one mile for the Survey of Ireland (1824-1849)
was intended to meet the requirements of land administration and taxation.
In time, the trigonometrical survey came to be called the "Ordnance
Survey" from the Board which directed its operations. The uniqueness of
- 4 -
of the British organization is the centralization of production of .all
mapping scales in one organization from the large or cadastral scales
(1:1250 and 1 :2500) through the topographical scales (1 :10 000 to 1:250 000)
to the geographical and atlas scales. In France, similar influences
played their part, but organizationally the responsibility for topogra
phical surveying was separatea from cadastral surveying and remains so.
Topographical surveying from Napoleon's time was vested in the Service
Geographique de l'Armee, (in which Napoleon served for a time), until
it was renamed the Institut Geographique National in May 1940 by Marshal
Petain just before the fall of France. Large scale and cadastral surveying
is carried out by a separate governmental organization and by private
geom~tres.
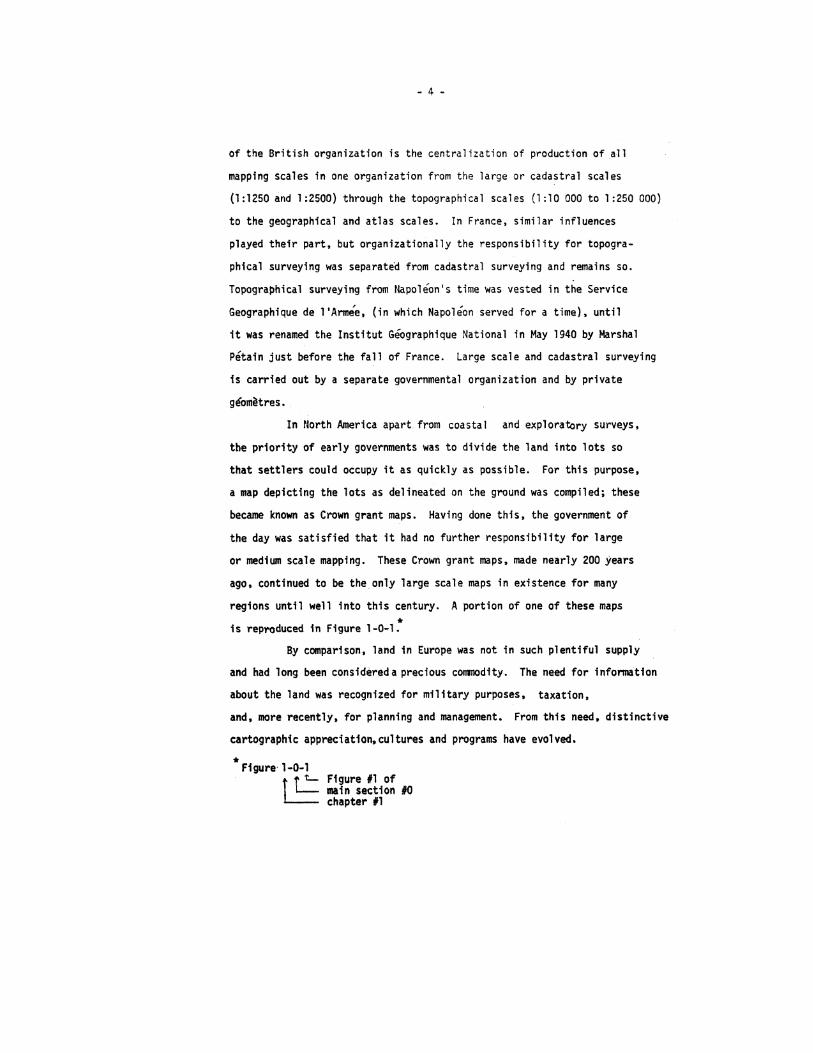
In North America apart from coasta 1 and exploratory surveys,
the priority of early governments was to divide the land into lots so
that settlers could occupy it as quickly as possible. For this purpose,
a map depicting the lots as delineated on the ground was compiled; these
became known as Crown grant maps. Having done this, the government of
the day was satisfied that it had no further responsibility for large
or medium scale mapping. These Crown grant maps, made nearly 200 years
ago, continued to be the only large scale maps in existence for many
regions until well into this century. A portion of one of these maps
* is reproduced in Figure 1-0~1.
By comparison, land in Europe was not in such plentiful supply
and had long been considered a precious co111110dity. The need for infonnation
about the land was recognized for military purposes, taxation,
and, more recently, for planning and management. From this need, distinctive
cartographic appreciation.cultures and programs have evolved.
* Figure· 1~0-1
~ Figure #1 of main section 10 chapter #1
- 5 -
Figure 1-0-1
This figure shows the type of map produced at the end of the nineteenth century in New Brunswick. It is a portion of page 29 in the "Illustrated Historical Atlas of New Brunswick" published in 1878.
-...' ~ ...... 7 ~ ~ ~ ... ~ . .... .... ~ kif!,,.,! ; .~ ~ '-.;
~ kJt!m~ ~ .<:>
Smle 700 Clzains-liruJr.

- 6 -
In the Maritimes as in the rest of North America, mapping received
little impetus from either the military or the civil areas of government
prior to World War II. There was no military impetus because the defence
of the Maritimes depended on command of the seas l'lhich was the responsi
bility of the Royal Navy. Nor was there any impetus from the civil
administration, because land taxes were not a source of revenue for either
the national or the provincial government. Where property taxes existed,
they were levied and collected at the local municipal level and for this
purpose an annotated copy of the Crown grant map sufficed.
The absence of a long tradition of mapping in the Maritimes has
economic, educational and cultural effects on the mapping program. Each
of these will be discussed briefly:
i. The economic effect- The most significant economic effect is the
pattern of project mapping or ad hoc mapping that prevails in
Canada. In the absence of suitable region-wide medium-scale and
urban large-scale map series, many agencies and industries have
been forced to do project-oriented ~apping. In some instances, this
is justifiable and economical; more after, however, several project
requirements partially overlap and project mapping of some areas may
be done three, four or five times where one multi-purpose map would
have served for all the projects and for general users. In such
cases, project-mapping is an uneconomic approach.
ii. The educational effect- Because there was no demand for t"he skilled
people to make maps, there were until recently, no educational
facilities either at the professional or technical personnel for
map making.
iii. The cultural effect- For the most part the Canadian public are
cartographically illiterate. To many Canadians, map usage is
limited to a map obtained at a gasoline station. On the other hand,
to residents of the British Isles and of most European countries, maps
have a wider appeal, and are used for hiking, for cycling, and for
many other pursuits.

- 7 -
The net effect of the absence of a long tradition of mapping
in the Maritimes is that, until World War II, there was no equivalent here
of the official governmental large scale mapping programs undertaken in
European countries. The medium scale mappinq at one mile to one inch (1 :63 360)
wu initiated in the 1930's and completed (as 1 :50 000) in 1953.
In Mew Brunswick a series of planimetric maps at.the. scale of
20 chains to one inch (1:15 840) was initiated in 1945 and completed
approximately ten years later; in Nova Scotia a similar series was initiated
in 1955 (see Figure 1-0-2). It should be noted too that each city has
long had some type of large-scale map __ usually for assessment purposes.
Following World War II, most cities contracted for a large-scale
planimetric or topographic map of the territory within the city boundaries;
usually, however, there wa~ no large scale mapping of the area surrounding
a city.
In 1968, under the Atlantic Provinces Surveying and f1apping
Program (APSAMP), a vigorous program of mapping at both medium and large
scales was undertaken. A summary of the work done under APSAMP and its
successor, LRIS, is presented in Figure 1-0-2 along with a list of the
previous series. This summary also shows the diversity of scales, map
projections, sheet lines and map numbering systems in the three provinces.
Under normal circumstances, there would not be a critical
deadline for a new program to be defined, but there are other deadlines
which have a critical effect on the timing of any major change in the
mapping program. These are. "metric conversion" and -"geodetic readjustment".
The Metric Commission has given wide publicity to the metrication program
and published a schedule in which January 1, 1978 is recommended as M-Day
for the "Realty and Survey" sector of the economy. A program to
readjust the North American geodetic networks is under way and, at the
request of the provinces, the Federal Government has agreed that readjusted
coordinates can be introduced simultaneously with the introduction of
metric units.

- 8 ..
rP~vfnc~~~----- ~--S;ri;,--Ts;;2~~L1ne -,Projection ___ I r.rid I ~iur:t!erfnq I Sl,,ct--~-~~-- p~;-i~d~---J
fY ' I System Q: .. tntity _ -~----------- l"=l-00;-- t~-- City Atlas of-: - i '! 1
N.S. 1"=300' Halifax ' Variable I Un>.no,.n rlone ! r:one i ,;:, pages Published 1878
N.B. - --- ---;;1·;~--~-r- & v~~~~~~---~ Unkncw:, --- None - Non.:---- Iss page;~L Publ~t,ed ,;-;-
1"=4 ch~~f--AU~s of fA~l~t~c~at~-;-& 1f---u;;know;~ -rion-e --r---Na~~---- : 95-pag~s-- -Puhll~~dlfll9 __ _ N.S. 1
to Pictou Land O~<nersh]i P I 1"=50 chains County ~__to__1879____ __ --~--~r--- _ -~~-- __
N.S. 1:63 360 County II County Unknown None County 1 18 Published 1864
f----t--~~-----1f-_:S:.::ec:.rc:.ie::.::s __ --r---!larre ~------1---- -----------1 P.E. I. Variable ~\eachem; 1 Aristocrats -u;;;;;~,m -N";e L~t 1 t~- -1162 pages Published 1880
Atlas --+ Lot of 1767 67
P.E.I. Variable Cu""'ins IAristocrat;---L Unknown None t-l-~t-lt;;--/140 pages Publhhed 1927, 194T
F===="i=':"==c=:=.:===c~~-t=':"Atc=l=a=cs -~- _ _._Lots of 1767 =~==~---,=== __ 67 L __ _ 1!.8. 1:15 340 Planimetric 1 Graticule PolyconieTNone 1 A Z ="f4s"'s,===t===="'19if~4r.!5-======l
Pr~~r f--N-.8-.--+--1-:1-S 340-- -Crown--land / Graticule - -Polyconic None J~ 4ss--APSAMP & Forest type I
LRIS N.B. 1:15 840 Geology I Graticule Polyconic None 3 __ 134 to
(mainly) N.B. 1:31 680 Planimetric j Gratic~~i---_!'_o_lyconic None 1 to 167 ----l-6-7---;
N,B. 1:31 680 Original I Graticule Polyconic None 1 to 167 167 Crown Grant
1976
APSAMP
&
LRIS
f-~N~-~B~--+-1~:~2~5_0~0~0~~--A~e~r~o~m~ag~n~e~t~ic~+-~Gr~a~t~i~cu~l~e~-+--~U~nk~~~--~~No~n~e~~--~N~T~S _____ ~-~6~0----4-----~1~9~75~---~--~ N.S. 1:15840 Series (a) j Graticule UTM 3°TM 1 45 543 1957
~erles (b) o Matrix Forest type 1 A~-->
f--.N •. .,..s_. -~-.1...,.:.,15""8740;;---11-"IO'-'--;rig__inal.fr_a,_w._ot--+_G=-r_a--,-t7ic_u7l_e _ _, ___ -:-:liT=-M:-:--- 3 Tt-l V and N.S. 1:15 840 Series (c) i Graticule UTM 3uTM 1 to 12!;
Crown Land for N.S. 1:15 840 Pl~~j~~ir~~J i Graticule UTM 3°n1 Cape Breton
I-----:N-:-.-S-.-+-=-1---::l:--::5:-:-84:-c0:------11-'---::F"-o'r"'e"'s"'"t type I Graticule UTM None un~nnal Crown 1
N. S. 1 :31 680 Grant Index Sheet
Modified ~aticule
N.B. 1:15840& Larger Scales
Assessement Series
liTM None
Polyconic I ~on"' Excluding 134 2 to 140
Variable
72 to
206 Ht7G
543
545 1954 - 1957
138 1938 - 1958
4809 1969 to present I Variable --I - ------,--=--'----1· ~-:'-':c" -,_----='-'--'-'---+·;__;_• --::--:--~---'--------1 1 to l(X; 106 1923 to APSMP St. John City I Street I
Cadastral Block 1:480 Nor.r N.B.
Cnknm-m
N.S. 1:4800 Topographic i Variable Local None 1 & up 372 1950 to APSMP
II.S. 1:2400 Topograohic i Variable Local None on ur~n 186 1950 to APSMP
I-~N~-~S~-~--~~=~1~2~00~--~~To~p=o~g~r~ap~h~i~c __ J_~V~ar~i~a~h~le~---4-~L~o:.::c~ac:.l ____ -r~t=lo~n~e-~o~mm~u~n~i~tf~ba~s_e:~s+-~2~2~---4--~1~9~5~0~t~o~A~P~SM~P------_, N.S. 1:480 Hal if ax City Grid UTM & Yes 143 1959 to 1960
P. E. I. 1:2400
N.B. 1:1200
N.B. 1:2400
N.B. 1:4800
N.B. 1:10 000
N.S. 1:1000
N.S. 1:1200
N.S. 1 :2400
N.S. 1 :4SOO
N.S. 1:5000
N.S. 1:10 000
Tooographic Local Topographic Variable Un~nown
Planimetric
&
Topographic ' & Cadastral
Planimetric
& Topographic
& Cadastral
Grid Stereographic
Grid Stereographic
I Grid Stereographic
Graticule Stereographic
Grid
Grid
Grid
Grid
Grid
Grat fcul e
None
Stereo~raph!c lfeetJ
Sheet 1 to 72
Expandetl NTS numlers
Metric Coordilll!te
1A R
20
Zone Identifier
3°TM Expandro' ' Cmetres) tiTS nlJiiler
3°m Expant~..t·
72
748
590
533
517
232
1004
34
107
37
138
Graticule l-------+---------4-------------~----------+-----------+·~(f~e~e._t~)-t_r_IT_S_n_~ __ e_r __ ~r-------~
Stereographlc Stereo- Expanmd. 199 P.E. I. 1:1250 Planimetric &
Topo?raphfc &
~------- --------- !~;i~!~) 1 _r_n_s_"_'_lllll_e_r __ t-------l
Ear 1 y 1960 to APSMP
Late 1960
to
1976
~,:__:.I:__:·-t-..:.lc:.:2:::S'!Q_ Cadastral ~_ratl_c_l)_!__~ ___ " ____ ,_'~-- t--------·-----r---:__!1~-
-~- _(_:_::_-:_:_:~L_~~~~~?~.J~~~~~!~.L~--~: =~:~~-~}:: --=-~----- -~----t----~------ ~i~-i-Flryure 1-0-2

- 9 -
Logically, any proposed changes in map projections, map scales,
map sheet neat lines or any other major item in map specifications should
be timed to coincide with the introduction of metric units and of the
readjusted coordinates. It follows that the specifications for a long-term
mapping program should also be ready by January 1, 1978.
From a cursory review of mapping programmes in many countries
it is apparent that in some countries the mapping programmes have evolved
to a "steady state" whereas in others, such as Canada, the mapping programmes
are still in an evolutionary stage. A summary of the programmes in two
of the countries (Great Britain and Sweden) in which a "steady state"
was achieved some decades ago is presented in the next chapter as
examples of what we have termed "traditional mapping practice".
In a concurrent study, one of the investigators {Hamilton)
reviewed progress on several applications of computer technology to
~pping and information systems. A summary of this review presented
in chapter 3 serves as an introduction to a discussion on how it is
anticipated that the general pattern of mapping practice will be modified
by the new technology. The potential impact of this new technology is
itself sufficient to warrant a re-examination of traditional mapping
programs. As there is no documented analysis of mapping requirements
in the Maritime Provinces, the investigators of this study decided to
make a survey by questionnaire to identify as closely as possible the needs
for mapping in the Maritime Provinces. The development of this question
naire is described in Appendix A and recommendations based on an analysis
of the responses are given in Chapter 4.

- 10 -
2 TRADITIONAL 1t\pPING PRACTICE
2.1 BASIC CONCEPTS
2.1.1 The Principle of the Basic or Parent Scale
The topographic map on a national level provides a synthesized
record of the visible features of the environment to the extent that the
scale of a map permits. The largest scale of map produced for an area
is the basic, or parent scale from which all the smaller scales may be
derived. The traditional ideal is illustrated in Figure 2-l-1 and the
Maritime-Federal practice is illustrated in Figure 2-1-2. The resulting
family of scales, in its turn, supports a theoretically limitless range
of thematic maps. The choice of parent scale is dependent on the value
or potential value of the land,on the size of the task, and on the available
resources. Currently in Canada, the largest planned nation-wide parent
scale is the 1:50 000 National Topographic Series (NTS) mapping.
Within each region, depending on the type of environment, a
parent scale is selected. The parent scale should be dependent on the
density of features to be shown. Because the "built environment" contains
more information to be recorded than the rural environment, it follows
that the parent scale for cities and towns should be larger than the
parent scale for an agricultural region. The scales in use in Great Britain
were chosen after a number of parliamentary debates, commissions, and
committees covering a period of over one hundred and fifty years. The
British story (Section 2.2. 1) illustrates the importance which should be
attached to the choice of the basic scales.
The concept outlined above by which all smaller scales are
derived from the basic or parent scale is an ideal which is honoured more
in word than in deed. This is because it is desirable when going to the
expense of recompiling and reprinting a map sheet to have the information
as complete and up-to-date as possible. To achieve this in making a smaller
scale map, from a larger scale map, it is necessary that all the map sheets at the
larger scale be up-to-date. Except for a brief period immediately following
the completion of revised mapping at the larger scale, these large scale
maps are not up-to-date. Futhermore, the number of map sheets required

HINTERLAND
SECOND DERIVED
SCALE
FIRST DERIVED
SCALE
PARENT SCALE
--
--
- 11 -
TRADITIONAL IDEAL
RURAL URBAN SCALE i R.n 111::10"
THIRD FOURTH DERIVED DERIVED ATLAS
SCALE SCALE
SECOND THIRD 1 :1 000 000 DERIVED DERIVED to
SCALE SCALE 1 : 250 000
FIRST SECOND 1 : 250 000 DERIVED DERIVED to
SCALE SCALE 1 : so 000 i
I
PARENT FIRST 1 : 50 000 SCALE DERIVED to
SCALE '1: 4 800
'-
PARENT 1 : 4800 OR to -- BASIC 1 : 1000
SCALE --------, 1 2X ,'
,' ENLARGEMENT j '------------------
Figure 2-1-1 - In the traditional ideal, data collected to meet the requirements of the parent scale map is used to "derive" all smaller scales. Note that the area represented by a whole map sheet at scale 1:1000 is represented by a square approximately 0.5 mm by o.smm at scale 1:1 DOO 000.

Coverage TechnJSLU ..-p;c)(Tuc,i on
Who 1 e country Deri vcd ,
Who 1 e country
Populated Jarea of the
country
~hole Province
ities only
Derived
Parent scale
Derived
Compiled I
- 12 -
HARIT ME-FEDERAL PRACTICE
NEW BRUNSWICK
FEDERAL
1 :1M, A"TLAS MAPS ROAD MAPS , ETC .
/
PRINCE EDWARD ISLAND
Whole Province Parent scale in N.B. Re-
I trace in N.S.
Southern coun- ompiled in N.Bj / I I I ties in N.B. ompiled in N.S< 1:10 000 1:10 000 1<:11c.l" Province educed in PEl I in P.E.I.
Rural areas
Vi 11 ages and towns
VIllages and small towns
Cities
Cities and larger towns
Compiled
Compiled in N.B I 1:4800 7 / 1:4800 7 Compiled in N.S
Compiled / ompiled in N.B. / 1:2400 I I 1:2400 I ompiled in N.S.
Compiled / Compiled in N.B / 1:1200 I Compiled in N.S
Enlarged
Figure 2-1-2 The principle of a parent scale from which smaller scales are derived has been followed onl.v for the rn·oduction of th" 1: SOO 000 s~ries P,e 1 :?.50 000 series (from the 1:50 000), and the 1:31 730 seriPs (from the 1 :~5 S'lO) in tle1~ Brunswic~. Photoqraphic reduction >~a> used in the! prnuuction of the 1:10 OClO photomaps (from the 1 :5000) in Prince F.d~;ard l;land. Phot.ootaJ:Ilic enlar9~ment was used for the production of thP 1 :4GO (from th<' 1 :1200) sPri0s in Halifax. The 1:15 840 series in Nova Scotia wa; a special compilation using the 1 :50 000 series as a base.
1:2500 I
1:1250 7

- 13 -
to derive a sma1ler scale map ftom a large-scale :r:a; can be quite large;
for examole for the compilation of a 1:50 000 shee:- some 100 sheets
at scale 1:2000 would be requi~ed. From :his ~t becomes apparent that in
many cases the ideal must remain just that- an ideal only.
In practice two or three parent scales are needed. The choice
of the basic or parent scale for a country-wide or region-wide mapping
programme is affected by the size of the country and region, and the resources
available. Great Britain, a country of small geographical extent, chose
successively, as it grew richer, basic scales of Mapoing of one inch to one
mile (1800); six inches to one mile (1824); 1:2500 (1855) for the developed
areas; and 1:1250 for the major towns (1937). Canada, a vast country with
limited mapping resources initiated a one inch to one mile series early
in this century; shortly after World War II this series was superceded
by the 1:50 000 series. This series is a parent scale for revision of
the 1:250 000 series and the 1:250 000 is, in turn, used to revise the
1 :500 000 and 1 :1 000 000 series.
At the larger scales the parent scale principle has, until now,
rarely been followed. This is because the economics of photogrammetric
compilation have been such that in general it has been more economical
to compile medium scale maps directly by photogrammetric methods than
to collect and generalize large scale maps. There are indications however
that digital mapping technology may lead to simplifications in the generalizing
procedure and this in turn will lead to economY. This will be discussed
in more detail subsequently.
2.1.2 Map Reproduction- Multi-color and Monochrome Map
The use of color greatly enhances any graphic communication ;
in particular it permits much more information to be presented while still
maintaining good accuracy and readibility. Consequently, color is introduced
into maps as the map-scale grows smaller but it is usually unnecessary in the
large scale plans and maps where data are plotted to scale and the content
is not cluttered. Color, then, is added to improve the readability of the
map and to accentuate features but for three main reasons should not be
added unless necessary.

- 14 -
1. Experience has proven that a long period of time· is required
for the production of color maps. For example in a U. S.
Government study entitled "Report of the Federal Task Force
on Mapping, Charting, Geodesy and Surveying" published in 1973,
it is stated that about five years elapses from the date the decision
is taken to procure photography until the map is on sale to the public.
ii. Printing presses are designed for and are only practical for
mass production; it is prohibitively expensive to set up a printing
run for a small number of copies.
iii. At the present state of the art of map repr.oduction, it is many
times more costly to produce a multi-color map than to produce
a map in one color (monochrome). The reason that multi-color
maps are so costly is that the lithography is a complex process.
In the printing of a multi-color map, a separate printing plate is required
for every solid color printed on the map or used in combinations to make
other colors. Sometimes, there may be two plates for one color, e.g., one
for the culture (black plate) and one for the names (also a black plate).
A separate drawing (overlay) is also required for every plate. Traditionally,
* it is at the drafting or scribing stage that the map data is separated.
The separations for the 1:50 000 NTS multi-color maps are shown in Figure
2-1-3. Having these separations enables various versions of a map to be
produced by omitting one or more overlays. An example of this technique
as' applied in Sweden is discussed in section 2.2.2. For some
purposes, such as for adding geological information it is sometimes desi
rable to omit contours. It must be emphasized that detail cannot be
omitted from a particular overlay. For example, selected contours in the
contour overlay or minor streams from the hydrography overlay cannot be
omitted except by preparing special masks of the deletions or by manual
retouching of the production material, i.e., by a manual drafting-type
procedure.
* Scribing is similar to drafting except that: it gives higher quality line work; and a negative instead of a positive is produced.

D Type overlay
D Type overlay
Grey
Printing Plates
Fiqure ~1-3
Reference
Scribecoat
Negative
D Positive
D Type overlay
Type negative 12% negative screen
::>lue
Positive
blue
Flow diagram of multi-color map production Baldock, E.D., Manual of Map Reproduction Techniques, Surveysand Mappinq Branch, Ottawa
Peelcoat
Blue line image
I WI I (51 I
\
Green
- 16 -
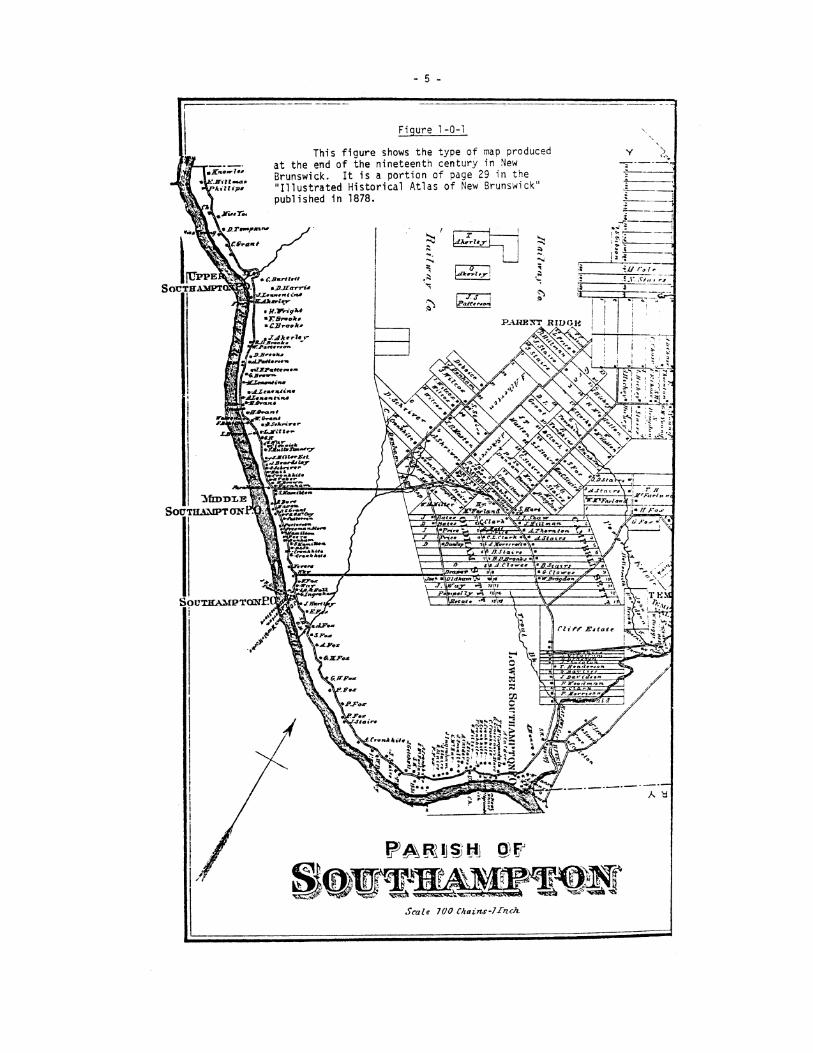
Where there is no intention of producing a multi-color map from
a manuscript, separate scribe sheets are not required and problems of
registration of the different overlays are thus avoided. This is
currently done when monochrome processes such as diazo are used for
printing. However, if it is anticipated that copies of the map may be
required without certain classes of features, such as vegetatior., omitted
the class of features to be omitted can be scribed on a separate scribe
sheet in the original production. (Each separate scribe costs approxi-
mately $40.00.) This overlay can then be combined with
the other scribe sheets, photographically, to prepare the combined negative
for printing. This procedure is depected in Figure 2-1-4. The procedure
currrently followed in LRIS is shown in Figure 2-1-5 for the orthophoto
mapping and in Figure 2-1-6 for the line mapping program.
The decision to produce monochromatic or color maps has a large
impact on the design of the map, on the symbolization and on the amount
of content that can be presented. However, by appropriate·symbolization,
monochrome maps can be made increasingly readable --a challenge in itself.
Should a multi-color map be desired in the future, the adaptation of pro
perly designed monochrome maps will be easily modified for multi-color
processing-- but the converse is not true. It must also be emphasized
that the monochrome maps are the most adaptable to processing and usage
in the current era of digital mapping and TV type display screens.
The over-riding factors with regard to multi-color maps are the
high cost of multi-color printing and the long production time.
This last factor also rules out the possibility of up-dating multi-color
maps frequently. A breakthrough in color technology would, of course,
change this situation dramatically. For the present, the above limitations
dictate that mapping programs at large scale should be planned for
monochrome reproduction.

BASE *27 Grid and coo.rdinate
systems
'--..Lii'"'-"-.L\·.....,_w.....~n I I
,--""-----I r ---- -7 II 1 /
I 1 Overlays ; I
I L _____ _;_/1
L-------
Requested line map for
diazo printing
Figur·e 2-1-4
This figure shows that features separation would permit a greate•· flexibility in map product.
- 17 -
I I
i'···2/
I

N p M T s c C T S M T
Material l!srd ---------Ncgati ve film Positive filfll ~lat transparency Scribe coat
- 18 -
lHIS PHOTO 11•,P r,~.'>ITfl!.Y - ---- ~----- . ---- ....
Property map
,,.,;;7 __ :-,_ photo n:__; / =-r
L----- - S M T ..__ _______ ___,
•••• i> -----> ----?>
mi n01· chanqe multi-exposures i.e. vacuum frame (require registration) samE' material
Clear tt~aw·.pclrenr:_y
Sensitize mot tt·ansparency
c => used to produce
Figure 2-1-5 Flm~cha•·t shm·Jinq the scqu~nr.e of strns in orrnarir.n material for Jlrinting LRJS p!•oto''"'ps. Three ru~lic Sl'ries arc produced:·
(1) Planioll('tric m-111 (no contcur) (2) lt'Jl',ogt·aphic rtJp (pla~in·· .. tric man with contour) (3) Property nap (no contour)

LRIS LINE MAP ASSEMBLY
Machine manuscript
r·;:=======;-7 Pl ani rretri c
features. norre'i others
~etn~c ~ features. narre~ others
s c
Hypsography
I
_;,.
Approximate property
boundary
d~w; ll·" ·~•md~ ll· ... ) Z, "~sc I I I 1 I I
~ '": 7/--fL ''"v 7/ ;11~;":==::::::---7 ~~ i i !
Material Used
Hypsographic li.ne. ~""'~"'' /I 11ne
map
Activities
S M T
Property map
N Film negative M T Matte transparency S C Scribe coat
• • • • 3> minor chan3e ----.:!> multi-ex,o·;ures i.e. vacuum frame (require registration)
S M T Sensitized matte transparency (used for printing diazo paper or transparent copy)
R W Red wash {red sensitized matte transparency}
-- sarre material · ==::=) used to produce
Figure 2-1-6 Flowchart showing the sequence of steps in preparing material for printing LRIS monochrome maps. In this sequence three map products are produced: line map with contours, plani~r.etric map (no contours); property map (planimetric plus property boundaries}.
S M T
Property boundary
manuscript
J
..... '..0 I

- 20 -
2.2 MAPPING PROGRAMS AND PRACTICES IN GREAT BRITAIN AND SWEDEN
2.2.1 Great Britain
In Great Britain virtually all official ~apping and a large part
of the surveying is done by one agency-- The Ordnance Survey. The basic
scales of mapping, based on Lord Davidson's committee Recommendations of
1937, are as follows:
1:1250 of the major towns totalling about 50 000 map sheets each
500 m x 500 m;
1:2500 of the minor towns and rural areas totalling about 200 000
map sheets each l km x 1 km; and
1:10 000 of the mountainous areas totalling about 10 000 map
sheets each 5 km x 5 km.
From these basic scales, smaller scales of maps are derived to produce the
family of national map series. These are:
1:25 000; 1:50 000; 1:100 000; 1:250 000; 1:625 000; and 1:1 Million.
Except for the 1:1 Million map which is on IMW (International ~1ap of the
World System) grat4cule sheetlines, all of these maps are on grid sheetlines.
A single projection, the Transverse Mercator on a central meridian
at two degrees West longitude, has been adopted. As the maximum width of
Great Britain is less than 8 degrees of longitude, the maximum scale error
due to projection is never greater than 1:2500. A national rectangular
spatial referencing system, the national grid, has been superimposed on all
maps of the scale of 1:625 000 and larger, in order to provide one reference
system for all map series in the national family of maps as recommended by
Lord Davidson's Committe. The international metre is the unit on which the
grid is based.
From the middle of the 19th Century up to the time when the Davidson
recommendations were implemented, the largest scale of general mapping was the
1:2500 scale of the county plan; these were drawn on the Cassini projection
with local origins. During this period the Ordnance Survey also undertook

- 21 -
the survey of a few city plans at scales varying from 1:480 to about 1:1200,
These independent city plans were abandoned with the introduction of the
major town program at 1:1250 scale recommended by the Davidson Committee.
The major British tasks since World War II have been the production of
the two largest scales. The 1:1250 resurvey has been completed. For
reasons of economy, the 1:2500 maps have been produced (the programme
is to be completed by 1980) by the less rigorous "overhaul" procedure, in
which the previous 1:2500 plans on the Cassini projection are being cast
on the grid sheet lines of the National Transverse Mercator projection
calculated on the Airy-Hotine spheroid, and the detail is graphically
adjusted to this projection and revised. Compared with the resurveyed
1:1250 maps, the accuracy is much lower and internal errors of up to
1 mm occasionally occur (see OS Professional Paper New Series No. 25).
The Ordnance Survey's long experience in mapping at the 1:2500
scale-since 1855-adds significance to the present specifications,
in particular the content and symbolisation of their large scale maps.
The following points are worthy of mention :
i, In 1853 at a statistical conference in Brussels, ALL the delegates from the principal states of Europe voted in favor of the scale of 1:2500.
ii. The 1:1250 and 1:2500 maps are printed in one color. Miniaturised reproduction material and electrostatic prints are obtainable.
iii. The ground line and not the roof line of buildings is surveyed and shown on the maps. Photogrammetric information must conform to this rule. The additional information, such as a ground line which is not visible in an air photograph, is obtained by field survey methods.
·i+. The acreages of all parcels of land are shown on the 1:2500 maps.
v. Height information is shown by Bench Marks, and not by contours on the 1:1250 and 1:2500 maps.
Some production details taken from "Map Production in the Ordnance
Survey" (Derrick Heald in The Penrose Annual. Vol. 52, 1958) are also of
interest and are attached at the end of this section.

- 22 -
There has been considerable activity in Great Britain in
computerising urban data, e.g., the Greater London Council and Leeds.
Concurrently, the Department of the Environment Road Research Laboratory
is engaged in computerising road data, and also accommodating the
software clearinghouse of the International Segment Oriented Referencing
System Asssociation. These activities influence the current activity at
the Ordnance Survey in digital mapping. Digitising was initiated at the
1:1250 scale and 1:2500 scale, but experiments in the production of derived
maps at 1:10 000 and 1:25 000 have since been successful. The segmenta
tion of l.inear features and the numbering of each segment in the digitising
of the 1:1250 plans refiect the requirements of other authorities and users
concerned with data management and analysis.
The UK situation is of particular interest because of the
complete integration of the national family of maps from the largest to
the smallest scales; the use of the larger scales of maps for land
registration; and the adoption of one unique national rectangular coor
dinate reference system - the National Grid.

- 23 -
Map P:r:·oduction in the Ordnance Sur·;ey
Derrick Heald
Since the early days of the Ordnance Survey, when the sheets of the 1 in. map first edition were being published, there has been a continuous process of development of its map series. In this development it is apparent that three requirements have exerted much influence. Firstly, that the map should be surveyed and published at a scale large enough to satisfy any user's needs in any area of country. This scale is usually called the basic or parent scale of survey-parent because the smaller scale maps can be derived from it. Secondly, that the map should be kept as up to date as is economically possible. And thirdly, that the map should be easy to read and pleasing to the eye.
In the description which follows of some of the techniques now employed in the Ordnance Survey, this interdependence of the surveyor, the cartographer, and the printer will be readily apparent. For example the production of the SO in. to one mile (1:1250) scale plans illustrates the need, with the increased scale of survey, to pay greater attention to maintaining the size of all the documents used in the process.
The final stage of the survey in the field at the scale of SO in. to one mile is to survey in detail the topographical features and to record them in a graphical manner on a "field document". To avoid distortion and to ensure agreement at the edge of the plan with the adjacent plan, aluminium plates 20 em square and 0.0625 in. thick are used as the surveyor's drawing medium in the field Figure 2-2-1. These plates are assembled in a sketching case by butting together in groups of four to form the drawing surface. The edges of these "butt joint plates" are accurately machined so that they fit together tightly. When they are photographed the junction line between them forms a grid line of the plan. The same precautions against distortion are maintained in all the subsequent processes until the final paper copy is printed, all the work being done on non-dis.tortir.g media: metal, glass, or plastic.
The first stage is to produce a glass negative by the photography of the "butt joint plates" mounted in sets of four on the vacuum copyholder of a fixed focus camera. To keep the glass negative in the same plane and so avoid distortion it is held in position in the negative holder by suction. From this glass negative a blue drawing key is printed photo-mechanically on a white enamelled aluminium plate (Figure 2-2•2). on this enamelled plate the draftsman completes the fair drawing of the plan (Figure 2-2-3). Subsequently the fair drawn enamelled plate is photographed in a fixed focus camera to produce the final negative from which the lithographic printing plate is made. It will be seen that at no stage is paper or any other material liable to distortion used in the process.
Similar procedure is adopted for the production of the 25 in. to one mile plans, except that the field document is a plastic sheet and the plan may be scribed as an alternative to being drawn. As there will be about 180 000 plans at this scale even small savings in the production cost of one plan will be well worthwhile. Scribing has been recently introduced and promises such a saving.
In a modern industrialized and densely populated country such as Great Britain the task of keeping the plans up to date is immense, for the survey must keep pace with the rate of building and engineering construction which increases with advancing civilization. To this end a system thought to be unique in the world has been developed by the Ordnance Survey whereby a new edition of any plan is placed ~~er "continuous revision" as soon as it is published. The system ensures that changes are surveyed as they arise. The decision to republish in a later edition is deci~ed by a flexible yardstick which depends on the age of the existing edition and the extent of the change of topographical features on the ground. Im!Dediately · the yardstick is reached in any particular plan the ]Wblication of a revised edition is authorized. The use of such a yardstick ensures that plans of rapidly developing areas will be republished at more frequent intervals than plans of areas where development is slow.

- 24 -
RESURVEY 1 :1250
Figure 2-2-1
Surveyor at w0r~ o~ butt joint ~lates held in sJecial sketching case.

- 25 -
Figure 2-2-2
All detail inside neatl ines in blue (on original illustration).
The negative made from the butt joint olates is used to oroduce a ferro prussiate blue key' on the white enamel plate, within a black standard grid and border, which is also produced photomechanically.
Figure 2-2-3
All detail inside neatlines in black (on original illustration).
The draughtsman has now fair drawn the work of the Field Surveyor, using the ferro orussiate blue shown in Fig. above' as a drawing guide. The Plan number and grid information has also been added to the standard grid and border.
NOTE: The sections of large plans
ORI PLAN "Scale: I:
-, r=
Resurvey drawing enamel plate.
ORI PLAN TQ2777SE Scale: 1:
Resurvey fair drawn enamel plate.
are reduced in size approximately two and a half times.

- 26 -
The detailed stages in the continuous revision system are as follows. When any particular edition of a plan is being printed, either a first or a later edition, a =erro-prussiate blue i~ression of the plan is made on a transparent plastic sheet (Figure 2-2-41. This is sent to the surveyor responsible for the particular area. As development takes place he will survey all new development and draw the result on the plastic sheet in opaque coloured inks, using the blue detail of the previous edition as a guide. It is the aim of the surveyor to ensure that the detail on the sheet is never more than a few days behind development on the ground. When the yardstick has been reached for a new edition to be published the plastic sheet showing all the additional detail is despatched to the Large Scales Division of the Ordnance Survey at Southampton where the s~bsequent processes are carried out. At the same time the surveyor provides a tracing on paper to show all the detail which needs to be omitted from the current edition of the plan (Fj_gure 2-2-5 l.

PL\:'. TQ277iSE
ii i-~
Figure 2-2-ll
- 27 CONTINUOUS REVISION i :1250
ORDNA!\:CE SURVEY Scale: I: 1~50 or S•h88 inches to I ~file
T<:::.!:"77NE 8.11TEI<SEA \ff.T ..t f"~ff.LY HORO
Contir.uous revision plastic field document.
The work of the previous edition is shown in blue (on original) and the new detail in b 1 ack.
ORDNANCE SURVEY
PLAN TQ2777SE Scale: I: 1250 or 50·688 inches to I Mile
..----"-----;,·-----·--- . Q
Q q'Q
Q Q
Figure 2-2-5
trace
Detail to be removed for the new edition is marked in red (on the original).

- 28 -
2.2.2 Sweden
The information that follows has been mainly extracted from a
monograph entitled "Urban Mapping in Sweden" with limited editing.
In Sweden, the responsibility for map production-- as well as for
establishing the geodetic control framework--- is divided between State
(The Geographical Survey Office) and Local municipal (CSO - City Survey
Office) authorities. The State, in principle, pro·1ides maps at the scales
1:10 000 and smaller, whereas mapoing at the scale~ larger than 1:10 000 is
a municipal responsibility. This is because the principal use of large
scale maps is in municipal planning and development.
The Geographical Survey Office's main respqnsibility is to produce
the official maps of Sweden. The modern series of these maps includes the
following:
The Economic Map (General Land Use Map) 1:10 000
The Topographic Map 1:50 000 (1:100 000 in parts of Northern Sweden)
The Comprehensive Map 1:250 000
The General Map 1:1 000 000
The Coastal Nautical Charts
The Gauss Conformal Projection (the 1938 Datum Grid) has been
adopted for all of Sweden's official maps. The central meridian of this system
is 2~ 5 W. (2cl5' W of the old Stockholm observatory), X co-ordinates are
positive, with the Equator as the origin; Y co-ordinates are counted as positive
increasing towards east, 1:500 000 metres has been added to the central meridian
to avoid negative values. The topographic map sheets are furthermore fitted
with the UTM grid.
The sheet edges for both the Economic and Topographic Map sheets are
directly related ·to the co-ordinate system, being parallel with the X andY
axes. The division into separate sheets begins in the south with an X value
of 6 100 000 metres and in the west with a Y value of 1 200 000. The map sheets
normally have a 50 x 50 em format: thus an Economic Map sheet at a scale of
1:10 000 covers an area of 5 x 5 square kilometres whereas a 1:50 000 Topo
graphic r4ao sheet which is made up of 25 Economic Map sh~ets covers an area

- 29 -
of 25 x 25 square kilometres. An Economic Map at a scale of 1:20 000 covers
an area of 10 x 10 square kilometres and a 1:100 000 Topographic Map sheet
SOx SO square kilometres i.e. the area covered by 25 1:20 000 Economic
Map sheets. Certain Topographic Map sheets covering coastal regions and
areas along Sweden'a international boundaries have a 50 x 75 em rectangular
format. By altering the standard format in this way it is possible to avoid
publishing sheets which show very limited land areas.
The economic map sheets 1:10 000 (1:20 000 in an older series)
covering nearly all of the populated portions of Sweden, constitute a mostvaluable
tool in all comprehensive planning. Production began in 1937, and so far
nearly 12 000 sheets covering about half of Sweden have been published. These
Economic Maps are printed in four colours by offset methods. The detail
shown in black includes administrative divisions, property sub-divisions,
plan detail, the limits of and the notation referring to different land-
use types, hydrographic detail, lettering and the map surrounds. Contour
lines are shown in brown, arable land in yellow and the photographic repro
duction of the geographical background in green.
The orthophoto map, at scale 1:10 000 is produced from aerial
photos flown at a standard altitude of 4600 metres. Originally, it consti
tuted the basic support in compiling the economic map sheets, but in recent
years it is available as a separate product, and as such is widely used in
planning. Even other orthophoto maps, specially produced from low altitude
aerial photographs, are finding their way into ever-increasing municipal
planning use.
As mentioned above, mapping at scales larger than 1:10 000 is a
municipal responsibility. These maps, at scales from l:SOOO downwards,
display a much greater variety than the State map series. Sheet size and sheet
divisions, and even the principal map scales have been independently decided
upon by the various CSO's (City Survey Officers) at different times, following
the various mapping needs and the varying development pace of the separate
communities. Mapping is a costly and time-consuming enterprise and a system
once introduced is adhered to for decades. It is quite difficult to alter
or to re-shape a mapping system, although strong demands for general nation-

- 30 -
wide conformity have recently been raised. The most frequently aoplied
mao sheet size in municipal maps is 80 x 50 and 80 x 60 centimetres, the
latter enabling diagonal check measure of 1 metre to be made easily.
In the case of maps and geodetic control at scales larger than
1:10 000, the National Grid is insufficient because of the considerable
east to west extension of the Swedish territory. If one single projection
plane were to be applied throughout the whole country, unacceptable pro-
jection errors would ensue. To avoid this, Sweden is divided into six
narrow meridional bands, each featuring its own projection plane to prevent
the map image from deteriorating towards the outer edges of the altogether
too wide National Grid.
Large-scale maps: 1:400, 1:500, 1:1000: --The municipal master map or primary map is designed to provide a basic source in the preparation and compilation of a vast array of specific maps needed in the municipal plann~ng and projects-designing activities. To make the map as useful and versatile as possible, its image content is often split up into a number of separate sub-sheets, which enables different versions of map image to be assembled as composite prints. The method is adapted from the preparation of the separate plates needed for printing maps in multi-color editions. +he following is an example of the division of map content into sub-sheets and ~~e ensuing possibilities of creating different versions of the master map:
1
2
3
4
5
1+2
1+2+3
1+2+3+4
1+2+3+4+5
Buildings, boundaries, hydrography
Texts (street and block names, property titles, etc.)
Planning Regulations Lines (valid town plans)
Control points and benchmarks
~evel contour lines
Property Version
Planning Version
Project Support Version
Formal Plan Support Map Version
A great variety of systems using similar techniques is practiced by the City Survey Officers (CSO's). Revisions and updating are generally carried out on the respective sub-sheets, but it is convenient to enter slight alterations even in the various composite versions to avoid the rather costly assembly printmaking too frequently. Technically, the master maps are often subdivided into original sheets (on which the actual plotting and the careful image construction is performed) and usage sheets, i.e. ink drawn, scribed or photomechanically derived map sheets allowing convenient day-to-day printing and assembling use. At many CSO's, even separate original sheets are kept for map image of different accuracy, e.g. differentiating sharp numerical plotting from photogrammetrically captured detail.
Town Planning Support Maps 1:1000, 1:2000: Support maps provide the officially regulated basic mapping image to various types of formal town plans. As such they are divided into four different quality sta~dard classes pertaining to varying accuracy and to image content requirements. The choice of quality standards depends upon items such as land value, the intended land use, property structure, nature of terrain and surroundings, the objective of the proposed plan and its 90ssible legal effects:
Quality Class I Town Plans relating to the re-development of densely clustered districts wit~ ~igh land value and a high grade of exploitation, i.e. central urban districts.

Quality Class II
Quality Class III
Quality Class IV
- 31 -
Town Planning for the development of new, permanent, year-round hous~ng or other permanent building.
Planning for development of areas for recreational housing use where joint · .. ater supply and sewage is intended.
Planning in areas of low land value and uncomplicated property conditions, the intention of planning being merely a modest regulation of recreational housing conditions.
For the most part, the CSO's are exclusively dealing with support maps of Class I and Class II quality.
The Registry Map 1:2000, 1:1000: -- In urban areas, the registry map, showing the current property configuration, is formally a part of the Property Registry, officially regulated as to its contents and is continuously updated. The keeping of a registry map is included in the City surveyor's formal duties as a Property Registration Authority.
Control Network Maps 1:4000 - l: 50 000: -- Maps intended to comprise the current state of control networks, triangulation, traverse and height controls of various orders.
Project Support Maps 1:400, 1:500, 1:'1000: -- In meeting the demands of mapping support for the designing of various projects, the CSO encounters the most advanced utilitization of the master map's image content, its overall accuracy and correctness here being put to the severest test. The project support maps, i.e. carefully prepared prints from master map sheets, constitute the base for detailed drawings of projected buildings, streets, utility lines and similar technical constructions.
Building Permit Support Map 1:400, 1:500: -- The Building Permit Support Map is a formalized version of Project Support Maps, in providing the base for all projects subject to examination and formal building permit granting by the municipal building and planning authorities. A building permit map has its content and features regulated as to topography, valid property boundary lines, town planning regulation lines, heights data for street and utilities connection, economic data for street building costs, etc. This type of map is very frequent in CSO work and constitutes a fairly important cso product.
Block Disposition Plan 1:400, 1:500: -- The Block Disposition Plan is an official map prepared by the CSO delineating the proposed detailed property structure within a city block (i.e. the area bounded by streets). It constitutes the step in Town Planning procedure immediately succeeding the final ratification of a town plan, and provides the formal foundations for further property formation measures.
Formal Property Formation Maps 1:400, 1:500, 1:1000: -- Property Formation maps (Deed Maps) are established to depict the outcome of official Property Formation proceedings and they form a part in the formal documentation thereof. Previous boundaries and the newly created boundaries, areas, lengths, boundary markings and property unit titles are recorded on these maps.
Address Maps, City Maps, Tourist Maps 1:4000, 1:5000, 1:10 000: -- Maps of this type, intended for sale to the public at large, are often printed in four to six colors and puJ?lished in large editions. Their main content is street, block and town district names, address numbering, buildings of public interest, traffic thoroughfares, etc. Although often referred to as mere "tourist maps", this type of map is of great importance and of va1t use even inside the municipal administration. It is a very sought-after product, and requires active CSO participation in its preparation and editing.

- 32 -
Utilitias' Networks Maps 1:400, 1:500, 1:1000, 1:2000: -- In the municipalsphere, there is a constant need for map series depicting the various urban utility networks such as electricity lines, water, gas, remote heating and sewage pipelines and manholes, telephone cables, etc. To be sure, the CSO's have, through the years, been providing the respective Utility Departments with suitable mapping support, but a unified approach to the problem has hitherto been somewhatne1lected by most municipal authorities. In recent years, the need for a comprehensive and rational solution has been more urgently felt. The solution will probably entail the application of some system of sub-sheets or composite map sheets with part of the image revised by the special Utilities' Department and the other part delivered by the CSO. At suitable intervals, both separately revised images would be amalgamated into fresh composite-assembly prints. In the l9iO's, such development of unified systems for utility network map series will be a central task for many CSO's.
2.3 SUMMARY OF RELEVANT FACTORS AND CONCLUSIONS FROM THIS REVIEW OF
TRADITIONAL MAPPING PRACTICE
i. There are so many differences-- historical, cultural and geographical between the Maritime Provinces and the older European countries that
it cannot be assumed without further investigation that programs
similar to theirs should be adopted in the Maritimes. On the basis
of this conclusion, a questionnaire to map users in the Maritime
Provinces was initiated. This is discussed in Chapter 4.
ii. In the normal course of events, many years are required to complete
the coverage of a region.
iii. The ideal of collecting map data once and only once at a chosen scale
and of selecting from this collected data as required has been achieved
in practice over a small range of scales, but has never been followed
over the whole range of an extensive national family of map scales.
Nevertheless, it remains a worthy objective which digital mapping
may help to achieve.
iv. Because conventional mapping is compiled graphically, there is very
little "source" data behind the map. That is, except for the toponymy
file, the file of survey markers and perhaps some data on administrative
boundaries, the map itself is the only "file" of its contents.
This review of current mapping programs, when considered in
conjunction with the review of technology and methodology in the recently
completed study "Infrastructure Information Requirements in the Maritime
* Provinces: An Analysis", leads to the conclusion that there is a need
for a rationalization of the handling of position information in the
Maritime Provinces. This is taken up in the next chapter.
* Hafl'iHon, A. C., MacNaughton, N., Chrzanowski, A .• Infrastructure Information Reauirements in the Maritime Provinces: An Analysis, U.N.B. Department of Surveying Enginee~•.,g for the Land Regi.stntio1 and Information ~;t~r·vic 1 ! (Fredericton, 1976). f'ereafter referred to a; thr: ''Infrastructuro. Studv"

- 33 -
3 P..ATIONALIZATION OF 1'APPING AriD THE CoNcE?T oF .AN ItlFO~ATION
CLEA.RINGI.OUSE.
3.1 A MODEL FOR THE RATiONALIZAiiON OF THE ~PPING PROGRAM.
Several attempts to dev~Jop a model to serve as a basis for the
rationalization of mapping in the Maritime Provinces culminated in the one
called "the family of maos and their component themes" shown in Figure 3-1-1.
In this model, themes are the building blocks for assembling maps. In this
context, a theme is the narrowest classification into which it is meaningful to
sub-divide map content.
How does this model differ from what has always been done? In
traditional practice it was assumed that there was one map base-the planimetric
map-which would serve as a "base map" for all other themes. The separations
were made as a necessary step in the production of multi-color maps. In the
model shown in Figure 3-1-1, the themes are identified separately so that they
can be used in various map series as required. It is assumed that much more
flexibility is needed and that it can be achieved by more "separations".
Thus, the basic planimetric map would be considered as made up of several
themes such as roads, buildings, etc. These theme units can then be selected
individually in compiling special purpose maps. It should be recognized that
this is an idealized model.
By looking at this mddel showing all the maps and their component
themes, we can see:
i. in how many maps one component (theme) appears;
ii. at what scale each component first appears; and
iii. which smaller scale themes can possibly be obtained by derivation.
This approach will increase the flexibility of a purely graphical system and
becomes essential in planning the optimum utilization of a digital system.
A few ~xamples will illustrate these points:
1. If theme T1L (theme #1 at large scale) is used in L1 (public series #1
at large scale), L2, L3, L4, Ls and L6, it could also be used to derive
T1M (theme 1 at medium scale) which in turn is used in M1, (public
series #1 at medium scale) M2, M3, and M4 it follows that the investment
in compiling Theme #l at the large scale is sound and that additional
effort to keep it up to date and in a format that is readily useftrl for
all subsequent uses is justified.

I :;>',il 000 IU.~.
1 :50 000
1 14EDIUM
SCALE
SUB-
FAMILY
T LARGE
SCALE
SUB
FAMILY
DIYJ}LfJ
f '~'- ~~ 1 :'.() 000
NATIO:IAL Mftp
SERIES
D,HA COM~ILATIONS FOR THE:IES OR
SEPARJ.T IONS FOR OVERLAYS
x2 OR x2.5 REDUCTION
PAREUT SCALE
MAP
x2·0R >2.5 ENLARGEMENT
DATA COIIPILATIONS FOR TH£14ES OR
SEPARATIONS FOR OVERLAYS
x2 OR x2.5 REDUCTION
PARENT SCP.LE
MAP
x2 OR x2.5 ENLARGEMENT
,, l.J 1
I I I I I
I I
_j_ D.UA COMPILATIONS FOR TIIE~IES OR
SEPARIIT IONS '----''---' FOR OVERLAYS
TOPOGRAPHIC COLOR SEPARATIONS
\
'?l \_
' I I I I I I
- 34 -
,;• 1-!!:.', /''·: ,,
--- l--+-\""" ---------£; ~--- 2-
,----L-----,-~--- [
GEOL. SEPARATIONS
r-----, : T7M : L ____ .J
TOPOGRAPHIC OV~RLAYS
Figure 3-1-1: TilE FMHLY OF WIPS AND THEIR COMPONENT THEMES.
CJ- SIGNIHlS A MAP SERIES TllAT IS niSTR!BUTED TO TilE PUnliC
D !>IGtHFilS /IN OVERLAY TIV\T IS USED IN ASSHI!lLING A MAP
NOTE: TillS IS NOT A lllflNIT£ Pl~.N lNStlFAR liS THE NUMG!:R OF ~tArS OR OVERLAYS. ITS PUHIW;[ lS Tll li.UISTR~Tl Till INTI il-RLLI\Tl(111SIIli'S ,'\!>KING TilE MAP CllMI'Ill\1 ION:· !\Nil MAl' SLRII 'i OF A HLGWN.

lf.'Hl USE SER ItS
~ -rc·"'J r~,-=77 r==r '1-.J 11~4.411! L~~1j ~4 L:,;~·,;r~l-!J
7~7-l.~-===--dt'/.? ,. / ~~=1=7~--/ !I
U.'ID US F. THE"' S
,-- - -l I I I L-- __ J
r------1
: Ti+4M : L-----J
- 35 -
r----, : Ti+5M : l _____ J
I TillS SU~>-F,\~il!.Y IS NOT LIKELY T(' Cll.\~<f,f. S I G~<l F 1 CJ,NTL Y. THERE lS C0l-'1't.r.n: Cti'lr:r.,·.GE OF Til[ ~~~.P.ITJ::LS 1\r
- 36 -
ii. If the merits of digitizing two themes are being compared and one theme
is used as in (i) above and the other only once, then it follows that
much more benefit will be obtained by digitizing the theme that is being
used the most.
iii. If all the themes in one sub-family, say the large scale sub-family, are
compiled at one scale and on one sheet line system, the problems in
assembling maps will be minimized.
iv. As indicated by L1-E (public series #1 at large scale-enlarged) and by
L1-R {public series #1 at large scale-reduced) a photographic
enlargement or reduction by a factor of 2.0 or 2.5 is feasible.
3.2 DIGITAL TECHNOLOGY AND METHODOLOGY
T.he technology to collect, store and plot map information digitally
has been in use for several years and is improving rapidly. Many mapping
agencies now are routinely storing map information on magnetic tape simul
taneously with the graphic compilation. There is much discussion and considerable
uncertainty on how best to use this new technology. Initially it was thought
of as a labor-saving method and hence was warranted on economic grounds. This
has rarely been confirmed. Nevertheless digital mapping, (computer-assisted
mapping, or automated cartography) has arrived and it is merely a matter of time
till it becomes an integral part of any sizeable map production system. In
. this study of the concepts for a long-term mapping program, the investigrators
would be remiss if they did not develop a rationale for decisions on where and
when to introduce digital methods to the mapping program at LRIS. For this
purpose three criteria can be identified:
i. The first is that there be a requirement for the digital data other
than simply for mapping. An example of this criterion is discussed
at considerable length in the Infrastructure Study. In that study,
the need by a power commission (N.B. Power) for several themes in
digital mode as part of an on-line operational management system
is discussed.
ii. The second criterion emerges from a close study of Figure 3-1-1.
Some themes such as the main elements of the transportation network appear
on virtually every map; if these were fn digital form (and a suitable

- 37 -
plotter were available) it would be a relatively simple matter to plot
this theme at the required scale, the required level (trunk, arterial,
feeder) and at the required line width. Once changes in the trans
portation network were made and corresponding changes were made to the
digital master file, all other subsequent output would be up to date.
iii. The third criterion is the ease with which the digital file can be
compiled. Clearly when data is already in alphanumeric form, it should
be relatively easy to compile a digital file for plotting purposes.
The survey control file (benchmarks and survey stations) is an example
of this type; the coordinates for each survey marker are the result
of computer processing of survey observations.
One important point with regard to digital data was identified
in the above-mentioned study. It is essential to obtain the theme content
throughout an entire region in digital format within a relatively short time.
because patches or bits and pieces of digital data are of negligible value.
There is thus a strong argument in favor of a theme by theme approach to
digitization.
The introduction of digital technology will be a slow process, if
for no other reason than that the education and training of people to use it is a
slow process. On the other hand, there are some cases where it should be
introduced without delay. It is apparent that we will have a hybrid digital
graphic positional information system as far into the future as we can see
at this time.
Again referring to Figure 3-1-1, ft is apparent that the sheet lines
(map sheet boundaries) of all theme maps should form a consistent pattern.
They should be identical at any one scale and the larger scales should fit
into the smaller ones without any fractioning.
Similarly, and in particular when a digital format is being
considered, the desirability of having a consistent system of coordinates
throughout the map family is apparent. In coding (coding is the assigning
of a unique label or identifier to a feature) in the digital mode, the need
to have a standardized code for every feature cannot be over-emphasized. Thus
a road of certain class must be given the same code regardless of what agency
does the actual coding.

- 38 -
3. 3 AN INTEGRATED POSITION INFOR~1ATION EXCHANGE: A MODEL
The rationalization of traditional mapping (as illustrated in
Figure 3-1-1) in conjunction with the potential of modern technology (as
described in Chapter 2 of "Infrastructure Information Requirements in the
Maritime Provinces: An Analysis") leads to the concept of an integrated
position information exchange. (Figure 3-3-1)
The input to the exchange includes all possible themes of positional
information. The only constraint in the input themes is that the features
of a theme must have a fixed position. in space; they may be tangible (roads) or intangible (boundaries) or this may be statistical (people, goods).
The format for each input may be graphic or it may be digital; if
it is digital it may have been taken from an alphanumeric file such as a
toponymy file or a survey station file or it may have been collected by
digitizing from line data or directly from a stereographic plotter. Graphic
formats will include photomaps, transparencies of theme data, microfilm or
microfiche.
The output from the exchange will normally consist of a group of
themes (as in a conventional map). As mentioned previously in this study, the
word "theme" denotes what is sometimes described as a class of features;
for example, hydrogrpahy could be one theme. This, of course, does not preclude
the output of one theme by itself. In a primitive sense, the exchange is, in
effect, functioning at present. The grouping of themes to form a topographical
maps is an example of the function of the exchange.
The output may be in the format of conventional maps, or it may be
designed for special purposes, video displays, numerical print-outs, or
analysis Of data in the exchange. Conventional maps would represent
traditional theme groupings as in topography, geology, utilities, land use, etc.
Special purpose maps may include themes not normally grouped together; for example a
geological theme and a utilities theme. These two types of output format
may combine themes having graphical input with themes having digital input.
The remaining output formats are restricted to themes having digital inputs.
Video displays could be "casual" searches for information in the digital files
or they could be "on-line" systems for operations and management purposes.
The data bank format will provide print-outs of selected information from the

INPUTS
(BY TIIEI'E)
FO~T
AI.PHAI<UI'ERIC
\
E.G., CONTROL, TOPONYMY,
PROPERTY
..;_1 DIGITIZED !: LIIIE DATA
ii \ [.G., POWER NETWORKS
~
~
DIGITIZED PHOTOGRAIKTRICAI.LY
E.G., ROADS, BUILDINGS
PHOTOIIAPS
AliO
THU0£5 NOT
MQUIR£0 IN DIGITAl
FOIIIIAT
! --,---------------'---------- ------
\= !~~~~----- ----
INTEGRATED
POSITION IHFO~TIOII
EXtHAI<GE
(ClEARING HOUSE)
THE "HYBRID'
EXCHAI<GE
INFORIIO.TION ON
TAPES, DISKS
FILM, OR MICROFILM
-_./"
Figure 3-3-1
·t .. ---.--- .. ---------- ~ ---- ___ .,.!
-------- I -----~!
.. l - - - - - ----- _: ----------~!
-- I ..... -- ~.::: - - - - - - -- _,__ _________ .,..,
'~~~~ ' ... <:_-_:.:. ::::.:.::-:.:-.: .. !
OUTPUTS
FOP.~AT
CONVENTIO'IAl r.APS
(CO:.:BINAT!O'IS OF THEI1ES)
FOR PUBLIC DISTRIBUTION
MADE-TO-ORDER r.APS (SPECIAl COMBWATIOSS OF THEI'ES)
VIDEO DISPLAYS
{1fiSTA1lT rAPS)
AVAIL~BLE O~LY rn THE .... THEMES THAT~ IN DIGITAL FORI'.AT
PRINT-CUT
OF DATA FRIJM
DIGITAL FILES
ANSWERS
TO QUERIES
FIJUCTIO!I
II'P REPROJ~'CTIO!I •
P?OJECT W.PP11'1G •
o~t-u·;r
INFC::t".A'i'!Ut••
DATA
eA.•KS··
DATA BAS£ ..
* ~AT BE fP.CH GP.APHIC INPUT, DIGITAl INPUT OR A COHBIHATION
OF BOTH.
RESTRICTED TO T~OSE THEJ1ES
IN WHICH THE iNPUT WAS IN
DIGITAl FORMAT
I w 1.0 I

r ::::'" '"'"' n d:.":--control hydrograpl1y
- etc.
l \ -----1[>
\
---!>=
Photogramme
tric plotter
Gestalt photo
mapper
1 SOrnc:E & RESU.. T
-40-
r I>
_1:!\SE t,op-;-{> (if desired)
THBIES
(
,[;'~~2/ I ~===::::-7 I i
. ,1_ ~
( I '
E;_?l~ /
j /
·'
r I i I I II I , I I . I
II I I I I
I I I l
Figure 3-4-1 A model for the regional digital-graphical rationalization of ·positional infomtion

----~------7 -----·----1
/j z_.,.,:::~71. I !. ________ _
b0unaar1es ___ -- _/
Pnotograrrmetri c overlays
----------~
Agricul tur0/' land usf:_/ /
I· -·- ·-- -·
BOOKS.
-41-
!~·' \" i :. 1\ lli. I t" ~ li t 1il1.'\h , .• • vi·. ; 1 lf: 1 r< d i q i t.1l luna ,1nd ~~~ ll'·iuired ln yt'llphir,ll form.
A \WrP•·:h'llt ~-•ponvr:dst (U~t~) .\rrd ,, r:.,.~ritil,('
co::~,·:i t t t'l; l'll f.Jl'O!JI\lphicol f1d.lnf'S.
~:t·vi~ic..n: Cnntinuou·1 t'!"\ i~.i,·:~ in di.,;itdl fl'l'l:, Jr.d ,lS rt,,Jiru:J in ~]r.,puic.·!l fen;.
hcvision: lont inuous r(·\·isiCJ'. in L1uth grapnicdl an.: ;Jir,ita1 torn:.
-- __ j-
j Revision: ((rnt~nuous rcvi::it•:l (once a
I' nnntl• say) ir. di~iLll fcrm
I and as required i11 grdphical I form.
+
+
-, '
ar:_ 0 .-:..:-;=)::;~ _:_- ... Do: oc·': .--·-·--· d~·ent
ca lt rla
I Rcs~onsibility: LRIS I ______ _j_ _________ ----------- ____ j _______________ _ I [ _______ _
Photo~r;lpttir..
ir,tt·r~!n·l..: r.·i·JO i1fl(!
f i~:ld ','1"->/1 'f.•,
--------------------------T--------------------: Revision: Continuous revision on di~ital ,
files and cyclic or as re- 1 ~-- r quired revision on graphical 0 -= files. + Parent
sc.ale Responsibility: Utilities •<gcnci~s ___ ov~la
I -1----------------- ---------- --- ------1 I R0vision: l1s ''ceded Ly tnc user -I producH.
I
-- J... ---Rcsrnnr, i bi 1 i ty: A•Jr i culture
i Revision: /,s needed by tl.p u,.cr -pror1ucer.
fcrr:ctry
1n I ---~
---.I
+
·- __ _J
+

-42-
digital files as requested by a user. The data base format will provide
output in print or in·graphic format representing answers to rather complex
questions. It should be stressed that this calls for quite sophisticated
software but its development is likely to be a continuing process at a
rapidly increasing pace.
The basic rat~onale for this exchange concept is the need to lfve
with both graphic and digital files for an indefinite period. Graphic
technology is cumbersome but it~ here and it does work. Digital technology
is capable of doing the job and it can provide some services, such as video
displays and data banks, that are not feasibbe using graphic technology •
. But right now digital technology is costly and it will take at least a
generation to solve the "people problems" connected with its introduction.
Its potential is attracting many disciples in all the developed countries,
and the opportunities for lowering costs of equipment, accelerating data
capture, and training production personnel to be more effective are being
pursued. When only graphic technology was in use, the function of the infor-
mation exchange was partially achieved by the passing of manuscript trans
parencies from one unit of graphic activity to another. Differences in scales
and in symbolism made this primitive exchange inefficient but not totally
inoperative. Digital technology is much less forgiving. Unless there is
consistency on many factors the exchange process will fail. When we recognize
that hybrid (graphical and digital) systems are inevitable, the need for formal
recognition of the exchange concept to merge digital and graphical data
becomes indispensible.
If the integrated position information exchange concept as outlined
in this section is accepted, then it leads to a number of conclusions.
3.4 CONCLUSIONS
i. A much more extensive definition of the exchange model should be made-a preliminary regional digital-graphical exchange model is shown in
Figure 3-4-1.
ii. Existing graphical procedures should be reviewed for compatibility
with the model.
iii. New developments should be planned as integral components of the
Exchange. This is particularly applicable to digital mapping projects.

- 43 -
iv. In order to achieve the potential of the Exchange, a Centre should be
created with the task of developing and testing the concepts for a fully
integrated position information system.
v. There is a need for standardization of the cartographic framework and for
cartographic specifications and standards. These are discussed in Part B
of the report.
3.5 RECOMMENDATION
It is recommended that a Centre be created with the task of developing
and testing the concepts for a fully integrated· position information system.
It is expected that this Centre would be located close to or at a University
where a nucleus of expertise in handling position information already exists.

- 44 -
4 MAPPING NEEDS IN THE r'AAITIME PROVINCES
4.1 QUESTIONNAIRE ON MAPPING REQUIREMENTS
The mapping needs of a region are a function of many social, cultural,
political and economic factors. The weighting of these factors determine the
mapping need. On the one hand one may say that the need should depend on the
present level of activity; on the other hand there is evidence that mapping
is a prerequisite for development and hence that the mapping need should be
related to the potential or the desired level of development.
In Chapter II the mapping programs and mapping practice in Great
Britain and in Sweden were summmarized and it has been assumed that the
programs generally meet the needs of these countries. One method of estato
blishing the need for mapping in the Maritimes would be~assume that its need
would be similar to that of Great Britain or Sweden and· hence that a similar
program should be followed. In view of the fact that the social, cultural,
political and economic history of the Maritimes is distinctly different from
that of the examples cited above, it was decided that this method was not
justified and that an inquiry of considerable depth was needed.
For this purpose a que~tionnaire was prepared, tested and sent to a
carefully screened list of some 400 "economic users" of maps. An economic
user is defined as one who requires a map in connection with his or her work;
with few exceptions, economic users are working with or for industry or for
a government agency. A copy of the questionnaire, the mailing list of those
to whom it was sent and notes on the preparation, distribution and processing
of it, are contained in Appendix A. Two versions of the questionnaire were
prepared. One had some questions specifically directed to regional users and
the other had some questions specifically for local users. In this context
"local users" are people such as municipal officials whose main interest
is confined to limited parts of the Maritimes; "regional users" are people
such as foresters and water management personnel.
The responses to the questionnaire were key-punched and processed
using a program package called SPSS (Statistical Package for Social Sciences).
The results of the regional questionnaire are included in Appendix B and
those of the local questionnaire are included in Appendix C.

- 45 -
4.2 ANALYSIS OF THE RESPONSES
The quantity of data which is available in both the regional and
local questionnaire is rather large. Any attempt to fully tabulate the
data would create an enormous quantity of output. Consequently only the
histograms of the complete set of data is presented together with some
selected cross-tabulations. Should more tabulation and analysis be desired,
the data is on computer cards in a form that can quickly respond to further
analysis by other investigators.
The graphics presented in Appendix B and C are not interpreted,
however they are labeled in such a way that the reader can make his own
interpretation. A sample showing how to read and interpret the data is
presented in Appendix B-3 and Appendix C-3.
The SPSS (Statistical Package for Social Sciences) version 5.01 has
been mainly used for compiling the histograms and for making the cross
tabulations. Version 6.02 is a new version of SPSS having additional analy
tical capability. Only a few cards need to be changed to process the data with
version 6.02. No matter which version is used, the documentation or labelling
is sufficent to read and interpret the results.
4.3 CONCLUSIONS FROM THE ANALYSIS OF THE RESPONSES TO THE QUESTIONNAIRE
The main thrust in the analysis of the questionnaire has been in
the field of map scale, resolution, content and accuracy. This has revealed
an inconsistency with regard to map accuracies. Many respondents who say
they.want a map at a certain scale also say they want accuracies many times
higher than can be attained from the scale they have requested. This indi
cates
i. that they should have requested a larger scale
ii. that the accuracy requested is not needed, or
iii. that there is a lack of understanding of the quality of maps.
The cost of mapping escalates rapidly as the scale increases and
as accuracy requirements increase. Thus a decision on the scale and accuracy
of a map can have a manifold effect on the cost of a mapping program. In
view of the fact that this decision over the long term is so significant and in
view of the inconsistencies revealed in the questionnaire, there is a

- 46 -
a need for further discussion with all those who responded to the question
naire.
This is not a "cop-out" on the part of the investigators; it is a
recognition of the fact that the respondents to the questionnaire gave it a
lot of time and thought and consequently are entitled to participate directly
in the formulation of the main conclusions from it. (It is assumed that the
conclusions will have a significant impact on the long-term Maritime mapping
program.) For those whose requirements cannot be met, it would give a good
understanding of why they could not be met.
4.4 RECOMMENDATION:
It is recommended that a seminar or workshop be organized as a
follow-up to the questionnaire. The objective would be to develop a consensus
and quality (scale, content, accuracy) of regional mapping needed for the
Maritimes.

- 47 -
5 A MriPPING PRoGRAM FOR THE i'AAITIME PRoVI!IJCES
5.1 THE PARENT SCALE PRINCIPLE AND THE DIGITAL DATP. BASE
In Chapter 2 the principle of the parent scale in mapping is
discussed at some length and in Chapter 3, on new technology, the digital
data base is shown to be the logical successor to the graphical cartographic
manuscript.
In this chapter the broad outlines for a mapping program that is
consistent with the parent scale principle and adaptable to the digital data
base concept will be outlined. The concept is shown in Figure 5-2-1.
5.2 LARGE SCALE REQUIREMENTS
In the spectrum of mapping scales, large scales include all maps
below l:SDDO. All map scales above 1:5000 are medium or small scale, while
1:5000 maps may fall in either group depending on how the map is made. If
the map is made by enlarging a parent scale of say 1:10 000 (or by selecting
data from the medium scale data base), it would still be a medium scale
map because its content, accuracy and resolution, would be the same as that
of its medium scale parent. On the other hand if the map is made by reducing
a parent scale, of 1 :2000 for instance (or from the large scale map data
base), it could be considered large scale because the quality of its data
would be that of a large scale map.
The requirements for large scale mapping vary widely depending
on the territory. For uninhabited forest territory there is no need for
any large scale mapping. In agricultural areas there might be some need
for large scale mapping. In urbanized areas there is always a need for
large scale mapping - the type of mapping depending primarily on population
density. In general, for mapping purposes urbanized areas can be considered
as falling in two categories:
(i) high density cities and
(ii) low density cities, suburbs, towns, villages and rural communities.
As the requirements for each of these differ appreciably further discussion
on this topic will be under two sub-headings.

- 48 -
5.2. 1 Requirements in High Density Cities
The large cities have a complex infrastructure system and hence
a greater need for an infrastructure information system than smaller cities and
towns. In the infrastructure study, recommendations on urban infrastructure
information are given along with an overview of the subject (Chapter 5,
pp. 72-90).
Basic (or base) mapping is an indispensible first step towards
an infrastructure information system. The requirements for basic mapping in
high-density urban regions were explored in considerable detail in the above
mentioned study. Also, as infrastructure information is the most demanding
ot all the requirements for basic mapping, it can be accepted that if basic
mapping meets the infrastructure requirements, it will meet all other require
ments. An extract from Section 5.7.4 (p. 87) of the infrastructure study sums
up the mapping requirements. "Scales at 1 :500 or larger are required for
urban (infrastructure) information mapping .•... Enlargements from the city
maps at the scale 1:1000 are adequate for infrastructure systems. However,
one has to remember to take into consideration thickness of lines and symbols
of the basic maps." In view of the fact that the 1:1000 is among the accepted
Canadian metric scales, it can be accepted as the "parent scale" map of high
density urban areas. By careful design and adequate control this parent scale
can meet the needs for infrastructure (utilities) maps and smaller scales
such as 1:2000 or even 1:5000 can be derived from it as needed.
No attempt has been made in this study to delineate the area that
warrants mapping at this scale. If the suggestion made in the infrastructure
study that cities collaborate with LRIS on large scale mapping materializes,
then the area would be delineated by discussion between LRIS and the cities
interested. In the delineated area, cities would supplement the cost of the
mapping and assist with up-dating.

... 49 -
5.2.2 Requirements in Low Density Cities, Suburbs, Towns, Villages and Rural
Communities.
Much of the activity creating change in our landscape occurs in the
suburbs, in low density cities and in towns, villages and in urbanized
rural communities. It is in these areas that much of the debate over zoning
and planning takes place. Utilities and other constructions are not packed
as tightly as in the high density cities. Thus the need for accurate position
ing and for large scale mapping is not as great. In most of the comparable
regions of other countries, mapping is done at the scale of 1:2000, 1:2400,
or 1:2500. As 1:2000 is the only "metric scale" in this range, it is
recommended here. With a parent scale of 1:2000, enlargement to 1:1000 is
practical and, of course, reduction to 1 :5000 could be done by photomechanical
methods or by editing and recompiling (Figure 5-2-1).
A project to prepare an index map showing the boundaries of cities,
towns and villages in the Maritimes was defined during this study. It is
included as Appendix D. As the information in this index will be essential at
the planning and budgeting stage of this mapping program, it is recommended
that this index be compiled as soon as possible.
Prior to the evolution of photogrammetry, mapping was done by
survyeors in the field; since World War II most topographic maps have been
compiled from air photos. The reason for using photogrammetry is economic:
it is much, much cheaper than having surveyors locate every feature. Its
only disadvantage is that some features are either not visible at all or
not identifiable on the photographs. The map-maker must then either omit
certain features or send a surveyor to identify and verify and in some cases
locate features. This is called "field completion". It improves the quality
of a map but also adds appreciably to its cost. As noted above, unless there is
an identified need for field completion it is omitted for economic reasons. As
some communities undoubtedly need field completed maps, it is recommended that
LRIS develop a cooperative program whereby municipalities have the option of
accepting the standard "economy model" or of doing the field completion and
receiving a higher quality product.
The main advantage to this approach is that it allows the major users
of a particular group of map sheets to participate in the decision on the content
and quality of the sheets.

f--
11=:00 1
I I
Reduftion
,, II
En1a~~ement II II I o
1 :1aao
Built-ul)
Lcing Te·rm
Large Scale Ma~oi ng Program for the
Maritime Provinces
Fioure 5-2,-1
High Density
The comoonents of the large scale mapping pro!lram: Co111pilation in suburban areas, towns, villages, and unincorporated coll1'lunities will be at the scale of 1:21)00; comnilation in the high density parts of cities will be at the scale of 1:1000. Graphic enlargements and reductions for each on request. In cities the quality (content and accuracy) will depend on the extent of the city 0articipation in the program. In time cities wtll need to have the map content in a digital data base. This will make possible displays or. V.D.U. 's (Visual Display Units) at any scale of any selected elements.
Reduttion
1:500'
Digital Data Base
1 :51)011 Display
1:1001) Accuracy Content
r.esolution
t
[ ~ ...--------"
1:501)
Oi sp1 ay
l 1:200
Display
(.]' ,....
I L-------------------------~---------------------~

- 51 -
There are several side benefits to this approach:
i. The feeling of alienation at the local level against "big government"
will be reduced.
ii. Those at the local level who participate in the field completion will
have a tendency to identify the map products as "theirs" and hence will
tend to utilize them and to promote their use as much as possible.
iii. Discussions on field completion between local and central agency represen
tatives will lead to better communication on other aspects of "information
flow". This, in turn, could lead to a more responsive attitude at the
central agency and to an increased interest in innovative technology
at the local level.
The 1:2000 series will be a new one for the Maritimes. Thus it presents
the opportunity to design a completely new product. Here, again, conceptual
questions arise. Should we, at this stage, design maps in the conventional
sense knowing that a digital data base will be evolving or should we design a
digital data base recognizing that one of the immediate application will be for
the compilation of a new map series? The answer to this question must await
the results of the analysis of the family of themes as recommended in Chapter 3.
Thus, in concluding this sub-section we recommend that for low. density
urbanized areas the basic map data be compiled at a quality level equivalent to
that required for a 1:2000 map series. It is also recommended that a cooperative
program be developed whereby local governments have an opportunity to get a
better-than-standard product by contributing to the data compilation.
5.2.3 Project Mapping Requirements
As discussed in Chapter I (EConomic effects, p.' ) until recently
much of the large scale mapping in Canada was done on a project or ad hoc basis.
It was also noted that the effect of this type of mapping is that in many cases
there is unnecessary duplication and expense; the development of a systematic
map series as outlined in this chapter should eliminate much of the duplication.
This does not mean however that project mapping can or should be abandoned
entirely. There is still a place for project mapping and in this section an
attempt will be made to define some criteria under which project mapping should
be undertaken.

- 52 -
It should be clear from the discussion in the preceding chapters that
if one of the planned map series will meet the requirements for a project then
every effort should be made to juggle priorities so that the mapping for the
project is done in time for the project. This aspect of the problem will
diminish in significance as progress is made on the completion of the respective
series. Thus, under normal circumstances, the only time that the question of
project mapping will arise is when the requirements for the project mapping
will not be met by an existing or a scheduled map series.
There are still two situations that may arise:
i. Part of the data collected for the project mapping may be of value to the
LRIS cartographic data file.
In this situation it is recommended that LRIS collaborate with the
project agency on some shared-cost basis. This can be beneficial to both parties.
The benefit to LRIS would be that the data would be collected to standards and
in a format compatible with the LRIS information system. The benefit to the
project agency would be twofold: the mapping expertise of LRIS will be
available to it; and, by sharing the cost with LRIS, the net cost to the agency
should be reduced.
ii. None of the data collected is likely to have any lasting value.
This eventuality should be considered quite apart from the long-term
cartographic program. tt depends on whether or not LRIS has a role as a
contractor or-as· a-c~lnt~et manager in providing "services". This question
is beyond the scope of this study.
5.2.4 Requirements in Agricultural Areas
There are no well established precedents on suitable scales for rural
mapping. If intensive agricultural practices involving, say, irrigation are
being followed then mapping at large scale (1 :2000) may be. indicated. If the
land is used mainly for pasture and cereal crops, it is likely that the regional
resource mapping will be adequate.
It is suggested that the requirements for rural mapping be left open
for the present. If the Resource Mapping Workshop as proposed in Chapter 4 is
held, a definitive answer should be forthcoming; if it is not held, then a more
critical assessment of the questionnaire responses is suggested as the next
step.

- 53 -
5.3 MEDIUt~ SCALE (REGIONAL) REI')UI!1Et1ENTS
The scales ranging from 1:5000 to 1:31680 are considered to be
medium scale. The examples cited in Section 2.2 confirm that medium scale
maps are essential members of the family of maps for any territory. Based on
precedent here and elsehwere and confirmed by the responses to the questionnaire
we can at this time, without hesitation, make a basic recommendation:
Mapping for the entire territory of the Maritime Provinces at one
medium scale is needed.
There is good reason to expect that these maps would, when complete, become by
far the most widely used maps in the Maritimes.
It was apparent from the discussion in the previous chapters that
mapping is a complex subject, and that much more than the question of scale
needs to be specified to define a map series~ for the 1:10 000 map of the British
Isles ,for example,there are 120 pages of specifications.
There are countless items that concern the quality, and hence the
value and the cost of a map. Scale and hence horizontal accuracy is one of the
items; contour interval and hence vertical accuracy is another; monochrome
or multi-colour production is another; there are many more.
No specific recommendations are being made on the medium parent scale that should be adopted for the Maritimes. This is mainly because further consultation with the users is required. The decision related to parent scale map characteristics is so important that the recommendations should not only be sound but they should be arrived at with the concurrence of a wide spectrum of concerned map users. Nevertheless map economics on one hand and response to the regional questionnaire on the other lead us to believe that a concensus will be reached on either the 1:10 000 or the 1:20 000. Figure s~3-l shows that in the long term with the digital data base basically the same resulting data display is achieved with either parent scale. The difference between the two choices is level (higher or lower) of accuracy, resolution, content, production cost, and revisfon cost. In the infrastructure study, the concept of a digital data base for regional infrastructure information is outlined. Many of the features (road networks, hydrography, buildings, etc.) needed as background for the display of infrastructure information are features normally shown on a planimetric map. The possibility of establishing one digital base to serve both the infrastructure agencies (e.g. power, telecommunicat~ns) and medium scale mapping is explored in Chapter 6 (pp. 91-115) of the abovementioned study and will not be repeated here.

Long lenn t1edi urn Scale 1Mlpplng Program
for the
DIGITAL
1:50000
1:10000 Accuracv Content
Re;olu~i on ·
" < illl I .. d 1:5000
Display
Figure 5- !S·l
"'aritime Provinces
GRAPHIC
1:10000
1:5000
The CG-~onents ·of the rredi um scale program: The question of whether the parent scale wi 11 be 1:10 000 or 1: 20 000 remains open at this time. Arrows D._ G represent data that is collected and updated in digital mode; arrows G-o represent data that is co:-;:;iled graphically and subsequently digitized. The third dimension of the diagram represents the overlays.
GRAPHIC Dlr.tTAL
Gser--~ ducer )
-"~~~/
1:20000
Parent Scale
1:10000 1: 1."·~,,~
II
I ~ Display
rr v I ~ woo 1. Display
(j
+::>

- 55 -
5.4 MEDIUM/SNALL SCALE REQUIREMENTS: THE NTS l :50 000 MAPPING
The Maritimes have been fortunate in that there has been complete
coverage of the region at 1:50 000 scale in the National Topographic Series
for many years. It is not surprising that in the questionnaire a great many
users indicate that they are familiar with these maps and use them
regularly.
It is clearly not within the s~ope of this study to suggest changes
to the NTS maps. They are available, they cover the entire area, they are
attractive in appearance, they are rich in content. Being multi-coloured,
information is readily readable even when it is quite compact. The NTS maps
are obviously invaluable.
Inevitably, they have limitations. They are never up to date;
this is because there is a time lapse of up to four years from photography to
release. They cannot be revised frequently; this is primarily because of the cost
of multi-colour reproduction. There are limitations in content; this is primarily
because of the cost of field completion.
In addition, there are limitations imposed by the scale itself.
When we bear in mind that features are reduced 50 000 times, we can see that many
features are reduced to microscopic size; thus many features are represented by
a symbol which bears little relationship to the actual size of the feature.
If we accept 0.2 mm as the smallest dot, then the smallest feature that can be
represented in its true proprotion is a feature that is 10 000 mm (10 m) in
diameter. The size of objects smaller than 10 m have to be exaggerated if they
are to be shown. The point of this discussion is that there is a limit to what
can realistically be expected from a 1:50 000 map. This, incidentally, explains
why information on a small scale map is rarely of value in compiling a larger
scale map. In theory the converse is not true; in practice there are limitations
this way also. The limitations are not matters of accuracy or of content but
simply of "housekeeping" and of startdardi zation of the i nfromation. In practice
it is more economical to start with uniform photography and compile a 1:50 000
map independently than it is to start with say, 25 maps at 1:10 000 and condense
and edit the information from the 25 maps. This explains why, under present
practice, the 1:50 000 series is an independently compiled parent scale (Fig. 2-l-2).

- 56 -
If all the data needed for the compilation of the 1:50 000 series
could be obtained photogrammetrically there would be no need to discuss the
series any further in this study. However, as for the larger scale maps,
there are several "themes" that do not show up on aerial photographs and
as dfsct,~ssed previously the "field completion" necessary to collect the
data for these themes is costly. Thus, if'provision for the flow of this
data from the medium scale data base to the rrrs data base can be built
into the design there should be significant economies and improvements fn
the quality of the data shown on the 1:50 000 maps.
5.5 RECOMMENDATIONS
i. For high density urban areas it is recommended that the basic
map data be compiled at a quality level equivalent to that
of 1:1000 scale maps.
ii. For low density cities, suburbs, towns, villages and
urbanized rural communities it is recommended that the basic
map data be compiled at a quality level equivalent to that
of 1:2000 scale maps. Further, as an essentital step in the
planning and budgetting for this series, it is recommended
that an index (see Appendix D) showing the boundaries of
cities, towns and villages be compiled.
iii. For both of the above series it is recommended that the"LRIS
standard" not include "field completion" data. It is further
recommended that a program be introduced whereby local govern
ments have an opportunity to provide field completion data
and in return re-ceive a map that is "tailored" to their
particular needs.
iv. Project mapping: If there is a likelihood that the data compflec
during project mapping will be of value in the LRIS data base
then a co-operative or joint venture with the project agency
is recommended. If it is anticipated that the data will be
of negligible value to the LRIS data base it falls outside.the
terms of reference of this study.
v. For agricultural areas: As the requirements vary depending

- 57 -
on the type of agriculture it is suggested that
agricultural requirements be included in a proposed
Resource Mapping Workshop (See vi below)
vi. Regional requirements: There is a definite need for a medium
scale map (and map data base) covering the whole of the
Maritimes. It is recommended that a Resource Mapping Workshop
be held before a firm recommendation as to scale (quality level)
and content be made.
vii. Regional requirements at medium/small scale: The 1:50 000
NTS map series meet this requirement very well. The design
of the regional cartographic information system should provide
for the flow of certain theme data from the medium and large scale
data base to the NTS data.base.
Viii. Compilation of a digital cartographic data base: On the
assumption that in the long term (20 to 30 years), the data
base for all map products will be in digital form, it is
recommended that a theme-by-theme (Figure 3-1-1) approach
to digitization be followed. It is further recommended
that an in-depth analysis of the family of mapping themes
be made in order to establish the sequence in which the themes
should be digitized.

PART B

-58-
6 THE CARTOGRAPHIC FRAMEWORK
6.1 DEFINITION, REQUIREMENTS, EXTERNAL FACTORS, CONSTRAINTS AND ASSUMPTIONS
6.1.1 Definition and Requirements
In Chapter 3 the family of maps and their component themes were
illustrated symbolically (Figure 3-1-1) and in Figure 3-3-1 the concept of
an integrated position information exchange was illustrated. It is implied but
nol stated specifically in Chapter 3 that all the ''theme" sheets (T1L, T2L, etc.
in Figure 3-1-1) should be consistent with each other so that they may be
readily superimposed. Similarly it was implied that the digital data files
in Figure 3-3-1 should be structured such that they can be readily correlated
with the graphical theme sheets.
In this study the cartographic framework is defined as the composite
of all the elements that will facilitate:
i. The development of coherent graphical map series, at all scales,
printed from a combination of themes;
ii. The creation of a homogeneous digital file system (over the next
t:G Y"ilr~j (HI Lin:! ~in:!IIIE:!-uy-tnerne concept; and finally
iii. The integration of digital and graphical data via a one-to-one
correspondence bet1~een the graphical and digital source files.
In a different perspective the cartographic framework is a
broad set of specifications that should be adopted and not be subject to change.
The first cartographic framework element is the map projection plane.
This is a vital requirement because the compilation of data on maps cannot be
initiated before the map projection plane is selected. The factors to be
considered in selecting a map projection plane are discussed in section 6.2.
The second cartographic framework element is the coordinate system(s).
In most of our day-to-day activities we can ignore the fact that the surface
of the earth is curved (quite apart from local topographical features). This
enables us to create a multitude of rectangular designs (buildings, lots, sub
divisions) within which we can use plane trigonometry. Thus, on the assumption

that society in general cannot be converted to the general use of ellipsoidal
coordinates some type of plane coordinate system is necessary. It is then a
question of which plane coordinate system, or systems, should be used. This
is discussed in section 6.3.
The third cartographic framework element is the referencing system.
T,he referencing system is the mechanism which establishes the linkage between
the maps and the land. There may be many coordinate systems in use. Referencing
systems are printed on maps to enable users to relate their own coordinate
system with the features on the earth's surface. This is discussed in section
6.4.
The fourth cartographic framework element is the packaging.
This is a new term which is introduced in order to convey the concept that
the selection of map sheet boundaries in map production and its digital
counterpart in digital form is independent of the map projection plane, of
the coordinate systems and of the referencing systems. A rational system for
numhering the map sheets, and the correspondinq digital entity, is a vital
part of the packaging system. The packaging choice has far-reaching con
sequences hence it deserves an extensive analysis. This is discussed in
section 6.5.
6.1.2 External Factors and Constraints
Within the cartographic framework there are constraints and
external factors which must be taken into account. These are:
i. The National Topographic Series (NTS) of maps at scales 1:1 000 000,
1:500 000, 1:250 000 and 1:50 000 are complete though not always
up-to-date. Their packaging is based on the ellipsoidal coordinates;
they are compiled on the Universal Transverse Mercator (UTM) map
projection plane; the predominant reference grid, representing the
UTM plane coordinate system, is printed on the 1 :50 000 and the
1:250 000 series together with the graticule (parallels of latitude
and meridians of longitude) as a subsidiary referencing system.
ii. In Nova Scotia the 3° Transverse Mercator (3°TM) projection in two
zones is used as the map projection plane for large scale map

-60-
sheet boundaries and as the basis for the plane coordinate system.
In New Brunswick the stereographic projection is used as the map
projection plane for large scale map sheet boundaries and as the
basis for the plane coordinate system. In Prince Edward Island
the stereographic projection is used as the map projection plane
and as the basis for the plane coordinate system.
iii. For provincial use, specifically for land surveying and engineering
surveys, a plane coordinate system having distortions no greater
than 1:10 000 is required.
6.1.3 Ass~mptions
i. Some form of integrated position information exchange along the
general lines discussed in Chapter 3 will be evolving as the
number of digital themes increases.
ii. The cartographic framework of the 1:50 000 NTS maps will not change
significantly.
iii. .... , , . . "':' 11lc 1<::.\.lll.li.IUII Ul uiyiicti ciata '\p"iace-related data in digital form)
corresponding to large and medium scale maps is many times finer
than the resolution of the digital data corresponding to the small
scale maps. Consequently the amount of data at the regional level
will be many times larger than the amount shown on NTS maps.
iv. Sub-division plans will be used as a base for data for several
of the more important themes of the information exchange.

-61-
6.2 MAP PROJECTION PLANE
In Section 6.1 it was stipulated that a map projection plane is an
element of the cartographic frameworl~. This is because the shape of
the earth is ellipsoidal whereas the paper on which we portray our maps is
flat. lhus, not having some type of convex paper, we must have some type of
map projection plane by which we can "project" the ellipsoidal surface of the
earth onto a plane. This implies that:
·i. For mapping, the ellipsoidal coordinates must be transformed to
some type of plane coordinate (Figure 6-2-1).
Figur~> fi-:;1-l
ii. Every point on the ellipsoid must have a corresvonding point on
the map projection plane. In this discussion we will limit the use
· ot the term "map projection plane" to the case of a plane which is
used for mapping. Thus the discussion will be appreciably simplified
and the controversial question of survey accuracy requirements will
be discussed under "coordinate systems". Here it will be necessary
to discuss only the accuracies of the relevant map projection planes
and their implications.
The accuracies of the three projections under consideration in the
Maritime Provinces were analysed thoroughly in "A Critical Review of Existing
and Proposed Map Projection Systems for the Maritime Provinces".*
* Hamilton, A.C., Chrzanowski, A., Vanicek, P., Castonguay, R.H.: A Critical Review of Existing and Possible Map Projection Systems for the Maritime Provinces, U.N.B. Department of Surveying Engineering for the Land Registration and Information Service, (Fredericton, 1975}, hereafter referred to as the "Project ion Study".

--
"' ~ ~·
t( -~
~~ .. -II
" N
c b/Jf/11/QJV
l/rM· z~ 4£l(fi['ll~ ...:_ ~
a •rh1 ZvNr- 8.DitNJ>~.IY:
. .
_r- __ : --
wrJ.f
---
-62-
--- -
• . . ~
' ~-~ ~
" .. ~ ti
~~ ... "' .. \j .. .. ~
---
. • v • _., ~
- -- ---

-63-
The maximum linear distortions were as follows:
UTM - 1:2500
3°TM - 1:10 000
Stereographic (N.B.) - 1:10 000
Stereographic (P.E.I.)- 1:25 000
In the Projection Study it was concluded that, from a ~
graphical point of view, the UTM map projection plane is sufficiently accurate.
I.f, however, as will be discussed subsequently, the 3°TM or the stereographic
plane coordinate system is to be used for land and engineering surveys there
is not merit in introducing the UTM map projection plane. The 3°TI1 and
stereographic reference grid would have to be plotted on the UTM map projection
plane and would be slightly distorted along with all the other map features.
The difference of scale between the UTM reference grid and the provincial
reference grid would be 1/2000 along the 69°W and 63°W meridian (Figure 6~2-2};
the UTM reference grid being smaller than the provincial reference grid
(+1/10 ooo·- 1/2500 = l/2000). Assuming the change along the meridian is
constant {this is very close to reality at medium and large scale), the
difference in the lllii!'J!'Jerl ll>r!!J+h 0-~' t~::: '!:·.-:~ .:-cf:rence grids, on a si,t:o::l i5 em
wide, is as follows: 3°TM - UTM = 0.015 inches = 375 micrometres; this is
a significant difference. This difference is the average accuracy of a
'manually drawn line and is readily detectable by the unaided human eye. In
computer--assisted cartography the drafting is much more accurate (tO.OOl inch
i.e.! 25 micrometres).
If a map is compiled on the UTM map projection plane, the provincial
reference grid will be in error by as much as 0.015 inch. Similarly, when
compiling on the provincial map projection plane, the UTM reference grid is in
error by 0.015 inch. If we superimpose either the UTM reference grid or
the provincial reference grid on the other, there are two ways to minimize
the error:
i. One can distribute the difference centrally on a sheet so
that the error is reduced to 0.0075 inch in the worst case.
(6.2 ft@ 1:10 000 scale).
ii. One can enlarge or reduce one reference grid slightly (0.25%) in
order to make one fit the other. The above enlargement or reduction
is the largest that occurs in the Maritimes. It is different with
every sheet.

-64-
It should be noted that both of these alternatives would be difficult to
execute manually but could be done with relative ease by computer-assisted
methods.
From a digital perspective the introduction of the UTM as the
Maritimes map projection plane would mean that some user-producer could
collect, store, and display data on the UTM map projection plane while
others could collect, store, and display on the provincial map projection
plane. In order for the majority of agencies to exchange theme data and
for the agencies' themes to be overlaid readily in either graphical mode,
digital mode or both, it is highly desirable that everyone including LRIS
use the same map projection plane. The situation where half the data would
be on the UTM map projection plane and the other half on the provincial
projection plane appears to be the worst situation possible because it would
create the maximum amount of rlata transformation. It could also jeopardize
the exchange of data between various users. -The ideal situation is to have
only one system. But accepting that the ideal might not be achieved, the
next best alternative is to have most of the information in one system.
Since the largest quantity of information is at the local and regional level
and since only a very small fraction of that information is required at the
_national level, the best way to minimize the number of trc.nsformations is
to keep all the information in the provincial .nmp projection plane.
If the provincial plane coordinate systems and map projection
plane were based on the same projection system, most of the regional and local
users would then be collecting and displaying data on the UTM map projection
plane, however, since those users would need an accuracy less than 1:2500,
the data when overlaid on the provincial map projection plane would be in
error by 1:2000 at the most. One can assume that if 1:2500 is sufficiently
accurate 1:2000 would not create any significant problem. Also the medium
and large scale data, collected or projected on the provincial map projection
plane would carry insignificant error when reduced to 1:50 000 to overlay on
maps projected on the UTM mapping plane. Conversely, when enlarging and
overlaying 1 :50 000 data· on the larger scale maps the distortions due to the
map projection plane will be negligible in comparison to the inherent accuracy

-65-
of the 1:50 000 data.
so as:
In summary the choice of. the map projection plane should be made
i. To minimize the problems in map production. Problems in
map production will be minimized when the map projection plane
is made consistent with the predominant reference grid; this is
the reference grid which will be used most.
ii. To prevent foreseeable problems in the graphical and digital
interface, i.e. in the interface between the themes that are
filed graphically and those that are filed digitally.
Ih light of the above considerations~~ 4ecommended that the
map p!I.Ojec:ti.on plane be .COit6~.ta.nt with the p!Ledombra.nt 4e6Mence g!Ud.
On the basis of the recommendation in section 6.4 that the predominant
reference grid be the grid of the provincial coordinate system ~ ~ ll.ecommwded
that the planu o6 the pJtav-lnc.la.t plane coMdbra.te hy4te.mA be adopted M the
map p!I.Ojection pla.nu with-ln. the MaJL.Lti.me. PJtOvincu.

-66-
6.3 COORDINATE SYSTEMS
6.3.1 Review of the Coordinate Systems in the Maritime Provinces
Approximately fifteen years ago New Brunswick, Pri nee Edward
Island and Nova Scotia adopted the plane coordinate concept for surveying,
mapping and engineering activities. Due partly to the shapes of the
individual provinces and partly to their individual administrations, three
different plane coordinate systems emerged. These systems are based on two
different map projection planes. New Brunswick and Prince Edward Island
plane coordinate systems are based on the stereographic map projection and
the Nova Scotia one is based on the 3° Transverse Mercator map projection
(two zones). The coordinates are all expressed in feet. The UTM plane
coordinate system and the ellipsoidal coordinate system (latitude and
longitude) are also being used. This means that there are five coordinate
systems in use. To add to this diversity two variants of these coordinate
systems are appearing. In these variants the coordinates of points are
being expressed in metres on an ad hoc basis. This is due to pressure to
produce metric plans to accomrrodate the construction industry v1hich is
schP.duled to go metric on January 1, 1978. The confusion ensuing from the
introduction of these ad hoc systems will not be significant if the new
fully metric systems become available soon. However, if it would turn out that
·the regional readjustment of the second order control network, whirh is
scheduled to be completed by the end of 1978, vJere delayed then there would
inevitably be a delay in the establishment of a fully metric system and the
confusion introduced by these ad hoc systems would continue for mny years.
6.3.2 Plane Coordinate Systems Needs
Coordinates are a lunguage through l'lhich surveyors, mappers,
engineers, and a number of other professions are communicating more and
more. They can be used to define elements related to land, air or sea.
They specify where elements are located in space and how they are related
with respect to each other. Depending on how the coordinates are grouped,
they can inform the users as to the location, shape, size, volume and orien
tation of the element under consideration. In another perspective the
coordinate systems are working tools which have increased in importance

-67-
in the last fifteen years. This is due to the necessity for improving our·
survey practice which in turn reflects the increasing attention that society
is giving to land and its utilization.
The specific needs of the engineering and land surveying
professions were examined in the Projection Study referred to previously;
the conclusion of that study was that a provincial plane coordinate system
with a maximum distortion not greater than 1:10 000 was necessary to meet
engineering and land surveying requirements. The plane coordinate systems
capable of meeting these requirements are the stereographic and the 3°
Transverse Mercator systems.
The zone boundary problem was discussed briefly in the Projection
Study and several examples of problems that zone boundaries cause are presented
subsequently (section 6.5). From this it is apparent that plane coordinate
systems should be selected such that zone boundaries do not fall in or near
any significant development centre.
At this stage then we conclude that:
i. Zone boundaries are unacceptable in any "active" area such
as a city or its region of influence;
ii. The choice of plane coordinate system(s) for the Maritimes is
limited to the stereographic projection and the 3° Transverse
Mercator projection.

-68-
6.4 REFERENCING SYSTEMS
In general, referencing is the process of measuring the horizontal
distance and direction from a land mark to an object of interest. In
cartography, referencing is the process of establishing the relationship
between the recorded elements of the earth's surface, in graphical or digital
form, and the coordinate systems which permit the elements to be located
on the ground.
In digital cartography the referencing is the mechanism which permits
one to establish the relationship between the coordinates of the elements
stored in the computer and the coordinate system in which the users wish to
work on the ground; it may be to locate a physical element on the earth's
surface or to store a collected element in a digital computer.
In graphical cartography the referencing is the mechanism which
permits one to establish the relationship between the elements plotted on
maps and a coordinate system. Given a coordinate system, the element can be
plotted directly on the mapjor given elem~nt on a map, its physical location
on the ground can be directly determined and located. Consequently the
referencing.systems permit- the users and producers to go back and forth
between the maps and the earth's surfaces. In·order to aco1ieve this there
must be at least one graphical referencing system on maps. However thenecan
be more than one. It is important to note that there are two main types
of graphical referencing systems:
i. Grid type: this is two sets of parallel lines intersecting
at right angle and forming squares or rectangles.
On a map they represent a plane coordinate system.
ii. Graticule type: this is a network of lines representing the
earth's parallels of latitude and the meridians of
longitude.
In the first case the graphical referencing system is a reference grid.
There can be many reference grids on a mdp. One can be representing the
provincial plane coordinate system; another can be representing the national
plane coordinate system; and finally there can be reference grids representing
other plane coordinate systems. Ideally there should be only one r.eference
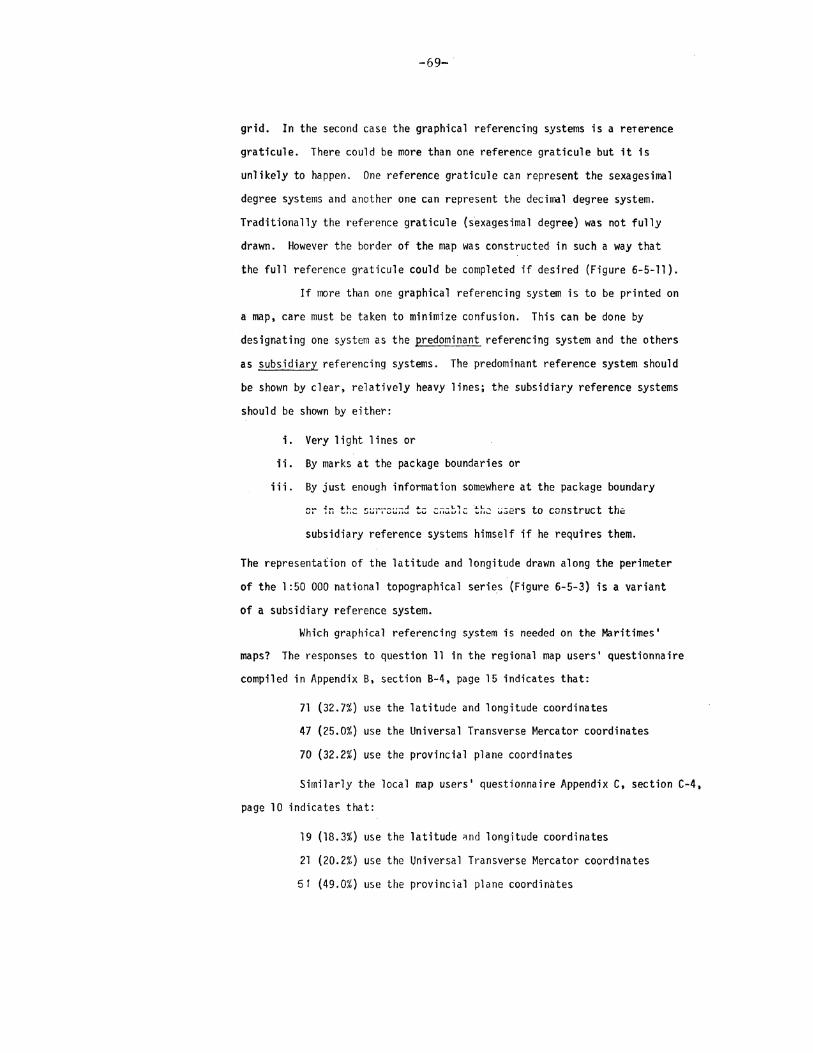
-69-
grid. In the second case the graphical referencing systems is a rererence
graticule. There could be more than one reference graticule but it is
unlikely to happen. One reference graticule can represent the sexagesimal
degree systems and another one can represent the decimal degree system.
Traditionally the reference graticul e (s.exagesima 1 degree) was not fully
drawn. However the border of the map was constructed in such a way that
the full reference graticule could be completed if desired (Figure 6-5-11).
If more than one graphical referencing system is to be printed on
a map, care must be taken to minimize confusion. This can be done by
designating one system as the predominant referencing system and the others
as subsidiary referencing systems. The predominant reference system should
be shown by clear, relatively heavy lines; the subsidiary reference systems
should be shown by either:
i. Very light lines or
ii. By marks at the package boundaries or
iii. By just enough information somewhere at the package boundary
subsidiary reference systems himself if he requires them.
The representation of the latitude and longitude drawn along the perimeter
of the 1:50 000 national topographical series (Figure 6-5-3) is a variant
of a subsidiary reference system.
Which graphical referencing system is needed on the Maritimes'
maps? The responses to question 11 in the regional map users' questionnaire
compiled in Appendix B, section B-4, page 15 indicates that:
71 (32.7%) use the latitude and longitude coordinates
47 (25.0%) use the Universal Transverse Mercator coordinates
70 {32.2%) use the provincial plane coordinates
Similarly the local map users' questionnaire Appendix C, section C-4,
page 10 indicates that:
19 {18.3%) use the latitude ~nd longitude coordinates
21 (20.2%) use the Universal Transverse Mercator coordinates
51 (49.0%) use the provincial plane coordinates

-70-
From these responses it is clear that all three graphical referencing
systems are needed. Which of these should be the predominant one and which
one the subsidiaries? It follows from the questionnaire responses above and
from section 6.2 that the reference grid of the provincial plane coordinate
system should be the predominant reference grid. The UTM reference grid
and the reference graticule should be the subsidiary graphical referencing
systems.
In view of the fact that with monochrome reproduction it is difficult
to clearly distinguish between many reference grids, ~ ~ 4eeommended ~hat:
.i. The 4e6e4ence g!Ud 4ep!t.e<le.l'lilllg the p!t.ov.i.nd.ta.t p.i'.ane
coo4cUna.te ~y1>tem be ~he p'Ledom.i.na.nt 4e6e4ence g!Ud a.nd ~hat
U be 1>hown by hrA.vy UnM.
U. The Un.i.v~a£. T4a.MveMe Me4ca.to!L p.i'.ane cooJtcii.nate ~y1>tem a.nd the
etU~o.i.da£ cooJtcii.na.te ~y1>tem be .6_u.b-6.i.cii.aJty 4e6e4enung 1>y1>~em-6.
W. The .6u.b-6.i.cii.a4y 4e6e4enung 1>y~t~ be 1>hown .i.n a- r;xx.y tha.t minbnizM
con6u.-6.i.on W.Uh the p!t.edomina.nt Jte6e-'tence g!Ud.

-71-
6.5 PACKAGING
6.5.1 The Packaging Concept
In the English language there is no noun or compact phrase
comparable to the French "decoupage cartographique" - literally "cartographic
cutting" - to describe a system of sheet lines (neat lines) for map series.
Clear terminology on this topic is necessary. Based on Webster's dictionary
the definition of package is: "The act or process of packaging a conrnodity
or a unit of product uniformly wrapped". We are proposing that packaging be
accepted as the English equivalent of "decoupage cartographique" and that it
be extended to cover the equivalent block of map data in digital form.
To distinguish between graphical and digital modes we will introduce
the terms "geo-graphical" and "gee-digital". Thus geo-graphical packaging
will encompass all aspects of the selection and use of a system of map
sheet boundaries or of system~ of sheet lines for the production of graphical
maps and geo-digital packaging will encompass all aspects of defining the
bounds of spatial data in digital files. As illustrated in Figure 6-5-1 it
is essential that there be a one-to-one correspondence between geo-graphical
In this part of the report a package will be the name used for the
spatial building block of the integrated position information exchange
(Figure 3-3-1). For all parent scales (Chapter 5) the packaging should be
agreed upon and all data - graphical and digital - should be uniformly
packaged. Specific recommendations on packaging for the Maritimes are made
at the end of this chapter.
What does a package contain? A theme package will contain only
the data of that theme within the bounds of the package; it may be a geo
graphical package or a geo-digital package. A map package will contain as
many themes as the cartographer specifies.
The essential point however is that everyone who is collecting or
storing position information agree on and ,_a=dh""e"-'r-"e'---"-to::c_,a.."-----_J.P::::a.::oc""ka""'g'-'i"'-'n-il.g-:a~.:g u~i:..:d:::e~l.:.:i n:.:.:e:.:S:..:.·

-72-
PACKAGING
GEO-GRAPHICAL PACKAGING GEO-DIGITAL PACKAGING
-·--- -------------------1
Family of Themes
_ One t Of!!L Corresp ndence
' ' ' '1.
Map Series Cathode Ray Tube Display
Figure 6-5-1 Maritime packaging concept and its relationship with the theme concept in both graphical and digital form.
' ' "' .... - .... , . ' \ I

-73-
6.5.2 Geo-graphical Packaging
The need for geo-graphical packaging does not require any
justification. All map users and producers realize that this is a necessary
technique to permit the con~ilation and presentation of the earth's physical
and cultural features at medium-small, medium and large scales. However
there are limitless ways to package the geo-graphical data. This can be
appreciated through an examination of Figure 1-0-2. Consequently a
rationalization of geo-graphical packaging in the Maritime Provinces is
greatly needed. The geo-graphical packaging must be designed with foresight
together with consideration of present technology. The main characteristics
can be summarized as follows: it must be unique, homogeneous, preferably
continuous, unambiguous, expandable horizontaly (off-shore) and vertically
(for condominiums). In order to achieve this goal a territorial coordinate
system is required. The four systems that will be explored are:
- The 3° TrarlVerse Mercator (a plane coordinate system)
- The Universal Tra~verse Mercator (a plane coordinate system)
- The Sexagesimal Degree
- The Decimal Degree
6.5.2.1 Production Aspects
(an ellipsoidal coordinate system)
(an ellipsoidal coordinate system)
The type of production difficulties encountered with pre~ent
production techniques will depend on the territorial coordinate system which
is selected for geo-graphical packaging. If a plane coordinate system is
selected then one set of difficulties is encountered and if an ellipsoidal
coordinate is selected then another set of difficulties is encountered.
a) Production difficulties when packaging is based on a plane coordinate system.
· If the entire territory to be covered by a map series falls within
one zone of a plane coordinate system, the use of plane coordinates for
packaging has many attractive features. For instance all the packages can be
the same size and all can be rectangular or square. A successful example of
square packaging is existing in Great Britain where all packages are in a 10°TM
* zone; another successful example of rectangular packaging is in !lew Brunswcic.k
where all pacl:ages are in one stereographic zone.
Mal ing, P.H., Coordinate Systems and Map Projections, George Phil i Son Limited, London, 1973.

-74-
Difficulties arise when the territory does not all fall within one
zone (Nova Scotia falls in two 3°TM zones). The problems that can arise at the
zone boundaires will be demonstrated using three possible geo-graphical
packaging alternatives (Figure 6-5-2).
Alternative #1
In alternative #1 the packages butt-join at the zone boundaries.
Due to the plane coordinate convergence there would always be non-standard
packages along the zone boundaries. (Figure 6-5-3). Packages could be produced
in many combination of sizes. But how small and how large should the packages
be at the zone boundaries?
Type B - Packages could be produced in their respective zones up to 0.6 metre in length;
then
Type C - A new hybrid package 0.2 metre in length could be produced with the orientation based on the meridian at the zone boundary. This could continue until these hybrid packages reaGh the size of 0.4m, 0.5m or 0.6m.
then
Type D - The package orientations could revert to their respective zone orientation. In this event the packages would be ~ma1ler th::111 th<:> St"'ldi~>'d P"r.kage format. This ro1_1ld i)e 0.2m or 0.3m depending on the maximum size of Type C.
Alternative #2
Alternative #2 resembles alternative #1 except ti,at the packages
are allowed a greater variation in size arid the hybrid Type C is eliminated.
Type B - In this alternative the focal point is that a half metre package is a relatively small package. Consequently packages could be produced in their respective zone until their size reached 0.7 metre in length;
then
TypeD- As the packages become larger than 0.7 metre in length, two packages would be produced - a standard half metre package and a non-standard 0.2 metre package.
Alternative #3
The objective in alternative #3 is to produce only standard packages.
In doing so an overlap will be unavoidable.
Type E - All packages could be 0.5m x 0.5m.

-7':J-
Alternative 1
Alternative 2
Alternative 3
package type
Type A
(Standard package size)
Type B
(Larger than standard size)
Type C (Hybrid smaller than standard size)
Type C
Type D
(Smaller than standard size)
Type B
Type D
Type E
(Overlapping standard size)
Type E
Figure 6-5-2 Alternatives at the ~one boundaries with geo-packaging based on the plane coordinate system. It assumes that the standard geo-packaging size would be a 0.5m square.

J O.H
.... ll A, IR B 0 U H .\ ! i
............ _:~~:=--=·4--~-~-~-~..:=.:...:.:_:~ --------\i ·~ \''
_1~~- [)~gby
j ~ ~
62 I., .•
63
I I
~----- Zone 19 ----~·~ I
--------Zone 20 ------------------~
Figure 6-5-3 This figure is a sub-set of Figure 6-5-2. It illustrates Alternative #2 at the zone boundary, in the Saint John area, with packaqinq based on the UTM plane coordinate system. It assumes a standard package size of 0.5m square.

-77-
Analysis of production problems for the three alternatives with respect to:
size variation in compilation, printing and filing.
The ideal in the compilation, printing and filing is to have all
the map sheets of the same size; to achieve this all the geo-graphical packages
must be the same size. In this respect alternative #3 is the best choice
because all packages and maps would be the same size. A standard geo-
graphical package and a standard map sheet size could be designed and the size
variation in compilation, printing and filing would present no problem. The
second best choice in this respect is alternative #1. In this alternative
non-standard packages would be introduced to permit butt-joins in the packaging.
Howeve.r, the size of the non-standard packages would not be drastically
different from the standard one. There are some possibilities that simultaneous
design of the packaging and tbe surround at the boundary could lead to a
standard map size. Alternative 12 would cause the most problems in the compilation,
printing and filing. This is because there would be a large variation in
package sizes at the zone boundaries. Variations in map sheet sizes would be
inevitable because there is no possibility that the surround could accommodate
the large variations and at the same time opitmize the paper size.
From the compilation, printing and filing point of view alternative
#3 is the best; it is followed by alternative _#1 and finally alternative #2.
Identification and definition
A geo-graphical package is representing a precise and uniquely
defined area of the earth. It implies that the boundaries, the corners and
the area of each package are precisely and uniquely defined. The ideal is
to have packages which are easy to identify (boundaries and corners) so that
there can be no confusion among the various producers with respect to the
location of the boundaries or corners of the packages.
In alternative #1 the packages are uniquely and precisely defined
however they are very difficult to identify. This is because every package
must be checked for validity. Then the result form this check indicates
a type A, type B, type C or type D package. Once the type has been identified
the package must be defined according to the policy which has been adopted.

-78-
At the zone boundary, type Band typeD are defined as follows: (Figure 6-5-4)
A r ,,
J,
p •• Left Zone
Consequently
Type B Type D
lJ A ,: , 6 r. •z --.
I
J, cl, lo, l.z J,_
b, "'~ I
c D •• F <a e ~
~ . Right Left : Right Zone Zone I Zone
I I
I Figure 6-5-4
Corners A & D are defined by coordinates from the left zone.
Corners B & C are defined by coordinates from the right zone.
Corners E & F are defined as the intersection of the right and left coordinate systems with the meridian of the zone boundary.
Edges c1 and c2, a1 and a2 are not parellel.
Edges b2 and d2, ct1 and b1 are not parallel.
Edges d1 and d2 are not parallel.
Angles EBC, DCF, EAD and ADF are right angles.
Angles BEF, EFC, AEF and EFD are not right angles.

-79-
There are two possibilities to define type C.
Possibility #1 (Figure 6-5-5)
Left !Right Zone Zone
Figure 6-5-5
Corners A & D are defined hy ~oorpi~~tPS from the left zone.
Corners B & C are defined by coordinates from the right zone.
Middle point E & F are defined as the intersection of the right and left coordinate system with the meridia.1 of the zone boundary.
Consequently
Edges a & d, b & c, f & e are not parallel.
Edges b & f, c & e are parallel
Angles EAD, ADF, EBC and BCF are right angles.

-80-
Possibility #2 (Figure 6-5-6)
Corners A1 and o1 are defined by coordinates from the left zone.
Corners s1 and c1 are defined by coordinates from the right zone.
Middle point E1 is defined as the intersection of the right and left coordinate systems with the meridian at the zone boundary.
Middle point F1 is defined as the intersection of the straight line joining o1 and c1 with the meridian of the zone boundary.
Corners A1, Bi' c1 and D; are defined like A1, s1, c1 and 01.
Middle points Ei and Fi are defined like F1•
Corners Aj' Bj' Cj and Dj are defined like A1, B1, c1 and o1.
Middle point E. is defined like F1. . J
Middle point Fj is defined like E1.
In alternative #2 the packages are uniquely and precisely defined
but the definition is not simple. Following the validity check a Type A, B,
or D. is identified. Type A are standard packages and Type B and D have
been defined previously (Figure 6-5~4).
In alternative #3 the packages are precisely defined but the.v are
not uniquely defined consequently this alternative cannot be accepted for
packaging.
The problems of identification and definition of the packaaes at
the zone ·boundaries have been shown. As alter·native #3 does not permit
unique packaging at the zone boundaries it is rejected. Alternatives #1 and
#2 do permit unique packaging but the definition of the packages are rather
complex. As alternative #2 presents fewer problems (Figure 6-5-5 and 6-5-6)
than alternative #1 it is the best choice with respect to package identificatio
and definition at the zone boundaries.
Numbering System
It is difficult to discuss the numbering system because the problems
likely to occur will be different with each numbering system. Nevertheless
it would be unrealistic to have more than one package having the same number.
In other words the package numbering should be unique. In order to achieve
a unique number for each package, there must be a distinct numbering system
within every zone. This is because
i. It is difficult to carry the numbering system across the zone

-81-
A,
P,
p J
A· I
£,
F.
l
eft L Zone
8.
(.'l
I "J
f·
f'• J
Ri ht g Zone
Figure 6-5-6
-

-tl2-
boundaries due to the discontinuity
ii. The number of zones is unknown in a system which is designed to be
expandable
Due to the increasing use of computers in cartography it becomes advisable
to select a numbering system which can function efficiently in digital mode
while fulfilling the requirements of a graphical system. In other words the
numbering of the geo-graphical and gee-digital packages should be identical.
Alternative #1 would cause some problems in the numbering system.
More specifically the numbering of type C packages would be a problem because
they would not fall in any zone. They are on the zone boundary. In other
words special numbering at the zone boundary would increase the complexity
of the numbering system. It would be djfficult to create a rationalized and
integrated numbering system.
Alternative #2 would not cause any_ package numbering problems
because packages are designed to butt-join on the zone boundaries.
Alternative #3 could cause problems One problem is indicated in
Figure 6-5-7. In this fiqure the illustrated oackage is defined by thP. plane
coordinates of the zone 20 and the package is also numbered in the zone 20
numbering system. Nevertheless the package is in the zone 21. This could
happen when uniform packaging bec?mes necessary for a project at a zone
boundary. This could happen in Cape Breton if the land belonging to zone 3
in the 3°TM was packaged in the coordinate system of zone 4 or if the land
belonging to zone 21 in the UTM was packaged in the coordinate system of zone
20 (Figure 6-5-7b and c).
Numbering problems are foreseeable at the zone boundaries in
Alternatives #1 and #3 but there is no problem foreseen in Alternative #2.
Consequently from the package numbering point of view Alternative #2 is the
best choice.
Referencing System
In Section 6.4 it has been recommended that a predominant reference
grid and two subsidiary referencing systems be printed on maps to represent
the three coordinate systems used in the Maritime Provinces. The predominant
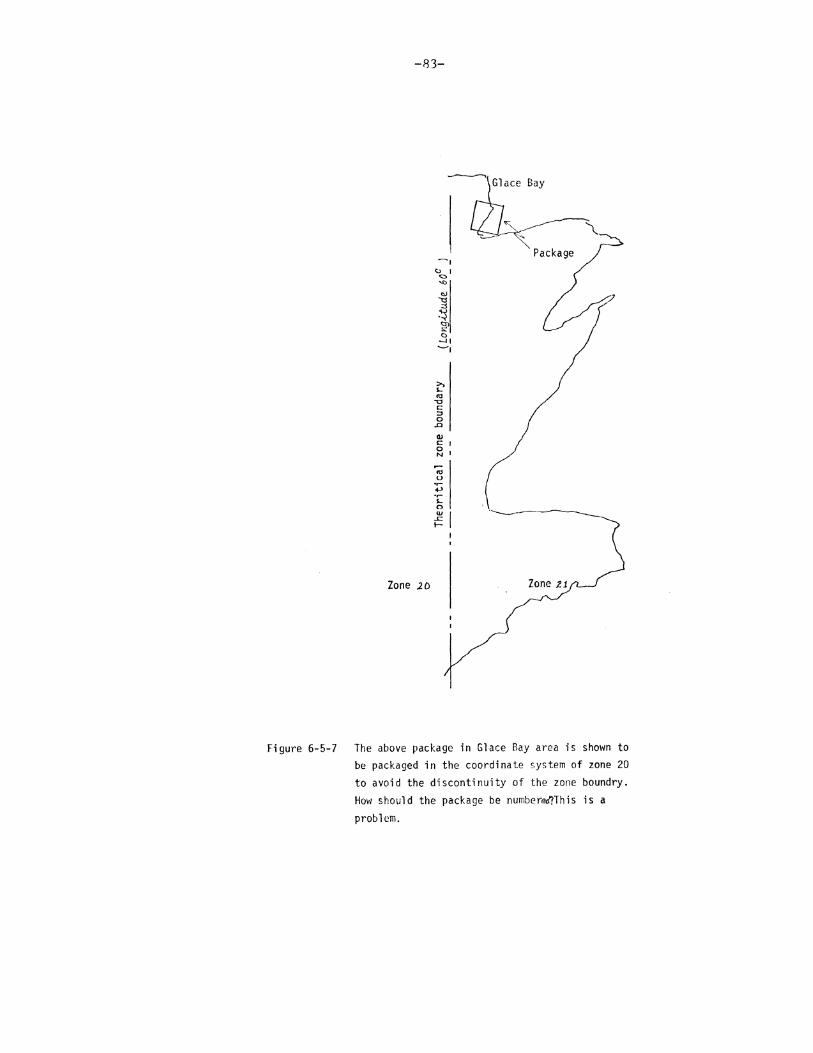
-83-
Zone .20
r:-"' -o c::
"' 0 .0
Q.l C::l
21 ';;; u .... ..., ·s: 0 w
..c:: 1-
Package
Figure 6-5-7 The above package in Glace Bay area is shown to be packaged in the coordinate system of zone 20 to avoid the discontinuity of the zone boundry. How should the package be number~This is a problem.

-R4-
reference grid represents the most used plane coordinate system but at the
zone boundaries there are two plane coordinate systems which are overlapping
one another. Consequently there are also two predominant reference grids
representing the two plane coordinate systems. So the problem· is - which
predominat reference grid should be printed on any map at or close to a zone
boundary? In the plane coordinate system it is customary to overlap the
systems for a width of approximately 25 miles. This procedure is necessary to
enable the users to extend one plane coordinate system across a zone boundary
to complete a project without changing to another plane coordinate system.
This need is well recognized in field operations but is it also recognized in
mapping? If. so, there is a need for the predominant reference grid to overlap
for a considerable distance. This may not necessarily be 25 miles at all
scales. A ground distance could be selected for every parent scale. Let's
assume that the predominant reference grid be carried beyond the zone boundary
for a width equivalent to four packages. Then the quantity of map sheets in
the Maritimes with a dual predominant reference grid would be as shown in Figure
6-5-7a for the 1:10 000 alone.
Packaging based on UTM Packaging based on 3°TM (Predominant reference (Predominant reference grid representing the grid representating the existing plane co-ordinate system).
3°TM plane :oordinate system)
Zone length requ1r1ng dual predominant 127 km (Figure 6~5-7c) 632 km (Figure 6-5-7c) reference grid
Number of packages with dua 1 predominant grid
@ 1 :10 000 127-f 5x8 = 203 632.;.5x8 = 1011
@ 1:2000 Difficult to evaluate Difficult to evaluate
Figure b-5-7a
This would cause numerous design and prod•Jction difficulties. There are
no methods to eliminate this problem except the elimination of the zone boundaries.

QUEBEC
J··-·· :
~
/~"~\ .~ -1 . I
w I 0 . ..,. w : I \ ~ / \
. 7'
MAINE ! / -It!
L-1 '"""'"'."/ 11J: \ ~ I I I \ . , / I '·· ;__}/ / I / /1 ~~- I
I ' / I/ I ~
I/ .~~ r -----/'1 r
Length of UTM zone boundaries (Inland)
N.B. 304 km N. S. 152 km P.E.I. nil
total 456 km
The number of non-standard packages at 1:10 000 is 182.
PRINCE EDW.PA-RD ISLAND
&
-~ rY-
~~JY 00
Figure 6-5-7b
I :x:> Vl I

QUEBEC
.s-----:
/ . ......., .. /
~
MA./N£
\ w 0 ~
Length of 3°TM zone boundaries (Inland)
N.B. 304 km N.S. 279 km P.E.I. 44 km
Total 632 km
The number of non-standard packages at 1:10 000 is 253
PRIN~E ED~ARD ~ :J~L.A.ND
- i
q,
~1.-fr 00
Figure 6-5-7c
I 00 0\ I

-87-
Data integrity
Integrity is defined asnthe quality or state of being complete or
undivided: completeness.n To achieve integrity there should not be any
package overlap. Any overlap creates duplication; the same information is Jh&
contained in two different packages. DuplicationAadds to compilation,
storage and reproduction costs. However where the problem is most accute is
in the updating of theme data for an overlapping area. Errors and inconsistencies
between packages covering the same area would inevitably occur. let's consider
only one theme, the cadastral one, among the numerous themes which will be
used to produce public map series. Further let's assume that a cadastral
mapper is assigned to revise a cadastral theme package as a result of a
single lot subdivision which has just been approved. How many times will
he revise the theme on one map sheet only? Often. LRIS has already realized
the duplication of the same jnformation at two different scales. What is
unacceptable for the cadastral theme will also be unacceptable for all other
themes.
Alternatives #1 and #2 do meet the data integrity requirements
but alternative #3 does not meet this requirement. Consequently alternative
13 is unacceptable for packaging from the data integrity point of view.
Map projection plane
In section 6.2 it has been shown that a map projection plane must
be selected before a geo-graphical package could be created. Whereas in
alternatives #2 and #3 there is no confusion with respect to the map projection
plane to be chosen, it is not the case in alternative #1. This is because
type C packages are on the boundary of two map projection planes. (Figure 6-5-2).
Should the left half, defined as AEFD,(Figure 6-5-5 and 6-5-6) be on the left
map projection plane and the right half, defined as EBCF, be on the right map
projection plane or should the whole package be on the right or left map
projection plane? There is no obvious rationale on which to make a decision.
From the map projection plane selection point of view alternative
#1 should be avoided.

-88-
Plane coordinate systems
The choice of plane coordinate systems (UTt1 or 3°H1) has no direct
impact on a~Y of the three alternatives. However indirectly the packaging
problems are proportional to the frequency of the zone boundaries. At medium
scale, say 1:10 000 there ~1ould be: 0¥'1
a) 182 non-standard packages for packaging basedAthe UTM plane
coordinate system (Figure 6-5-?b)
b) 253 non-standard packages for packages based on the 3°TM
plane coordinate system (Figure 6-5-?c).
At a scale of 1:20 000 the number of non-standard packages would be reduced by
a factor o~ two. The number of non-standard packages increases by twice
the scale increase i.e. four times greater scale leads to 8 times more non
standard packages. As many boundaries on both the UTM and 3°TM plane coordinate
systems in the Maritimes fall in economic zones, there would be a large number
of non-standard large scale packages produced. It is difficult to estimate
the number of non-standard packages likely to be produced but it is possible
that in the long term there might be as many at large scale as at medium scale.
The number of non-standard packages in either 3°TM or UTM is not
significantly different consequently the quantity of non-standard packages
doe~ not influence the choice of plane coordinate system (UTM or 3°TM) for
packaging.
This completes the analysis of the production problems associated
with each of the three alternatives for geo-graphical packaging of data at
the zone boundaries when the packaging is based on the plane coordinate system.
A summary of the production difficulty ratings is presented in
Table 6-5-1. It is apparent that none of the alternatives is effective in
eliminating the production difficulties.
In the following section the production difficulties when
packaging is based on the ellipsoidal coordinate system will be discussed.

-89-
Type of Production Alternatives ( Manual & computer Difficulties #1 #2
Size variations in B c campi 1 at ions , printing and filing
Identification and c B Definition
Numbering system D A
Referencing system c c
Data integrity A A
Map projection plane D A
Plane coordinate system -
Worst production D c di ffi cul t_y
A no difficulty B minor difficulty C considerable difficulties D severe difficulties E unacceptable
assisted #3
A
E
B
c
E
A
-
E
Table 6.5.1 Rating of production difficulties when packaging is based on the plane coordinate system.
Production

-90-
b) Production difficulties when packaging is based on an ellipsoidal coordinate system.
In the previous section it has been shown that there are a number
of production problems associated with packaging based on a plane coordinate
system. All of these are due to zone boundaries. When gee-packaging is based
on ellipsoidal coordinates the zone boundaries are eliminated in the packaging
and consequently all the zone boundary problems are removed.
Size variations in compilation, printing and filing
Presently thennanual production of maps based on the ellipsoidal
coordinates is being done by many agencies with no major difficulty. However
the use of the ellipsoidal coordinates for geo-graphical packaging generally
requires more con1pilation skill than the use of plane coordinates. There are
two main compilation problems. The first one arises because the packages
are not quite square (Figure ·6-5-8); the sides being meridians of longitude
are not parallel. However because of the limited range of latitude in the
Maritimes (43.5° to 48.0°) the maximum differente in package width is approximately
7 em. This variation would not be sufficiently large to warrant a change in
paper size. It can be accommodated in the design of the map surround without
any difficulty. The significance of the convergence of the east and west map
bour.daries dL and the singificance of the sag AS is a function of the size
and the scale of the packages. Table 6-5-9 shows the~L andAS values for
the range of scales recommended for the Maritime Provinces.
I I I
I I I I I I _L _______ I
~s --1 ~6L
Figure 6-5-8

SCALE
1:20 000 1:10 000 1:5000 1:2000 1:1000 1:500
-91-
.aS (inches)
7/1000 3/1000 2/1000 1/1000
..( 1/1000 ~~ l/1000
Figure 6-5-9
..n -C> -.. 0
Figure 6-5-10
.o L {inches)
37/1000 18/1000 9/1000 3/1000 2/1000 1/1000
~9:.
\)\)1~
~- ---~1
~,-OOG~ ----- .. -. ----- 006
"--~--
-- 0055
-- oos
004s

-92-
The package size which has been chosen for these computations are the existing
.1:10 000 in Ne1~ Brunswick and Nova Scotia. In order for the reader to
comprehend the graphical significance ofLI.S and.t~L a line width templet is
printed in Figure 6-5-10. The second compilation problem arises in the
establishment of the package boundaries. The plane coordinates of the package
corners must be computed using the ellipsoidal coordinates. The computed
plane coordinates of the corners are not even numbers. Example:
Latitude
45.5°
Longitude
66.0°
(Stereographic)
El 128 208.33 ft N635 741.67 ft
This requires more care, skill and checks in plotting than does the plotting
of the even coordinates that are used when packaging is based on the provincial plane
coordinate system. £rn"'l'h.:
E976 000.00 ft N808 000. 00 ft
In computer-assisted production these two problems would become
trivial; development of the software for producing package boundaries is a
relatively simple ~atter.
In the short term, packaging based on the ellipsoidal coordinates
presents no filing· and printing problems. The compilation problems are minor
and will be removed in the long term wit.h the introduction of computer
assisted cartographic equipment.
Referencing system
The problems related to the printing of the referencing systems
are minor when packaging is based on the ell i psoida 1 coordinates but they are
not completely eliminated.
Primary referencing system - provincial plane coordinate systems
The use of ellipsoidal coordinates for packaging allov1s the Maritime
Provinces to retain·the existing map projection planes and the existing
coordinate systems. Consequently it would be possible to carry out milpping
without introducing zone boundaries in New Brunswick and Prince Edward Island.
In avoiding zone boundaries the predominant ref~rencing system problems
caused by the zone boundaries do not occur. The zone boundary ren~ins in Nova
Scotia consequently the predominant referencing system problems persist
there.

-93-
Subsidiary referencing system- ellipsoidal coordinates:
The representation of the ellipsoidal coordinate referencing system
can be achieved very easily. This is shown in Figure 6-5-11.
Subsidiary referencing system - UTM plane coordinates:
In representing the UTM plane coordinate system there are difficulties
regardless of whether the packaging is based on the ellipsoidal coordinate
system or. on a territorial plane coordinate system.
The production difficulties when packaging is based on the ellipsoidal
coordinate system are summarized in Table 6-5-2.
A comparison of the production difficulties based on the plane
coordinate system (Table 6-5-1) and those based on the ellipsoidal coordinate
system (Table 6-5-2) shows that in the latter case production difficulties
are either eliminated or reduced significantly.
It is concluded that from the production point of view, packaging
based on ellipsoidal coordinates is the better choice for packaging in the
Maritime Provinces.
6.5.2.2 User's Aspect
a} Coordinate requirements
In Section 6.4 it has been shnwn that three coordinate systems are
used extensively in the three Maritime Provinces. In order for the users to
effectively benefit from their preferred coordinate system, they must be
able to go from the nEps to the earth's surface and vice versa. This is
achieved by printing on maps three geo-graphical referencing systems. In
Section 6.5.2.l(b) it has been shol'm that it is easy to print the three geo
graphical referencing systems with packaging based on the ellipsoidal
coordinate systems. However there is no easy way to do it when packaging is
based on plane coordinate systems. Consequently in order to meet the user's
coordinate requirements without confusion, packaging should be based on the
ellipsoidal coordinate system.
b) Map planning
Judging from the response to the questionnaire, planning is an
important activity among map users (63.3%). Both inside and outside LRIS,
preparations for nmp production and map requirements for planning are
frequent acitivities. If one could pick a small scale map and quickly identify
the individual medium and large scale maps desired this would be a great

Figure 6-5-11
.Predominant referencing system i.e. provincial reference grid
Subsidiary referencing system i.e. UTM reference grid
Subsidiary referencing system i.e. decimal degree reference graticule
G•o·g''Phlc•l ''f'''''''9 wh'' ''''''''9 '' b,,,d '' th, •llip,oid•l coohli'''' 'Y•torn
I 1.0 .p.. I

-95-
Type of Production Difficulties Manual Production
Size variations in B compilation, printing and filing
Identification and definition A
Numbering system A
Referencing system B
Data integrity A
Map projection plane A
Plane coordinate system -
Worse production di ffi cuTty ·
r--------- -~-·--
B
A no difficulty B minor difficulties C considerable difficulties D severe difficulties E unacceptable
Computer-assisted Production
A
A
A
B
A
A
-
~
Table 6-5-2 Rating of production difficulties when packaging is based on the ellipsoidal coordinate system.

-96-
advantage.
From that point of view, geo-graphical packaging based on the
Universal Tra~verse Mercator is the best (Figure 6-5-12). This is because
the packages at medi~m and large scales could be made to correspond with the
reference grid of the snmll scale maps. Consequently, not only the general
area required could be picked out, but the individual packages or map sheets
could be determined together with the number of package or map sheets required.
No technician would be required and no delay experienced. Discussions could
be made quicker, planning time could be reduced and the quantity of maps could
be minimized.
Map planning when packaging is based on the ellipsoidal coordinates
is less convenient. This is because, currently, the graticule is shown as
subsidiary reference system (Figure 6-5-14). It is however a relatively simple
task to identify packages for the medium and large scales on these maps by
joining the graticule marks with a straight edge.
Map planning when packaging is based on the provincial plane coordinate
system is very difficult. This is because th~ reference grid of the provincial
coordinate systems is not shown on NTS maps even as a subsidiary reference
system. If it .were sho\~n. the san-eapproach as described above could be used.
When the provincial reference grid is not shown as a subsidiary system the
user must go through the computational and plotting steps necessary to show
it. This is such a complex and time-consuming task that, for all intents
and purposes, it would rule out the use of NTS maps as a planning guide for a
provincial plane coordinate packaging system.
c) Map use
A common map use is the map assemblage. It consists in joining
many map sheets together to form a large map covering the whole area of
interest (such as for mounting on a wall). There are always problems in the
map assemblage whether the geo-packaging is based on the ellipsoidal or the
plane coordinate system.
As shown previously, gee-packaging based on the ellipsoidal
coordinate system yields map sheets which are not quite square. The top

:SERIES 1:50,000 IfRlEDlERIT C1'0N
SHEET 21 G!Js WEST HALF THIRD EDITION
66'•i
...=;r~~_::-.::-... <7\' '( ~~~~~-.-·:~~·~· ~=~\-\~~:r- 1r,~--:;>~'~'\:.. ';,;- ~-Mout\'.I\_--.··~-~~"(Z0-;-~1 --~~:.._:_~<_k···· .·_·· .. ·~ '\:'Jr'' · ~ / ' ' "' I' '\ .A-or/ ~' •· ' • ·· '. . "'""• U C ' .. ·-··' . ~- ' \ I _ / - / ?(' r- · ~ ">,' 1 ,\ ' L 1 " : ,;q 1'· , , o Kcswt •·· ·--. # ,· "-' · · · ' ·. '-.L. .!'• ;;,·: .. .:_. ' ~ ·· '.-. ~," <. - / ' ' • ~ \ •' ' ' • ' ( c c "'~ r .• •. . .·. ~ .• - •• '·_c.::._-.... __ ·-r·>~· . . .. . \ . --~ : '.."'-.· • -- _ t / ~/ CJ::: .; eswo Ridge l, '"'-' ' /j \ , .. , • ' ··· ,!!Otl<la """. ·~;6~~~- ~ ~-
/ , -, ··~\.-.. / . · -::_"'~ , \ ~-- . ~-.. L '', ~ •.· .. /. '· . JJP~-;;-.:..__...:.:_--- ·-... ,...::-.._;,'\if.~~ ~·~.)'-I "" I 1 v. \ "' 3.# ' -;-:.. -_. ·w~ 7,-'"7-.''[ ?.., '"c. " ' :, < ' ' /....-;;~ J cS-o '11 <o .. ....., ./,........:==:::::__ -:""<< "Z I ""- '' ,/r · : '. ,..,.. __. ' ~·""'-~· -~·-\• • ~ /. , • , •, '~fl o y..._~ 0 I s.,'""'"" .:_~~~
/ i>"" ' - 5::.--t •' } :,. "'"'' -~ \\"; · ,' ~· ( .< 0•~ ~ rr o ~ '-,\ o !' "A"- , ~~~,~~Th-~ -~ • ~ ~ "' I - ' '" -' - ,, " to .--...... • '"""\ ~ ' "'\ '-. ~--' c?.. Seu.eme.oN ~" "\\~~ ~"" ):7 ciA• "~ ~Su~~.a~i>SI_9.~d,'(" -.•''-' ~-- • , c r .,r.; ·,.., ".;;: ''11 -3: J\\:; ~,~ .. "") ,, :, "" --. ~ Figure 6-5-12 This figure illustrates the simplicity "., ','.//1~·· 0o. / 1 • 'i ) I ~·· ""'
0 ·-~- ' s 0
• e '• I
inmapplanningandindexingthemedium '"') ~~·,. ,o:/:--]'1~ 'o•". /'' ~~:":;;··- ,,", and large scale maps,a..,y fro,.. the zone · \\ olii;;.'•'s''" 'I '~7 o ~ o __.....dJ, • ~ boundaries, when packaging is based on . •>': ··\. r1, I 7 ,--::::::=-- •, --._____. . ~ the UTM p1 ane coordinate system ' 1 1 ~ \ K 1 ~\'~.ud\l' o L'l3u•P e f"' - _____ "--- -~ - - Ch_a::n:' u.). •
"'-. • ·~;A ",:'ks~\'' 1.: •• n:J..V,ow .C.l' ., .. " .••• • .'\ _ ' ·- , •
~ \ · :1 f;/ '\, . \ ·~; c \ '\'~;)' I( '-. < _ '\ ,Y :?10~· ·~ 1 / • 1 ;.;,; ••• 1" """'· ·.- -·:!:\ .:~~ ~
1 '' . ,,( _) . ' : \ . ( ,_., ' • ' ) • ~ -= \ f-· ~ ' "• I ' '.. • • ' ' . V . ·· · \ ' ' L•-- . ~ ' .~' · ·· · .. '(' .t_·.... ;,-"_,t~.~- .• ,to\·· ··\·'\. \" ~\ /;;p~~~}! Y: ~"t·, ~/6/~·· , , ~ . . !~~< ··r· · , ·~ ~#"· R 1 v''";'""'-~~-- ~ ··~··· "'-- · ·· · · · - ··- ~I
\, ~/ .,~-::-"'""" -. . , '--~-- /r. ?~~ .. / . --~~----Ali-.""''"' •'\. A f.. - 1i. ~ v ."$ _ _/:;:--- "~ • · / ~,, c>'·"" _,-... -,• ,· ~-,.;:\ ~ ' 1 McKomey , .• ,, ,. \ ,J'I ' _: · ' ··:.,,, ·.·· . ;ff_i-'-c~ . ·•··· · \ <\\ .. ' ~ lj' (l ... ,,..<il'•. CANADIAN _: ~~K;~';V --~:f, •":f_ ' / ,7?, :·~
·- "":.- ..:. _.,,;-- · ,?...- · · . ~ ' ' , • \\ lr • acta , - I ~ ) ,;J:t -:::_./ ~ . ' -.... , / .. --· .... :..."····-·- .... _jjtf~J ........ ~- . . .j. -,\.,.,.:~ \b- ~. ·'~. , __ - . >-vp,:! :• -~ I .... ,:-~~: .... .._ .. ::./ .../'-~ . --- · ..<?/- · ·... ·, "\'~ ~L-., · \ · _"'-"·;.:.,.-~·. ~ . .\S, • ;..,..-.,f,oncl;',......:.._r:cv - V : ~'/--·-·:~----~::c-, ·~<\. ,-.,::.-....._ ·. . / ,.::.,:,,:<:; ' · ?' ' \ : ·. ·-·"" · ' ·· ~ · "!/ • ' · r s•:. ' •¥!. • ~i:aw · · / ·• "' " • · '. · • : -· ' ... ,- , :~ ~<-~~'/~~ -· _ _.....:.....l.._y_,.-.,:1- ·. '.'~~ -. ·' .Y:";,·--..,s~ ; ,· :.-.__,..i\i . '•
\ ' - .. ~ . :;:: .>:'·~A - ( •');_. , i\ \. ~:·~~::_;~/\ Jo· ' . , \ .lJ}_ ~-----~ . " m ...._ ·- .- jl · ~-· . · -· {:-; rc. 1 ~-....., ----\-v· •----·!:b ---- -' I \, ,«~ / ' •.• ;_J-" ,~ /~ i ·~~ ·, ( / :v ! / "·--] 1
-/ "': \ - ,, I \ ' \.c.4 • ,... I I .. - ~ .... ' ( I ~ ' - , )-..., '-,~ \ -~ '
I '·, '-· ,, '! II .v. 0 • • I " ' '• ', / i!.' ~~--- ' . ' ~ , _ • , f,ef, yo, IJ , ~ ~ ~. 1 ':f:-1 ~ - ... ___, '
I \ .( \· · __ '*: .. \ -:"'!:. )x~·:.·f,. i / • -- 6~~"f~.,_:<-:~:./ ,~" _\ - -. ~~ ~:< /"-~;_....--1
· r } / }·1-,- ,,1 ) llf\ \: ,>< ~"\ ~ ; ., ~""' • - • -- , --J-._ ' ••/. . \ ' ' ---·""· ''., ' ') \'· ./~ -, \ ' ( . : . ' ' '·" ~' ..... ' ' ..... ~ - . ·r . ·~ .... ; . .;. '· ., ""' 7>;, \ . \.\ ·., ., -,· , ··:: - " ~ .- ::. _ ~<. :;..<. . / .. .:; ....... "... .... 1 '<: :I ... (J. ~;. .. /\ " ~- ~ , . :r-.J - 1 10 . ~r I j L.... 'I ' •\ / ' V ;. I · : 0 0 n ;,~ · · 1 ·.- ' • ~,. • \ ~ • '~~\.')... · "-- r' \ ., ... I --.. · ~ ....~, . u ;, - I ....-- /'"'< \S ~ . . , , I •, .,.. _.. \ !:i C~ 'r_1l _ I ,.. ·~ , 1 ' , ' I /
• ' '• ._/ \ __ _.. (l '' V 'Y ' I \ ~ IP'
_·_.../!
1• _ /;rt"(._'~Ml',..... ~.K.sc'wJ' . 0;/":..(\~v··~ ~~cJ~(I' ·---~"'., i.- /;.....· . ........, ., 'o/' • , ~v, ~.. ', ...., \'·.·:::_-.--\- ·-... ,. /...---/ - - --_./- -1· T .,../. <?-. f7 ··r _ . >2c .,, ,., ~... ~ , ~ ('. • • ._:-----.
// ( . . . ' ,:;-· '/ ••. , ~~ 4"'. , ~"· ·;..._, /I -'-:· \·\:.~. \ ' .0 ', \) __ .., / ..... ~~,. ( /1 ~"": _:--._ -. /- '";!.-:...,'!>/ ~·< ~ ( \ ', ,, • ... '~-
( ,----.. /.-' ~ .. .,... ,-I / ,./ ,/" t: ___...::./ ,....- -----....... ..,_:::,.-/ ---~:£...( ", ' \ ' ......... \ ' _{-. ~ --- - ··~· '( •· _,_,..... '/--r-~···:r--~' ..... "'! -· /
i:i .. ~.: • - ~ l / -- ------....... ... ;'/' '\ \~ J - -J ... ,-- : ' ~~ /""' / \~· ..__. '-\a\ ~-~~ ·.:,J ; ~~- .. , . y '-- -::. --.__:·~ \'.~ \:-. ' I ' . '
/ ,., . I • I / .. . -<I c.,>;-....... ~ .\ . :'\..·' .;. . /.·
~-t-· __ .., .. :..: --n··:l , .. 1 =2o ooo -~:- ____ .. ~ \~. \\\ ·. :..,\r, .. ~'--~.\ ~~ . ..,c~ .· .... / ./~. ~ . ~ --- "'\'1::. /,/ .. ,,· .t . . ·: / I . , r ., _, . "\. . . ''J I . , : . . ,. - - . . . ,... ....... /· 1 -'. ·, ' ,.--! \ \:... . ~-· ...._,.~~., \. \ ':.' [/ ..., r .
; -,,.-·: _. , .. , ;~.t_,.:·: / .. . '. . ' . . \_...- ~· . ..1·: ,..._. "' ' , ' • .o{ • l(:;: '{' ':\ <";--';' ·; --~·-"" I ) ./ . / ,/
./ ll ~ • ' ' -,:. ,. -- . • ,.:-. ~~ It V' u .) •.,.;) 0 :..-. /' 'C' ' -' •• ', :
- -., I 'I -..• ~~,, ~ ,· ' ' • --~ - ·""
• •• - " ' } ' ' "':' ' ~ ~::· / ' ;o • ' • ~ '<" . . ~~· ~--.. -'( • ~. ....... :r. \ .. • ~ .. ,;-=--:_·:=:.~-!~:-:/ i'''"· ! ,;=: {"'::7'"•F~f: f, -z;cz:?- • 'f',, >~_y~ --- - _, . ,./- -¥Til o - . ~ ·;;;-=-il --=··"::::.. ~, .l... . -.. ·~ -- "· -/ •~ ,.':. ... /-- { > ~--- •/J ;J. • ,_._..-......~ ' / .J.\~•':-< "- ~ ;:.. ',' r~~,\ '--'
··~ -·--;; '""· , / . .,.,"'. t.-13ze,<' 1l .. /?" ~ .- ___.- t"- ,_.,..../'~ .·• .._/ ---·--:---~" .,.,"*--....,.. .--- 17 ' ::..-;-< ,.-.../" -" "\,... ~ ,~ _ -- ·., . ~ "-"•.''·:;··;/-_ ::. __ -.::..""··:-"'--~.-::: (:;;:.~ett•;,"::'n':'' />_,.../ ' · -~:;!,';• '--.~··,------. ·?j~. . ... >A-· ./ ...;:,,-·c··~._.--c--~.- ~~:::t;•>2Q,OQ (~ ~~"-~---., -< ... • / , _,~,. .._ -d~:. .. \ , -....:~~· .·•. ~~ . - . .._: ~ "'~7')'\;;.dj~"i ~-., -·r~ , • ' - "'-, (":'..., '') ;~··. \,~: ~ ~-7 · 1 '";r ·,p ''v_ '' /{/ j ',- 0 , ~- • ·~ : "-...,~ -----: 1:-...: '·\
...,. __ ., • _, ' - ,...__...-;-,.,. j , -3': '(I t C:, " '1:'" \• • <
• i · 1 -~ -J "'· -- ----- r : - _,, -fl- ~-o ~· ""' • , ~ 1 ~ • \ \ • ......., ~ .
,,.
.h>t ? ',' ~ ',<~_:_/\ . r r ·'........._)
.,..-./:-
.----"'
----...:::,._
.............
,~13~~ t~~i:~w~~ f,-t w'!r~? ~Q~
CANADA
DEP.\~~v:_~r C:t '.!.~ ('U~ ~~F~~:f ~~.~~ ::...~ • .:1' [~' !:,.)r.'-'1~~1
R~H~I~(~
•>~~~- .· .. , .-. ....... ,.,~ ·~•l,a..o ~H" o,o, -·:.---.......... --.-. .-.. -------...... ~ ....... -~.,. ·---~)
~cool ........... ~·aAf-4->i•...-..s~.k"'~:_ --: . .-.~-~ O!~f'rR".~I " . .__,..._ Pr,wat~ ~.:.ad I,J.: Q.: ... ,~ ;:,.t·t "'''' ~~-, ... ,.,.
~-=~--
. . t)·.~~~ ....... ,~ ,.,, ~···~ > --..--~o;::.o:--
~V~I'i!J!'<"I •'•·...,·~·.,._ -----·- ---
~:>-•l!
r. ... """' ~· ~ ... ~
·········~· ---·-"······ \·· -·; . -- .... t .e--.::·-~ .• -''"t' ' -~ ~ . .:.:....:.... r t. ,~ -'~"
:· r~. J: c ·:::J' ~· a ..... -,~J') .X s.~1!') l>',;;"'v-~t
s ...... :"' :"-':!·ir. "~-_!;~. I
~.:-v: ~·~;J::;)Il
~'~'" C.lt'
s..~ ....... 0~. ~ .. -,,::<,
:.• , vr ;:J,:;;·-, ,...,.. -;.."'
f'.:-.: ~'·
.,. .. Y '
s~,;: o· ,__;._.., ~-:
~ <:!t-~g €dlJf' ... to:t-r:! :).,r--.y t~,
l·~ .. :!l .. -,., ..
'/,~.!·'
to:.:,
.v I"~"·" "<"~ ,..-...:-·
\.; .h:t' ._:( ~:-.::-.. ;,,;~
):•!J"!'_ .......... .,,..,.
Cur.:u..•\ ~~··•;""'
o'\JV:.~ A.e•~- "'""
--=-- ,:-·- . ·. -.-<~/ c;_~j· ,'-f, . I ··~X .~· ,;- ~ ....... ~,. I ·?ce~-:_.o I ' : ' 'C""'?. - ~ \~I . ( \· r·. '(/8\-~~f~~\ I \r;;r ;-Ju i /•q( ····:-,;,,. -,~~T[f2t [SL_c /cl~-.,·~~. ,' _' <--~ •• , , ' .., \ _.:::~-<, . ' \ < 'I <!( r > 1''..!. • '-.... :-;:: . o ' \l~~ I
" ---- 3 I /,.------ 1 - ~ "-l; I I ,.... \ I"\ ~,. t·-~ ... ·- l_, -~ _, ... _/ • ..... \. • ' ' - "" ' ' ~ I I ' , ... -, ' ' ' ' '
] .- • - ~ '- ' - - 0 - ' ' ' ' /:- - ~ -- '•, • ,.,;... --....:..._ ' / •
• · ·J / '· .. ~.::. -.- ·J '•.,;. .: ~\ z 'r'-~-~-·.. ·~ ., ., . ~ ~ •.· -:;r~r:··~·~----""-·"-. ----------.•--~--,,. T• .._. ·I> '> ' .. ,I ., '' V('' < .,- ' ' ' ,-, ' ""-,··~·_..,, (,:- ~ ;:,+,~\'"<·t ~-"·.\"-,·· ... ·"'· " ;."Y -\'~ ;_-.~;~ ,..._ , _. :::) 1 ~ \ :' .. _ .. , '\· r ~t ·- . ~ .. -------- ............
I \0 "-1 I

-98-
of the sheets are shorter than the bottom. The east-west map assemblage
produces a concave arc. This is especially noticeable at small scale. Map
users who have assembled a \'/all map at 1:1 000 000, 1:500 000, or 1:250 000
can clearly visualize this problem. However as the scale increases this
problem decreases. At a scale of 1:1000 it cannot be noticed. The deviation
from a horizontal line would be 4 mm in an assemblage of seven map sheets.
{Figure 6-5-13). At the end of seven sheets (4.6 metres) the 4 mm deviation
would be barely noticeable. This is considered an insignificant problem at
medium and large scale.
The gee-packaging based on the plane coordinate system yields map
sheets which are. square (or rectangular) and, within one zone, they can be
assembled very easily. However.where the problem arises is at the zone
boundaries. Along the entit·e zone boundary there would be maps side by side
produced on two different plane coordinate systems. They would butt-join
but they would not fit together in a continuous fashion. Maps side by side
would always be at an angle with respect to one another (Figure 6-5-4).
The angles would be approximately six de~rees and three degrees for gee
packaging based on the Universal Tra~verse Mercator and 3° Tra~verse Mercator
respectively. No matter which plane coordinate system is selected the zone
boundaries cannot be avoided.
The Saint John area is intersected by a UTM zone boundary. This
is illustrated in Figure 6-5-3. It is also intersected by a 3°TM zone
boundary. Consequently gee-packaging based on plane coordinates would create
inconveniences and difficulties asssociated with map use at the zone boundary.
More specifically the users would be confronted with a non-continuous gee
packaging system, a non-continuous map numbering system, a non-continuous
plane coordinate system on the ground together with possible variations betwee
the practical zone boundary on the ground and the corresponding zone boundary
on the maps. These difficulties together with variations in sheet and packagE
sizes (Section 6-5-2-1) in both medium and large scale maps could cause consi·
derable frustration and dissatisfaction among map users.
6.5.2.3 Other aspects
a) Surround
The production of the individual map surround is comparable in
many respects for the gee-packaging based on either ellipsoidal or plane

J ~-- 4.6 metm
[ I I i'r I~ \ l J Figure 6-5-13 A map assembly conposed of seven map
sheets deviates 4nm from the horizontal at a scale of 1:1) 000
I 1,0 1,0
I

-100-
coordinates; the same components, material, and time in the map production
are required.
If ellipsoidal coordinates are selected for gee-packaging the
possibility of a different surround for each tier of latitude arises. This
is not necessary. Usually there is a "master surround" - one for each public
map series - and a "particular surround" - one for each map sheet. The
master surround is rendered possible in the l~aritime Provinces because there
is only a 4.5° range in latitude. The corresponding difference in map
sheet length between the most northerly and most southerly map sheets is
approximately 7 em. Aesthetically, the surround can be made to look attractive
in all cases. While being attrative it can also be functional for the most
northerly and the most southerly sheets.
If plane coordinates are selected for gee-packaging different groups
of problems arise. These are mainly due to the large variation in package
and map sheet sizes at the zone boundaries. In Section 6.5.2.1 the alternative
#2, presented in Figure 6-4-7, has been chosen as the best geo-graphical
packaging choice. However the final sheet ~ize choice cannot be made yet
because there are metric external factors (see Section 6.5.5) which are unknown.
Nevertheless it is easy to see that the variations can be as much as 0.5 metre -
the width of a standard package. This would probably lead to a speci~l surround
design for .the small and large packages at the boundaries together with another
one for the standard package size. The theme production concept may bring
about other variations in the design of the surround because the size and
style may change from one producer to another. In other words maps representing
themes like geology, forestry, soil, land use, cadastre may all need a different
surround size for legend and explanatory notes.
The surround design is a flexible element of map production. It
can be accommodated in both types of gee-packaging, nevertheless one universal
surround is a ~1orthwhile goal for simplicity and uniformity in design, handling,
storage and exchange. It can be achieved much easier ~lith gee-packaging based
on the ellipsoidal coordinate systems than with gee-packaging based on any
plane coordinate system.
b) Indexing
An index map or a series of index mops are prepared for every map

-101-
series produced by an agency. This permits the users to see the coverage
available and it helps them to select the maps of interest. The scale of
the base selected for indexing purposes is ordinarily 20 to 100 times smaller
than the maps to be indexed. For the Maritimes' large and medium scale maps,
the National Topographical Secires of maps provide a suitable base. They
cover the entire ~laritimes and they are available in the right ratios. The
1:250 000 is used for the indexing of the medium scale maps and the 1:50 000
is used for the Maritime large scale maps. These scales are presently used
with success, and, since there are no other viable alternative, this practice
is likely to continue.
The National Topographical Series of maps is the ideal base for
indexing large and medium scale maps if they are based on the ellipsoidal
coordinate system. This is because the large and medium scale maps are
sub-sets of the small scale national topographical series. From the
production point of view it permits the production of index maps quickly and
accurately. From the users' point of view there is no confusion in map selection
because the large and medium scale maps are multiples of the small scale maps.
Packa.ges based on the plane coordinate system yield maps which are
more difficult to index than those based on the e11ipsoidal c~ordinates.
Furthermore the indexing problems are a function of the plane coordinate
system selected. The UTM plane coordinate system presents the least indexing
problems. This is because a UTM reference grid is plotted on the small scale
maps. Designing the package to coincide with the coordinate values
of the reference grid permits one to quickly index large and medium scale
maps on the National Top(lgraphical Series of maps. Nevertheless the large and

-102-
medium scale maps cannot be designed to be sub··sets of the National Topo
graphical Series. This causes difficulties in indexing close to the edges
of the small scale maps. As illustrated in Figure 6-5-14, it is possible
that map sheets could be left unindexed or that map sheets could be indexed
twice. In nearly all indexing activities, it would be necessary to consult
the adjacent small scale map to ensure uniformity. This uniformity is
achievable within one organization however, in a dispersed user-producer
environment, it would be very difficult to achieve.
Finally, packaging based on any other plane coordinate system woull
create serious indexing problems. Large and medium scale maps would not be
sub-sets of the small scale map; the bounds could not be made to correspond
with the UTM reference grid; and finally the indexing at the edge of the
small scale maps would be confusing.
No indexing problems are encountered when packaging is based on
the ellipsoidal coordinate system. There is no confusing to either the
producers or the users. This is the best choice from the indexing aspect.
c} Fl~x"lb"l1 "lty
The geo-packaging should be selected so as to provide the most
flexibility possible in the cartographic framework. The packaging based
on the ellipsoidal coordinates offers the most flexibility because:
i. lt is independent of the map projection plane(s).
ii. It is independent of the primary reference grid.
iii. It is independent of the subsidiary reference grid.
iv. It is independent of the plane reference systems.
Consequently each province can have its own provincial map projection plane,
its own plane coordinate system to meet the engineering and surveying
requirements, and finally it can meet future off-shore requirements.
Packaging based on the ellipsoidal coordinates provides territoria
geo-packaging which is unique, homo~enious, continuous, unambiguous and
expandable. At the same time it gives flexibility in local, provincial and
off-shore needs Vlith respect to the mapping plane, the coordinate system ant
the referencing system.

-103-
-~~--- Index twice _
~
Figure 6-5-14
Index once
I / I '
I /A user must resort to the i adjacent NTS map for the , coverage of the second half .
. 34
'JO
43
")I' 'I
;. _,
a·l .•.

-104-
d) Redefinition, readjustment and metric conversion influence on packaging
Upon the introduction of the redefined, readjusted and metric plane
. coordinates, all maps produced prior to the changeover will become obsolete
to a certain extent. The usefulness of maps will be greatly reduced because
the map referencing system will be in Imperial units whereas work on the
ground will require sr units.
In 1979 more than half of the medium scale mapping in the Maritime
Provinces will be completed and a large quantity of large scale maps will
have been published. Consequently it may take many years after the redefinition,
readjustment and metric conversion before all maps in the Maritime Provinces
can be published with the new referencing system corresponding to the redefined
and readjusted coordinate systems. Tre time required to make the changeover
will depend on the technique selected for the changeover. There are three
choices:
i. To reprint all the map sheets;
ii. To modify the referencing systems of each map sheet until
revision; or
iii. To leave the maps unchanged until revision.
Each of the three choices has a different influence on the pcckaging.
Choice i has little influence on the type of packaging. This is
because, in reprinting, each map sheet would have to be repackaged. It would
be approximately the same task to repackage maps based on either ellipsoidal
or plane coordinates.
Choice ii is an intermediate solution. It may be required if the
users cannot wait for either to implement at the medium scale. It would imply
two changes. The first one would be to remove the ellipsoidal coordinates
from the corners and insert the corresponding new one and to draw the new
referencing systems on the original transparencies. The old one could be
retained until revision or 1t could be erased. Should this approach be
necessary, then the packaging would be completely irrational in the interim
period.
Since it is reasonable to assume a 15 metre shift between the
present and the 1979 readjustment, the shift at various scales would be as

follows:
-105-
3.0 mm@ 1:5000
1. 5 mm @ 1 : 1 0 000
0.8 mm@ 1:20 000
As the scale decreases one can observe that the difference beb1een the
present map position and the 1979 map position becomes quite small. f·1edium
scale maps based on the readjusted coordinates would require an edge tie at
a boundary with old mapping. This could be done by printing beyond the
package limits {say 1.5 mm at 1:10 000) if the shift happened to be in
one direction; or·by printing an overlap if the shift happened to be in the
opposite direction. The overlap and overhang would eventually disappear
in subsequent revisions.
In contrast with medium scale maps, the present large scale packaging
does not favor one packaging over the others. This is because the present
large scale packaging in most cases, are based on the imperial unit of the
plane coordinate systems. The readjusted metric plane coordinates or ellipsoidal
coordirtates will cr(>nt.P thP sit11"tinn •·•h""''=' n.0 !"l"'=~~::~ing can be desigr.e':! 1:~
match any existing packaging.
Should the third choice be selected (i.e. to leave the maps unchanged
until revision) then neither packag~ng based on plane coordinates nor ~ackaging
based on ellipsoidal coordinates has an advantage over the other.
6.5.2.4 Conclusion
In section 6.5.2.1 it has been shown that there are much fewer
production difficulties when geo-graphical packaging is based on the
ellipsoidal coordinates.
In section 6.5.2.2 it has been shown that:
i. In order to meet the user's coordinate requirement geo
graphical packaging should be based on the ellipsoidal
coordinate system;
ii. In order to meet the map planning requirement geo-graphical
packaging could be based on either the UTI1 or ellipsoidal
coordinate system;

-106-
iii. In every day map use the geo-graphical packaging based on
ellipsoidal coordinates will create negligible problems
compared to geo-graphical packaging based on a plane co
ordinate system.
In section 6.4.2.3 it has been shown that:
i. For simplicity and uniformity in map use, handling, storage
and exchange it is desirable to have one surround design and
one map size. Unless geo-graphical packaging is based on
the ellipoidal coordinate system this will be difficult to
achieve.
ii. In order to avoid confusion among producers and users in
indexing, geo-graphical packaging should be based on the
ellipsoidal coordinate system.
iii. In order to permit the maximum flexibility in local, pro
vincial and offshore needs with respect to the mapping
planes, the coordinate systems, and the referencing
systems then geo-graphical packaging should be based on
the ellipsoidal coordinate system.
It can be concluded that from the geo-graphical packaging,point
of view it is highly desirable to have the packaging based on the
ellipsoidal coordinate system.

-107-
6.5.3 Geo-digital packaging
There is every indication that an informatio~ explosion is occruing
due to the development of new technology. The coupling of communication
networks, computers and cathoae ray tube displays creates a great information
potential. Nevertheless we think that:
i. For at least a generation most data will be in a
graphical format although there will be a gradual
accumulation of geo-digital data.
ii. graphics will be required in a large number of activities
iii. computer-assisted cartography will be improved.
In other words the co-existence of the geo-graphical and geo-digital
information systems is inevitable. Consequently, to fully benefit ·from
this co-existence an interface between the geo-graphical and geo-digital
information is necessary. The interface is the coupling or merging of themes
in graphic form with others in digital form. It implies a close relationship
between the geo-graphical and geo-digital formats. This relationship can be
achieved if there is a one-to-one correspondence between the geo-graphical
packages and ihe 1~o-digitai packages. ln1s is symbolically shown in Figure
6-5-1. The figure also shows that:
f. the geo-digital themes, which are the building blocks of
geo-digital packages, are stored separately like the
geo-graphical themes, the building blocks of a geo
graphical package.
ii. on inquiry the geo-digital display is very much the same
as a map or geo-graphical package containing the same themes.
Figure 6-5-15 is an expansion of Figure 6-5-1. It shows the actual
sequence between the time the geo-digital data is collected and the time it
is used. There are three main components to the Figure: the source, the
computer memorj~s, and the inquiry. In the Figure the source represents the

Sru<cE
CcwUTER 1-E'tlRIES
I;::ui?.'f
p. 1
The~e 12
pi+3 Theme 12
I pi+l
Therr.e 12
I pi+4 Theme 12
Inquiry by theme
Digitized Data
Systematic \ ~ Gee-digital packaging
and . __ Coordinate syst:em [------------\.
pi+2 Theme 12
I pi+S Theme 12
p j
Figure 6-5-15
This figure illustrates the role of systematic gee-digital packaging in the integrated positional information exchange. Gee-digital packaging is an essential part of the data structure. It allows the input data to be organized in order to achieve quick access in the retrievals.
l
J jP
? j+l
lnqui ry by packa;;e
" \ ,.. /'
.;
~~~?~~~~c i:
J+2
':; r.:..::...~:.:-~
I 1-' 0 (X)
I

-109-
collection of data which is done and will continue to be done with instruments
which are necessary to acco1nplish a predetermined task quickly, efficiently,
anJ at a minimum cost. The results from these surveys are incoherent sets
of data. The computer storage includes the usual normalization of the gee
digital data enroute to the computer memory. In the present graphical system
the collected data is plotted on maps. This normalization is done so that the
collected data may be more accessible to internal and external users. The
symbols on maps are a language which needs little do~umentation to be understood
by the users. The need to portray information on maps with symbols is
evidence that the collected data must be normalized in order to make it more
readily availab)e. The graphical system is a very simple system nevertheless
normalization is required for simplification. In a computer system which is a
hundred times more complex.it is inconceivable not to normalize the data.
The need for simplicity of any system cannot be enough emphasized. In order
to achive it, a common and systematic coordinate system for storing data in
computer memories is required. The inquiry represents the types of output
which will be normally required i.e. visual display of packages composed of
a desired theme or family of themes.
There are three ways to look at Figure 6-5-15. It can be looked
upon as an agency or department sub-system, as a clearing house or as a
combination of both.
As an Agency of Department
The source indicates the different techniques that might be used
by the department or agency to collect its themes of interest. The computer
storage indicates that, following data collection, the theme data is:
i. Packaged into a Maritime systematic and uniform geo- digital packaging system;
ii. Normalized according to a Maritime systematic and uniform coordinate system; and
iii. Stored in the assigned theme file.
The inquiry indicates the retrieval of the geo-digital data. It may be a
package, a group of packages, or a sub-package with themes in any combination
available.

-110-
As a Clearing House
The sOUl'ce indicates a wide range of instruments employed in the
collection of gee-digital data in the Maritimes. The computer storage
indicates:
i. That all participat-ing agencies are packaging their geedigital data according to a ~1aritime common and systematic gee-digital packaging and coordinate system;
ii. That the theme files are satellite files which are administered by the participati~ agencies each of which has the full responsibility for the content of its files. In other words the collection and up-dating of the theme files is the full responsibility of the producing agency. Other agencies can have access to the agency's files but they cannot change the content.
iii. An exchange through which themes produced by other agencies can be accessed.
The inquiries indicate that standard visual and graphic inquiry can bring
forth a package, sub-package and.multi-package in any combination of themes
available through the exchange.
The two major questions raised in Figure 6-5-15 are:
i. \~hat should be the coordinate systems to store data in compute1· memories?
i i. ~:hat should the geo-digita 1 package be based upon?
The first question is a very important one but it will not be analyzed. This
is because it is a highly technical question which can only be answerer by
computer specialists in consultation with users and cartographers. In the
following sub-section the choices of gee-digital packages will be analyzed in
a broad perspective.
6.5.3.1 Alternatives for gee-digital packaging
In section 6.5.2 four territorial coordinate systems have been
examined as possible geo-graphical packaging systems. Among them there were
two plane coordinate systems - 3° Tra~verse Hercator and Universal Tra.fverse
Mercator and t~:o ellipsoidal coordinate systems - Sexagesimal Degree and Decimal
Degree. The difference between 3° Tra~verse Mercator and Universal Tranverse
Mercator is very small from the geo-digital packaging point of view. Similarly
the difference between the sexagesimal degree and decimal degree is also very
small in gee-digital packaging. Consequently the alternatives for g~o-digital
packaging are between the two types of coordinate systems- plane or ellipsoidal.

-111-
a) Geo-digital packaging based on plane coordinates
In section 6.5.2 the geo-graphical packaging based on the plane
coordinates has been analy!ed. It has .been shown that virtually all the
difficulties are due to the zone boundaries. Three geo-grap~hical packaging
~lternatives at the zone boundaries have been outlined and the associated problems
·have been identified. The packaging concept implies a one-to-one relationship
between the geo-graphical and geo-digital packages. Consequently the same
alternptives should be analyzed. Rather than being very repetitive we can say
that generally the graphical problems are duplicated in the geo-digital packaging.
b) Geo-digital packaging based on the ellipsoidal coordinates
In the analysis of ellipsoidal coordinates for geo-graphical packaging
it was seen that the main difficulty encountered was related to skill. Consequently
it required meticulous cartographers. However, this accuracy requirement can
be easily achieved with a computer-assisted cartographic system. As a result
no difficulty can be foreseen in the use of ellipsoidal coordinates for geo-
digital packaging.
The ellipsoidal coordinate system is a stable and yet a flexible system
for packa~ing. It is stable because there is no event in sight which cc,_,lrt
c·hange the structure of the system. (Should the "grad" system have been a
serious contender, it would have been introduced with metric conversion). It is
flexible because within the packages it gives the computer scientists th~ freedom
to select any coordinate system they require to optimize the storage within
computer memories. Geo-digital data can be stored using plane coordinates, table
coordinates, ellipsoidal coordinates, or any other type of coordinates.
6~5.3.2 Conclusion
Among the two types of territorial coordinate systems the ellipsoidal
coordinate system is a better choice for geo-digital packaging. Its flexibility,
stability, continuity, homogeneity, and expandable properties are such that it
provides packaging in which there is no room for confusion and ambiquity among
either the producers or the users.
6.5.4 Package Numbering
If v1e accept the packaging concept then each package must be numbered
so that it can be filed and retrieved at will. (Filing and retrieval apply
to both geo-graphical and geo-digital packages}. The geo-graphical package
numbering is normally called map numbering system. The geo-digital packages do
not yet have a commonly used name. In reference to both thr. term "package
numbering" is being used here.

-112-
It is desirable that the ~ackage numbering serve the cartographers,
the users, and the computer scientists equally well. In order to achieve it
there should be a common package numbering for both the geo-graphical package
and the gee-digital package. Three types of package numbering will be
analyzed. The arbitrary, the matrix and the geo-code numbering.
6.5.4.1 Arbitrary numbering
The arbitrary numbering is very common. In Canada it is wide-
spread at the federal, provincial, and municipal levels. In this type of
numbering the rational or natural pattern between the numbering of· adjacent
packages is practically non-existent. The numerical, alphabetical, and
alpha-numerical numbering may zig-zag from east to west and vice versa or
from north to south and vice versa. In some cases it is a combination of both.
One examp 1 e of this type is the numbering of the Nation a 1 Topographi ca 1
Series. Similar types of arbitrary numbering also exists at the provincial
and municipal levels. In most cases the map numbering has been designed to
cover limited map series and a limited portion of the earth's surface. In
other words map numbering systems cannot, ordinarily, be expanded· or combined with
those of other mapping agencies,
The irrational pattern, the lack of flexibility, lack of
expandabil ity, the mixture of a 1 pha-numeri c and symbo 1 are serioJs
limitations of the arbitrary type of package numbering.
6.5.4.2 Matrix numbering
The matrix type of package numbering is different from the arbitrary
type in the sense that there is, some time, a logical or natural relationship
between the adjacent packages. It resembles the arbitrary in the sense that it
establishes no direct relationship between the packages and their positions or
space locations. The matrix numbering can be autonomous but rarely is. ~1ost
of the time it is a mixture of two types.
Examples:
Province Scale Map Number
New Brunswick 1:2400 l2U 82 '---y---"" ~ 11atrix Arbitrary
Quebec 1:5000 31P07 - 050 - 0508 ~ -----....-- ~ Arbitrary Scale t~atrix

-113-
In the first example the matrix is used as a prefix and in the second one
the matrix is used as a suffix. For various reasons this mixture in the types
does not give any significant advantages over the arbitrary numbering. In
most cases the numbering lacks flexibility. The autonomous matrix numbering also
lacks flexibility. This is because the maximum size of the matrix must be
predetermined. Should one ~1i s h to prepare maps outside the a rea covered by
the matrix then the numbering breaks down.
The matrix numbering can be an improvement over the arbitrary
numbering but the system does not have sufficient flexibility to be applied
extensively dff-shore.
6.5.4.3 Geo-code numbering
The geo-code type of numbering makes use of spatial coordinates,
usually the spatial coordinates of a package corner, to identify the
packages. The numbering is rational consequently the number of the neighbour
ing packages can be identified without an index. Also a package number
establishes a clear relationship between the package at hand and its location
in the territory. This type of numbering is expandable, flexible, numerical,
continuous, rational and space sensitive. It has the potential of
satisfying the cartographers, the computer scientists and the map users.
The geo-code type can be divided into two sub-types: che plane
coordinates geo-code and the ellipsoidal coordinates geo-code.
a) · Plane coordinate geo-code
The plane coordinate sub-type can be used when packaging is based
on the plane coordinate system. Examples of this sub-type of numbering can
be found in Alberta, in British Columbia, in Ontario (Task Force on
Geographical Referencing), in the British Isles, in Germany and in many other
countries.
b) Ellipsoidal coordinate geo-code
The ellipsoidal coordinate sub-type of numbering packages is
very similar to the plane coordinate sub-type. It can be used when packaging
is based on the ellipsoidal coordinate system. This is difficult to implement
with the sexagesimal degree system but it is simple to implement with the
decimal degree system.

-114-
6.5.4.4 Conclusion
Among the three types of package numbering the geo-code type is
the most promising alternative. It can be learned quickly by the users;
it can be entirely numerical to satisfy the computer scientists; and it
can be practical for the cartographers. Viewed as a regional system it is
expandable, flexible, continuous, rational, and space sensitive. This is
the best choice.
6.5.5 Packages and map sizes
There are two components which contribute to the size of a map.
There is the geo-graphical package area and the surround area. Together
these two areas form the total area of a map sheet. The map's length and
width is limited by production materials, filing cabinets, ease of handling,
printing equipments,. and users' preference. In other words the size of the
maps and geo-graphical packages ·is limited. However, there appears to be
no factors controlling the size of the gee-digital packages in the range
of sizes acceptable in mapping. Consequently the subject becomes a purely
cartographic one.
Until recently very little attention has been given to paper
sizes. The lack of standards has created the situation where the market
has reacted to the demand. It was an uncontrolled supply and demand. This
has led to hundreds of paper sizes. Recently, however, in the planning
of metric conversion, the opportunity of standardization has been recognized.
It has led to acceptance of two standards: one for correspondence (CAN 2-9.60
M-76) and one for printing (CAN 2-9.61 M-76). However, there is no standard
yet for engineering drawing, mapping, charting, etc. The Canadian Government
Specification Board (CGSB) has had a few meetings on the subject but· it
cannot give any indication yet as to what might be the standard.
Whenever available the mapping paper sizes should be selected with
the following considerations in mind: paper economy, and map series
efficiency.

-115-
6.5.5.1 Paper economy
Economy in paper can be achieved by increasing the efficiency of
paper in mapping. The efficiency ratio is defined as the ratio of the geo
graphical package area to the total area of a map sheet. It is recognized
that a minimum of information regarding each map sheet must be printed in the
surround, however care should be exercised to ensure that the area of the
surround is not larger than it needs to be. Otherwise one gets into higher
production costs due to the size of production components which are larger than
necessary; one gets into higher reproduction ccsts due to the size of repor
duction material which are larger than necessary; and finally one gets into
higher filing costs due to cabinet size which are larger than necessary.
Table 6-5-3 shows the efficiency ratio for a variety of selected maps. It can
be observed that as the area of the geo-package increases, the efficiency
ratio ordinarily·. increases. Consequently one should design the largest possible
geo-package and design a surround which is not unnecessarily large. One must
also consider that a map wider than 30 inches becomes inconvenient for users
to handle. The length is less restrictive. Maps can be square or rectangular.
~.5.5.2 Gee-packaging yield and efficiency
·-The ·geo-package yield is defined as the quantity of geo-packages of
a given size, required tocover an araa, at a given scale. Table 6-5-4 shows the
the y1eldof· the 1:10 00 series in Prince Edward Island, New Bruns\'rick, Nova
Scotia and Quebec. As the package size increases the number of map sheets to
produce, file and handle decreases. This should create an increase in effeciency
for both the producers and users.
One benefit of computer-assisted cartography should be an improved
production efficiency. Large geo-packages should result in higher efficiency
due to the lesser number of map sheets to initiate, manipulate and store.
Consequently in light of computer-assisted cartography attention should be
given to the selection of geo-packages with a low yield to increase the pro
duction efficiency. However, even if efficiency increases as the size of
packages increases, it is recognized that beyond a width of thirty inches
some of the existing production and filing materials would be obsolete. Users
would also have difficulties in map handling.

-116-
Geo-graphical Total Efficiency Map package Surround
considered area area area ratio (sq. in) (sq. in) (sq. in)
Maritime 1:10 000 460 405 865 .53 (present paper)
315 775 .59 Maritime 1:10 000 460 (Al paper)
566 1583 .64 Quebec 1:10 000 1017 (present paper)
531 1549 .66 Quebec 1:10 000 1017 (AO paper) I
p. E. I. 1 : 5000 I 342 378 720 .48 (present paper) I
Ontario 1:10 000 390 383 775 .50 (proposed paper)
Nova Scotia 1:1200 750 390 1140 .66 (production material)
Nova Scotia 1:1200 750 626 1376 .55 (printed paper)
Table 6-5-3
Gee-packages dimensions Average Area Yield Geo-package] at the scale of (number yield ' 1:10 000 at geo- ratio i
mi 2 km2 package i to cover I
the Maritimer
Lat. Long.
2.5' 3.75' (as in P.E.I. series) 9 23 5778 2.9
2.5' 5.0' (as in N.B. & N.S. series) 12 31 4333 2.1
3.75' 7.5' (as in Quebec) 26 68 2000(Ref.) 1.0
*The area of the Maritimes is 52 000 sq. mi. (135 000 km2)
____ Iable 1)-5-4

-117-
6.5.5.3 Other factors
At this moment we may be thinking of a particular localized
requirement but one may never know when looking ahead how these particular
maps might be wanted in the future. Although at the present time LRIS
might be thinking of diazo production, some litho production might be printed
in the future. The problem with larger· sheets is that sometimes one may
have to go a long way to find a printing press.
6.5.5.4 Conclusion
A small map does not make efficient use of paper. A high gao
package yiel~ does not cover a territory efficiently. In other words small
packages create handling, printing and filing inefficiency. Consequently
gee-packages should be the largest possible. However extra large gao
packages could produce problems in printing,equipment, filing cabinets
and handling by both the producers and the users. In between there is an
optimum size.
· 6.5.6 Evaluation of the Packaging Alternatives
The factors affecting the choice of packaging have been discussed
in the five previous sections. In order to show the packaging alternatives
in perspective a network diagram is shown in Figure 6-5-16. The network
diagram leads to four tables.
The first one, Table 6-5-5 shows the advantages-disadvantages of
the sexagesimal degree vs decimal degree. The decimal degree outweighs the
sexagesimal degree by a ratio 2 to 1 consequently this eliminates the
sexagesimal degree for the Maritime packaging. _
The second one, Table 6-5-5, shows the advantages-disadvantages
of the UTM vs 3°TM. It is important to realize that even if UTM was not
selected as the common Maritime map projection plane, UTM could still be
selected for the packaging. However, as shown in the table, neither UTM or
3°TM presents any significant advantages for packaging.
The third one, Table 6-5-7, shows the advantages-disadvantages
of 3°TM vs decimal degree. Decimal degree outweighs 3°TM by a ratio of
2 to 1.

-ll8-
The fourth one, Table 6-5-8, shows the advantages-disadvantages
of UTM vs decimal degree. Decimal degree also outweighs UTM by a ratio of
2 to 1.
The conclusion emerging from the four tables is that the Maritime~
packaging should be based on decimal degree.
6.5.7 Recommendation
It is recommended that decimal degree be adopted for geo-packagin£
in the Maritime Provinces.
The proposed system is shown in Figure 6-5-17 to 6-5-20. It has
the following characteristics:
i. Packages are designed to be sub-sets of the 1:50 000
and 1:250 000.
ii. All medium and large scale packages have the same aspects
as the 1:50 000 NTS packages.
iii. 1·1ap sheets are the same size at all scales.
iv. The numbering system is composed of the latitude and
longitude of the southeast corner. It has, as prefix,
a scale identifier.

Se xa ges i ma 1 Degree
Advantage - disadvantage summarized in Table 6-5-5
The decimal degree has definite advantage over the sexa·;esir1a1 degree. ~-
Constraint #1 There must be- a uniform pack~ging in the Maritime
Constraint #2 UTM and JOTM are the only two viable common Maritime and plane coordinate systems
for packaging.
Figure 6-5-16 Flow chart showing the steps leading to the choice of coordinate for gee-packaging
30TM
Advantage - disadvantage summarized in Table 6-5-6
UTM
I t
i
I I
~-.--------~ ~ &> I I
Neither one nor the other present significant benefit.
c,cimal C :gree
Advantage - disadvantage SU!Tr.'larized in Table 6-5-7
I Adopt decima 1 degree
for gee-packaging
I
3°TM
cr.oi .:e
UTM
3r:j
Dcci:-a1 Ct2".;r~t?
I I I I ! I ,;ctvantage - Cl SJ o'Cntage : ; l sorra ri zed n ;--'
Table 5-5-I
!
I f-' f-' \0 I

Cot~PAP.ISOtl BEWEEN SEY.AGESH1AL AND DECIMAL DEGREE FOR THE r·lARITIME PACII.AGING ------~-------------~----------
noe.f-... 1 n,....,. __ _ sexagesimal Degree Decimal Degree "-------· (De_?ree, minute, second and decimal of second) (Degree and decimal of degree)
i t.aiG U. EFFECT '
SL'3JECT ' !>DY'A:fi:'\SES I DISADVANTAGES ~ri-'
. ht ADVANTAGES
I r~c;.;..~g~ra ' I Difficult tc make large scale packages The medium and large scale packages can ~~·-~c ·:::;-
I sub-sets of both the medium scale and NTS 1 easily be a sub-set of each other and
l .:a:~.y, packages. Difficult to produce a of the NTS packages. (Figure 6-5-17).
: ' coherent family of packages and map sea 1 es. A coherent family of scale and packages
' I A package at the scale of 1:2000 would need can then be produced. I
I ! I to be 36" by 72" to be a sub-set of the (Figure 3-1~1) 1 :50 000.
I
' I 1 Ir:Ce.,_irg :-:-~e srcticw1:- of the ~TS can be :Jsed fer ir:C£~xir.g the ll'.edium 2 :;:J1e ~aps. I
: ~3:~~;~ Impos~ i b 1 e to produce one package and \ Packages and map sheet can be produced at
i and :cap i
one standard size, at all scales, for the
i sizes map S1Ze and achieve rationalisation 1 whole Maritimes in land and off shore.
I in packaging. (Figure 6-5-17 column 4)
! : ; Efficiency : I
Difficult to increase the present package Packages and map sizes can be 1ncreased
\ • ! and map_sizes t? imp:ove the efficiency 1 (same as 1 :50000) and increase the
I and ach1eve rat1onal1Zation in packaging, efficiency of the series. (25% less packages and map sheets)
i c i l .co~o,-y I
Difficult to use the same production 2 1 Maps can be of a uniform s1Ze. Con-
of scale material size for all maps at all scales sequently a single production·materials
and achieve economy of scale. size is required for all scales. Thus the econoniY of sea 1 e should be ach 1 eved.
r Packages I Package and map sheet numbering cannot Package and map sheet numbering can be r~~1ona11-
· and be rationalized, (Section 6.5.4) con- 1 zed (Figure 6-5-17). It is easy to recall how
I map sheets I sequently one can ne.ither recall how the the number! ng works. Adjacent packages or
I numbering 1 numbering works nor deduce the numbers sub-packages numbers, at any scale, can be
! from adjacent packages. easily determined.
Package numbering gives no infonnation 1 Package numbering easily establishes information
about the location of the maps and 1t about the location of the map. It also
establishes no direct relationship establishes direct relation between the map
between the map data and the ~rounJ. data and the ground.
Digital Package numbering cannot be used directly 1 Numbering systems can be used directly as a
aspect as a data index. data index. (Figure 6-5-17 last column).
Sexagesimal degree must be converted to Decimal degree can be processed directly in
decima 1 degree to be processed in 1 computers. Coordinates can be read as a
computers. Coordinates cannot be read string of digits 45.279213.
as a string of digits i.e. a column is needed for I Deg
1 Min I Sec I
45 16 45.167
Total 41eight 10
Conclusion The Decimal Degree has definite advantages over the sexagesimil degree
Note: The sexagesilllll degree vs. deciul degree is presented in a condensed form in this table. There ts no lengthy discussion presented in the report.
Table 6-5-5
D I SADVAfiT AGES Wei- 1 ... h~
i
4 I I
I '
~he graticule if! degre:?, l'tinute, 1
! econd of tlte ~;TS is of little 1
~~ge'~c~~~E~~~.the w~dium and I ! J
3
I I z
z
3
3
3
3
Total Weight 24

COMPP.R!SON OF UTM Arm 3°H~ FOR TilE ~~JlRITir-1E PACKAGING -----r-- !(with >ter~ooraphic in N.B. and P.E.1 1!T~nd 3°TM in tl.S. as map project10n piane. 3°Hi .. , and cocrd1nate systemJ (with 3°TM as the common Maritimes mao projection plane and plane coorc1nate s.vs:ec•,
I SUBJECT AD\'tit.TAGES I OISAOVMITAGES . . ~IH ADVANTAGES CISA:\/P.i~'TAGES
~ producTon aspect (6.5.2.1) Non-standard map sheets are 1nev1table 1 There is a zone boundary in all provinces·
(at all scales) at the zone (632 km of zone boundaries). Fisure 6-5-7< e 1 boundar! es. ( 456 km of zone ~ Non-standard map sheets are ir.evi Lcble.
variation I bocndar1es). F1gure 6-5-7b. This I This causes probler::s in corpi1ation. I [ causes problems in compilation, 1
printing and filing. · printing and filing. I
~ili 1 .
I"''"" 6-6-" ). I ' I"'"' ,_,_"! ~---------------+~~---------~----~
!denti- Packages are difficult to define and
I ! Packages are difficult to iden:ify at the
fication identify at zone boundaries in two l i zcne bcundaries in all provinces. and provinces. (Figures 6-5-4 to 6-5-6) 1 (Figures 6-5-~ to 6-5-6) definition I
! I
~--~~continu·ities of the zone
--,. : Oiscontinuiti2s cf tloe zone bocco3 ;es
Nu~beri ng i i l ystem ' bcundJ.riPs create G~scontinuities in
create discor.tir.uit~es in tne ;::a.:r:- :;:2 I I I : numJering in ail ;:;rovinces. Cor.• ... ~-=•-! I the package numbering in tv;o
I I 1 would arise if packa<;ing exception IdS
i provinces. Confusion waul d arise if packaging exception was allowed.
t-i allowed. (Figure c-5-7)
I (Figure 6-5-7) i
l -----Referencing r-lap sheets with a dual predominant 1 Map sheets .,.:; h a du 1 prejc~inar.t
i -~~---~-- --~ ...1 -~ ·-- ---...l .. ~ ... ~ -- : reference gri ca·~s.:._ ;::-rvC:..(ti ... ~1--. 3 : difficulties r, a 11 r::v1 r:ccs.
· Su)sid~c.:r.Y referer.ce grid is PreGor_::i;ant r~ference grid is not 1 [Predominant referer.ce grid is ; earal1e1 to :re rca;> sheet edges paralle• to tne map sheet edges. I parallel to the map sheet edges, -~-----------
;-i--------t~--- I Difficult to print the three Di ffi cult to ~ri nt the three ;efer2 .:::;: t systems required ty the users. I Users' aspects(6.~.2.2) reference systems required by the
11
C d' t i I users. Predominant: provincial plane I oar 1 na e 1 coordinate system
. ose i Subsidiary : UTM and ellipsoi-
PreCom1nant: ;.:-r0vincial p1.=r.e cc,--~·-:::1r~~:t· sys te,:·
~~~t~~ordinate I ' -------~--- ---------·-·--4 I
: Subs~ diary u:~~ GiL: e:;~ ~-S8~C3 c:::··~' ",::. S.J'S te-:
Map : ._a rc:e a c :-:-.E:di ur scale rr:ap re-planning -::;uire;-.e :s ~ie easy to delinea:e
· on :;r.·a~ sca:e rr.a;;s. (Figure 6-5-12)
Map use Users' frustrations due to packaging discontinuity, '"ap sheet size vur~ations and package numbering discontinuity in N.D. and N.S.
: Q~her as:ects (6.~-.2.2)_
Surrc·.;'ld
Extrerr:ely difficult to design a universal surround.
I I I I
I 1 I I
Indexing lrncexong is geoeraily easy and it I Indexing problems for map sheets I requires no com;Jutation. adjacent to zone boundaries. I I (Figure 6-5-14)
---~------------F1cxibilit.y. ~3cr, ;:.n~,,~r.ce c~n ~Jiro':.:::.in its cwn
I .
···<-<>--' ·n ._.._,·.:.·- •- "h· ·-', '-'"'..:,
Di gi tal I I Similar production and user
production I difficulties as in the graphical mode. and use I
i I Gee-digital packages are.not sub-sets of the NTS packages.
i Tota 1 Vlei ght : I I
Conclusion I UTM does not have significant advantage over 3°m for the Maritime packaging
I
I
I~ I I
Large and r;ediu:r. scait: ;:-;:.r re•~uire--2·~::
are very difficu1t to Gtli:-~..:atc en sr;.a~l scale maps.
Users' fn.1s~rat~cn ~;e to CisCOI;tinuity) rae (i e si:E -:s, and packa;e n-.;;~ber r. .:i1Sccc~.::-,~~:~.
in all provinces.
Extrerr.ely diffic~1t to desigr·. universal surround.
co:.:putations and r-·easwre .... c .. t Sc:-,., 14 I Indexing is difficult. lt re ci res
ir.dexing prcbler:s at ed~:cs a s:~-:-.· ... •... -,·_ . ,II----l~------------------~A common plene coordinat:.: sys~-e~~~-~-----1 2 ! map project~.::r1 plane is recuir-•,...
I l Similar production and usel·s
l j difficulties as in the g:·aphicJ1 t:ll'Ce.
i 1
J Geo-digita1 packages are r.ot sub-stts of i the NTS packag~s.
2Z ~ota·i ... -ei-;r.t 18
·--
----·-
Table 6.5.6

COMPARISON BEn!EEN .3°TI'1 AND DECH1~.L DEGREE FOR THE MARITIME PACI<AG!i:lG ' 3 ™ 1 i (with 3°TM as the co.mon Maritimes map projection
i plane and plane coordinate system)
Decimal Degree (Degree and decirr.al degree) 0 • (>lith stereographic inN'. B. aAd P.E.!. and 3 TM 111 ,tiS. 4~ map projection plane and plane coordinate system)
___ .. _
--------------------------------llllG 1EWt EFFECT
ADVANTAGES ' DISADVANTAGES·-. Ffl ADVANTAGES I DISADVANTAGES
Graphical producti4n aspect (6.5.2.1) There 1s a zone boundary in all
SUBJECT
Size variation
ldenti fi cation and definition
lluomering System
Referencing System
1 provinces. (632 km of zone boundaries) I Figure 6-5-7c· Non-standard map sheets are inevitable. This causes problems in compilation, printing.and filing
Packages are difficult to delineate onJ identify at the zone boundaries in all provinces (Figures 6-5-4 to 6-5-6)
Discontinuities of the zone boundaries create discontinuities in the package numbering in all provinces. Confusion would arise if packaging exception was allowed. (Figure 6.5.7)
; I I
Map sheets with a dual predominant referer.ce grid cause. production difficulties in all provinces. (Figure 6-5-7a)
2
All map sheets are the same size, Package size variation is +4 em for a 4,50 range of latitude. -
No pack~3ing identification and definition problem.
No discontinuity in the package numbering.
Map sheets with a dua 1 predominant reference grid cause product ion difficulties in Nova Scotia.
(Figure 6-5-7a) I
~~~ j?rec!:;::-;;nant reference grid -l Predor.1inant refet·I.?,~Ct: griC is r,;: ----;is para11el to tr.e map sheet j 4 para11el to the "·"P sheet edges. 1 •
J ;ed;es.
I Users' aspect (6.sh.21 j Difficult to print the three reference
I Coordinate use j I systems required by the users. I Predominant: provincial plane coordinate . I ~~ . : Subsidiary : um and ellipsoidal
Easy to orint the three reference I systems required by the users.
I i 1 I coordinate system. ..-------
~~· !'.ap Planning i I Large and medium scale maps are very 1 Large and medium scale maps
I i! I difficult to delineate on small scale requirements are easy to delineate 3 maps. on small scale maps. .
I I I , , . . No package discontinuity, unnotice- -- ·---------f'.ap use I U~e:rs fru~tratlOns due to pack~g1~9 able assembly curving (Figure 6-5-13),
1 I d1scont1nu1ty, pac~age ~1ze v~r1~t1o~s, 1 nstant h t iz continuous I I and package number1ng d1scont1nu1ty 1n ~0 b , g\eet s e, ' all provinces. um er 'n ys em.
' . . i Other a'pects IF..5:3.~L I Extrer:lely ·difficult to design a Easy to design a universal 1 ' • 1 surround. I Scrrc~nd : . ur.lVersal surround. _
I. Indexing I I Indexing is difficult. It require com- No indexing problem. Medium and large putations and measurements. Indexing 2 scale maps are sub-sets of the NTS. ! I prob 1 ems for map sheets, adjacent to It requires no computation.
! zone boundaries. (Figure 6-5-14) . . .. .. Each prov1nce can ma1nta1n· lts own
Flexibility I 1 A c~num~ plane CO?ra1nat: system and map 1 olane coordinate sv~~m and its 1 I , project1on olane 1s reou1red. O~ln"iii.ap__.JJJJUf!W.QII" :nP ' · · . I · · · · · · No production difficu ties and more D1<;1tal. I S1m~la~ product~on and user d1ff1cult1es 1 flexibility in coordinate systems to product1on & 1 1 as 1n .he graph1cal mode. store data in computer memories. use.
Efficiency {6.5.5)
Geo-di gi ta 1 packages are not sub-sets of the tiTS packaqes.
Difficult to design to yield an i i efficient packaging.
Gee-digital packages are sub-sets of the NTS packages. can be designed to- .)'ield an efficient packaging.
-r I Total Weight I 19! Total <:eight
·-·----:---2
" -2
---
. -3 i :~
-43
t Conclusion lTh~ ~dvantages of the decimal degree outweighs 3°Tt1 for the Maritime 1 ackaging.
Table 6-5-7

COr1PARISON BETHEEN UTM NlD DECIT'I.AL DEGREE FOR THE r·1ARITIME P.~CKP.GING
I UTM j Decimal Degree (Degree & decimal of degree)
J I ('lith stereographic map projection plane in both; New Brunswick and Prince Edward Island and 3°TM in Nova Scotia) 1
l.1J.lG rm1 EFFECT ! SUBJECT ADVANTAGES DISADVANTAGES DISADVAr~TAGES
I Graphical pbduction aspect(6.5.2.1) I r:on-standard map sheets are inevitable (at all scales) 4tthe zone boundaries This causes problems in compilation, printing and filing. W56 km of zone toundaries - see Figure 6-5-?b).
weight ADVANTAGES
All map sheets are the same size. PackiQe size variation is ±4 em for a 4. so range of 1 atitude.
··::~- I
I , Size variation
lde~t -ficat on & ~efin tion
~iu::-.!Jeri ng system
Packages are difficult to define and identify at zone boundaries in two provinces. (Figures 6-5-4 to 6-5-6)
Discontin,;ities of the zone boundaries create discontinuities in the package numbering (in two provinces). Confusion ~ou 1 d arise if packaging exception was allowed. (Figure 6-5-7)
No packaging identification and definition problem.
No discontinuity in the package numbering.
I
T I ' ' -l I 12 I '
~eferencino I \r1ap sheets with a dual predominant i'ap sheets with a deal crEc0c:inar.t -;---1 system :~ reference grid cause prod·uction reference grid causE pro~~ctlon Cif- • 3 I
~~!'ficulties in Nova Scotia. 3 fi~u1tie: !n f~ovz. Sco~ia. ! 1 \n~ure 6-5-?a} (F1gure t)-:)-7a). l :
r-----+s;;u;;::;-;-,Ti 7c ,;-:· a;-;r;;:-;;-;r~e"-fe:;;r;-;:e:;;n~~;::e-:-;;;;r;lic;:d"'i :=-s -;p:::a::r:::a11 "1 e::'lr---kp r::e~a;-;:. o-=m7i =-na;,n~. tc--::r;e;fe'"'r-:ec:n-=c""e-g"'r"'i"'d,..,.i.,.s -n'"'o"'t___ . ~ · · · i- i __j to the :r:ap sheet eoges. parallel to the map sheet edges. redo~r.inant reference 9' 10 1S no. I ' I ·, 1 parallel to the map sheet ed;es. ' I
Users' aspe~ts (6.5.2.21 Difficult to print the three reference Easy to perm~t the three reference ,·-----1 systems required by the users. system; requ1red by ~he users. i 1
oordi nate use
Predominant: provincial plane coordinate 1 Predom1nant: prov1~c1al plane 1 •• ! sys tern . . coord1 nate ~ys t~ms ! · •
'Subsidiary : UT~ an~ ellipsoidal co- 1 ~ubs1d1ary : ~TM and ell1pso1dal co- 1 I . a in s ste 1 t Fiaure 6-5-ll 1 ordinates system 1 ,
!'a Large and r..ed1,;m scale n;ap requirerr<;nts Large and medium scale map requirements ~--~ _1 "· are eas~: to celineate on small scale 4 are easy to delineate on small scale I 3 I "annlng <eaps, (Fi;ure 6-5-12) maps. j j
''.ap use
Gt~er assec~s (6 S 2.3)
Surround
Indexing Indexing is generally easy and it requires no computation.
FlexibilityjEach province can maintain its own plane coorGinate !:ystem c,nd its O'im map projecticn plar.e.
"'91taT Froc!uction and use
!.Users.' frustration due to packaging ~- INa package discontinuity, unnoticeab~e I I . :discontinuity, map sheet size variation 1 assembly curving (Figure 6-5-13), 1 < I tand oackage numbering discontinuity in constant sheet size, continuous '! ' j l!-ie~< ~runswi ck and Nova Scotia. numbering systems. l
Extre::-ely difficult to design a uni versa 1 surround.
Indexing problems for map sheets djacent to zone boundaries. (Figure . 5 .14)
imilar producbon and user d1ff1cult1es s in the graphical mode.
eo-digi tal-packages-arenot sub~-sets f the NT$ packages. ·
4
. 2
Easy to design a uni versa 1 surround.
No indexing problem. Medium and large scale maps are sub-sets of the NTS. It requires no computation •
Each province can maintain its own plane coordinate system and its O>m map projection plane.
~productlonanTfCulties and more flexibility in coordinate systems to store data in computer memories.
Geo-di gita 1 packages are sub-sets of the NTS packages.
Gl I
15 i
! 2
I ---"1 " -3 -3 -
I Efficiency 1{6.5.5) bi.fficu1tto design to yield an efficien~: 1 1 r·---------+·----------------------------------~~ackaqlnO,
~~2k~~i n~e.si gnett to yield an effi ciant
Tot a 1 wei qht 23 Total weight .;6
Conclusion. The advantages of the decimal degree outweigh UTM for the Maritime packaging ..
Table 6-5-8

PACKAGE SIZE COVERAGE NUMBER
SCALE TEP IN ~TEPLN OF
RANGE SCALE DECIMAL PECIMAL PACKAGES DEGREE PEGREE em x em km x km PER
OF I OF DEGREE ATITUDE LONGITUD SQUARE
1:200 000 1.QQQQ I 2.QQQ0 56 X 78 11 . 2 x· 156. 4 0.5 SMALL & MEDIUM 1:100 000 0.5000 1 1 .0000 56 X 78 55.6 X 78.2 2
SCALE 1: 50 000 0.2500 I 0.5000 56 X 78 27.8 X 39.1 8 RELATIONSHIP 1: 20 000 0.1000 I 0.2000 56 X 78 11.1 X 15.6 50
(see also figure 1: 10 coo 0.0500 I 0.1000 56 X 78 5.6 X 7.8 200 6-5-18) 1 : 5 000 0:0250 I 0.0500 56 X 78 2.8 X 3.9 800
1: 20 000 0. 1 000 I 0 . 2000 56 X 78 11.1 X 15.6 50 ~·1EDIUM & URBAN 1: 10 000 0.0500 I 0.1000 56 X 78 5.6 X I 7.8 200
SCALE 1 : 5 000 0.0250 I 0.0500 56 X 78 2.8 X 3.9 800 RELATIONSHIP 1 : 2 000 0.0100 I Q.Q2QQ 56 X 78 1.1 X 1.6 5000
(see also figure 1 : 1 000 0.0050 I 0.0100 56 X 78 0.6 X 0.8 20 000 6-5-19)
1 : 0.0025 I 0.0050 56 X 78 0.3 X 0.4 80 000 500
~RBAN & ENGINEER-1 : 2000 0.0100 I 0.0200 56 X 78 1,1 X 1.6 5000
ING SCALE 1: 1000 0.QQ5Q I 0.0100 56 X 78 0.6 X 0.8 20 000
RELATIONSHIP 1 : 500 Q,QQ25 I 0,0050 56 X 78 0.3 X 0.4 80 000
(see a1so,rigure 1 : 200 0.0010 I 0,0020 56 X 78 0.1 X 0.2 500 000
6-5-20 1 : 100 0.0005 I 0.0010 56 X 78 0.1 X 0.1 2000 000
Figure 6-5·17
Geo-paekaging based on :leeima1 degree
LATITUDE AND LONGITUDE
OF THE SOUTHEAST CORNER
LATITUDE LONGITUDE 45.0000 64.0000 45.5000 65.0000 45.0000 65.5000
45.3000 64.4000 45.3500 64.5000 45.3000 64.4500
45.3000 64.4000 45.3500 64.5000
45.3000 64.5500 45.3300 64.4400
45.3350 64.4500 45.3300 64.4550
45.3300 64.4400 45.3350 64.4500 45.3300 64.4550 45.3330 64.4440 45.3335 64.4450
PACKAGE NUI·1BERING
2000 450000640000 1000 li5500D650000
500 450000655000
200 4530008!4000 1 00 453500[;1.!5000 050 l!530006L!5500
200 L!530006l.J4000 1 00 4535006£!5000 050 453000644500 020 453300644400 010 453350644500 005 Lf53300(44550
020 4533006£!4400 01 0 Ll53350644500 005 q53300£!14550 002 lf533306L!4440 001 £!53335644450
I ·I-' N ~ I

1:100 000
I I I
I
I 1:50 000 (Same as
presently oroduced in the tiTS series)
Figure
1:200 OlO
!•lAP SHEET _O_R __
SCALE PACKAGE NUI1BER
200 000 100 000
1 50 000 1 20 000 1 10 000 1 5 000
2000 1•5oncnf,l:oooo 1000 lt~5GOOf,'C0880 soo l!·,ooonr;r.:sooo 200 I'S300Gi),~ooo 100 I!S3500(.Jt5000 050 1\53000{)1~5500
I ! I I 1 ~--t I I I 11 . 1 o ado ! ' · l:20 ooJ I
I FT2ao !
i ' -· I I
I I I
I
i
I I
I 6-5-18
I I-' N V1 I

g 0
u 0 0
a
""
-126-
I -
r----·-+~-
I I
L
0 0 0
"'
·········-l
T "' I
"' QJ ,_ :::J en u:

1:1000
-r--- 1:2000
I
I -
1-I
I
!
I :
i I
! ..__
I ~ -I
~ I
I 1:500
-
I
Figure 6-5-20
MAP SHEET OR
SCALE PACKAGE NUMBER
1 2000 1 1000 1 500 1 200 1 100
020 45330fl644400 010 453350644500 005 ~,~3300[44550 002 · 3330FN440 001 333!i{)Lj4450
I I !
11:100 I I ,_ 1:2~0 1
I I I
1 ! T
I l
I
..J
I i
I ~
tv '-I I

-128-
7. SPECIFICATIONS THAT SHOULD BE SUBJECT TO PERIODIC REVIEW AND i'tlDIFICATION
7.1 MAP CONTENT
The map content, in the Maritimes, is described in the technical
specifications in a narrative form. (Figure 7-1-1). It includes primarily
those environmental elements which are most easily identifiable on the
aerial photography. The maps produced to these specifications are called
topographical maps.
Looking at topographical maps produced around the world one sees
that some topographical maps contain little information and others, at the
same scale, contain a great deal of information. It is easy to see that
there is no consensus on the content of a topographical map. As mentioned
earlier the specifications for the 1:10 000 series in Great Britain total
approximately 120 pages. Similarly there are 120 pages of specifications
for the 1:20 000 topographical map series for fhe province of Quebec. In
the Maritime Provinces the specifications are not nearly as voluminous.
These three sets of specifications show clearly the wide range of the topographica·
map content specifications. There are no topographical maps which contain
!ll the topographical information. Even at the largest scales there is
always a need for some generalization. For this reason it woJld be more
appropriate to classify maps similar to the existing topographical maps in
the Maritime provinces as basic maps, i.e. maps which contain the essential
topographical details.
In the early 1960's the general specifications for topographical
maps at large scales in the Maritime Provinces were a six page document.
These general specifications were divided into six sections: general in
formation, aerial photography, photogrammetric compilation, map content,
accuracy and final presentation. The map content section accounted for
approximately b1o pages. Looking at the evaluation of map content in the
Maritimes one can observe that the general specifications have changed
considerably but the map content specifications are essentially the same as
they were in the early 1960's.

The •ppi.ng ehall ebow· all topographic and pl.an-1Mtric detail that can be interpreted on the photograp!o' and that can be abo~ clearly at ~ ecale of l/1200 and in general, shall be the ~~~g: .
a) · Building of a· permanent or Semi-Pe;nnanimt Nature
The dillension ot baildinge shall be determined b;y the outline ot their roo.fs.· adldings having at leut· one dimension larger than 10 teet shall be ehoNn to shape and scale. Bulldings whose largest d!Jaension is 10 .feet or \UI.der shall be sho'WI'I b:y· a Qlllbol.
b) Roads, Streets, Railroads, Tracks, Trails and Footpaths
The width of the roads w.ill be determined either b;y the width .from curb to curb, or the width of the travel path. Driveways longer tban 50 teet will be shown. Sidewalks will not be shown. Trails shall be shown b;y a single dashed line representing the center line. Trails and paths shorter than 100 feet will not be shown. Where the number of trails or tootpaths ·1s so great as to intluence the legibility of the map, trails or lesser significance shall be omitted. Railroads shall be represented by the center line· of· the tracks. Railroad sidings and spurs shall be showed, c) HYuro TelexrepnanU Telepnonti 1ines
These lines will be shown by indi 'Vidual poles or towers when these are 'Visible on the photography and they shall ~ connected by a dashed line • When poles or towers are not 'Vi.si ble, the lines w:ill be shown by a s;ymbol, Within built-up areas service poles will be shown,
d) other Cultural Features
All other cultural features that can be photographically interpreted and shown at this scale 1
such as bridges, major culverts, piers, viaducts, harbours, airport runways, flood gates, dams, large chillllleys, mine shafts, pipe lines (above ground), piles, pits, parks, parkinf: areas, radio, radar and microwave towers, subst.antlal rock outcrops, fire towers, ski lifts, oil ancl gas tanks, reservoirs, silos, retaining walls, water towers, platforms and cemeteries, etc •
.All fences, wall.e and hedges that are visible on the photography shall be shown. All survey lines or cut lines 'Visible on the pl'!otograph.;r shall be shown. ·
'AnT feature not sho'oll by a S111Lbol shall be drawn to scale and annotated,
ei. All water f.ea~urcP-
Features such as rivera, stre&llls, lakes, ditches, rapido, falls, canals, dams (incluc11ng beaver dams), swampe and floOded lands will be outlined. lfuere the course or a water fea1.urc cannot be definitely !!Stablished, the app•oximate position shall be shown by a broken line so as to indicate the continuit.:: of drainage • Meandering or rivers lll!d stream11 will be shown. ·
All coastal shore lines will be shown at the mean higl.t water mark; and only man-made deta.ii will be shown below thie line. The value tor the mean high water mark will be auppl.ied b7 the inspector.
Dra:Lnage features shorter tban 100 feet 1n length sball. not. be shown.
St.ream.s averaging m.ore than 5 feet in width shall be shown llit.h double lines, each shore being identified by a solid line. Other drainage lines· shall be shown by the at.andard s,mbol. Ditches which are adjacent to, or obscured by other cultur~ features, shal.l not be sho'oll.
t) Vegetation
The outlines of 1o0oded areas, large clumps or· trees, shrub areas, and if they constitute land marks, very large indi'Vi.dual trees shall be shown, Particular care shall be taken to show the true shape of clearings 1n extensi vel;y forested areas. Clearings smaller than 625 square feet· shall not be shown. Orchards shall be outlined and annotated. Clearings of hydro lines,
t.elephone lines, ski tqws, survey and boundary lines shall be shown by a clear band of actual width. Where liOOds are terminated along shore lines or road ways the woods boundary s:ymbol shall not be shown. Areas which constitute shrub ,. .. n,,.,.., nnl• will be outlines and qmbolised. •
g) Control & Photo Centers
.All horizontal ground and photogram:netric control and photo centers used in the compilation shall be plotted in their true position on the compilation manuscript. On the final product only those permanent ground survey points falling within the compilation limits of the map sheet will be shown.
Figure 7-1-1 Map content for 1 :1200 mapping as described in APSAMP project 71012.
I 1-' N 1.0 I

-130-
A comparison of the map content specifications at the scale of
1:1200. 1:2400, and 1:4800 in the early 1960's leads to the observation
that the map content specifications were very nearly the same for all these
scales. Comparing the same map content specifications of the early 1970's,
it is easy to see that the situation has not changed. It appears that the
production of the three large scale maps (1:1200, 1:2400, 1:4800) which are
in a narrow scale range has led to the copying of the map content speci
fications from one scale to another with only minor additions and deletions.
It appears that the designing of a completely independent map content
specification for every scale could not be justified. This observation
reinforces the need to introduce parent map scales and to derive maps as
the need arises.· (See ·also section 2.1.1) In other words, at large scale,
the adoption of the 1:2000 as a parent scale will be an impetus to:
i. Examine the map content specifications of the 1:1200, 1:2400 and 1:4800 and integrate their contents into the design of the 1:2000 parent scalej
ii. Reorganize the map content in a family of themes;
iii. Rate the themes in order of .important; and finally
iv. Decide which theme combination constitutes a basic map series.
The introduction of map content, structured on the theme basis,
will also provide an opportunity for the analysis in more depth of the
elements belonging to each theme. This, hopefully, will lead to improvements
in the map content specifications. Even with the theme concept however it
is expected that the establishment of specifications for map content will
continue to be a dynamic process. The content will be changing as the need
of the society is changing and as the Maritime cartographic culture develops.
In the traditional approach the addition of new elements to the map
content specifications and consequently to the maps is no problem. It is
done by adding a new symbol to the legend. However, in a digital data base
the addition of new elements is quite a different process. In a digital system
there are ordinarily two parts to each element; the
~IHJI.T and the ~IHERE. The WHAT is a code which is selected to identify an

-131-
element. The ~!HERE is expressed by a set of coordinates 1>1hich define the
location or position of an element. The design of the codes to identify
elements within a theme will require careful analysis and long-term
foresight to ensure that sufficient flexibility remains so that a new
elementsmay be added at any time.
In conclusion it is believed that the themes and consequently the
map content will continue to be dynamic; it will change with the need and
evolution of the Maritime culture.
It ..W Jtc.comme.nde.d .that a. 6-iM.t .Ue~ta.Uon a..t de6bung .the.
6a.mU.y o 6 the.mu a.nd id e.nti6 y-Lng the. eteme.ntJ., o 6 e.a.ch be. C1VlJL.i.e.d orLt M
60011 a6 p06h-i.bte..
7.2 SYMBOLS
In the t~aritime Provinc:es the map symbolization has been changing
very slowly since the first maps were made approximately 40 years ago. This
can be observed by examining 20 chain plans and recent medium scale maps.
This is basically due to the lack of cartographic specialists and the lack
of demanding users. From the et~rly 1St60's to tne iormation of LRIS, the
symbolization could be summarized in one page for the larger scales of
mapping. (Figure 7-2-1) The paucity of symbolization resulted in extensive
labelling of features. As the l~aritimes enter into map production from
digital data the decision of whether to dispense with labelling or to use
extensive labelling and few symbols or to have a mixture of both will arise.
At first glance it appears that the least labelling would be preferable.
i. lt ~>IOuld eliminate the need for operator intervention to position the label;
ii. It would avoid the problems of bilingual labelling.
However, it is easy to foresee that in the long term a large quantity of
symbols will appear with a large number of themes. Hhereas up to now it has been
possible to print all the legend in the map surround, this may be difficult
with a large number of symbols. If a custom legend \'las accepted rather than
a universal one, the problem could be solved. A custom legend is one in

-132-
PROVINCE OF NEI4 B:\Uii:,;·J!CK DRAFTING SPECIFICATIONS (1972)
B\ilLDL'iGS
.RAILWAY
ROADS & TaA!LS
'/1200 ... -·"(lt-! __ 1flt_&_o__,_o __ _ .J'---···· I/2~10~---=-· -------- r-----.016 I .012"
•• 311''-___ .....,. __ !,I'
.008" -
r-- 1.0" --- / -------....,.-------~- ooo
""- .014'' .012" /. '"
L"Q12" I
/-.25'' ==~===
[.010"
.20" ---~---
CliT·LDf:i.: (su;;~ ~pees as for trail) --- ___ _ C.J1!. _!:IJ!L __ ----
SCRUB, ·'.-/OOZCD An:::AS
ES:iC£:3, "ii:~DC;.:~; I 'I ALL:> · JJiD TRr::.; ·!,I.H=:S
COli'TOUR ;;m:.a:::ns .... :~ S?OT P.L!-::VA~ 10::5
(Show nu~:~ber to ricH
f- 1.0"--1 r 75'.' -1 -[1__ 15" "·oolfol -·-r i-~ 15 .. ~.-oo$;·
[--- .90'!... -1 r-.5o·r.J .
-11 '"'ooa". J..._~-u>·"oog~. . .10" II · .10" :
r--50"!-· ·- ---,----·- " Ll.lO" .008
r--.50" ~ fi_'"\oo6;.~
.10"
/J;--···· .01.0206" ., Suppl_ementar:: contours . . '!· ·ppro_ x. 1" 1inco l,'2o•: --space
.' _L_ .• o".:!o::..::<6c..''-----+ I - ·----- ~--··- _ .. ---·
_ 60/900 Vo>rti c:1l ~ · aojooo :ta1ic.
of spot wh~rc ~osoib1e)
Figure 7-2-1
60/00'J V!.'rtica~ 60/f?OO Italic
6ojooo·vertica1 60/000 Italic

-133-
which the legend block contains only the symbols appearing on the map at
hand. A second alternative would be to assume that n1ost users are familiar
with the most common symbols and print only the least common ones. In this
alternative the legend would be of little help to new map users. A third
alternative would be to provide on demand a symbol pamphlet containing all
the symbols in use. The third alternative is practical when a State has
reached stabilization in symbolization. Hov1ever at a time when the Maritimes
is about to enter into computer-assisted cartography it will take a long
time before any stabilization in symbolization is reached. Consequently the
third alternative does not appear to be practical in the near future.
Since symbolization will be continuously changing to adapt to new
users and technoJogical requirements, it appears that the custom legend will
be the positive ~tay to ensure agreement between the map symbols and the
legend.
As a consequence of the computer-assisted cartography implementation,
the symbolization may have to be completely redesigned. To illustrate this
let us consider the symbol in Figure 7-2-2.
Mine shaft
~ !.1 5
~1~·?j_;~r · __/\ 3.0
.1 0 -- J.-
Assuming that this symbol is to be mapped with a flat bed plotter
operating in a scribing mode, a sophisticated sub-routine will be required
to direct the scribing point to plot the symbol. The time to scribe the
symbol would also be relatively long. This shows that the complexity of the
symbol design can have an important impact on the speed of map production.

-134-
However a laser plotter using the same graphic sub-routine could be used
to overcome the speed limitation of the flat bed plotter operating in a
scribing mode. Laser plotter generations are fast because they are
electronically controlled and produced with few or no moving parts. Further
more as computer and communication speed increases the laser speed will also
increase. Laser plotter is a promising breakthrough in computer-assisted
mapping.
The photo head is another device for plotting symbols in computer
assisted cartography. With this technique one can handle complicated
symbols even though it is difficult to deal with large quantities of them.
Also the plotting must be done in a dark room which is a poor working
environment. So.far photo heads have been very expensive and of limited
success.
Even though laser plotter and photohead can overcome the speed
limitation in scribing complex symbols, they can remain a problem in
graphic terminal. This is because the same sophisticated sub-routines are
likely to be used. Unless the computer and communication speed is improved,
the time to plot comolex symbols nn 9ri!phir tp,.,..,;.,,.,~ ·~ill re!'lain relati·::1~·
long.
Graphic terminals, cartographic plotters, computers (speed},
communication systems (speed) are improving at a relatively fast rate.
Consequently it is still difficult to evaluate how this hardware will
influence the symbology designed for purely graphical map making.
We concluded that with the development of the methodology of the
Maritime theme concept in graphical form, there is a need to develop a
comprehensive set of specifications for symbols. The symbols should represent
the elements of the themes ~lith the least possible labelling. This com
prehensive set of specifications will become the base from which the
symbology for computer-assisted mapping will be developed. In the transition
period from graphic to digital a custom legend should be introduced.
1:t ,U, !Lec.ommc.nded tha-t a eomptte.henl>i.ve .t.et o6 llpec.i.6.{.c.alioM 601!.
.t.ymbo£..6 be developed W..Uh the !ea<~t poM-<b!e !a.bel.Ung. TIW, <let o6
.6pec.i.6.{.c.alion& 6oft .t.ymbo!ll .U, to become .the baM 6ttom whi.c.h the. ~.>ymbo!ogy 6oft
c.ompu..teJt-o.M.i-6.tr.d mapp.i.ng will be. deve!oprd.

-135-
7.3 PRESENTATION OF REFERENCING SYSTEMS
It has been seen that the gee-packages, the map projection plane
and the plane coordinate systems should not be subject to change. Nevertheless
there are many ways to graphically present the referencing system. Some
variations may be with respect to:
i. The size of the reference grids and graticule.
ii. The number of reference systems and the style of presentation.
7.3.1 The size of the Reference Grids or Graticule
In the t·1aritime provinces there are many reference grid sizes.
The reference grid size in New Brunswick and Nova Scotia is five inches
by five inches ·at most sea 1 es. (Figure 7-3-1 )
REFERENCE CORRESPONDING SCALE GRID SIZE GROUND DISTANCE
1:1200 5 inches 500 feet
1:2400 5 inches 1000 feet
1:4BOO 5 inches 2000 feet
1:1!! 1)1)1) (.. 1;-.~~.cs. 5000 feet
Figure 7-3-1
In Prince Edward Island the reference grid sizes vary with the
scale. (Fig!Jre 7-3-2) REFERENCE CORRESPONDING
SCALE GRID SlfE GROUND DISTANCE
1:1250 (P.E.I.) 20 em 250 m
1:2500 (reduction) 10 em 250 m (P.E.I.)
1:5000 (P.E.I.) 20 em 1000 m
1 :10 000 10 em 1000 m (reduction) (P.E.I.)
Figure 7-3-2

-136-
Should the Maritime Provinces adopt a fixed or a scale-variable reference
grid? A reference grid is said to be a fixed reference grid when the size
of the reference grid is the same on all maps at all scales. As a con
sequence the ground distances represented by the reference grid is different
for every map scale. A reference grid is said to be a
scale-variable reference arid when the size of the reference grid is changing in
the same ratio as the scale. As a consequence the ground distances represented
by the_ reference grid are the same for all maps in a selected range of
scales. (Figure 7-3-3)
SCALE
Large
Me~um nedium small
SCALE-VARIABLE SCALE REFERENCE GRID
1:500 (enlargement) 20 em
l:lOOO(parent scale) 10 em
1 :2000(reduction) 5 em
1 : 1000 (en 1 a rgement)" 10 em
1:2000(parent scale) 5 em
1:5000(reduction) 2 em
1:5000(enlargement) 20 em
1:10 OOO(parent scale) 10 em
1:29 OOO(reduction) 5 em
1:10 OOO(enlarge-ment) 10 em
1:20 OOO(parent scale) 5 em
1:50 OOO(derived) 2 em existing
Figure 7-3-3 Scale-variable reference grid
RATIONALIZED GROUND DISTANCE
100 m
100 m
100 m
100m
100m
100 m
1000 m
1000 m
1000 m
1000 m
1000 m
1000 m

-137-
If the ~laritime reference grid is to be a fixed reference grid,
it appears that 10 em is the optimal size. The multiplication of the scale
factor by the reference grid size is easy. Consequently the ground distan.ce
is easily obtained.
Example: Scale
Sea 1 e factor
Reference grid size
Ground distance
i.e.
1:2000
2000
xlO em
20 000 em
200 metres
It can be observed that removing a zero from the scale factor gives the
ground distance in metres. A 5 em reference grid may be considered as a
nuisance by many users who do not use the reference grid. This is due to
the high density of the reference grid lines. For other users a 20 em
reference grid may be too sparse- to meet their accuracy needs.
If the Maritime reference grid is to be a scale-variable reference
grid then the reference grid should represent rationalized ground distances.
This is shown in Figure 7-3-3. One of the advantages of the scale-variable
. reference grid approach is that all large scale maps would have a reference
grid correspon~ing to 100 metres in ground distance and that all medium
scale maps wouldhave a reference grid corresponding to 1000 metres in ground
distance. The 1:5000 would have a reference grid representing either 100
metres or 1000 metres. The reference grid would be an indication of the
source and accuracy of the maps. The users, when looking at a map, \'Jill
use the reference grid to visualize the ground distances.
Both the fixed reference grid and the variable reference grid are
comparable. The decision to adopt one rather than the other depends on:
i. The long term map production methodology.
ii. The users' preference.
iii. Which one will be the best for the users in the long term.
On the assumption that the long term map production methodology,
based on the theme concept will lend itself to scale-variable reference grid,
it is believed to be the best choice. In other words a reference grid
representing fixed ground distance in the medium scale range and
a reference grid representing another fixed ground distance in the large
scale range is a better choice.

-138-
7.3.2 The Number of Reference Systems and the stype of presentation
The decision as to how many referencing systems should be printed
on a map has been discussed in section 6.4. It was concluded that there are
three coordinate systems in use in the Maritime Provinces and consequently
there should be three referencing systems on every map. The provincial
coordinate system should be represented on maps with a reference grid which
clearly illustrates the primary importance of the provincial coordinate
system. The UTM and ellipsoidal coordinate systems should be represented,
however the type of presentation should illustrate their secondary importance.
In tlova Scotia there is a 3°TM zone boundary. In order to permit
users to complete their projects in one coordinate system, two primary
reference grids should be printed on all maps close to the zone boundary.
Unless there are specific requests, the dual predominant reference grid should
only be printed on a strip of ·four map sheets on both sides of the zone
boundary.
In New Brunswick there is a UTM zone boundary. It· is felt that
the Federal practice should be followed. In other words, the subsidiary
reference grids should butt-joint on the zone boundary, i.e. no overlap.
0~ examination of the existing maps, one can observe that all line
maps are printed with a full reference grid representing tt.e predominant
plane coo~dinate system and that the grid of the subsidiary plane coordinate
system is not represented. Reference grids on the photo maps are a
mixture of partial reference grid (cross) and full reference grid. There is
also a mixture of white reference grid and black reference grid. In all
cases. the photo maps carry only one reference grid, the predominant one.
The decision to have a white or black reference grid on photo
maps was associated with two factors:
i. The production technique: map production techniques
have varied from province to province. Some techniques
lend themselves to black reference grid and some others
lend themselves to white reference grid. Within a
province the pro uction techniques have changed with
-139-
time, causing changes in the reference grid presentation.
In the majority of cases, the choice of black or white
reference grid was partly due to the ease of assembly
and the cost of producing the reference grid.
ii. The cartographic aspect: a map, at first glance, looks
like a photograph. It is generally quite dark. In order
to maintain the "photo-like" appearance of the map, it is
preferab 1 e to add enhancement vii th a co 1 or which is 1 east
contrasting. The black enhancement is then more appropriate
This is, in part, why the black reference grid has been
used.
The decision to have a full reference grid or a partial reference
grid (cross) is also related to the cartographic appearance. A partial
reference grid is more subdued than the full reference grid. This technique
serves the users who needed the refere.1ce grid and yet it does not disturb
the users who do not use the reference grid.
The arguments that led to these decisions were valid argument<:
and they still remain valid arguments. But there are nev1 considerations
being added.
i. In the questionnaire it was discovered that, in
many cases, the accuracy users expect from maps
is much greater than anticipated. Using a full
reference grid, the users can plot data more
accurately and they can read data more accurately.
ii. The plotting of many reference systems on maps
raises the problem of how to display the multi
reference system and not confuse the users.
iii. In Section 6.4 it was concluded that the provincial
plane coordinate system be represented on maps with
a predominant grid and that the other coordinate
systems used in the Maritime Provinces be represented
on maps in such a way as to minimize confusion with
the predominant reference grid.

-140-
In light of the above considerations, it is concluded that:
i. A full reference. grid representing the provincial
plane coordinate system should be printed on all
Maritime maps. On photo maps the reference grid
will meet the users' accuracy requirement and,
at the same time, it will illustrate the pre
dominance of the reference grid which corresponds
to the most-used plane coordinate system.
ii. A partial reference grid (cross as shown in
Figure 6-5-11 ) representing the l!Tr1 p 1 ane coordinate
system should be printed on all 1·1aritime maps. The
partial reference grid will avoid any confusion
between the predominant and the subsidiary reference
grid.
ii. Finally the graticule should only be shown on map
perimeter as shown in Figure 6-5-11 .
.i.. The p!tedominal't.t ~te6e!tenc.e gJtid lteplteoen:ti..ng .the
pltOvinc.i.al. ptane cooltdina.te -6 !{.6.tem be a null. lte6e~tence gJtid.
U. AU. .Ealtge and medium ual.c. map-& be pM.n.ted tcUh a -&u.b
.6idialttj lte6e~tence gJtid (!teplteoenUng .the UTM ptane
coo!tdina.te .6y.6tem). Howevelt, the .6ubJ.>icUa!ty 1Le6eltenc.e.
· gJtid dc.MU!f .6hou1.d (a) be. JLedu.c.e.d .to :the. minimum,
[b) be a pMUal. ~te6e~tenc.e gJtid.
ill. AU me.cU.um and taltge. .t.c.ale map6 be pJtinted vJUh :the
glta.ticul.e in decimal deglleel.> altau.nd :the. map pvU!ne:telt.
iv. AU .EMge -&c.de map6 be pJtil't.ted with a pltedominant
1te6e1tence gJtid (ltepiLeoen:ti..Hg .the p}(ovinc.i.al ptane
cooiLcU.na.te .6 y6.tem6) coMUpo11cU.ng .to a giLowtd di.6.tance
o 6 1 0 0 me.tMJ.> .

-141-
v. A fl. mc.d.<.wn &calc. map& be. p~ { n..ted w..Uit o:t p!tcdomina•U:
tre6e.Jte.nce. g.ud (!tepfte&enU.ng -the p.'tov.<.nua£. pf.anc
coOJtd..i.na.te. &!{&tem&} coft!!c6).1Pild.f.ng to o:t gJta(md d-W.ta~tce.
o6 I 000 me.tftc.&.
vL The I: 5 000 map& be. p)(..(_1tted wLtit a. 2 em oft 20 em
Jte.6e.Jte.ncc. gtrid depe.ncUng 011 wlte-thCJr ..U I& Jteduced 6ftom
the. me.cUwn &cale. mapo aft f!.ll.f1Utged 6,'tom the lMge. &cal.e
map6.
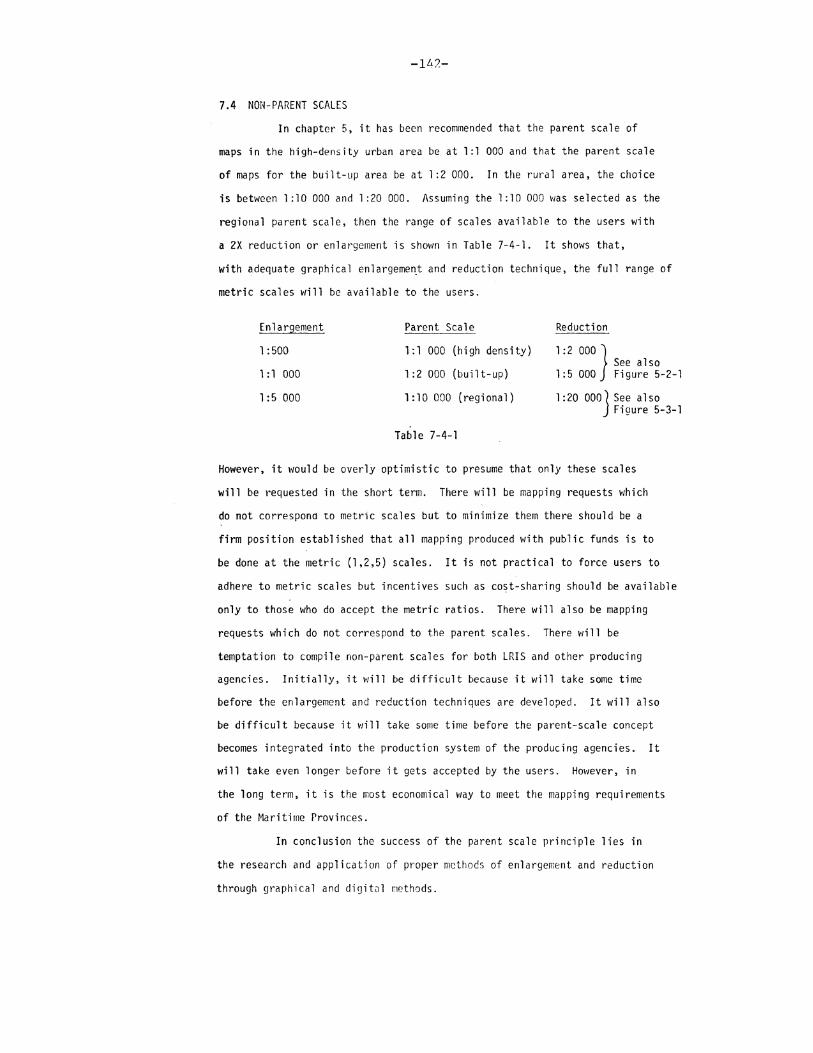
7.4 NON-PARENT SCALES
In chapter 5, it has been recommended that the parent scale of
maps in the high-density urban area be. at 1:1 000 and that the parent scale
of maps for the built-up area be at 1:2 000. In the rural area, the choice
is between 1:10 000 and 1:20 000. Assuming the 1:10 000 ~1as selected as the
regional parent scale, then the range of scales available to the users with
a 2X reduction or enlargement is shown in Table 7-4-l. It shows that,
with adequate graphical enlargemen_t and reduction technique, the full range of
metric scales will be available to the users.
Enlargement
1:500
1:1 000
1:5 000
Parent Scale
1:1 000 (high density)
1:2 000 (built-up}
1:10 000 (regional)
Table 7-4-1
Reduction
See also 1:2 000}
1:5 000 Figure 5-2-1
1:20 000} See also Figure 5-3-1
However, it would be overly optimistic to presume that only these scales
will be requested in the short term. There will be mapping requests which
do not correspono to metric scales but to minimize them there should be a
firm position established that all mapping produced with public funds is to
be done at the metric (1,2,5) scales. It is not practical to force users to
adhere to metric scales but incentives such as co~t-sharing should be available
only to those who do accept the metric ratios. There will also be mapping
requests which do not correspond to the parent scales. There will be
temptation to compile non-parent scales for both LRIS and other producing
agencies. Initially, it will be difficult because it will take some time
before the enlargement and reduction techniques are developed. It will also
be difficult because it will take some time before the parent-scale concept
becomes integrated into the production system of the producing agencies. It
will take even longer before it gets accepted by the users. However, in
the long term, it is the most economical ~laY to meet the mapping requirements
of the Maritime Provinces.
In conclusion the success of the parent scale principle lies in
the research and application of proper methods of enlargement and reduction
through graphical and digitul methods.

-143-
7. 5 REPRODUCTION t·1ETIIODS
Today most map data is scribed before it goes to the reproduction
unit. There are still producers who are inkinq. hut this practice seems to
be disappearing. In most comruter-assisted cartographic systelils, scribing
is used with flatbed plotters. Neverthcloss, the use of sensiti7ed film
in flatbed and las~r plotters is also promising. Roth the negative scribes
and negative films lend themselves to a wide range of reproduction techniques.
In the Maritime Provinces most lilap production is monochromatic
from transparent material. By using a diazo printing process. the reproduction
can be made on demand front the master transparency. This is a cheap and
effective system 1~hich avoids the problems of storing a large n:ap inventory.
In some provinces and in many countires, lit"ography is used for
most map reproduction. The disadvantage of lithographic printing is that
the unit cost is very high unless .large quantities of maps are printed in a
press run. The inventory of a 11 these printed r;1aps is a 1 so a prob 1 em. In
the ~1aritimes, there is a potential of 5 000 parent medium scale maps in
each public map series.* It is foreseeable that there will be in the long
term 10 000 parent large scale maps in many public map series. ~1ost of
these maps will not be required in large volume, consequently
lithographic printing is not likely to become feasible in the v~ritimes.
Screen printing is another alternative that yields a multi-color
product. The set-up cost is lmver than the set-up cost for lithographic
printing, hence the unit cost for small quantities of maps (300 to 500 prints)
is lm~er. Screen printing could be a feasible printing method for some
public map series where it is desired to highlight the primary theme{s).
Examples could be geology, flood risk, soil classification, etc. It is not
attractive, h01·1ever, for primary themes which are changing quite rapidly -
land use, cadastre, budworm infestation, utilities, etc. Assuming that
utilities required continuous revision in either !)raphical or digital form
in high density arcus, then the screen printing ~tould not be suitable. If
*Definition of a public rnap .cries: A map se~"ir·o rrinted, JdvPrt.ised, and sold tD thl' trchni ca 1 ar•rl genera 1 rub 1 i c.

-144-
a medium-size city, covered with 500 map sheets, decided to use the screen
printing process for utilities themes, then the number of maps to be
stored could be between 150 000 to 250 000; this is a relatively large
inventory.
The third alternative in multi-color printing is the large format
color electrostatic copiers {photocopier). Letter-size color photo copiers
are now on the market and it is reasonable to expect that larger formats
will be introduced. The multi-color master, color maps could be produced on
demand.
In the monochrome map production, microfilm is promising. Laser
technology is an excellent method for producing maps on microfilm from
digital files. As updating is carried out, new microfilm could be produced.
It would be cheap to produce and cheap to make available to regional offices
as well as other regular map subscribers. Users could then insert the
microfilm in a viewer for a "quick look"; this would not eliminate the need
for maps on paper, but it ~tould greatly reduce the number of copies required.
I\ pape.r presented at the Commonwealth Sury~y Officers' Conference in 1971,
lppendix E to stimulate thought on microfilm applications in mapping.
It is concluded that the diazo process will continue to be the
1ai n reproduction process in the Maritime Provinces until ne~/ breakthroughs
n printing.technology surface in the market place. In order to be able to
espond to users' demands ~lith the most up-to-date information, any ne~t
echnique of reproduction ·will have to be able to reproduce maps on demand.
n other words, from a master copy or a master file, it is necessary to be
Jle to reproduce maps economically without the need to carry an inventory
f printed maps.

-145-
7.6 REVISION
The goal of the LRIS program is to revise the medium scale maps
over a 10-year revision cycle and to revise the large scale maps over a
five-year revision cycle. This is a general revision cycle around v1hich a
more detailed revision program can be developed. There are other models
for map revision: maps can be revised based on the incidence of change;
maps can be revised based on a continuous revision program; maps can be
revised based on a cyclic revision program; and finally there can be any
combination of the three. Looking at continuous revision from a central
agency point of vievl, it would be extremely expensive. There is no doubt
that the Maritime Provinces will not have, for sometime, the financial
resources to implement a general continuous revision program. The choice
in revision frequency is between the incidence of change and the cyclic
revision. An essential prerequisite for an effective revision program is
.the preparation of a detailed plan. Then the plan must be rigorously
implemented. In other words, any loosely-planned revision program will fail.
The easiest way to achieve this is to adopt a revision program based on
cyclic revision. Furthermore, the only way to let users know well in
advance which maps are going to be revised and when they are going to be
revised is to have a general map revision program based on a cyclic revision.
In the Maritime Provinces, the revision techniques have never
been clearly established. The general approac~ has been to update maps
having minor changes and recompile those having major changes. In other words,
when the update cost was nearly as much or more than the recompilation cost,
then the map has been recompiled. In 1 ight of new digital technology, the
theme concept, local government pariticipation and the involvement of other
agencies in revision, r.e~ revision models are needed. The frequency,
the techniques, and the locations of map revision will be explored in mor.e-detail.

-146-
7.6.1 Medium Scale Map Revision
7.6.1.1 Map Revision Frequency
After having concluded that, basically, the Maritime map
revision program should be based on a cycle, it is now necessary to
determine the cycle length of the medium scale maps. As the medtum
scale maps are composed of three parts - the skeleton, the photo base
and the themes (Figure 7-6-1), each one must be examined separately.
(a) Skeleton
The skeleton is composed of the general surround, the
particular surround, and the referencing systems (Figure 7-6-1). None
of these three components is changing with time. Consequently, if the
skeleton for a map series is well designed, it should not be subject
to revision.
(b) Photo Base
The medium scale photo base cannot be updated unless
new photography is taken. This eliminates the possibility of continuo!
revision. In section 7.6, it is concluded that a revision program
should be based on a revision cycle rather than on the incidence of
change. In the photo base revision, there are even more reasons in
support of cyclic revision. It is impractical to have a medium scale
photo base revision program based on the incidence of change because:
i. It is very difficult in practice to set the
incidence-rf-change criteria; it is scientifically
and objectively difficult to carry out the analysis;
and finally it is time consuming.
ii. The aerial photography must be carried out in blocks
in other words, it is impractical to take photograpr
here and there. There would be a lot of film
wastage, many changes would be missed, and there
would be difficulties in setting the control for the
photogrammetric models. More specifically, in a
sparsely-populated territory, the only practical
method of control for the photogrammetric models is
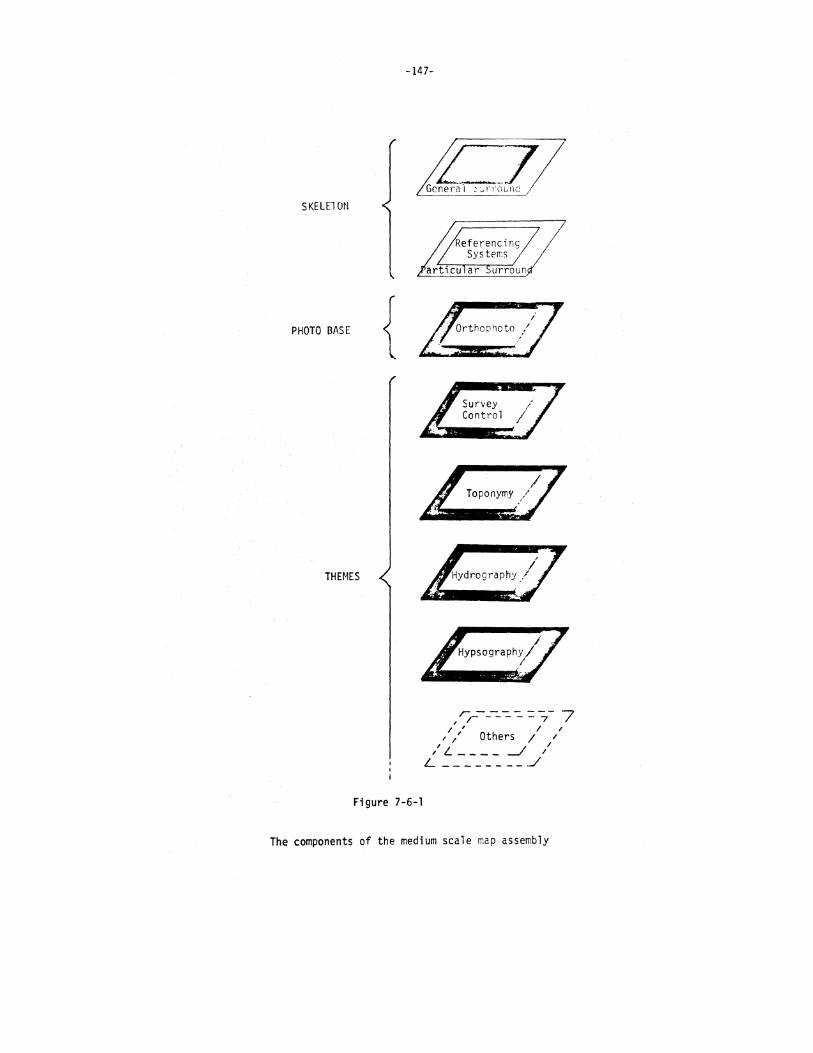
-147-
SKELE1 ON
PHOTO BASE {
THEMES
Figure 7-6-1
Survey Control
Toponymy
,',-----=--=-=;.- 7 / , / /
, / Others 1 / /L ____ _./ /
L ________ j
The components of the medium scale map assembly

-148-
by aerotriangulation. This lends itself to the
revision cycle method, but it is impractical with
the incidence-of-change method.
iii. There would be many edge tie and zone difference
problems. This can be avoided with cyclic revision
carried out in blocks.
iv. The cost of the orthophotography is only 10~ of
the total map cost.
The photo base can, in round figures, be revised on a 5, 10,
15 or 20-year revision cycle. But, first, it is important to define a
revision cycle. For example, a 10-year revision cycle implies that the
photo base would never be more than 10 years old. As it takes a minimum
of two years to produce a base map economically this indicates that the
revision should be initiated six years following the printing of a map
series with a photo base (Figure 7-6-2). Furthermore, photography for
tne photo base is difficult to obtain. This is because the photography
mu~t be of good quality. There are very few hours per year in which
there is no haze, fog, cloud, turbulence, snow, and a 40° minimum sun
elevation. Consequently photography may be delayed a year or more.
Thus it is more realistic to allow three years for the production of a
photo base. This means that, in many cases, when a photo base is seven
years old, revision should be initiated. Quickly one realizes that a
5-year revision cycle would be impossible because more than half of the
medium scale maps would be in revision at all times.
In a ten-year revision program, it is most likely that revision
will not be started when the base is seven years old, but 10 years
following the printing ~f the previous edition (Figure 7-6-3). As a
consequence, the photo base will not be a 10-year cycle, but a 14-year
cycle or, due to delays in obtaining photography, a nominal 10-year
cycle may extend to a 15-year or even 16-year. However, if in the
first place, nominal revision cycle had been 15 years, then the photo
base would have been 20 years old by the time the new photo base became
available.

"' !-
"' QJ >-
"' s... "' QJ
>-
10
9
8
7
6
5
4
3
2
0
13
12
ll
10
9
8
7
6
5
4
3
2
0
-149-
Revised map wit~ photo base printed
1 Map revising with photo base initiated /
' l j
Map with photo base printed }
Map producticn with photo base initiated
Activities
r; gure 7-6-2
Revised map ~1ith photo base printed )
Map revision with photo base initiated J
Map with photo base printed
Map production with photo base
Activities
figure 7-6-3
2 years~ I
E years
I I
2 years I i I
./
2 years
Lrue
10 years
revision cycle
Nomina 1 10
years revision cycle
2 years

-150-
In practice, a 10-year revision cycle means that photo base
revision will be initiated 10 years after the printing of the previous
series. It means that the true revision cycle of photo bases will be
between 14 and 16 years, depending on the success of the photo mission.
In light of the practice in medium scale photo base revision,
it would be unrealistic to increase the cycle length. The revision
cycle should stay at 10 years, and in the long term the LRIS goal should
be to achieve a true 10-year revision cycle, i.e. one in which the photo
base is never older than 10 years.
(c) Themes
It has been shown that the photo base should be revised on a
cyclic basis, but this is not necessarily appropriate for themes. Theme
revision will depend on whether the themes are in graphical or digital
form. Graphical themes will normally be revised when required for the
printing of a public map series. Consequently, most graphical themes
will be on the same cycle as the public map. series. However, it is not
likely to be the same with all digital themes. Some digital themes such
as the cadastral theme, and the survey control theme, will be revised
continuously. Some digital themes will be revised on a revision cycle.
Other themes will be revised on an incidence-of~change basis; hypsography
is an example. The medium scale map contour interval is 5 metres;
consequently only major hypsographic changes will have any effect on the
map. Major land slides, major land erosion, major construction are
examples. If a mechanism can be set to locate the hypsographic changes
as they occur, then there will be no need to have cyclic revision in
hypsography.

-151-
7.6.1.2 Map Revision Responsibility.
When the entire range of map themes is considered it is
apparent that for the foreseeable future some themes should be
revised by user agencies, some should be revised by regional
offices and some should continue to be revised by a specialized
central agency.
For example, as at present, the .Province of New Brunswick
should continue to revise themes such as the granular resource theme,
the Province of Nova Scotia should continue to revise its themes such
as .1ts Forest Type theme and Prince Edward Island should continue to
revise its Land Use themes. With all users adhering to the same gee
packaging it should be possible for everyone to exchange information
and to compare themes with ease.
As a network of regional offices is not yet established and
may not be established, it is only possible to cite examples of
revision done by regional offices elsewhere. The Ordnance Survey of
Great Britain ·maintains a network of regional offices for collecting
information for "continuous" revision of its large scale map series.
Regional surveyors or survey assistants check regularly with the
office that issues building permits and they tie in all new buildings
and delete all demolished buildings as soon as possible after the
change has taken place. A copy of this information is kept on file
locally and a copy is sent to the central office.
For those themes which are revised with complex photogrammetric
instruments there is no doubt whatever that production should be
concentrated in one centralized office to maintain a consistant
standard of quality at a reasonable cost. However, themes, like
property mapping themes, which do not require complex photogrammetric
instruments could be decentralized in regional offi~es:
7.6.1.3 Map Revision Techniques
In the short term, the photo base is essential in all medium scale
public map series. This is because there will not be enough themes to produce
self-sufficient line maps. Hot1ever, in the long term, the pnoto base will
become optional. This is because, as many themes become available, the
composite of a selected group of themes will give birth to a line map. Some

-152-
of the themes will be in graphical form and others will be in digital. It is
possible that some themes may never be required in digital form. Nevertheless
the digital themes will become increasingly popular. This does not mean
that a graphical expression of the digital theme will not be required. The
digital themes that are likely to be produced first are:
i. Those required for on-line operational purooses.
ii. Those which recur most frequently with other themes.
iii. Those that are already existing in alphanumeric form.
There may be an impetus to co~pile other themes not belonging to
these three categories, but it is difficult to predict which these will be.
For example, let us consider the hypsography theme. At first glance, one is
tempted to say that hypsography is a static theme. Contours do not change,
especially at the medium scale ~!here the contour intervals are five metres.
There is little benefit in transforming the graphical scribed theme into
a digital theme. Yet, the hypsography may be a dynamic theme and have a
very important function in a data base. This is because much of the analysis
required from a data base may be a function of the hypsographic data. As
an example, one can think of soil classification where the class is a function
of the terrain slope. Without hypso~raphy, this aspect of the soil classification
cannot be carried out. It may happen for example that, in the use of the
forest management series, slope will become an important analytical factor.
At this time it is not possible to say whether or not hypsographic data
should be digital and this is one ~f the many cartographic questions that will
need to be reviewed from time to time.
In such a flufd situati.on vis-a-vis nraohic and digital themes, it is
difficult to foresee how each theme will be revised. The revision technique
that may evolve in the di9ital mode may be substantially different from the
revision in the qraphical mode. Furthermore, each agency may have a different
technique for revising its own the!T'es. This May be due to theme characteristics,
organization structure, equipment available and expertise at hand. The important
thing is the final result; i.e. a revised file which meets a set standard. But
to arrive at this goal, much effort is needed in developing revision models and
revision techniques.

-153-
7.6.2 Large Scale Mao Revision
7.6.2.1 Map Pevision Frequency
In the urban area, the 5-year cycle is about the shortest cycle 11hich
can be expected from a centralized ohotonramnetric mar revision rronram. However,
with some local government collabora.tion, the lenC'th of the cycle could be
reduced. Furthermore continuous revision is feasible. It is also a lonC'-ter!'1
~oal, but it can only be ill'plernented throu9h healthy collaboration l'lith the
local r!Qvernments. In other 1·1ords, it co,Jld be iT"plemented ~tith local ~overn
ments carryinn out some data collection. In such a mao revision aooroach, users
needs can be optir1ised. However, it is clear that the LRIS urban ~ap revision
should be based on a 5-year revision cycle unless there is both a need from the
private industry and local (JOvernT"ents to ir10rove the revision and a \'Jillin(Jness
on their behalf to collaborate in the revision . .Accordion to the "infrastructure
studv" these two conditions seeM to be fulfilled.
7.6.2.2 Map Revision Location
Even thounh the 5-vear revision cvcle is supported for a centralized
photoorammetric revision proqra!T', this does not irr'nlv that a central acency
should be doin~ all the revision. It only means that, in the absence of a
decentralized map revision proorar., the 5-vear cvcle is about the best that can
be achieved.
Decentralization is necessary in order to improve the revision frequency.
It will brinn the decision process closer to the users and consenuently it will
make it more sensitive to their needs. Decentralization will also brinn t~e
revision problem closer to the users and consequently it will be easier to arrive
at a balance between need, cost, and up-to-dateness. The first steo in decent
ralization would be the creation of regional mao revision offices. The second
step would be to have the municipalities doing their own revision. In the long
term, it is important that local novernments (Jet invo~ved in some revision
particioation; otherwise t:w problell's, the investment in revision, and the
service offered will never net appreciated. Plannin() rnust be rnade in sue~. a way
that participation from local ')O\•crnments 1-dll be ·ir,;;.ro:e.:.

-154-
Looking at the urban scene, one realizes that, of the 256 cities, towns,
and villages in the Maritime Provinces, there are only a dozen which are
sufficiently large to handle their own map revision. Furthermore, many towns are
not large enough to have a full-time mapping office to do their o~m map revision.
In both cases, a flexible participation formula is desirable. ~lith such an
approach local governments could get involved in the revision of their maps at
their own pace.
In the Maritimes, as elsewhere, one must realize that the large scale
map revision is a heavy task - and one that is never finished. This is because
the number of large scale maps will increase as the population increases and as
users become more aware of the value of up-to-date large scale maps. In a
centralized map revision office, there will always be conf1 ict between new map
requirements and map revision. There is always pressure to give new map production
precedence over revision. T.S. Keates, in his book "Cartographic Design and
Production" says: "The proper maintenance of a map series is almost certainly a
better assessment of the true quality of a mapping organization than the original
production."
In order to achieve the immediate goal of a 5-year map revision program
and a long-term goal of continuous revision, it is necessary to initiate the
decentralization process. The first level of decentralization is the creation of
regional map revision offices. This is a mechanism which is most likely to
ensure that the 5-year revision cycle will be implemented. It is the mechanism
which will permit the introduction of map revision flexibility, consultation,
training, and planning assistance so that local governments can implement r .. dp
revision at their own place. In doing so, progress toward the long-term goal
will be made.
Decentralization is necessary in order to improve the revision frequency.
However, its implementation hinges on the development of simple map revision
techniques which could be used at regional and municipal levels. In other words
the present photogrammetric process is too complex to be decentralized.

-155-
7.6.2.3 Map Revision Technique
The long-term map revision technique is the most difficult to assess.
It will change with time in a world of changing technology, changing needs and
changing organization structures. r~aps may be revised with sophisticated
analytical plotters; they may be updated with simple instruments, such as
the zoom transfer scope, using plans and photographs; they may be revised from
field surveys; or they may be revised with a whole range of more or less
complicated revision instruments.
In the long-term, map revision will slowly pass from graphical to
digital, but it is difficult to predict how fast digital technology can be
implemented at the Maritime, regional and local level. It will be necessary
to follow the development elsewhere, but also it will be necessary to initiate
some Maritime digital development if there is a desire to apply the concept
formulated in this report. Figure 7-6-4 shows the graphical approach to data
and map revision; it shows the semi-digital approach which is a mixture of
graphical and digital techniques; and it shows the fully digital approach to
revision. For each approach it shows the task, the tool, and the product in
the data collection, data processing, printing of data and data distribution.
At the present time with the graphical approach to map revision,
data collection, processing, and Jistr1oution could be done by either the
central or regional offices if simple or non-photogrametric approach ~1as
developed. However, it would be unrealistic to print the transparancies for
the public map series at the regional offices.
Looking ahead at revision, it is most likely that:
i. Digital revision will be implemented over a period of time.
ii. The first comput~r-assisted revision method will be in semi
digital form.
iii. It will be introduced at the central office first.
Shou'id this pattern prevail then initially only the data collection and data
distribution would be done in the regional offices. The data processing and
printinq would be done at the central office.
At a later date the semi-digital method could be introduced at the
regional offices and the local government offices. Then the data collection,
data processing, and data distribution could be done at the

-----~~
TASK Data Collection
-----
Data Processing
j Printing of i1<1 ta
~
Data Distribution
I
GPJHHCAL S81I -DIGITPL DIGITAL ! TOOLS rmmns TOOLS rmmns TOOLS PRODUCTS
Aerial photographs Manuscripts with Aerial photographs ~1anuscrip1:s with Aerial photographs Analytical stereo-plotter additions and Analytical stereo- additions and Analytical stereo-with plotting table deletions plotter with plotting deletions plotter
Data set Analogue plotter with table Analogue plotter plotting table Analogue plotter with with encoders Stereo transfer devices plotting table
Stereo transfer devices Field surveys Field surveys Field surveys
I plans plans digital tape field notes field notes and data ------~----- --------1
Scribing Equipment Revised theme Digitizer Revised theme Digital plotter Revised theme scribe coats Digital plotter files accessible or files acces-
through inter- Graphic terminal sible or active graphic (for edit) through Graphical tenninal (for edit) tenni nill interactive
Computer facilities graphic I
Computer facilities terminal
Vacuum frame Transparancies Flat bed plotter Geo~digital files Flat bed plotter Geo~digital !
of public map or Transparancies of or files Film processor series Laser plotter and public map series Laser plotter and
camera Camera Transparancies of public map
Film processor Film processor series ~
Diazo printer Diazo paper Graphic terminals Elecfrosfqft! paper Graphic terminals Electrost-atic 1 copies Diazo printers copies Diazo printers paper copies 1
Dim P'P" copie; 0 J I
1azo paper copies
'----------~- ---~-~----
Figure 7-6~4 Tools and products related to data collection, data processing, printing of data and data distribution in revision based on, graphical, semi~digital and digital approaches.

-157-
regional and municipal offices. Transparancies and microfilm for public
map series would still be printed at the central office. The implementation
·of semi-digital approach at regional offices and municipal government offices
will make it possible to locally maintain data up-to-date. It will oermit one
to access the data anytime through a graphic terminal. Howeve~
the semi-digital and digital approach can only be implemented some time in
the future. Yet there is a map revision need which cannot ~tait for the semi-digital
and digital approach. Consequently a graphical map revision program must get
underway as soon as possible.
At the present time it takes two years to revise a map. In other
words there is approximately a two year time lapse from the day the revision
of a map is initiated to the day it is available for distribution. Hith the
present map revision technique and a five year revision cycle two-fifths of
all large scale maps are on the revision books at all times. This is
excessive. Internally the two year lapse time for a map to be revised creates
the situation where the revision monitoring is difficult. Externally maps are
two years out of date when they are published. there is a great need to
develop a map revision methodology which will improve this time lapse. The
objective should be to design a revision methodology that 'will permit the
revision of a map in less than six months. This revision method should be
applicable to both centralized and regionalized map revision programs.
In light of considerations in map revision frequency, responsibility
and technique, in medium and large scale mapping Lt ~ ~ecommended ~hat:
L The mecUwn &c.ale pho~o ba.6e be JLev~ed on a nom.tnal
10-yeM 1r.e.v~.ton cycle w.uh a long-~~ goal o6 a btu.e.
10-ye.M JLev~.<.on c.ycle •
.U. In the -61-w.lt.t .tvun, ~he mecUum &cale may be the compMde
o6 :the photo bo.J.>e and vM.i.oU-6 otheJI. th~. ·
- :the ba.6-i.C. map &eJI..tu be tlte c.ompa&de on ~he map
&h.deton, the photo ba.6e, and the fuee 6oUowing themu;
&Wt.vey mMkeM, toponymy, hydJwgJtap'tiJ.
- :the hyp&agl:.aphy map &WM be the c.ompa&de o6 tlte map
&kdeton, the photo ba.6e., and :the. 6oWt. 6oUowing theme&:
IIWt.vey mMkeM, toponymy, h~~ogMphy and hypMgMphy.

-158-
-.the. p!r.Ope/l.ty map ~e.M.u by .the eompo~.Ue o S .the. t.ke£.e..ton
.the. photo bM e and .tlte 6ouJL 6oUow.i.ng .theme.&: l>r.v'tve.y
mCVt.f1.ell4, .toponymy, hycvwgJt.a.phy and ptr.opmty bou.nda:,uu.
LU. M .the .ttr.a111.>potr..tc:t.Uon cwd bu.Uc:Ung .theme& become ava..Uabe.e
.the ba~.<.e map& l.!vUU cU: med.<.u.m ~c.a.e.e be ptr.odu.c.cd tt•.Uh a.nd
wUiwu .. t .the photo bMe .
.<.v. In .the tong .tetr.m, .the tr.ev~ion o6 tile med.<.u.m l.lc.c...Le map
~e.M.u p1wdu.c.ed by LRIS tr.ema.in c.enL'La.Uzed.
v. The £.a...'tge 1.>eate map tr.evi~.>ion c.yde c.on..t.£11u.e .to be a 6.{.ve
yeCVL one.
vL LRIS .ta.lze a.e.e .the oppotr..tu.nliiu .to e•tc.ouJLage and &.t.imu..ea...te
~ell4 and mu.nidpa.l gove.Jtnmen..tl. .to c.oUabotr.a:,te .<.n the
!a.tr.ge ~c.a.e.e map tr.ev~-i.on .to -i.mplr.Dve the tr.ev~-ion c.yde.
v..U... In otr.de.Jt to adu.eve. the objective (v-il above, l>e.-uou.&
c.on6.<.de.Jta:,tion be given to the eJLec:t.Uon o6 ·'tegiona.l map
tr.e.v~ion o66ic.u.
vLU. A gtr.a.phic.a.l ma.p tr.ev~ion ptr.oc.e.duJLe be devetoped M
&oon M poMibie to me.e..t the -i.mmecUa..te tr.ev~-ion need.
-i.x. Long tetr.m ma.p tr.ev~.<.on modetl> be devetoped .ta.f1.-i.ng in.to
a.c.c.ou.nt .the digLta.e .tec.!tnoiogy, .the .theme c.onc.ep.t, and
.the tr.e.g-i.ona.e. a.nd ioc.a.e govetr.nmen.tl.l pa.tr..t-ic.-ipa:,t.[on in
map tr.ev~ion.
x. An invu.tiga.Uon be iM.tia.ted M .6oon M po-6.6-i.bte w.Uh
.the objective o6 tr.edueing the :time 6011. gtr.a.ph.i.ea.l map
l£e.v.i6.i.on a.t .lCVt.ge. .~>c.ai.e. :to .tu..~> .than 6.ix mon.tlu..

-159-
7.7 MAP SERIES IDENTIFIE~
In chapter 6, the map and geo-package numbering system is discussed
and a numbering system is proposed. However, the proposed map and gee
package numbers do not identify the type of maps. Consequently, it appears
that an additional identifier would be practical. This would be a code to identify
either the main theme of a map or a specific public map series.
In New Brunswick and Prince Edward Island the various types of
maps have been identified by name, i.e. property map series, planimetric
map series, etc. In Nova Scotia, the various types have been assigned a
series identified. They are:
Series "a" Forest types scale 1" = 1/4, 1/2 and 1 mile.
Series "b" Forest types special projects on Crown Lands.
Series "c" Original Land Grants and Crown scale 1" = 1/4 mile.
Series "d" Planimetric Base with Crown Lands map scale t•=t/.ljrnil«.
The general principle of the series identifier in Nova Scotia is good.
However, in order to differenti.ate the metric from the imperial series, upper
case letters should be used.
Before any series identifier can be implemented fruther consultation
with the Nova Scotia Department of Lands and Forests is necessary to ensure
that no conflicts will arise in assigning series identifiers. Since new series
would be added periodically, as new public map series are introduced. it
appears that some criteria should be developed for assigning series identifiers.
The first criteria should be that any new series identifier should be mutually
acceptable by the three provinces.
Together with series identifiers, series names should be continued.
It is suggested that the series name reflect the main theme of the map series.
Series Identifier Series A Series B Series c Series D
Series E Series F Series G
etc.
Serial Name (Main Theme) Basic map series. Forest type series. Original grant series (if continued) Property map series (including publicly owned
land) Hypsographic series Agriculture series Geology series
Table 7-7-1

-16Q-
The main observation from the above Table is that the topographical
map series, the resource map series and the planimetric map series are not
shown. The term "topographical maps" has been so much misused that the only
way to correct the situation is to drop the use of it. For some people a
topographical map is a NTS map; for others the planimetric map is a
topographic map; finally other people are asking for planimetric maps or
topographical maps with contour. The present planimetric map and topographic
map series do not clearly characterize these two series; consequently
these map series names should be dropped and renamed more appropriately. It
is suggested that all map scales (medium and large) showing height information
as the main theme, in land, be called "Hypsographic series".
The resource maps series without hypsographic information and
planimetric maps series have some similarities. They fulfill the same need
and they contain the same basic information over which· themes can be printed.
Consequently they should have a common name. However they have differences,
planimetric mctv::. ::.eries impiies 11ne maps. Consequently the two series
cannot have planimetric map series as a conm10n name. Resource map series
implies medium scale maps l'lhich can be photo map or line map. r:onsequently
resource map series cannot be used as the common name for large and medium
scale map series. Due to the lack of a better name it is suggested that
"basic map series" be used as the common name to replace the resource map
series and the planimetric map series. The basic map series could take two
forms. It could be the basic line map series and the basic photo map series.
It ~ necommended that LRIS and othen map pnoducen6 con6~den
M.O~gJ'Ihtg both a .oi!Jt..i.ctt idenUMen and a .oi!Jt..i.ctt name to eveny pub.Uc map
.o~e.o.

-161-
7.8 CARTOGRAPHIC EVALUATION AND DESIGN OFFICER
Chapter 7 reviews the specificationsthat should be subject to
periodic review and modi fica t ions. In the next fe1~ years, there is a
tremendous amount of cartographic design needed in the f.laritimes' speci
fications. The initial thrust will be in the development of specifications
for the metric map series. However the design and evaluation should not
stop 1~ith metric conversion. This is because the needs will be ever
changing. In order for LRIS to keep up with the changing needs and changing
technology U .U. Jtec.ommc.Hde.d tluu LRIS appoint a c.aJLtogJtaphi.c. eva.tuat.i.on
and dM.i.gn o6MceJt.

-162-
8 SlJIMARY OF RECCM'\ENDATIONS
FJWm uc..Uon 3. 5
1.t .U. Jte.comme.nde.d that a Ce.nt:Jte. be. c.Jte.ate.d w-<.th
the. t:Mk o6 de.velop.<.ng and te..~ting the c.onc.ep.U
60Jt a 6u.U:y inte.gJtated po~Won inf)otunat.i.on -!>IJM.em.
1t .U. expected that th.U Cent:Jte wouid be .f.oc.ate.d
c..f.Me to oJt at a Un.<.ve.M-I.ty whe.Jte a rtUc..f.e.u..6 o 6
e.xpe!LtWe. in hand.Ung po~.<.Uon .i.n6otunat.[on a.f.Jte.ady
e.w.u.
FJtom ~e.c..Uon 4.4
It .U. Jte.comme.nded that a ~em.i.nM oJt woJtk~hop be
oJtgan.<.:z:ed M a 6oUow-up to the quutiomm.<Ae.. The
objective wou.f.d be to de.ve.f.op a comeMM and
quaV..ty r~ca.f.e, content, accuJtacy) o6 Jteg.<.ona.f.
mapping needed 6oft the MMWmu.
FJWm ~e.ct.<.on 5. 5
i. FoJt high dem-I.ty uJtban M.eM .<.t .U. Jtecommended that
the. bMic map data be. comp.[.f.e.d at a qua.f..<.ty .f.e.ve.f.
e.qu.<.vate.nt to that o 6 1 : 1 0 0 0 ~ ca.f.e map~ •
U. FoJt tow den-6Uy ~M, wbtVtb-!>, towm, v.[.f.!ag M and
uJtban.<.:z: e.d JtuJta.f. communWu -<.t .U. Jte.comme.nde.d that
the. bMic map data. be comp.[.f.ed at a quoJ'..-Uy .f.eve.f.
e.qu.<.vate.nt :to that o 6 1 : 'l 0 0 0 .6 c.a.f.e map.6 • F uJt:the.Jt,
M an e.Me.ntia.e. ~tep in the. p!ann.<.ng and budge.:tting
60Jt th.U ~ eM.u, -I.t .U. Jte.comme.nded that an index
(.&ee Appendix. V) ~hawing .the. bounda.Jt.<.M o6 ~u.
towm and v.[.f.!agu be. compiled.
ill. FoJt both o6 .the above ~eM.u U .U. Jtecomme.nde.d that
the "LRIS ~ta.ndMd" not inc..f.ude "6~ comp.f.e.tion"
data. 1.t .U. 6uJt:the.Jt Jtecomme.nde.d .that a p!togJtam be.
intJtoduce.d whe.Jteby !oc.a.f. gove.Jtnmena have an oppoJt.tunUy

-163-
t:o pJr.ov.i.de Mei.d c.omp!et:.Wn da.ta. a.nd in Jt.WUtn
Jtec.elve a. ma.p t:ha.:t L6 ":to.Le.oJted" t:o thel.l!.
pa;r;Uc.u!a.Jt. need6 •
iv. PJtojec;t mapping: 16 theJt.e L6 a. .Uke!lhood tha.t the.
data. c.ompl!ed duning pJt.oject ma.pplng witt be o6
va..fue ln the LRIS da.ta. bcue then a. c.o-opelr.a.tlve c-'t
joint ventu!te w.Uh the p.l!.oject a.genc.y .U. ltec.ommende.d.
16 U L6 a.n.Uupa.ted tha.t the da.ta. will be o6
neg.Ugible va.!ue to the LRTS data. bcue U 6a..U.6
ou:t&.Ue the te/Uilh o6 Jt.e6e~tence o6 th.u. -6tu.dy.
v. FO.IL. a.g.l!.lc.u!tu.ILa.! a.Jt.ecu: At. the Jt.equl.l!.ement-6 vMy
depending on .the type o6 a.g.l!.lcu!tulte U L6 M.gge-6ted
tha.t a.g.l!.lc.u!tu.ILa.! Jt.equl.l!.ement-6 be lnc.!uded in a.
pltopOl>ed RuouJt.c.e Mapping WOJLI<-6hop (See vl bel.ow)
v-<.. Regiona.! ltequl.l!.ement-6: The!te .U. a. deMnlie need 6o'!.
a medium -6ca.!e map (a.nd map da.ta bcue) c.ove.Jt.lng the
whole o6 the M~u. It L6 Jt.ec.ommended tha.t a
RuouJt.c.e Ma.pplng WOJLI<-6hop be held benoJLe a. M.-'tm
ltec.ommenda.tlon cu to -6ca.!e (qua.Uty level.) and content
be made.
vU. Reglona.! Jt.equl.l!.ement-6 a.t medlum/-6ma.U -6ca.!e: The
1:50 000 NTS ma.p -6e.Jt.lu meet th.u. Jt.equl.l!.ement veJt.y
weU. The dulgn o6 the Jt.eg-iona.! Ca.-'ttogJt.a.pitlc.
ln6ol!.ma.tlon .6y-&tem -&hou!d pltov.i.de 60.1!. the 6low o6
ce.l!.ta.ln .theme data. 6Mm the med..i.um a.nd !a.-'tge -&ca.!e
data. bcue to the NTS da.ta. bcue.
vili. Compli.a-Uon o6 a. diglia! c.MtogJt.a.pitlc da.ta. bcue: On
the M-&umpwn tha.t in the long teltm (20 to 30 yeM-6),
.the da.ta. bcue 60.1!. a.U map pJt.oduc..t-6 witt be in
di.gita.! 6ol!.m, U L6 Jt.ec.ommended tha.:t a. theme-by-theme
(F.iguJLe 3-1'-1) appltOa.c.h to dlg.iUza.tlon be 6oUowed.
It L6 6Ul!.theJL ltec.ommended tha.t a.n in-depth a.na.!y6L6
o6 the 6aml!y o6 mapping themu be ma.de ln oJt.deJL to
uta.b!iAh the uquenc.e in which the themu .6hou!d be
dig.iUzed.

-164-
f1t0m uc.Uon 6. 2
I~ ~ 4ec.ommended ~hat:
.i... The map p!tojec;ti..on plane be c.ott6~t:eM wah t:he
p4edom.i..naM !te6Me.nc.e. glt.i..d.
U. The plane6 on t:he. p4ov.i..nc.-Ute. plane. c.oo~I'Ul-te .6!f.6.te.m~
be adop~ed a.6 t:he. map p!tojec;Uon piane.-6 w~h[n the
M~e P4ov.i..nc.e.6.
F1t0m .6ec.Uon 6. 4
I.t ~ 4ec.ommende.d that:
.i... The 4e6Menc.e gJud lte.p4e..6e.nt.i..ng ~he p!tov-i.nc.-Ute. plane.
c.oo~nat:e .61}.6tem be. the. p!tedam.i..na.r..t gtid and that: ~
be. .6hown by heavy Une.6.
U. The. Un.i..velt.6at TMn6velt.6e. MeJtc.a.t:o4 plane. c.ooJtd.i..na.te.
.6!:f.6.tem and the. el.Up.60.i..dat c.oo1td.i..na.te. .6!f.6te.m be.
.6ub.6.i..d.i..a.lty 4e.6Me.nc..i..ng .6y.6te.m.6 •
.i..U. The. .6Ub.6.i..d.i..My !te.6e/c.e.nc..i..ng .6lj.6te.m.6 be. .6hown .i..n a. IAXltJ
~hat: m.i..n.i..m.i..:l:e.-6 c.on6U.6.i..on wah the p!te.dom.i..na.M
4e.6eJte.nc.e. glt.i..d.
f4om .6e.c.t.i..on 6.5
It ~ lte.c.omme.nded that the. dec:..i..ma..e de.glte.e. be adopted 6o4
geo-pac.kag.i..ng -i.n the M~e. P4ov-i.nc.C6.
F1t0m .6e.c.Uon 7. 1
U ~ 4ec.ommended tf1a.t a 6-i.lt.6t .i..telta.t:.i..on at: de.Mn.i..ng
thl!. 6am.i...e.y o6 the.me.-6 and .i..d!!.nU6y.i..ng thl!. e.l.eml!.nt-6 o6
eac.h bl!. c.llltlt.i..l!.d out a.6 .60o n a.6 po.6.6.i..bie.
fltDm .6e.c.Uon 7. 2
It ~ 41!.c.omme.nde.d that a c.omp4ehe.l1.6.ive Ht o6
.6pl!.c..f..6.i_c.a.t:.f..ol1.6 6M .6ymbo£..6 be. d!!.Vel.Op!!.d W.i..th the. .f.ea.6t
po.6.6.i..bie. iabel.Ung. T~ .6et o6 .6pe.c.-i.6.ic.a.t.iol1.6 6o!t
symbol6 ~ to become. 1he. ba.6e. 6Mm wluc.h the. .6ymbo.t.ogy
6M c.omputeJr.-a.6.6-i..6ted mapp.i..ng w.i..U be. de.vetoped.

-165-
wm -6 e.c.U.cm 7 • 3
J;t -iA Jr.e.c.omme.nde.d ;tha.t :
L The. p!te.dot7U.nant Jte6e.Jtence gtud Jte.p!te.&enu.ng the
p!tov-inua..t ptane_ c.ooJ-uiina:te .oy.otem be a Suli Jr.ene-"cence
g!t-id.
u. AU tMge and med-<-wn 1.>c.a..te map!.> be p!t-inted ,,·ah a ~tLb
.o-id-<-My tteSer.ence. gud {!tep!te.~.>enting the UHf plane
c.oo!td-<-na.te ~.>y.otem) . Hotl·eve.Jt, -the .oub~.>-id-<-My Jr.ene.tenc.e
g!t-id den&ay .ohoutd (a) be Jteduced to -t1Ie. m-inmum,
(b) be a pM-t{a.f'_ Jtene.Jtenc.e. g!t-id.
@. AU med-ium and tMge -~ca..te map,o be p!t-inted v•ah .the
gJta.-ti.cute. -in de.wa..t deg-tee.~.> Mot.nd .the map pe.w11e.te.Jt.
-<_v. AU lMge ua..te map.~ be p.unted wah a p!te.dom-inant
Jtene.Jtenc.e g!t-id (tr.e.p!te.~ ent-ing .the p!tov-inua.f'_ plane
c.oOJr.d-<-na.te .oy.o.tenv..) cc-'L!te.~pond-<-ng to a g-'Lound d{,~.tance
o 6 1 0 0 me.tJte.~ .
v. AU med-<-wn .oca.f'_e map-~ be p!t-inte.d wah a p-tedot7U.nant
Jte6e.tr.ence g-ud (tr.e.p!te.~e•t-ting the p!tov-tnua.f'_ plane
c.ooJtd-<-na.te .oy,otenv..) coJv'Le.!.>pond-<-ng to a gJtound fu.tance
o6 1 000 me.tJte.~.>.
vL The. 1:5 000 map-6 be p!t-inte.d wah a 2 c.m OIL 20 c.m
Jr.e6e.tr.ence. g!t-id depend-ing on whe.the.Jt a _u, Jte.duced 6Jr.om
the. med-<-wn ~.>ca.f'_e map.& o!t enlMged 6JtOm the tMge ~.>cafe
map.o.

-166-
F~om ~e.ction 7.6 1.t )A ~e.c.omme.nded :tha;t :
L The. med<.wn 1.>c.al.e photo blUe be. Jte.v-0~e.d on a·nom-i.nal.
1 0-ye.M ~e.v-i.A-i.on c yce.e. •t:.i.tft a {ong-tVtm goa{ o6 a ;(:,'tue.
10-yeM ~e.v~-i.on c.yc.le.
U. In the. !.>ho!tt te.Jtm, the me.d-i.um 1.>c.al.e may be. the c.ompo~.>Ue.
o 6 _the. photo ba;., e a.nd vM-i.oUI.> o.thVt theme~.>.
- :the. ba.~.>-i.c. ma.p 1.> e.Jt-i.u be. tlte. c.omp01.>Ue o 6 fhe. ma.p
~.>kel.e.ton, the. photo ba;.,e., a.nd the. tlv!.e.e. 6oUow-i.ng thvne,~;
I.>Wr.ve.y mMfze!tl.>, toponymy, hyd!tog!tap'ty.
- :the. hypMg!ta.phy ma.p 1.> e./t-i.e,~ be. the c.ompMUe. o 6 tlte. ma.p
~.>kel.e.ton, .the. photo ba;.,e., a.nd .t~;e. 6ouJt 6oUow-i.ng thvnu :,
l.>uJtve.y mMfze!tl.>, toponymy, hyd!tog~taphy a.nd ltyp!.>Cg!ta.phy.
-.the. p~opeJt:ty ma.p l.>e.Jt-i.U by the c.ompo~.>Ue o6 the. 1.>_/ce.le.ton
":the photo bMe a.nd the. 6ouJt 6oUow-i.ng .tltemu: ~.>uJtve.y
mMke.Jt6, .toponymy, hyd!tog~taphy and p~ope-'L.ty boun~'L-i.u.
ili. AI.> .the. .t!taMpoJt.tct.Uon a.nd bu-i.ld-i.ng .the.me.1.> be.c.ome. a.va.-i.la.b.Le.
the. ba;.,-i.c. ma.pl.> 1.> e.Jt-i.u a;t me.d-i.um 1.> c.a{e. be. p!toduc.e.d wUh a.11d
wUhou.t .the pho.to ba;.,e.
-i.v. In .the tong .te.Jtm, .the. ~ev~-i.on o6 .the me.d-i.um 1.>c.al.e. ma.p
~.>e.Jt-i.u pltoduc.ed by LRIS Jtema.-i.n c.en.t.Jr.a..U.zed.
v. The. .f.Mge. 1.>c.al.e. ma.p ~ev~-i.on c.yce.e c.ont-i.nue .to be. a Q-i.ve.
ye.M. one..
vL LRIS .ta.lce. a..U .the. oppoJt.twU..ti.eA .to enc.ouJta.ge. a.nd ~.>.t-i.mula;te
Ul.> e,Jt6 and mun-i.upal. govVtnme.1;;:-6 cto c.o-Ua.boJta..te -i.n .the
.f.Mge. -6c.a.le ma.p Jtev-i.-6-i.on to .(J p!tove. .the Jtev~-i.on c.yc.l.e.
vU. In oJtdVt to a.c.h-i.eve. .the objective (v-i.) a.bove, ~.>e.Jt-i.oUI.>
c.oM-i.dVtation be g-i.vm to the. c.Jtect.Uon o6 Jteg-i.onal. ma.p
vili. A g 'l.a.ph-i.m ma.p Jte.v~-i.on pJtoc.e.dWr.e. be. de.vel.ope.d a.1.>
.~ :·o·: a;., po-61.>-i.b.f.e. to me.e.t the. -i.mme.d-i.a.te Jte.v~-i.on ne.e.d.

-167-
.<.~. Lo~g teAm m«p ~ev~io~ mod~ be developed ta~~g i~o
«ccou~ the c:Ug.ua.£. tech~o!ogy, the theme concept, «nd
the ~egio~al and local gove~nment4 p~cipation in
map Jtev~ion.
~. An invut.i.gation be in..i ... ti.a.:ted M Mon a.6 po.Mibie with
the objective o6 ~educing the t.i.me 6o~ g~plucal map
Jtev.U.ion a.:t .f.Mge .6ca.l.e to !U-6 than .6ix montll-6.
F JtOm .6ect.i.o n 7 • 7
.i. I:.t ~ Jtec.ommended tha.:t LRIS and o:.theJt map p-toduceM
con-6-ideJt. M6.ignbtg both a 6el!.ial Uent.i.6.(,eJt and a.
.&eJtia! name to eveJt.y public map l>el!.iu.
FJt.Om &ct.i.on 7. 8
L I:.t ~ Jtecommended :tha.:t LRIS a.ppo.i~ a. CJVLtog~phic.
evaluation a.nd duign o66ic.eJt.


![African Methodist Episcopal Church--Missionary Enterprise Among the Coloured People of the Maritime Provinces of Canada [Microform] (1899)](https://static.documents.pub/doc/80x56/577ce47e1a28abf1038e7902/african-methodist-episcopal-church-missionary-enterprise-among-the-coloured.jpg)


