37
Environmental Sampling Health, Safety & Environmental Processes November 2014 Guided Practicum Prepared for University of Fredericton by James Landry.
| Date post: | 07-Aug-2015 |
| Category: |
Documents |
| Upload: | james-landry |
| View: | 35 times |
| Download: | 3 times |

EnvironmentalSampling
Health, Safety & Environmental Processes
November 2014Guided Practicum
Prepared for University of Fredericton
by James Landry.


Sampling is an attempt to choose and extract a representative portion of a
physical system from its surrounding and sampling itself is an important issue
that has less status than analytical methods. Samples are taken for a number
of reason, monitoring, regulatory activities, quality control, scientific study or
just curiosity. The objective is to take representatives samples so that
decisions can be made concerning the entire system. But it can be
complicated .
The complexity of the matrix ( water, air, solids, sludges and liquid wastes)
interferences during the transportation and storage before analysis and
instability of the analytes. Sampling is often considered to be the weakest
part of the planning. This sampling guide will be useful to anyone interested
in environmental sampling to obtain reliable environmental samples .
In the coming years, there will be a need in field of environmental technology
for technical personnel at all levels of education and training. The protection
of public health and environmental quality will be the top priorities for most
citizens.

iv
Table of Contents
Sampling . . . . . . . . . . . . . . . . . . . . . . . . . . . . . . . . . . . . . . . . . . . . . . . . . . 1
Taking water samples. . . . . . . . . . . . . . . . . . . . . . . . . . . . . . . . . . . . . . . . 1
Grab Sampling . . . . . . . . . . . . . . . . . . . . . . . . . . . . . . . . . . . . . . . . . . . . . 2
Composite sampling . . . . . . . . . . . . . . . . . . . . . . . . . . . . . . . . . . . . . . . . . 3
Storage and Preservation . . . . . . . . . . . . . . . . . . . . . . . . . . . . . . . . . . . . . 3
Groundwater . . . . . . . . . . . . . . . . . . . . . . . . . . . . . . . . . . . . . . . . . . . . . . 5
Wells . . . . . . . . . . . . . . . . . . . . . . . . . . . . . . . . . . . . . . . . . . . . . . . . . . . . 6
Communicable and non-communicable diseases . . . . . . . . . . . . . . . . . 10
Coliforms Bacteria . . . . . . . . . . . . . . . . . . . . . . . . . . . . . . . . . . . . . . . . . 12
What is E Coli, . . . . . . . . . . . . . . . . . . . . . . . . . . . . . . . . . . . . . . . . . . . . 12
On site testing . . . . . . . . . . . . . . . . . . . . . . . . . . . . . . . . . . . . . . . . . . . . 17pH reading . . . . . . . . . . . . . . . . . . . . . . . . . . . . . . . . . . . . . . . . . 17Conductivity . . . . . . . . . . . . . . . . . . . . . . . . . . . . . . . . . . . . . . . . 18Dissolved Oxygen . . . . . . . . . . . . . . . . . . . . . . . . . . . . . . . . . . . . 18
Air sampling . . . . . . . . . . . . . . . . . . . . . . . . . . . . . . . . . . . . . . . . . . . . . . 21Ambient Air Quality . . . . . . . . . . . . . . . . . . . . . . . . . . . . . . . . . . . 21Source Sampling . . . . . . . . . . . . . . . . . . . . . . . . . . . . . . . . . . . . . 21
Indoor Air Quality . . . . . . . . . . . . . . . . . . . . . . . . . . . . . . . . . . . . . . . . . . 22
Carbon Monoxide . . . . . . . . . . . . . . . . . . . . . . . . . . . . . . . . . . . . . . . . . 24Particulate air Pollutants . . . . . . . . . . . . . . . . . . . . . . . . . . . . . . . 26Conclusion Principles of Sampling . . . . . . . . . . . . . . . . . . . . . . . 29
References . . . . . . . . . . . . . . . . . . . . . . . . . . . . . . . . . . . . . . . . . . . . . . . 30
Environmental Sampling 1
Sampling
Correct sampling and storage are critical to the accuracy of each test.
Minimize contamination from sampling devices, remove residues of previous
samples from sample container and preserve samples properly. Special
precautions in handling the sample also may be necessary to prevent natural
interferences such as organic growth or loss or gain of dissolved gases.
Taking water samples.
Samples for analysis should be collected to make sure the most
representative samples is obtained. Use only clean containers and rinse
container several times first with the water to be sampled.
Samples taken in home’s faucet should be allowed to run for a sufficient time
to flush the system, and gentle stream to avoid turbulence and air bubbles.
Water samples from wells should be collected after the pump has run long
enough to deliver water representative of the ground water feeding the well.
Sampling representative surface water if difficult. Best results can be obtained
by running a series of tests with samples taken from several locations and
depths at different times.
Environmental Sampling 2
Proper sampling procedures are important part of the survey to assess water
or wastewater quality and to check compliance with water quality standards.
A sample witch has been improperly collected, preserved, transported, or
identified will result in invalid and useless test results. There are two basic
sampling methods: grab sampling and composite sampling.
Grab Sampling
A grab sample collected over a very short period time. A quick scoop or it
could take up to 15 min to fill the sample. It is important to note that the test
results from a grab sample only represent the conditions of the water or
wastewater at the particular time and location. Grab samples are most
suitable when testing for chlorine residual, pH, coliforms and dissolved
oxygen. They are usually collected manually. For stream or waste water
grab sampling devices that provides easy access to flow channel from boats,
spillways, or docks are available. Special containers that allow samples to
be collected at specific depths below the surface, without mixing with air, are
also available.
Environmental Sampling 3
Composite sampling
Composite sampling is more appropriate when it is necessary to determine
overall or average condition ver a certain period of time. Composite sampling
are obtained by mixing individual grab samples taken at regular intervals over
the sampling period. Automatic sampling equipment is usually used for
composite sampling. The cost of the equipment is balanced by saving on the
labor involved in the manual collection and composite.
Storage and Preservation
Planning is the most important step in sampling. This process necessitates
a discussion between the laboratory staff and the sampling crew to address
factors such as sample containers, field preservation, proper documentation,
packaging, shipping and receiving dates at the laboratory. Planning the
shipment schedule and method of shipment should be specified before the
sampling .The field crew has the responsibility for ensuring that the laboratory
receives properly preserved samples. The field activities start with a check
of all samples bottles, preservation and labels on-site to ensure that
everything agrees with the sampling plan. All sample bottle labels, chain of
custody records, and other pieces of documentation must be clearly
completed.

Environmental Sampling 4
The methods for taking and preserving samples vary depending on specific
water quality parameter and analysis to be made. Four general
considerations that apply for any type of samples. Source : ( Safe drinking water act self
study handbook) The American water works association.
1.The sample must be truly representative of the existing conditions. Example:
Collecting water from a faucet without first letting the water run for a while will not
give results representative of conditions in the water main, but only of the water that
was stagnant in the service line for an unknown period of time.
2.The time between collection and the analysis should be as short as possible for
the most reliable results.
3.Appropriate preservation techniques should be applied to slow down the biological
or chemical changes that may occur in the time between sample collection and
sample analysis. This usually involves refrigeration to cool sample
4.Accurate and thorough sampling records must be kept to avoid any confusion.
What, when, where of the sample as well as to satisfy legal requirements. All
sampling bottles should be properly identified, and records of the date, time, place,
and type of sampling should be kept.

Environmental Sampling 5
Groundwater
Part of the precipitation that falls upon the land may infiltrate the surface,
percolate downward through soil under the force of gravity and become what
is known as groundwater. After the water infiltrates the ground surface, it
seeps downward through the layer of soil called the zone of aeration. This
is a layer of soil in witch the small spaces between the solid soil particles are
partially filled with air as well as water. As water continues to percolate
downward, it eventually reaches the zone of saturation, a layer of soil or rock
in which all pore spaces or rock fissures are completely filled with water. The
dividing line between the zone of aeration and the zone of saturation is called
the water table. An excavation or well that is deep enough to penetrate the
zone of saturation would fill up with water to the height or elevation of the
water table. The elevation of the water table is not constant. It depends on
weather conditions and a\varies seasonally. The water table is generally
closer to the ground surface in the spring or during rainy periods and deeper
during dry spells. The water table can also be lowered by pumping.
Aquifers An aquifer is a layer of soil or rock in which groundwater cam
move relatively freely. An aquifer that is sandwiched between two
impermeable layers that block the flow of water is called a confined or
artesian aquifer. An imaginary line, representing the piezometric surface, can
be used to represent the height to which water would rise in a well that

Environmental Sampling 6
penetrates the aquifer. The recharge for an aquifer is where precipitation
infiltrates the ground to replenish the water flowing through the aquifer.
Covering with pavements and parking lots blocks the infiltration process and
reduces the amount of water that can be withdrawn from the aquifer
Wells
The most common method for withdrawing ground water is to penetrate the
aquifer with a vertical well and then pump the water up the surface. Wells
may be constructed in a variety of ways depending on the depth and nature
of the aquifer. A dug well is a shallow excavation up to about 10 m (30 ft)
deep. It is generally lined with stones or masonry to support the side walls.
Figure 1.1 Dug well

Environmental Sampling 7
A well point ( Figure 1.2) is a section of perforated pipe with an internal
screen and a point on the power en. Constructed in soft soils by driving a well
point into the ground up to about 20 m ( 65 ft.)
Figure 1.2 point well (source: activerain.com)
The most commonly used, Deep wells, Figure 1.3, for public water supplies
with depth of more then 30 m. (100 ft.) can penetrate aquifers with more
dependable yields of water and better water quality then shallower wells.
Deep wells are 100 to 300 mm ( 4 to 6 in.) drilled using percussion or rotary
drilling techniques and are lined with metal pipe, called casing. The annular
space around the casing is filled with cement grout. The casing and grout
serve to seal off poor quality water coming from the surface and upper soil
layer, protecting the well from contamination. A sanitary seal is installed at
the top of the casing with a well number identifying the well company with ID

Environmental Sampling 8
plate number and ministry well tag number. Unfortunately not all wells are
constructed with seal-off top and it explains why many wells end up with
coliforms from surface water.
Well drilling requirements is regulated by the New Brunswick ”Clean Water
Act” . A licensed well driller must comply with minimum well construction and
location requirements as specific in the “Water Well Regulation” under the”
Clean Water Act”. Mandatory testing for water quality of all newly drilled or
re-drilled well in NB was introduced under the “Potable Water Regulation” in
1994.
Inorganic and bacteriological test are required. In-organic components such
as: total hardness, alkalinity, calcium, chloride, copper, fluoride, iron,
potassium, magnesium, manganese, sodium, nitrite, lead, sulfate, antimony,
arsenic, boron and zinc. Bacteriological testing looks for the presence of total
coliforms and faecal coliforms.
The contractor will attach a sequentially numbered permanent identification
tag to the completed well. This well tag number is also recorded on the
testing voucher along with the NB GIS property Identification number, PIN.
When the well construction and plumbing is complete and the well has
experience some normal usage, the well owner is responsible to collect the

Environmental Sampling 9
sample. This sampling is mandatory, and must be done within 12 months of
the well construction. The samples and the voucher are then returned to the
office where the bottles were picked up. Usually at the Service of New
Brunswick, SNB. The samples are forwarded to the department of
Environment Analytical Services Laboratory. The results of the analysis are
interpreted by Department of Health and Community Services and returned
to the well owner by mail.
Figure 1.3 Diagram of a water table well (Source bhomes.org)
Environmental Sampling 10
Communicable and non-communicable diseases
Communicable diseases are caused by microbes include bacteria, protozoa
and viruses. Water contaminated domestic waste water is generally the
most common cause of intestinal diseases. The pathogens are excreted in
feces of infected people. Symptoms of intestinal diseases include diarrhea,
vomiting, nausea and fever also include typhoid fever, dysentery, cholera,
infection hepatitis and gastroenteritis.
Generally, the contamination is caused by cross-connection in the water
distribution system witch may allow back flow of waste water into drinking
water supply, inadequate well construction, and surface water wells.
Preventing the spread of disease and protecting the health of general
population is the goal of environmental technology and public health . The
application of basic sanitary principles and environmental technology have
eliminated serious outbreaks of water related diseases
Non infectious diseases
Public health problems related to environmental pollution are considered to
be the result of contaminated of water, food, and air with toxic chemicals.
Group of substances known as the heavy metals are notorious in this regard.
Diseases may take years to develop and can involve chronic or long lasting

Environmental Sampling 11
health problems. Various synthetic organic substances cause this type of
problem and some are considered to be carcinogenic, having the potential to
cause cancer to humans.
Lead is one of the heavy metals involved in non-infectious diseases. Lead
poisoning can lead to blindness, kidney disease, and mental retardation,
particularly in children. Lead is cumulative in human tissue and can built up
to toxic levels over time. St-Francois pre-school in Edmundston New
Brunswick was closed down in 1998 after James Landry, a concern
environment technologist, tested his son’s school water for lead. After
several testing and pressure on the city of Edmundston and the school district
# 3, the school was closed. The plumbing of the school and the main water
valved all were constructed with lead components. In Noah’s days, it was a
common practice in municipals water distribution system and many of them
are still in operation today.
Mercury is an other heavy metal associated with environmental pollution and
non infectious illness. Waste water mercury compounds discharged in
streams, rivers, lakes and ocean can be ingested by people who eat
contaminated fish. Research led to the discovery that certain microorganisms
can cause the metallic mercury to combine with other substances in the
water, forming harmful mercury compounds such as methyl-mercury.
Microscopic organisms plankton ingested this substance, little fish ate the
Environmental Sampling 12
plankton, bigger fish ate the smaller fish and finally people ate contaminated
fish and were ill by toxic methyl-mercury. Mercury and Lead are not the only
harmful chemical substances that become environmental pollutants when
poorly managed or controlled. Pesticide kepone. PCB, poly-chlorinated bi-
phenyl, this oily substance widely used in electrical transformers, coolants,
paints and many other products, persists in the environment because it is non
biodegradable and have accumulated in the bottom deposits of rivers and
lakes and many species are contaminated with it. Environmental pollution
with harmful chemicals are part of our daily problems and are now referred
to as hazardous waste disposal.
Coliforms Bacteria
Total coliforms tests are used for potable water supplies. Fecal coliforms, E
Coli, are also found in untreated water, waste water, bathing water and
swimming water. The presence of coliforms in a distribution system can
result from inadequately treated source water, with allows total coliforms to
pass through the treatment system into the distribution system
What is E Coli,
Escherichia coli, is a bacterium commonly found in the gut of warm blooded
organisms. Several types of E. Coli exist as part of the normal flora of the
human gut. Most strains pose no harm to human health, except for the

Environmental Sampling 13
stereotype 0151:H7, which can cause food poisoning in human. A healthy
adult will usually make full recovery from E. coli 0157:H7 infection within 5 to
7 days . However, young children, elderly and patients with weakened
immune systems can develop potentially fatal HUS ( demolytic uremic
syndrome), a type of kidney failure. Person infected with E. coli 0157:H7 will
experience symptoms within three to four days after being exposed to the
bacteria and in some cases the may appear within a day or a week later.
! Abdominal pain first symptom is severe abdominal cramping that
comes suddenly
! Diarrhea- a few hours after sudden abdominal pain the patient has
wetter diarrhea. A day later there may be bright red bloody stools,
caused by sores in the intestines.
! Nausea
! Vomiting- some patients will not vomit
! Fever, not that many people infected may not have fever
! Fatigue- diarrhea causes loss of fluids and electrolytes ( dehydration)
making patient fell sick and tired
Environmental Sampling 14
Many infected people have no noticeable symptoms. However, they are
capable of spreading the infection to others.
The 0157:H7 E.Coli, produces a potent toxin, the Shiga toxin, that is harmful
for the lining of the small intestine and human can become infected by
! Ingesting contaminated water, swimming pools, some lakes and
private wells and even tap water
! Ingesting contaminated food: ground beef, unpasteurized milk, fresh
vegetables, even infected people who work in restaurant and no not
wash their hands properly after going to the toilet, hotel phone and TV
remote control, door handles and groceries shopping cart handles can
spread the infection to customers and other members staff.
! Physical contact with infected person
! Contacts with animals it may not only occur in farm but in zoos or
country fairs.
! High fiber diets, researcher from the Uniformed Services University of
the Health Sciences reported in the Proceedings of the National
Academy of Sciences (PNAS) ( May 2013 issue) that people on high

Environmental Sampling 15
fiber diets have higher risk of harboring E. coli bacteria and suffering
the consequences of 0157:H7 infection and severe disease. The
authors reported that ” dietary choice affects Shiga toxin-producing
Escherichia coli .
Prevention to E. coli Cook meal well especially ground meat
1. Drink pasteurized milk, apple juice or cider
2. Wash vegetables thoroughly especially leafy green ones might not
protect you completely but it will help.
3. Wash cutlery and crockery, knives, forks, plates and serving dishes,
with warm soapy water.
4. Store food separately, use separate cutting board and do not store raw
ground beef right next to other foods.
5. Wash hands thoroughly with warm water and soap after going to the
toilet, before preparing foods, after preparing foods and after touching
animals. Wash your hands regularly in hot water and detergent.
6. Thoroughly rinse with hot tap water, followed by distilled water rinse

Environmental Sampling 16
to make sure that all detergent is removed
7. Steaming glass and autoclavable plastic containers at 121*C for 15
minutes. Glass sample containers may be sterilized by hot air at
170*C for one hour.
8. Store sterile containers tightly capped in clean environment until
needed.
Sampling should be properly carried out to insure the seasonal variances and
that results are representatives of the sample source.
Sufficient volume of sample should be collected for analysis. This usually
means at least 100 ml of sample. World Health Organization guidelines
prescribe 200 ml per sample while Standard Methods for Examination of
Water and Wastewater guidelines prescribe 100 ml per sample.
Samples should arrive at testing facility within 24 hours after collection. In
warm climates, the samples must be packed in a freezing mixture to maintain
the sample temperature between 4 and 10 /C. Coolers with ice freeze pack
are usually sufficient.
Collect 100 ml of samples and do not fill completely. Maintain at least 2.5 cm
Environmental Sampling 17
for mixing samples prior to analysis.
Collect representatives samples by allowing water to run from faucet, hydrant
or pump at a moderate rate without splashing, for two to three minutes before
sampling. Reduce the rate of flow before sampling.
Dechlorinating agent should be used with potable water samples.
Dechlorinating agent will not interfere with unchlorinated samples so, for
simplicity, plastic bags or bottles, containing dechlorinating agent may be
used for all samples. Sodium thiosulfate is generally used to destroy chlorine
residual.
On site testing
A certain number of parameters as the pH, the conductivity, the dissolved
oxygen, the temperature and the turbidity need to be tested on site . In-situ,
means directly into the aquatic. The on site testing for those parameters
needs to be taken each time possible and directly into the body of water if
possible if not a sample will be taken to take those reading with specific
reading instruments and probes
pH reading
pH are taken with a pH meter and it is the level of acidity or alcalinity of the

Environmental Sampling 18
solution. The neutral solution have pH of 7 while the acid solution will have
a pH lower then 7 and alcaline solution a pH of 7-14 .
There are many types of ph portable pH meters on the market today. There
is anologic pH testers who can be difficult to read from boats with trouble
waters and numeric that are more likely to be used.
Each time pH testing are to be planned. Careful calibration verification is a
must . It is also important to document the calibration and any adjustments
needed every time the unit is used. Those re-calibration also needs to be
done on site with known tampon solutions. The calibration
Conductivity
The term conductivity is a term witch refers to the ability of a material to carry
an electric current. Liquids witch carries an electric current generally referred
to as electrolytic conductors. The conductivity of a solution will change with
the change of temperature. So conductivity measuring is conducted with a
temperature reference. The calibration of the meter is also done prior the
sampling and on-site.

Environmental Sampling 19
Dissolved Oxygen
Dissolved Oxygen testing is also done In-situ. The portable DO (Dissolved
Oxygen) meter consist of a handheld unit, LCD display, keypad with tactile
and audible feedback, an electrode with an electrode holder.
The electrode holder is designed with a chamber at the bottom to hold a
cotton bal which has been saturated with water or dissolved water
Sampling Surface water
Today not many freshwater are left today that are fit to be called fresh. All
evidence indicates that life originated in water. And it is established fact that
all life must have water to survive. Water is ma’s most important asset. It
affects his cultural and his social life, his industry, his agriculture, his leisure
and his war. The difference between water and most other liquids is probably
basic to our existence. Most other liquids are heaviest (densest) at their
freezing points, and sink as the freeze. Water, how ever, is densest a few
degrees above its freezing point (about 4°C). This dense water sinks and the
lighter frozen water (ice) floats. Aquatic life can thus continue under the ice.
The ice also insulates the water below it, preventing from freezing. Lakes,
ponds, streams and rivers are unlike any other. Not only are the physical and
chemical factors different, but so are the particular plant and animal
communities. Each is a separate ecosystem with its own peculiarities.

Environmental Sampling 20
The test for dissolved oxygen(D.O.) Is probably the most important test to
determining water quality. The carbon dioxide content of water is important
from and economic viewpoint, since this gas contributes to several forms of
corrosion. Biologically, a concentration of carbon dioxide greater then 25
ppm can be lethal to aquatic animals. Further, a high carbon dioxide
concentration is usually a accompanied by a low D.O. The pH, the alkalinity,
the total hardness (T.H.), total suspended solids(T.S.S.) Total dissolved
solids (T.D.S.), turbidity, the conductivity the transparency, the color, the
temperature, velocity of flow and the volume of flow all must be tested on site.
The transparency of water indicates the amount of suspended matter in water
and can be obtained with a Secchi Disc. Figure 1.4
Figure 1.4: A Secchi disc.
This is a metal disc, 20 cm in diameter and divided in four quarters, 2 which
are white and 2 black. Several kind of information can be gathered with the
disc: a rough measure of the suspended matter: the depth of the reflected
light penetration: and a rough estimate of the extent of the littoral zone.

Environmental Sampling 21
To obtain a Secchi disc reading, lower, lower the disc into the water, in the
shade, until it disappears. Take a depth measurement at this point. Then
raise the disc until it reappears. Take another depth measurement. The two
measurement are average. This process is repeated three times and the
overall average is considered to be the proper Secchi disc reading.
By looking through a glass bottomed bucket, much better measurements can
be made since surface distortions are eliminated as shown in figure 1.5
Air sampling
There are two different approaches for sampling and measuring air
pollutants.
1. Sampling and analysis of surrounding “outdoor” or ambient air quality.
2. Sampling and analysis of specific emissions at their point of
generation. Source sampling or emissions analysis.
Ambient Air Quality
Collected from the open atmosphere, after pollutants from various sources

Environmental Sampling 22
have been dispersed and mixed together under natural meteorological
conditions. It provides air quality data for urban or rural areas and a basis
for developing and updating ambient air quality standards. It also provides
data to determine if established standards are met or exceeded. Ambient air
quality can also be done inside infrastructures to determine indoor air quality
for workers. It is important that the sampling duration and location be
representative of the particular study area and type of pollutant being
examined.
Source Sampling
Sources or emissions sampling are performed right at the point of pollutant
discharged. It is often called Stack sampling at power plants or industrial
facilities where discharge is from a chimney, Purposes of emissions sampling
are to provide data for designing and operating air cleaning equipment and
to measure the working efficiency of that equipment.
For accurate results, stack sampling must be isokinetic; collected by a probe
at the same rate which that gas leaves the stack. The equipment used for the
purpose is called a sampling train, and it includes several interconnected
Environmental Sampling 23
devices. The basic components are a pitot-tube probe, a vacuum pump to
pull the sample out of the a stack, a flow meter, and a meter to measure the
weight or mass of the specific pollutant in the sample. The temperature of the
gas must also be determined.
Indoor Air Quality
Up until recently, little attention has been given to air pollutants in homes.
Indoor air quality and the nature of residential pollutants differ from those
major concern in the outdoor air or workplace. Since people spend much of
their time at home, indoor air quality can have a significant effect on health.
A factor that makes indoor air pollution a more significant problem now than
it was in the past is the recent trend toward complete insulation of buildings
and homes for energy conservation. Recently, the ventilation of an average
home due to leakage has been reduced from about one air change per hour
to about 0.25 changes per hour. This decrease in ventilation means that
people are being exposed to staler and possibly more polluted air.
Two major ambient pollutants, carbon monoxide and nitrogen dioxide, are
also of concern indoors. The highest levels of these pollutants seem to
accumulate in the kitchens of well-insulated houses, often exceeding the
outdoor concentrations. Two different gaseous substances that particularly
affect indoor air quality are radon and formaldehyde. Radon gas is produced
continuously from radioactive decay of radium, witch is a natural trace

Environmental Sampling 24
element in most rock and soil. Building materials, including concrete and
brick, as well as the earth foundation itself, are a source of radon gas. Indoor
levels of this gas, a suspected carcinogen, are usually higher than outdoor
levels.
Formaldehyde is found in foam insulation, carpets, drapes, and other
household items. It is also used in plywood and particle-board bonding
agents. In addition to causing nausea, respiratory irritation, and other effects,
it is suspected of causing more serious long-term problems, such as cancer.

Environmental Sampling 25
Carbon Monoxide
The most dangerous gas most of us will ever face is carbon monoxide (CO).
Not normally occurring in nature, this gas is the result of oxygen-starved
combustion from improperly ventilated fuel-burning motors and appliances.
! Oil and gas furnaces
! Gas water heaters or gas ovens as or kerosene space heaters
Fire places and wood stoves !
Older autos without catalytic converters !
Too much carbon monoxide in an unventilated space is deadly. In fact,
carbon monoxide poisoning is the most common type of fatal poisoning
worldwide. This is why many new homes are built with CO detectors in
addition to smoke detectors
Figure 1.6: Source of carbon
monoxide in homes
Environmental Sampling 26
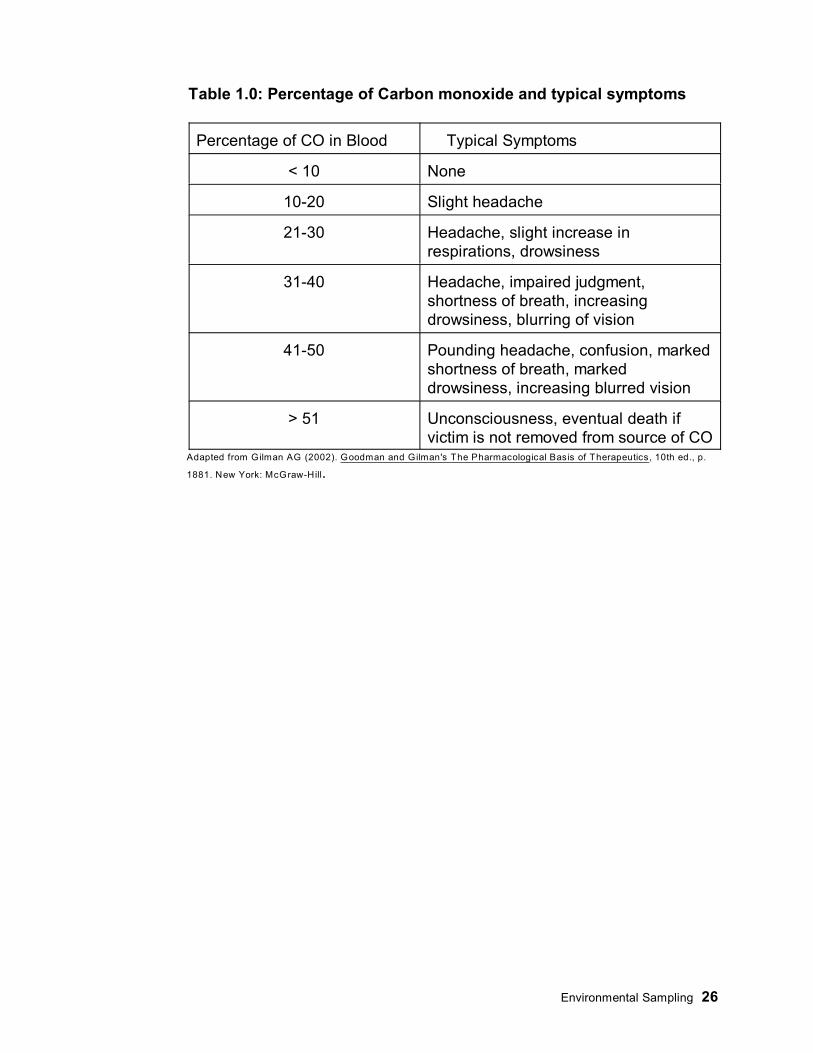
Table 1.0: Percentage of Carbon monoxide and typical symptoms
Percentage of CO in Blood Typical Symptoms
< 10 None
10-20 Slight headache
21-30 Headache, slight increase inrespirations, drowsiness
31-40 Headache, impaired judgment,shortness of breath, increasingdrowsiness, blurring of vision
41-50 Pounding headache, confusion, markedshortness of breath, markeddrowsiness, increasing blurred vision
> 51 Unconsciousness, eventual death ifvictim is not removed from source of CO
Adapted from Gilman AG (2002). Goodman and Gilman's The Pharmacological Basis of Therapeutics, 10th ed., p.
1881. New York: McGraw-Hill.
Environmental Sampling 27
Particulate air Pollutants
Today we have several methods to measure air particulate. Gravity
technique, filtration technique and inertial technique.
Gravity technique is the simplest method, but can only measure the amount
of settleable particulate, dust and fly ash in the air. A simple device called a
dust-fall bucket has been used for this purpose. The open bucket, containing
water to trap and hold particles, is left exposed in a suitable location, often on
a building rooftop. After a collection period of 30 days, the water is
evaporated and the dust is weighted. The results can be express in grams per
square meter per month or as tons per square mile per month.
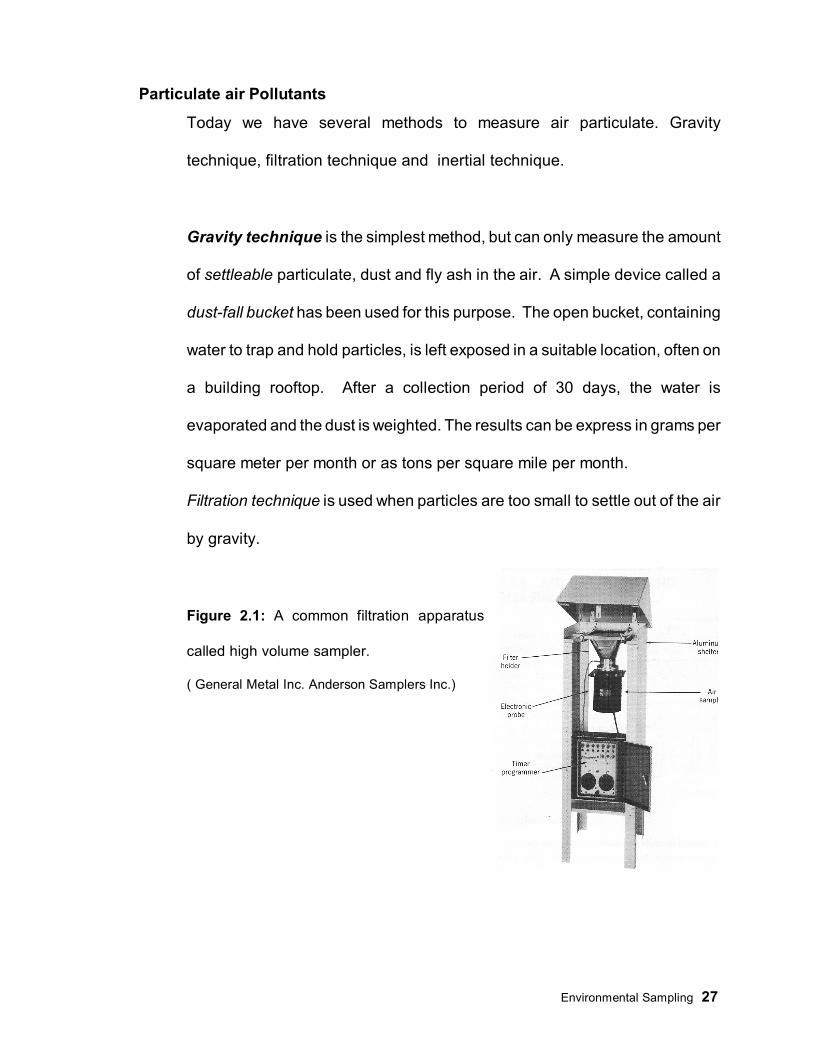
Filtration technique is used when particles are too small to settle out of the air
by gravity.
Figure 2.1: A common filtration apparatus
called high volume sampler.
( General Metal Inc. Anderson Samplers Inc.)

Environmental Sampling 28
Paper tape sampler is another filtration type instrument used to collect and
measure suspended particulate. Sampling durations with this device are
relatively short, typically two hours. A vacuum pump pulls the air stream
through a filter tape, which moves automatically on a reel, at preset intervals.
Trapped particulate form a dark spot on the tape, and the amount of
particulate correlates with the darkness of the spot. The relative darkness of
the spot is measured by an optical device called transmissometer, which
gives a reading in terms of the percentage of light that can pass through the
tape. Final results are then expressed in terms of coefficient of haze (COH).
Figure 2.2: Paper tape sampler.(RAC Division, Anderson Samplers Inc.)

Environmental Sampling 29
Inertial technique makes uses of an obstacle placed in the path of the air
stream. The air flows around the obstacle, but because of inertia, the
particulate collide with it and become trapped in the device. Figure 2.3.
Such device is also called sticky tape sampler. It can be use to collect Total
Suspended Particles, TSP, pollen grain or bacteria.
Figure 2.3: Sticky tape sampler
Smoke reading is a visual evaluation of smoke plumes that are discharged
from stack or chimney are made with a Ringlemann Chart. Figure 2.4, The
density or darkness of the smoke is compared to the five standard shades of
gray on the chart. Ringlemann smoke
readings range from all white (0) to all
black (5). Even though pollutant
concentrations are not necessarily
correlated exactly with the shade or
darkness of a smoke plume, Ringlemann
readings are a value in monitoring air
pollution, and some air quality regulations
are still based on smoke density.
Figure 2.4: Ringlemann smoke chart. ( Plibrico Company Illinois)

Environmental Sampling 30
Conclusion
We all can take samples but taking reliable environmental samples is a
difficult process. Specific needs will dictate which special techniques will be
incorporated in the sampling plans. Generally, the objective is to take
representative samples in order to analyze for components that constitute a
very tiny fraction of the samples and once the sample taken, other
interferences can be introduced during transport or preservation.
The following three requirements are acceptable sampling programs.
1. A proper design that takes into account the goals of the study
2. Instructions for sample collection, labeling, preservation, and transport
to the analytical facilities
3. Trained personnel in the sampling techniques and procedures
specified
These three suggestions also need to be written in detailed protocols in a
quality assurance program (QAP).
We also need to add the two aspects of quality assurance of sampling: quality
control and quality assessment. Quality control includes the application of
good laboratory practices, good measurements practices, and standard
operations procedures designed for sampling. The quality assessment
depends largely on monitoring for adherence to the protocols.
Periodic review in any monitoring program is critical in the quality
assessment of the sampling operation and audits are the best means to
accomplish this purpose.

Environmental Sampling 31
Environmental Sampling 32
References
1. Handbook for Sampling and sample preservation of water and Waste Water. U.S.
Environmental Protection Angency 1982 EPA -600/4-82-029 Addendum 1983
2. Annual Book of ASTM Standard: American Society for testing
3. Basic Environmental Technolgy . Jerry Nathanson 1986.
4. Guide d’ Echantillonnage pour la qualité de l’eau Environnement Canada Directeur de la
qualité des eaux Ottawa 1983 isbo 0662-92513-0.
5. Manuel de Cour : Technologie de l’environnement CCNB Bathurst. New Brunswick
Michel Blais. 1992
6. HACH Company. Instruction manual HACH company 1985
7. Standard Methods for examination of water and waster water 22 edition American Publicnd
Health Association. Washington DC 20001-3710. 2012

Environmental Sampling 33


