The Private Credit Investment Landscape Meghna Desai Director, New York Presbyterian Hospital Kipp deVeer CEO, Ares Capital Corporation; Partner, Head of Ares Credit Joshua Easterly Co-CEO, Co-CIO of the Adviser, TPG Specialty Lending Matt Liepert Managing Director, Antares Capital Gregory A. Robbins Managing Director, Head of Corporate Strategy and Development, Golub Capital Moderator: Jonathan Bock Managing Director, Wells Fargo Securities 1 All estimates/forecasts are as of April 26, 2017 unless otherwise stated. Please see page 18 for rating definitions, important disclosures and required analyst certifications. Wells Fargo Securities, LLC does and seeks to do business with companies covered in its research reports. As a result, investors should be aware that the firm may have a conflict of interest that could affect the objectivity of the report and investors should consider this report as only a single factor in making their investment decision.
Transcript
The Private Credit Investment Landscape Meghna Desai Director, New York Presbyterian Hospital Kipp deVeer CEO, Ares Capital Corporation; Partner, Head of Ares Credit Joshua Easterly Co-CEO, Co-CIO of the Adviser, TPG Specialty Lending Matt Liepert Managing Director, Antares Capital Gregory A. Robbins Managing Director, Head of Corporate Strategy and Development,
Golub Capital Moderator: Jonathan Bock Managing Director, Wells Fargo Securities
1
All estimates/forecasts are as of April 26, 2017 unless otherwise stated.
Please see page 18 for rating definitions, important disclosures and required analyst certifications.
Wells Fargo Securities, LLC does and seeks to do business with companies covered in its research reports. As a result, investors should be aware that the firm may have a conflict of interest that could affect the objectivity of the report and investors should consider this report as only a single factor in making their investment decision.
2
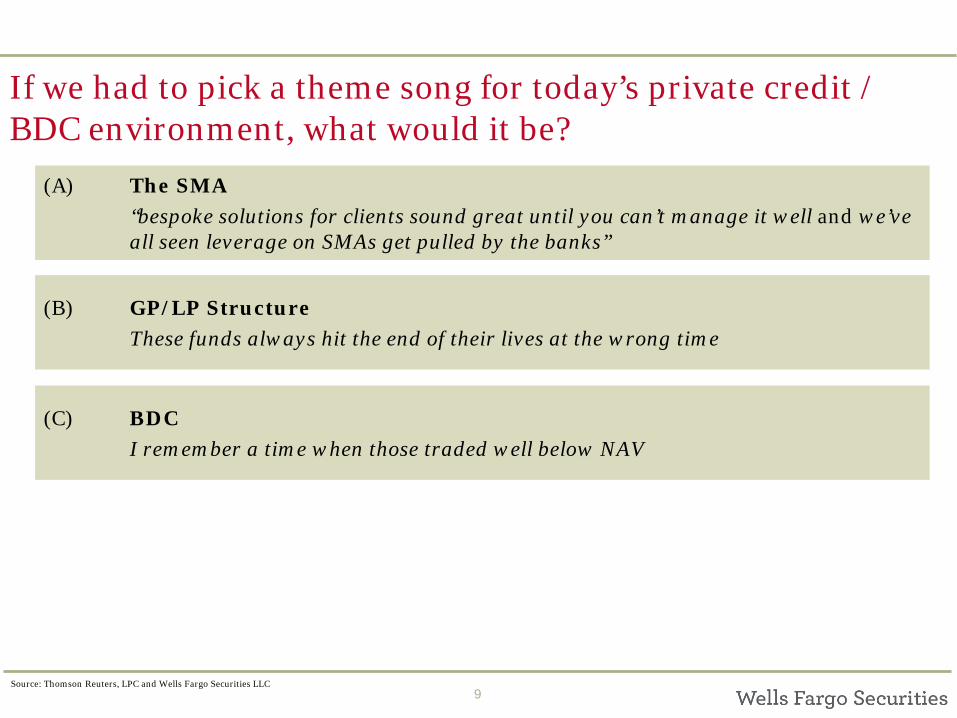
If we had to pick a theme song for today’s private credit / BDC environment, what would it be?
(A) We Are the Champions, Queen I’ve never been able to raise (and charge fees on) so much capital!
(B) Everybody Hurts, REM I can’t find good (yieldy) deals, and no one else can either
(C) Dream On, Aerosmith I’m not deploying gobs of capital in this environment—I simply can’t safely
(D) Hold On, Wilson Phillips Hold on for one more day…things will go your way.
3
…And Leverage Is Lower
The Middle Market Pitch…an exercise in relatives…
Source: Thomson Reuters, LPC and Wells Fargo Securities, LLC
Middle Market Yield Premium is Wide…
From the Top Down…
4
With the share of par-plus loans now at 73% (up from 2% this time last
year) on a dollar weighted basis, are you really optimistic about forward loan return? If
so, why?
Share of loans bid >=100 & >=101
Source: Thomson Reuters, LPC and Wells Fargo Securities, LLC
A Look At Returns
5
BDCs who have delivered greater ROEs over the
past three years trade at a premium price / NAV multiple.. What is your view on the ability to deliver outsized ROE given today’s tighter spread environment?
3-Year ROE vs. PB
Source: SNL and Wells Fargo Securities, LLC SOURCE: SNL FINANCIAL LC. CONTAINS COPYRIGHTED AND TRADE SECRET MATERIAL DISTRIBUTED UNDER LICENSE FROM SNL. FOR RECIPIENT’S INTERNAL USE ONLY
Top Quartile and Bottom Quartile BDC Performance Relative to WFBDC (as of April 2017)
Source: Thomson Reuters, LPC and Wells Fargo Securities, LLC
70
90
110
130
150
170
190
210
230
4/26
/201
1 6/
8/20
11
7/21
/201
1 9/
1/20
11
10/1
4/20
11
11/2
8/20
11
1/11
/201
2 2/
24/2
012
4/9/
2012
5/
21/2
012
7/3/
2012
8/
15/2
012
9/27
/201
2 11
/12/
2012
12
/26/
2012
2/
08/1
3 3/
25/2
013
5/07
/13
6/19
/201
3 8/
01/1
3 9/
13/2
013
10/2
5/20
13
12/0
9/13
1/
23/1
4 3/
07/1
4 4/
21/1
4 6/
03/1
4 7/
16/1
4 8/
27/1
4 10
/09/
14
11/1
9/20
14
1/5/
2015
2/
18/2
015
4/1/
2015
5/
14/2
015
6/26
/201
5 8/
10/2
015
9/22
/201
5 11
/3/2
015
12/1
6/20
15
2/1/
2016
3/
15/2
016
4/27
/201
6 6/
9/20
16
7/22
/201
6 9/
2/20
16
10/1
7/20
16
11/2
9/20
16
1/12
/201
7 2/
27/2
017
Wells Fargo BDC Index
Top Quartile Return
Bottom Quartile Return
Since 4/26/11, the top-ranked BDCs are up 105%.The BDC index is up 57% while the lowest rank BDCs are up 60%, respectively. The S&P 500 returned 75% over this time frame.
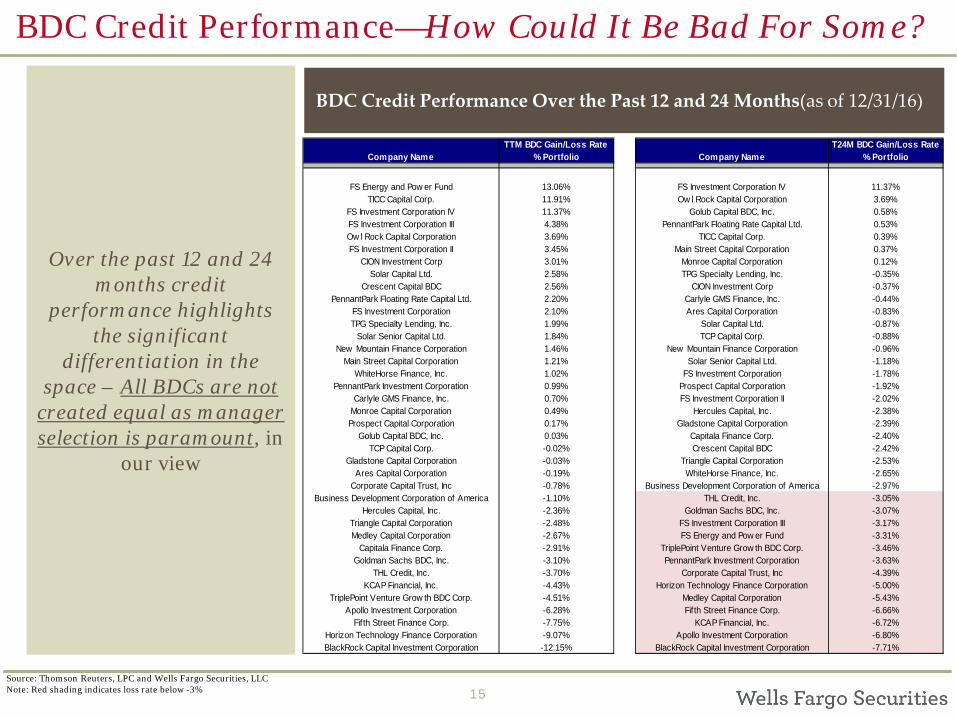
BDC Credit Performance—How Could It Be Bad For Some?
15
Over the past 12 and 24 months credit
performance highlights the significant
differentiation in the space – All BDCs are not
created equal as manager selection is paramount, in
our view
BDC Credit Performance Over the Past 12 and 24 Months(as of 12/31/16)
Source: Thomson Reuters, LPC and Wells Fargo Securities, LLC Note: Red shading indicates loss rate below -3%
Company NameTTM BDC Gain/Loss Rate
% Portfolio Company NameT24M BDC Gain/Loss Rate
% Portfolio
FS Energy and Pow er Fund 13.06% FS Investment Corporation IV 11.37%TICC Capital Corp. 11.91% Ow l Rock Capital Corporation 3.69%
FS Investment Corporation IV 11.37% Golub Capital BDC, Inc. 0.58%FS Investment Corporation III 4.38% PennantPark Floating Rate Capital Ltd. 0.53%Ow l Rock Capital Corporation 3.69% TICC Capital Corp. 0.39%FS Investment Corporation II 3.45% Main Street Capital Corporation 0.37%
CION Investment Corp 3.01% Monroe Capital Corporation 0.12%Solar Capital Ltd. 2.58% TPG Specialty Lending, Inc. -0.35%
Crescent Capital BDC 2.56% CION Investment Corp -0.37%PennantPark Floating Rate Capital Ltd. 2.20% Carlyle GMS Finance, Inc. -0.44%
FS Investment Corporation 2.10% Ares Capital Corporation -0.83%TPG Specialty Lending, Inc. 1.99% Solar Capital Ltd. -0.87%
Solar Senior Capital Ltd. 1.84% TCP Capital Corp. -0.88%New Mountain Finance Corporation 1.46% New Mountain Finance Corporation -0.96%
Main Street Capital Corporation 1.21% Solar Senior Capital Ltd. -1.18%WhiteHorse Finance, Inc. 1.02% FS Investment Corporation -1.78%
PennantPark Investment Corporation 0.99% Prospect Capital Corporation -1.92%Carlyle GMS Finance, Inc. 0.70% FS Investment Corporation II -2.02%
Monroe Capital Corporation 0.49% Hercules Capital, Inc. -2.38%Prospect Capital Corporation 0.17% Gladstone Capital Corporation -2.39%
Golub Capital BDC, Inc. 0.03% Capitala Finance Corp. -2.40%TCP Capital Corp. -0.02% Crescent Capital BDC -2.42%
Gladstone Capital Corporation -0.03% Triangle Capital Corporation -2.53%Ares Capital Corporation -0.19% WhiteHorse Finance, Inc. -2.65%
Corporate Capital Trust, Inc -0.78% Business Development Corporation of America -2.97%Business Development Corporation of America -1.10% THL Credit, Inc. -3.05%
Hercules Capital, Inc. -2.36% Goldman Sachs BDC, Inc. -3.07%Triangle Capital Corporation -2.48% FS Investment Corporation III -3.17%Medley Capital Corporation -2.67% FS Energy and Pow er Fund -3.31%
Capitala Finance Corp. -2.91% TriplePoint Venture Grow th BDC Corp. -3.46%Goldman Sachs BDC, Inc. -3.10% PennantPark Investment Corporation -3.63%
THL Credit, Inc. -3.70% Corporate Capital Trust, Inc -4.39%KCAP Financial, Inc. -4.43% Horizon Technology Finance Corporation -5.00%
TriplePoint Venture Grow th BDC Corp. -4.51% Medley Capital Corporation -5.43%Apollo Investment Corporation -6.28% Fifth Street Finance Corp. -6.66%
Fifth Street Finance Corp. -7.75% KCAP Financial, Inc. -6.72%Horizon Technology Finance Corporation -9.07% Apollo Investment Corporation -6.80%BlackRock Capital Investment Corporation -12.15% BlackRock Capital Investment Corporation -7.71%
A Look At The Math…
16
In general, BDC fee structures / dividend
yields require that capital be deployed at a ~10%
return over the long-term
“The Math” – Required BDC ROA to Meet the Dividend Yield
Source: Thomson Reuters, LPC and Wells Fargo Securities, LLC
17
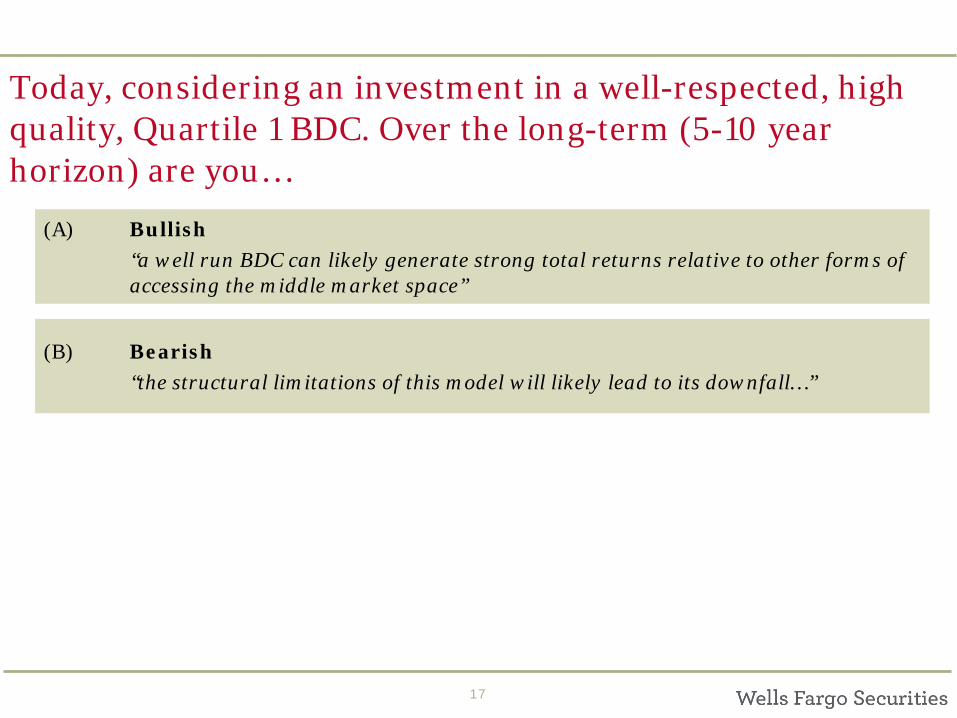
Today, considering an investment in a well-respected, high quality, Quartile 1 BDC. Over the long-term (5-10 year horizon) are you…
(A) Bullish “a well run BDC can likely generate strong total returns relative to other forms of accessing the middle market space”
(B) Bearish “the structural limitations of this model will likely lead to its downfall…”