75
THE PRIVATE LIFE OF MAIL MAIL IN THE HOME, HEART AND HEAD.

THEPRIVATELIFEOF MAILMAIL IN THE HOME, HEART AND HEAD.

MAILMEN.co.uk

03
CONTENTS
INTRODUCTION 05
EXECUTIVE SUMMARY 06
EIGHTEEN MONTHS OF INVESTIGATION 10
MAIL IN THE HOME 12
MAIL IN THE HEART 20
MAIL IN THE HEAD 26
MAIL IN THE WALLET 34
THE SALVATION ARMY CASE STUDY 46
CONCLUSIONS 56
APPENDIX 58
THANK YOU 68
SOURCES 70

04

05
INTRODUCTION
In today’s rapidly transforming media landscape, brands and consumers are
communicating in more diverse ways than ever.
Mail, however, represents a significant point at which communication becomes physical.
Over the last 18 months, Royal Mail MarketReach has conducted a series of research
projects to understand exactly what that means for consumers, and what it means
for you.
We’ve looked into consumers’ homes and found that mail lives a rich, complex
and surprisingly long life beyond the doormat. We’ve looked into their hearts and
uncovered the deep emotional responses that are triggered by sensations of touch.
And we’ve literally looked into their heads, using the latest neuroscience techniques
to discover that mail has a profound and direct impact on the brain.
It’s an unprecedented look at what happens after mail enters the home, which is why
we’ve called it, The Private Life of Mail.
Mail has always delivered a great return on investment (ROI) – and it still does.
But we’ve learned that mail also has the kind of benefits you might have associated
with above the line media, such as creating strong, emotional connections and
brand associations.
We’re always working to demonstrate the vital contribution mail makes to the success
of campaigns. As part of this work, we’ve gained access to some of the richest sources
of insight on mail in the UK and now we want to share what we’ve learned with you.
Jonathan Harman
Managing Director, Royal Mail MarketReach
February 2015

06
EXECUTIVE SUMMARY
Digital media has changed the advertising world. It has brought a variety of new
platforms through which brands and consumers can communicate and share
experiences, from social media forums to e-commerce channels. As a result, new
ways to create and enhance consumer relationships are evolving all the time, as
is the ability to collect and analyse vast amounts of data on consumer behaviour.
We’ve also seen constant change in the way people interact with media such as
TV and the internet.
What digital media hasn’t changed is people. We are still physical creatures that thrive
on human contact and stimulation. Giving, receiving and handling tangible objects
remain deep and intuitive parts of the human experience. In the never-ending stream
of two-way virtual communication, sending a direct sensory experience of your brand
can mark a pivotal moment in the customer journey.
We want to help you understand why this moment matters by giving you
unprecedented access to the homes, hearts and heads of UK consumers.
These findings are the result of over 18 months in-depth investigation. We used
a combination of traditional and new methods in the field of market and media
research, including ethnography, quantitative and neuroscience research,
interviews and analysis. Here are the most important things for you to know.

MAIL IN THE HOME
Through deep ethnographic interviewing, CCTV observation and survey work,
we uncovered some vital insights into how mail flows throughout the average
UK household. Here’s what we learned:
Mail is displayed
39% say they have a dedicated display area in their home where they put mail.
Think creatively about ways to encourage people to display your mail and it will
become visible to everyone in the household.
Mail is passed around
An average of 23% of all mail is shared between people in a household. 21% of
promotions and special offers are shared. If you give people a positive reason to share
or discuss your mail, your brand will start being talked about, allowing your message
to reach more people.
Mail persists
Mail is kept in a household on average for 17 days for advertising mail, 38 days
for door drops and 45 days for bills and statements. This means a single piece
of mail can have a big impact and presents multiple opportunities to be seen,
often over days or weeks.
Karen Blackett OBE – CEO, MediaCom
“ AFTER 20 YEARS PLANNING TV I’VE DISCOVERED A NEW CHANNEL.”
MAILMEN.co.uk

08
MAIL IN THE HEART
We studied peer-reviewed scientific research on the power of touch. We also carried
out our own research to better our understanding of how these findings could be
applied to the way consumers respond to mail. Here’s what we learned:
People place value on things they can touch
In psychological experiments, people value something they can see and touch 24%
more highly than something they can only see. Send an offer by mail and recipients
will perceive it as worth more than the same offer on screen.
People feel valued by mail
57% claim that receiving mail makes them feel more valued. Sending mail creates a
more genuine two-way relationship between brands and consumers.
People get emotional around mail
38% of respondents say that the physical properties of mail influence how they feel
about the sender. The production values of a mail piece can reinforce your brand
values in a deep and intuitive way.
MAIL IN THE HEAD
We watched consumers’ behaviour around mail and saw that much of what they
did was subconscious and automatic. We therefore used the latest techniques in
neuroscience to understand mail’s direct impact on the brain. Here’s what we learned:
Mail is instinctive
Consumers interact with mail and absorb its messages in a largely unconscious
way. This means it works on the brain’s System 1 – the faster, more intuitive mode of
thought, which affects decision making.
Mail changes perception
We can see a measurable change in how consumers react when mail is added to
other media, so carefully planning mail around your TV and email campaigns will
boost the effectiveness of all three.
Mail is remembered
Over half of respondents (60%) say that the best mail advertising helps keep a
sender’s brand top of mind. It activates areas of the brain responsible for long-term
memory encoding more strongly than other media, and has a lasting effect that
means recall will be more readily triggered later on.

09
MAIL IN THE WALLET
All of this only matters if it means that you can use mail to drive real business value
from a campaign.
For evidence of this we turned to client results databases, commissioning
BrandScience to look at their clients’ metrics, as well as independent consultant
Peter Field to interrogate the IPA Effectiveness Awards Databank. We also looked at
our own research and other advertiser cases for extra evidence of measures such
as market share increase, brand switching and reaching new audiences. Here’s what
we learned:
Mail delivers results
In BrandScience cases, mail delivered strong ROIs, broadly the same as TV, and
above most of the other media channels. In addition, IPA Effectiveness Awards
Databank analysis showed that campaigns including mail were 27% more likely to
deliver top-ranking sales performance, and 40% more likely to deliver top-ranking
acquisition levels, versus campaigns without mail.
Mail generates a media multiplier effect
The total communications ROI for BrandScience client cases that included mail was
12% higher than those that didn’t. This links well to the strong interaction and priming
effect we saw between mail and TV.
Mail delivers for brand growth
In the meta-analysis of the IPA Effectiveness Awards Databank, cases with mail
delivered market share growth with three times the efficiency of cases without mail.
Brand switching is evident, with positive effects for advertisers that incorporate mail,
as demonstrated in our neuroscience research.
Mail reaches new audiences
Mail opens up new audiences. New audiences respond when mail is added to the
mix. In fact 68% desired some communication by mail.
Mail demonstrates investment success
The Salvation Army case study, based on work awarded both an IPA Effectiveness
Award (Silver, 2014) and DMA Award (Gold, 2011), demonstrates investment success
with mail (and door drops) at the core in the post-digital world.

10
EIGHTEEN MONTHS OF INVESTIGATION
Over the past 18 months, we have conducted eight separate strands of research
with the aim of creating one complete story and a comprehensive view of the ways in
which mail impacts consumers.
With each project we took a hypothesis-driven approach, starting with what we
already knew and believed before looking more rigorously for effects we’d seen in
previous research. As each project developed, we started to see the story progressing
from different angles and found new hypotheses that furthered our understanding.
That’s why in this report you’ll see evidence built up from varying strands. Each of our
projects confirmed or expanded on the others, and the story of what we’ve discovered
is best told using them all together.
Aside from analysis of 416 cases within the IPA Effectiveness Awards Databank,
401 cases within BrandScience’s Results Vault (one case covers a year’s worth of
data for one client) and analysis of over 1,000 academic articles, the primary research
within The Private Life of Mail included:
12 households covered within our ethnographic work including
CCTV in participants’ homes.
14 focus groups and 99 in-depth interviews.
213 participants within our neuroscience and tactility work.
9,504 respondents across our telephone and online quantitative surveys.
See appendix for full details of all the studies included in The Private Life of Mail.

11
THE EIGHT STRANDS INCLUDED IN THE PRIVATE LIFE OF MAIL RESEARCH
HOUSEHOLD ETHNOGRAPHY
12 UK households. 800+ hours of CCTV footage. 24 filmed depth interviews.
Online survey panel (n=1,129). UK representative. Confirms universality of behaviours seen in the household ethnography.
Review of over 1,000 peer-reviewed academic papers.
Summarises key results about the psychology of touch.
Two separate quantitative stages (n=1,000; n=2,375).
Part 1 on email and part 2 on digital media in general.
Explores behaviours, preferences and attitudes.
50 participants. 5 mocked up mailing variants. Combination of quant, qual and biometric approaches.
DECODE SCIENCE SCAN
ROI ANALYTICS
VALUES
MAIL AND DIGITAL 1 & 2
ETHNOGRAPHYQUANT
TACTILITY
163 participants. Exposed to TV, mail and email. Steady State Topography (SST) measures activity of brain areas.
NEUROSCIENCE THE PRIVATE LIFE OF MAIL
BrandScience ‘Results Vault’ – econometric ROI Meta-Analysis.
IPA Effectiveness Awards Databank – comparison of campaigns using and not using mail.
6x focus groups and qualitative diary task followed by online quant (n=3,000).
Respondents asked to talk about the BEST mail they’ve had across 6 different sectors.

12
LIFE BEYOND THE LETTERBOX
Starting point
Mail is physical, and from the moment it enters the household it changes the
environment. These changes represent a major component of mail’s power to drive
consideration and response and are more diverse and more dramatic than some
advertisers may believe.
What we learned
The lifespan of mail is extended in terms of both time and space. We found that mail
flows through a household. It is filtered, passed around, discussed, displayed and filed
in diverse ways. Our findings also show how participants interacted with both mail and
door drops.
Supporting evidence
Rather than being opened and read at the doormat, we saw our ethnography
participants fitting their interaction with mail around daily life, revisiting a piece of
mail at various times in the day.
MAIL IN THE HOME

13
Observing the 800+ hours of video from our ethnographic study, we noticed in some
cases that mail occupies an amount of overall daily time comparable to that of other
media. In fact, the latest IPA Touchpoints survey shows that adults read their mail on
average for 22 minutes a day – more than magazines at 14 minutes per day.1
MAIL IN A PARTICIPANT’S DAILY LIFE
1.15 PM: Collects mail and brings it into the home with other bags and belongings
2.15PM: Opens parcel
2.30PM: Uses laptop to get details on a piece of mail received
8.30PM: Brings catalogue into lounge to read
1.30PM: Opens mail whilst doing other jobs
1. IPA Touchpoints 5, 2014 (Data based upon Monday to Saturday reading)
Source: Royal Mail MarketReach, Media Moments, Trinity McQueen, 2013
5.30PM: Uses laptop again to get further details on the piece of mail from earlier

14
Our ethnographic observations also showed people revisiting mail that had been in
the house for quite some time. So in our quantitative follow-up survey we asked about
the mail that participants held on to, where it was and how long it had been there.
We discovered that mail was kept in a household for on average:2
17 days for advertising mail.
38 days for door drops.
45 days for bills and statements.
Recent data from Kantar Media’s TGI survey uncovered that 80% of adults have kept
some mail that companies had sent to them in the last four weeks.3
People commonly keep mail they find useful. In fact, according to Royal Mail
MarketReach research, 66% of respondents indicated that they kept mail that
they considered particularly useful, with a higher figure keeping mail from the
financial and tourism sectors4 (both 72%).
Mail also moves around the household and we identified three distinct types of
storage area:
1. A Holding area where mail is kept before being dealt with.
2. A Pile where mail is kept after being sorted and is awaiting action.
3. A Display area where useful or important items are stored, such
as local information or time-limited offers.
2. Royal Mail MarketReach, Ethnographic Quant, Trinity McQueen, 2014
3. TGI Kantar Media, 2014
4. Royal Mail MarketReach, Values: V2C Drives V2B, Quadrangle, 2014

15
Data from IPA Touchpoints 5 confirms that people store mail. 69% of people have
a specific place in the house where they store advertising mail such as catalogues,
brochures, vouchers and coupons.5
WHERE MAIL IS STORED The Holding area, the Pile and the Display area for a single ethnography participant.
Holding area
Pile
Display area
5. IPA Touchpoints 5, 2014
Source: Royal Mail MarketReach, Media Moments, Trinity McQueen, 2013

16
MAIL ON DISPLAY
The display area is particularly important. In the ethnography films, we noticed how
mail was used as functional decoration, occupying a designated space in a room.
The quantitative follow-up survey identified that 39% of people displayed mail in the
home, most commonly in the kitchen, providing multiple opportunities to engage
with a brand.
0%–15%
16%–30%
31%+
HOUSEHOLD HEAT MAPShowing where specific items of mail are displayed in a typical household.
Mail also moves from person to person. Our follow-up survey identified that almost a
quarter of mail (23%) is shared in a household – allowing for wider exposure of your
brand message to new audiences.
Source: Royal Mail MarketReach, Ethnographic Quant, Trinity McQueen, 2014
31%Living Room
5%Study Bathroom
6%Dining Room
51%Kitchen
3%Bedroom
18%Hallway
1%

17
6. Royal Mail MarketReach, Ethnographic Quant, Trinity McQueen, 2014
7. IPA Touchpoints 5, 2014
8. Royal Mail MarketReach, Mail and Digital Part 2, Quadrangle, 2014
In shared households 35% of promotional mail is passed on to others.6 Since the
inhabitants of shared households tend to be younger, this has particular implications
for mail. We have already found evidence that 15-34 year olds are:7
42% more likely to find mail memorable than the UK population as a whole.
27% more likely to welcome it.
71% more likely to trust the advertising mail they receive.
21% more likely to have switched a supplier as a result of mail.
It could be that mail is a relative novelty for this group and so stands out as a more
distinct or different way for companies to communicate with them. Our Mail and Digital
research supports this, showing that while 65% of the general population look
forward to finding out what’s in their daily post, the figure for 18-24 year olds is 75%.8
29%
24%
Brochure from a company I have ordered from before
25%
Average of 23% of mail shared
within a household23%
Letter – about a product/service they don’t have
22%
21%
Leaflet without an address about a promotion/offer
17%
SHARE
Statement, bill or information update
Letter – promotion or special offer
Brochure from a company not ordered from before
Leaflet without an address about a product/service
SHARING MAIL WITHIN THE HOUSEHOLDProportion of different kinds of mail that are shared between members of a household.
Source: Royal Mail MarketReach, Ethnographic Quant, Trinity McQueen, 2014

18
Encouraging sharing of mail among this group could therefore have a significant
impact on the number of people you might reach with a piece of mail.
Video material from our ethnographic work illustrates all of these principles. We can show
examples of participants:9
Referring to their mail several times during the day.
Spending seven uninterrupted minutes interacting with a mail delivery
(IPA Touchpoints has shown that people spend on average a total of
22 minutes across the day reading their mail).
Sharing and discussing the day’s mail delivery, and deciding what they will
act on later.
Taking time out to discuss properly that day’s mail with other family members.
Taking us on an extended tour through their household showing us the many
places where they keep and display mail, for lengthy periods of time.
CONCLUSION
Mail brings a brand into the home and into close proximity with the people living in
it. As it flows through the household, a single piece of mail can represent multiple
opportunities for people to engage with a brand, reminding them of it, reinforcing its
values, and ultimately becoming part of everyday life.
9. Royal Mail MarketReach, Media Moments, Trinity McQueen, 2013

“ IF THERE’S A BETTER WAY TO TALK TO PEOPLE, I’LL EAT MY HAMSTER.”David Robinson – Sales & Marketing Director, The Sun
MAILMEN.co.uk

20
CREATING AN EMOTIONAL RESPONSE
Starting point
Humans react instinctively to their environment. So if mail has a bigger presence
in that environment than previously thought, then it may have a more profound
effect on our emotional reactions. This is a central driver of the power of mail as
an advertising medium.
What we learned
The physical nature of mail triggers largely subconscious responses that are
based around deep, scientifically established, psychological instincts. This explains
why people actually respond to mail more positively than their stated attitudes
might suggest.
Supporting evidence
Behavioural marketing experts, Decode, scanned recent academic literature for us to
see what had been discovered about the importance of touch in human psychology.
They demonstrated that there are strong reasons why getting consumers to engage
physically with a brand is likely to have a strong effect on them.
Multisensory stimulation seems to alter the way the brain processes messages – often
making processing quicker, which is key for driving emotional response to messages
or brands.
Physical contact results in the Endowment effect – a sense of ownership over an item,
which translates into an individual valuing it more highly. Scientific experiments have
shown that people value something they can see and touch 24% more highly than
something they can only see.
MAIL IN THE HEART

21
2.75 2.73
3.36 3.38
Psychological ownership
Valuation
7
6
5
4
3
2
1
VISION ONLY VISION AND TOUCH
DEMONSTRATION OF THE ENDOWMENT EFFECTParticipants were asked to subjectively grade ownership and value on a 7-point scale.
Our own research confirms that mail gains an advantage from this increased valuation.
Part 1 of our Mail and Digital work showed that mail offered a sense of gravitas and,
crucially, value to recipients.
+22% +24%
Source: Peck, Joann, and Suzanne B. Shu. The Effect of Mere Touch on Perceived Ownership.
Journal of Consumer Research, 2009
22
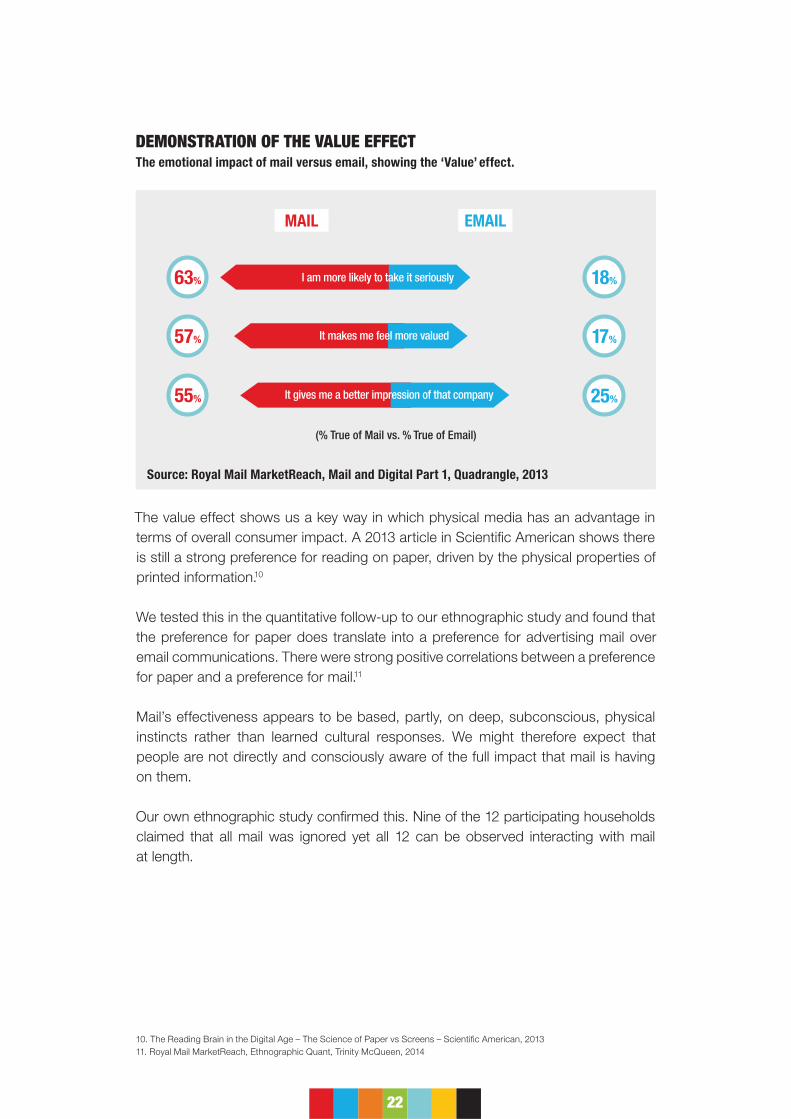
DEMONSTRATION OF THE VALUE EFFECT The emotional impact of mail versus email, showing the ‘Value’ effect.
63%
57%
55%
18%
17%
25%It gives me a better impression of that company
I am more likely to take it seriously
MAIL EMAIL
It makes me feel more valued
(% True of Mail vs. % True of Email)
10. The Reading Brain in the Digital Age – The Science of Paper vs Screens – Scientific American, 2013
11. Royal Mail MarketReach, Ethnographic Quant, Trinity McQueen, 2014
The value effect shows us a key way in which physical media has an advantage in
terms of overall consumer impact. A 2013 article in Scientific American shows there
is still a strong preference for reading on paper, driven by the physical properties of
printed information.10
We tested this in the quantitative follow-up to our ethnographic study and found that
the preference for paper does translate into a preference for advertising mail over
email communications. There were strong positive correlations between a preference
for paper and a preference for mail.11
Mail’s effectiveness appears to be based, partly, on deep, subconscious, physical
instincts rather than learned cultural responses. We might therefore expect that
people are not directly and consciously aware of the full impact that mail is having
on them.
Our own ethnographic study confirmed this. Nine of the 12 participating households
claimed that all mail was ignored yet all 12 can be observed interacting with mail
at length.
Source: Royal Mail MarketReach, Mail and Digital Part 1, Quadrangle, 2013

23
12. Royal Mail MarketReach, Ethnographic Quant, Trinity McQueen, 2014
13. Royal Mail, Roamler, 2011
This was confirmed in the quantitative follow-up. When asked about attitudes to
advertising mail 62% claimed to reject it outright. Yet when asked about what
they had actually done with the mail in their homes at the time of the survey, 64%
had opened a piece of mail that day, and the majority who did went on to interact
with it.12
83% 69%Statement, bill or information update
71% 56%Brochure from a company they have ordered from before
69% 55%Letter – promotion or special offer
60% 43%Letter – about a product/service they don’t have
59% 43%Leaflet without an address about a product/service
54% 43%Leaflet without an address about a promotion/offer
54% 43%Brochure from a company not ordered from before
INTERACTOPEN
OPENING AND INTERACTION RATES FOR DIFFERENT KINDS OF MAIL
This supported work Royal Mail had undertaken previously, where we demonstrated
a strong disconnect between consumers’ stated attitudes to mail and what they
actually do. In 2011, we asked individuals to take photos of the mail they had around
the house before discussing it within our research. Most participants who said they
throw such mail straight in the bin actually had pictures of mail stored in their homes.13
So what are the unconscious effects that these interactions are having on consumers?
Our Tactility research shows that handling physical items – particularly when they
include impactful tactile effects such as unusual shapes and textures – changes the
way that people instinctively talk about an item.
Source: Royal Mail MarketReach, Ethnographic Quant, Trinity McQueen, 2014
‘Interact’ is defined as having read, kept or acted on an item.
Interaction rates are shown as a percentage of overall population rather than those who opened items.

24
When asked to talk unprompted about the mail they had been given in the Tactility
research, analysis of participants’ language showed two linked effects:
Participants used a wider range of words to talk about the items and were more
animated and creative in the way they described them.
The words used were more emotional and less functional, focussed on the
qualities of the piece and the sensations it evoked about the brand rather
than the exact nature of the offer.
Respondents were uniformly more demonstrative overall and used more strongly
emotional terms.
14. IPA Touchpoints 5, 2014
This suggests that mail is good at creating instinctive emotional associations with
a brand, which is perhaps why in the most recent data from the IPA’s Touchpoints
survey, 38% of respondents said that the physical properties of a mail piece will
influence how they feel about the sender.14
Least ‘tactile’ (low weight paper, no variance in texture or shape)
Most ‘tactile’ (foil blocking, textured paper, UV spot photography etc.)
Piece A
(Online retail)
Piece B
(Travel)
Piece C
(Leisure)
TESTING TACTILITY Comparison of descriptive words used with lower and higher physical production values.
Source: Royal Mail MarketReach, Tactility, Trinity McQueen, 2013

From our own ethnography research we have video evidence illustrating how
the tactile nature of mail can transmit brand values. In videos, participants openly
discussed how layout and paper quality affected how they felt about the sender.
One in particular admitted that they would irrationally choose a more expensive
service provider based on the quality of their mailing.
CONCLUSION
Studying the rates at which people open and interact with mail, we can see that it is
much more effective than consumers’ stated attitudes would suggest. It creates an
instinctive sense of value being exchanged between the sender and recipient, which
the latter may not be aware of. It drives stronger emotional associations with a brand
when its physical nature is used creatively to communicate its values.
Elspeth Lynn – Executive Creative Director, M&C Saatchi
“ A GREAT IDEA CAN COME FROM ANYWHERE, INCLUDING THROUGH THE LETTERBOX.”
MAILMEN.co.uk

26
MAIL IN THE HEAD
IMPACT ON THE BRAIN
Starting point
Given that mail generates a response based on deep physical instincts, its impact
should be strongly visible at a neurological level. This should be true regardless of the
demographic details of the respondent, or their stated attitudes to mail.
How we did it
To measure mail’s impact on brain activity, much of which we felt to be subconscious
in nature, we decided to use an innovative neuroscience technique called Steady
State Topography (SST).
Well established in academic circles, but relatively new to market and media
research, SST’s key measures (engagement, emotional intensity and long-term
memory encoding) are known to strongly relate to the immediate/pre-rational
processing we wanted to assess. The measures are also proven to lead directly to
commercial outcomes.
However, in order to create as neutral a setting as possible for measurement of media
consumption, SST does require very careful research design and implementation.
We therefore took all the necessary steps recommended by the technical experts.
These steps are outlined in the appendix to this report.
In the wider context of our understanding about how the brain processes advertising
messages, we also looked to confirm that our new findings made sense. We checked
all our findings with previously published scientific literature, as well as elements of our
previous research.

27
What we learned
We can see a strong and universal response to mail when directly measuring brain
response. At a high level, mail has a much more powerful overall impact on the key
measures of the neuroscience project than email or TV.15
15. Royal Mail MarketReach, Neuro-Insight, 2013
16. Royal Mail MarketReach, Values: V2C Drives V2B, Quadrangle, 2014
MAIL EMAIL TELEVISION
168
202
172
127
165
130
105113
100
Engagement Emotional Intensity
Long-term Memory Encoding
250
200
150
100
50
0Inde
x vs
. ‘no
rmal
’ res
ting
brai
n
NEUROLOGICAL RESPONSESOverall measures of neurological responses to mail, email and television in the neuroscience study.
While different indicators are stronger for different age groups, overall the effect
remains strong regardless of age. This suggests that the effects we are seeing may
be both biologically and culturally determined and therefore potentially universal.
Based on this, we would expect mail to be capable of producing a wide range
of emotional responses. When we asked consumers to describe how they felt
about mail that had been particularly useful, their response went far beyond the
purely functional.16
Source: Royal Mail MarketReach, Neuro-Insight, 2013

28
48%
66%
48%
45%
43%
41%
40%
39%
Better informed
Understands what interests me/is relevant
Tempted
Happy
Reassured
Intrigued
Pleasantly surprised
Valued by them
REPORTED POSITIVE EMOTIONAL RESPONSES TO USEFUL MAIL
We also compared participants in the neuroscience study who agreed that they
were happy to get advertising mail and those who said they were unhappy to do so.
The differences in engagement and emotional intensity between these groups when
looking at mail were not statistically significant.
Levels of long-term memory encoding were actually found to be slightly higher
among those who said they actively reject advertising mail. This is perhaps because
all participants were given the choice of whether or not to open the mail they were
presented with. Those who dislike mail may be more selective about what they
choose to engage with so will focus more closely on what they do open. This confirms
at a neurological level what we’ve seen in the ethnographic and other research –
consumers stated attitudes and their actual responses are very different.
Source: Royal Mail MarketReach, Values: V2C Drives V2B, Quadrangle, 2014

29
Multisensory learning and the cognitive miser hypothesis
So why are consumers’ brains reacting in such a uniformly positive way to advertising
presented in a physical medium?
A review of published scientific papers uncovered for us by behavioural marketing
experts Decode suggested, that part of the answer might be because stimulating
more than one sense speeds up the brain’s ability to process information.
This is a well-studied and established effect. In a 2008 experiment, participants were
given a memory task with either visual cues only, or visual cues accompanied by
sound. It took up to 60% less time to reach peak performance in this task when
both senses were activated than when visual stimulus alone was used.
ATTITUDES TO RECEIVING MAILDifferences in response between those who said they enjoyed receiving mail (Happy), those
who did not mind it (Accept) and those who claimed to actively reject it (Reject).
161
216
170165
195
155
183197 197
Engagement Emotional Intensity
Long-term Memory Encoding
250
200
150
100
50
0Inde
x vs
. ‘no
rmal
’ res
ting
brai
n
HAPPY ACCEPT REJECT
Source: Royal Mail MarketReach, Neuro-Insight, 2013

30
The same applies to touch. In a 2007 paper, two different groups of participants
undertook a memory task involving vision and touch. When tactile signals were added
that matched the visual patterns shown to the participants, learning performance
improved considerably.17
We saw a similar effect in our Tactility research, which also included a neuroscience
element.18 Our methodology focussed on measuring the amount of effort taken to
absorb the information on a piece of mail (cognitive load) and the difficulty involved in
assimilating that information (frustration).
17. Ernst – ‘Learning to Integrate Aribtrary Signals from Vision and Touch’, Journal of Vision, 2007
18. Royal Mail MarketReach, Tactility, Trinity McQueen, 2013
MULTISENSORY VS. UNISENSORY LEARNING
Perc
ent c
orre
ct
Portion of session %
85
80
75
70
20 8050
MULTISENSORY LEARNING UNISENSORY LEARNING
Source: Shams and Seitz – Benefits of Multisensory Learning
– Trends in Cognitive Science, 2008

31
19. http://www.psychwiki.com/wiki/Cognitive_Miser
20. TGI Kantar Media, 2014
21. Royal Mail MarketReach, Values: V2C Drives V2B, Quadrangle, 2014
As the pieces of mail became more stimulating, the amount of cognitive effort spent
on them dropped. This fits with known research about how brands work overall – the
brain prefers not to use too much effort in assessing a situation, and we are primed to
feel pleasure when we are able to grasp a message without a great deal of conscious
effort. This is called the cognitive miser hypothesis.19
Brands exploit this effect by developing associations with certain values and attributes
that can be grasped quickly. It appears that the tactile effects of mail do something
similar by speeding up the absorption of messages.
This may be what makes advertising mail so memorable. In Kantar Media’s TGI survey,
80% of respondents said that they can remember seeing or reading some mail sent
to them in the last four weeks.20 And when we asked about the effect of really good
advertising mail, 60% said that it helped to keep the sender’s brand top of mind.21
Mail’s interaction with other channels
Given that mail allows consumers to swiftly form and retain brand associations, we
should reasonably expect that it has a halo effect on brand messages in other media.
Our neuroscience work reveals how mail interacts with other channels. We found
evidence of TV having a priming effect on mail. Those seeing mail after a TV ad
are more strongly stimulated on the key SST measures of engagement, emotional
intensity and long-term memory encoding.

32
MAIL’S INTERACTION WITH OTHER CHANNELS Comparison of overall stimulation depending on order of media – mail seen after exposure
to TV and/or email has a stronger global effect.
It is possible that prior knowledge of a brand gained through other advertising
media enhances the quick learning effect of mail’s multisensory attributes, and thus
the associated pleasure gained from the cognitive miser effect.
However, we also found an effect when the sequence is reversed and TV advertising
is seen after mail. Participants appeared to be more strongly stimulated at specific
moments in a TV ad that resonated with the creative message or the offer they had
seen in the mail piece.
Engagement Emotional Intensity
Long-term Memory Encoding
100 100 100
112
101
106
126
121
110
130
125
120
115
110
105
100
95
90
85
80
0Inde
x vs
. res
pons
e fr
om fi
rst e
xpos
ure
MAIL SEEN FIRST MAIL SEEN SECOND MAIL SEEN THIRD
Source: Royal Mail MarketReach, Neuro-Insight, 2013

33
Seen first
High activity
Low activity
Seen last
THE EFFECT OF MAILComparison of the effect of the call to action in a TV ad before (top) and after (bottom) exposure
to a similarly branded mail stimulus.
In this case, it’s possible that the combination of the dual-sensory stimulus of mail and
its impact on long-term memory has more effectively pre-loaded brand associations.
This in turn triggers a swifter and less consciously demanding response to relevant
moments in the TV advertising. This suggests that mail sent out during the run of a TV
campaign could enhance its impact, by priming the viewer to associate more strongly
with the ad and drive a better response.
CONCLUSION
By all measures, mail has a profound effect on the human brain. It is effective regardless
of demographic indicators and stated attitudes. Mail clearly has a strong interaction
with other media, which can be exploited to boost overall campaign effectiveness.
Source: Royal Mail MarketReach, Neuro-Insight, 2013

34
MAIL IN THE WALLET
MAIL MAKES MONEY
Starting point
We have seen the role mail plays in consumers’ homes and how it impacts positively
on the hearts and heads of consumers.
What our research also shows is that mail is highly effective at delivering ROI.
Performing not just in terms of sales and direct response, but also on a number of
other metrics, including incremental reach, efficient growth of market share, brand
switching and cost per new customer acquisition.
Mail also helps in getting new audiences to engage and respond so it can make a
significant difference when integrated into multi-channel communications planning.
It is important to demonstrate the impact mail has on the full range of marketing and
communications measures and to see how these lead to tangible business results.
How did we do this?
We looked at evidence from three key studies:
BrandScience 2014: a meta-analysis of advertiser econometric models (401
cases, each representing one year with an average of three campaigns per year).
IPA Databank 2013: a meta-analysis of the IPA Effectiveness Awards Databank
conducted by marketing effectiveness consultant Peter Field (416 client cases).
The Salvation Army case study 2014: The Salvation Army and Mike Colling &
Company (MC&C) provided analysis of IPA Effectiveness Award (Silver, 2014) case
study. The Salvation Army with MC&C also won a DMA Award (Gold, 2011).

35
Measurement of communications in the post-digital world
With the increasing incorporation of the digital world into the everyday customer journey
the ability to allocate response/sales to media channels accurately has changed.
Advertisers were previously able to measure response to individual channels, such as
mail and other offline channels, by phone or postal returns, to estimate and predict
KPIs such as ROI, cost per acquisition, and cost per sale. This was possible because
post and phone were the available methods of response, aside from buying in store.
The internet changed this behaviour and is now completely integrated in the customer
journey. The way people use devices such as smartphones in their daily lives has again
changed how and when they access and use the internet – and this will continue
to change. People use their smartphones and laptops whilst watching TV – and in
shops. People can immediately research a product, wherever they are, and in some
cases buy in one click. Direct marketers have identified long ago that the easier a
process, the higher the response. Often digital behaviour is the last action, a clearly
identifiable part of the process, though generated by offline media.
MAIL DRIVES CUSTOMERS ONLINEAnd mobile is making it easier than ever for people to do this.
54%
86%87%92%
engaged in social media
connected with business
influenced to make online purchasesdriven to online or
digital activity
43%download something
AS A DIRECT RESULT OF
RECEIVING MAIL
Source: Royal Mail MarketReach, Mail and Digital Part 2, Quadrangle, 2014

36
As people have changed their media behaviours in response to mail, it has been
increasingly important to understand how to measure accurately the effect of
channels, both individually and working together (‘the media multiplier’ effect).
The media multiplier effect recognises that there is a point of diminishing returns
for each individual channel, i.e. when it becomes more cost effective for the overall
campaign to add a new channel. The new channel opens up new and unique
audiences, extending reach. With some of the audience now seeing the campaign
in more than one channel this positively impacts the returns from other channels
in the mix. We can refer back to the ‘priming’ effect seen in the neuroscience
research earlier.
Econometrics is one way of measuring and understanding the effect of multi-channel
campaigns and becomes available when there are sufficient data points to accurately
analyse. Setting up test and learn plans (using test vs. control techniques) can also
deliver an effective campaign analysis.
Particularly important is choosing to measure the KPIs which most relate to medium
to long-term gains.
Many of these universal principles are deployed in The Salvation Army IPA
Effectiveness Award winning five-year case study (Silver, 2014), included in the
next section.
In the studies discussed here, econometrics is a key part of how performance is
evaluated. We can discover some universal truths from the analyses by BrandScience
(100% econometrics analyses), IPA Databank (many used econometrics) and The
Salvation Army (econometrics).
What we learned
BrandScience: Mail ROI delivers top class results as well as having a media
multiplier effect on other channels for overall ROI boost
To look at revenue ROI, we commissioned BrandScience to interrogate their client
database of econometric results. They used 401 advertiser cases, of which 56
used mail and 42 door drops. (69-70% of the mail and door drop cases are from
2010 onwards).22 All of the mail/door drop cases, except for two, were multi-channel
and specifically covered these sectors: telecommunications, financial services, retail,
public sector, media and leisure/entertainment.
22. Royal Mail MarketReach, BrandScience, 2014

37
Each advertiser case covered one year of modelled data. There were over three
campaigns per year on average. The ROI figures in the BrandScience analysis were
calculated across a period of 3-6 months during and after each campaign. The
analysis uses RROI (Revenue Return on Investment23) which generally is referred
to as ROI.
Of the 56 cases using mail we found that mail and door drops did well versus other
channels, and both deserved to be included on schedules for RROI benefits alone.
The analysis showed that mail’s ROI performance is strong – broadly the same as
other primary media such as TV (not even 1% apart) and above that achieved by most
of the other media channels covered in the analysis.
Door drops also deliver excellent performance – around the same level as OOH
(out of home/posters) and above cinema and online display advertising.
23. The definition is Revenue over a given period divided by Investment (cost), so that if revenue = cost,
it delivers a break-even result of £1.00
PERFORMANCE OF CASES USING MAILMail RROI is strong, double some of the other media in the mix.
The average RROI across the 56 cases where mail is used and measured in the
BrandScience analysis.
Total
Commun
icatio
nsPri
nt
Search TV Mail
Radio
Out-of-
home
Door d
rop
Cinema
Online
disp
lay
8.00
6.00
4.00
2.00
0.00
£
Source: Royal Mail MarketReach, BrandScience, 2014
RROI
(Rev
enue
ROI
)

38
THE BRANDSCIENCE META-ANALYSIS INDICATES MEDIA MULTIPLIER EFFECTS WHEN MAIL WAS INCLUDED ON A MULTI-MEDIA SCHEDULE
When mail was included in a plan, the total communications ROI jumped from £4.22
to £4.73 – a 12% increase.
The inclusion of mail showed increased ROI from campaigns using TV and print.
This is in line with our neuroscience work where we saw a strong interaction
(and priming effect) between mail and TV.
Including mail, however, delivers more than just ROI.
The IPA Meta-Analysis Databank 2013: Clients who included mail in
multi-channel activity delivered market share growth with broadly
three times more efficiency than non-mail clients
While the BrandScience analysis focussed on ROI, we also wanted to confirm that mail
delivered on other commercial measures. To be considered for the IPA Effectiveness
Source: Royal Mail MarketReach, BrandScience, 2014
Advertiser cases including mail versus cases without mail.
Total RROI jumped when mail was included
4.634.22
4.934.73
Total Communications Print
7
6
5
4
3
2
1RROI
TV
5.58
6.31
RROI-NO MAIL RROI-WITH MAIL
£

39
Awards, advertisers needed to submit data on a wide variety of metrics. So we asked
marketing effectiveness expert Peter Field to analyse the 416 cases within the IPA
database and compare the metrics between campaigns that use mail and those
that did not.
It is widely known that the impact of advertising campaigns on market share is
influenced by a brand’s existing market share. To accommodate this, Peter Field
related growth to a widely accepted metric – Excess Share of Voice (ESOV), which
relates advertising spend to a brand’s current share of market.24
ESOV has been widely validated as a key driver of effectiveness. If it is positive then
brands have an opportunity to grow in market share. If negative, brands’ market
share tends to shrink. To make things equal by eliminating the effect of different
budget levels, Peter looked at the rate at which market share growth increases
as ESOV increases: the more strongly ESOV drives growth, the more efficient
the communications.
24. ESOV is defined as the percentage a brand’s communications spend represents of the total category communications spend
across all channels (Share of Voice – SOV) minus the percentage that a brand’s revenue represents of total revenue in that
market (Share of Market – SOM).
MAIL INCLUDED IN MULTI-CHANNEL CAMPAIGNS DROVE MARKET SHARE
GROWTH WITH 3x THE EFFICIENCY VS NON-MAIL ADVERTISERS
Market share growth for all clients
2.9xMarket share growth
for service sector
3.4x
Comparing market share growth per 10 Extra Share of Voice points (ESOV)
shows the increase in efficiency of advertising plans including mail.
Source: Royal Mail MarketReach, IPA Databank Meta-Analysis, Peter Field, 2013

40
We can say that mail included in the media mix shifted share of market broadly three
times more efficiently than multi-channel plans without mail. That’s efficient.
To put this into equivalent terms, a brand spending the same amount of money on two
campaigns would experience three times the amount of share growth from one that
included mail than one that did not.
To confirm that this positive finding was not influenced by other factors, Peter looked
deeper into the IPA Effectiveness Awards Databank. He identified that the campaigns
including mail were almost identical to the ones without in terms of campaign duration,
relative budget size, performance in winning creative awards, category dynamics
(growing, static, declining) and pre-campaign market share.
Moving beyond ESOV and market share growth to look at Sales and Acquisition
performance, Peter’s analysis of the IPA Effectiveness Awards Databank identified
that campaigns including mail were 27% more likely to deliver top-ranking sales
performance and 40% more likely to deliver top-ranking acquisition levels than
campaigns that didn’t.
USING MAIL IN CAMPAIGNS DELIVERS HIGH SALES AND ACQUISITION PERFORMANCE
45%
30%
57%
42%
Sales Acquisition
60%
50%
40%
30%
20%
10%% C
lient
s lis
ting
top
perf
orm
ing
impr
ovem
ents
+27% +40%
RROI-NO MAIL RROI-WITH MAIL
Source: Royal Mail MarketReach, IPA Databank Meta-Analysis, Peter Field, 2013

41
Earlier we demonstrated, using neuroscience, how mail drives long-term memory
encoding and showed using both neuroscience and econometrics meta-metrics,
the positive effects of using channels such as TV and mail together.
Our work with Peter Field looking at the IPA Effectiveness Awards Databank has shown
the importance of ESOV in driving brand growth and the positive impact mail can have.
Large established brands have an existing ‘familiarity factor’ that can help boost
communications effectiveness. They are visible in consumers’ homes, prominent
across a wide range of retail outlets and easily remembered by consumers.
Our ethnography work has shown that mail can make a brand a persistent physical
presence in the home. Advertising mail is kept (for 17 days on average), shared
and displayed – all key attributes that help to grow and maintain familiarity. In order
to better understand how mail does this, we sourced studies showing the link
between successful advertising (as identified by clients’ own metrics) and the level
of memory encoding.
Memory encoding has been shown to be a key indicator of overall advertising
effectiveness. As part of their work with Thinkbox, Neuro-Insight also made use of
the IPA Effectiveness Awards Databank, looking at the response elicited by strongly
performing campaigns across nine product categories.
With a single exception of one category (chocolate), those TV campaigns performing
higher than average in terms of effectiveness were also those that scored highly on the
key neuroscience measures of long-term memory encoding and emotional intensity.
A similar conclusion was reached in a study carried out by a group of academics in
association with Mars Food. They compared the performance of different pre-test
approaches on a sample of ads with known sales differences. This showed that the
greatest correlation with actual sales performance was brain response, specifically
the activity of areas of the brain related to memory. In contrast, more conventional
measures such as brand recall, recognition and likeability achieved low correlation
to actual sales.
We performed an experiment in our own neuroscience research to understand more
about switching behaviour. The subjects in the study were offered a prize draw, with
the prize being a day at a spa. They were asked for their choice of spa up-front.
We gave half of them a mail pack, and the other half an email, for Knighton Grange
spa, which is a fictitious brand. Afterwards, we explained we had lost their choice of
spa and asked them again to identify their choice. 17% of mail recipients switched
their choice to Knighton Grange, but only 2% of email recipients did so.25
25. Royal Mail MarketReach, Neuro-Insight, 2013

42
Those respondents who switched their prize choice to Knighton Grange showed
considerably higher levels of engagement and long-term memory encoding towards
the end of the time they spent looking at the mailer. This period is associated with
browsing the brochure rather than looking at the exterior or reading the letter –
this is what impacted switching behaviour.
In conclusion, mail was powerful enough to overcome the total unfamiliarity of a
fictitious brand. The implication is that in markets where new customer acquisition
is primarily a result of customers switching between brands, mail has a potentially
significant role to play.
Pre-event baseline
First 30 seconds
Next 30 seconds
KNIGHTON GRANGE SWITCHERS
Engagement
Memory Encoding
1.60
1.28
0.96
0.64
0.32
0.00
1.60
1.28
0.96
0.64
0.32
0.00
15.0
15.0
30.0
30.0
45.0
45.0
60.0
60.0
75.0
75.0
0.0
0.0
NON-SWITCHERS – ENGAGEMENT SWITCHERS – ENGAGEMENT
SWITCHERS – MEMORY ENCODING NON-SWITCHERS – MEMORY ENCODING
Source: Royal Mail MarketReach, Neuro-Insight, 2013

43
26. Royal Mail MarketReach, Mail and Digital Part 1, Quadrangle, 2013
27. Royal Mail MarketReach, Mail and Digital Part 1, Quadrangle, 2013
Royal Mail MarketReach, Mail and Digital Research:
Mail delivers messages to new audiences
Adding mail to the mix delivers new responsive audiences. This is not just from
media multiplier theory. Royal Mail MarketReach research shows us that different
people like to be communicated through different channels at different points in the
customer journey.
For example, in our Mail and Digital Part 1 survey, we found that 51% of people
prefer companies to use a combination of mail and email.26 Including mail as
another direct marketing element of a campaign therefore engages a larger group
of customers than if you used email alone.
Add this to the 17% who indicated that they wanted businesses to contact them by
mail alone, and we have 68% of consumers looking for some communication by mail.
So it’s no surprise that when mail is added to an email campaign, with a longevity
and impact higher than that of email, we could identify that 13% more consumers
visited the sender’s website, 21% more consumers made purchases and 35% more
consumers redeemed coupons or vouchers.27
more consumers visited sender’s website
13%more consumers made purchases
21%more consumers
redeemed coupons or vouchers
35%
ADDING MAIL TO THE MIX OPENS UP NEW RESPONSIVE AUDIENCES
When compared to using email on its own
Source: Royal Mail MarketReach, Mail and Digital Part 1, Quadrangle, 2013

44
CONCLUSION
The behaviour we’ve seen mail generate has a measurable effect on the way people
respond to brands and the value generated for clients. Mail is effective across a wide
range of metrics – return on investment, efficient growth of market share and real
cost of acquisition for new customers. It’s a key way to open up new audiences
(including amongst your current customers) that would otherwise be missed. Mail is
therefore especially important to multi-media schedules. Overall, campaign ROI can
be increased by sequencing mail with TV or other media to best advantage.
The incorporation of digital behaviour in consumers’ lives means that new ways of
measurement are increasingly important to identify and attribute the real value of mail
as people respond and buy increasingly online.

Robert Senior – WW CEO, Saatchi & Saatchi
“ CHARMING. PERSUASIVE. MOTIVATING. AND FOR ONCE I’M NOT TALKING ABOUT MYSELF .”
MAILMEN.co.uk

46
THE SALVATION ARMY CASE STUDY
THE SALVATION ARMY: AN AWARD-WINNING MULTI-MEDIA CASE STUDY
The Salvation Army, working with Mike Colling & Company (MC&C), increased volume
in both mail (2.7x) and door drops (1.6x) over five years. By integrating mail with digital
and broadcast media, and by accurately attributing results and understanding the
roles each channel plays in the media mix, MC&C increased their clients net income
and profitability.
MC&C were awarded at the IPA Effectiveness Awards (Silver, 2014), to follow their
DMA Award for Media Strategy (Gold, 2011).
In 2007, The Salvation Army had market-leading but declining returns on their control
mix of mail, door drops, press and inserts. So in 2008, the organisation set itself a
challenge: to significantly grow the volumes of new donors they recruited. As a charity
they needed to do so profitably, and to ensure the volume of net income generated
over five years also grew significantly.
Judged to be one of the most compelling cases entered into the IPA Effectiveness
Awards, it clearly illustrates some of Royal Mail’s research findings in action.

47
The original campaign
From 1987 to 2007 the charity relied on a six-week burst of activity running up to
Christmas to recruit its new donors. They used only print media: mail, door drops,
press and inserts.
The first changes
In 2008 and 2009 they started to test a different model, adding both broadcast and
digital media to their media mix. Broadcast was designed to increase the reach of
the total campaign, and digital media to provide an additional response channel for
donors. In both years they saw successful increases in numbers of donors recruited.
In 2009 they also noticed that response from mail and door drops, which had been in
decline for years, had increased.
Structured insight
By 2010 they saw a step change in online income, it had quadrupled in just four years.
With just a few thousand pounds invested in search it was clear that online activity
was not driving this income.
Mail/door drop
Mail’s big increase:
since 2010
Online response up 595%:
DM key driver
Cold mail increased:
270% to 5.4m
Door drops increased:
158% to 9.6m
Total Campaign
Volume of new donors:
262% up to 131k
Campaign spend:
221% up to £4.1m
Cost per new donor:down 16% to £31.96
Incremental income:
£9.5m short term, £24.8m over 5 years
The Salvation Army: Mail/door drop integral to total campaign
success in more than doubling new donors efficiently
2012 compared to 2007 base
Note: Mail/door drop is 66% of 2012 spend
Source: The Salvation Army/Mike Colling & Company, 2014

48
To enable these digital donations to be attributed to the correct offline channels, and to
understand the relationships between the channels used, they turned to econometrics.
Once the understanding of this model had been achieved, MC&C turned to the
challenge of exploiting its profitability. A planning tool was built, powered by the
econometric equations; enabling The Salvation Army to forecast income and donor
numbers from different investment scenarios. This tool showed mail and TV driving
online response, with strong positive interactions between the two.
This is a very practical illustration of the learning from our neuroscience research that
TV primes people to engage when prompted by mail and vice versa.
It also identified the true value of both mail and door drops, and gave The Salvation
Army the confidence to increase investment in both mail and TV by circa £1,000,000 the
following Christmas. Their total new donors and net income both reached record levels.
The Salvation Army’s findings not only matched Royal Mail MarketReach research
but also reinforced the learnings from the IPA Databank. The 2014 IPA Effectiveness
Award case study highlights:
1. The effectiveness of combining acquisition of new customers with activation
of existing customers.
2. The benefit of significantly increasing advertising investment, along with the
continued effectiveness of TV.
3. The dangers of focusing too strongly on ROI as the key metric, rather than
targeting to maximise the absolute net income generated from marketing.
These are old lessons, but worth revisiting.
The paper also created surprising new learnings, specifically around the role of mail
in a digital age:
That mail can be the most effective channel in an integrated multi-channel schedule.
That integrating mail with both broadcast and digital media enables incremental
value to be realised from both new and existing customers.

49
In the years from 2005 to 2007, the cost of donors recruited via mail rose by 20%.
Between 2008 and 2012, cost per new donor fell by 16%, whilst the number of new
donors recruited grew from 50,000 to more than 136,000.
MC&C attribute this extraordinary improvement in results to the six key learnings
below, the most important of which is the integration between mail, broadcast media
and search.
LEARNING 1: PLAN CHANNELS TOGETHER, WITH RECOGNITION OF THE ROLE EACH PLAYS IN THE MIX
TV amplifies response to mail and door drops, and all drive people online. This supports
the general findings from the BrandScience research that there’s a multi-media
multiplier effect when including mail.
Deploy door drops to maximise effective reach and use addressed mail for precision
recruitment of new donors without wastage.
Press Inserts Search Door drop MailTV
100%
80%
60%
40%
20%
0%
DOOR DROPS FOR REACH; COLD MAIL FOR PRECISIONDoor drops mop up response; addressed mail finds new donors
69%
97%
49%52% 52% 55%
The chart above shows the percentage of new donors recruited by each media
channel. Door drops, with a reach of 37% of UK households in 2012 were seen
by both current and new donors, hence only 55% of donors recruited by the
channel were new. The donors delivered by mail were almost entirely new (97%) to
the organisation.
Source: The Salvation Army data, analysis by MC&C
% n
ew d
onor
s

50
The Salvation Army found that with heavyweight TV support, overall door drop
response was uplifted to a level where more of the UK could be targeted. By 2012
door drop volumes had increased by 158% compared with 2007, significantly
contributing to the overall volume gains in new donors and income.
LEARNING 2: ACCURATE AND EFFECTIVE MEASUREMENT IS REQUIRED TO UNDERSTAND THE VALUE OF MAIL
In The Salvation Army’s findings; mail, particularly mail to their current donors, was
a key contributor to the majority of their online income. Even donors in their sixties
chose to give online rather than by post or telephone.
If response had been measured by simple linear attribution (especially by last click
attribution), £900,000 of The Salvation Army’s income in 2012 would have been
allocated to digital rather than offline channels. The investment in offline media, under
pressure in 2008, would not have grown without offline to online attribution, and
The Salvation Army would not have seen the rise in their income.
Accurate attribution is particularly important for mail. Mail is kept in the house for
long periods, and consequently is responded to over a longer period than many
other channels.
LEARNING 3: CHOOSE MEASUREMENT KPIs CAREFULLY
KPIs determine your channel mix
If The Salvation Army had allocated budget purely by year one ROI, they might
have reconsidered using mail. Mail can struggle to perform strongly in the short
term due to its high cost per contact compared with other channels. The adult
cost per thousand of mail for The Salvation Army was nine times more expensive
than TV.
What drove success here was the alignment of measurement KPIs with objectives.
The primary objective for The Salvation Army was the recruitment of new donors.
These are the lifeblood of any charity, as they can be the source of many years
future income.

51
Mail performed poorly on year one ROI due to high costs per contact, but was the
most efficient generator, and the largest volume source of net new donors. The
individual level targeting inherent in the channel meant 97% of new donors recruited
by mail were new to the organisation, compared with an average of 50% from
other channels.
As a result, mail gave the best cost per new acquisition of all channels apart from
paid search (brand and advertising terms only, no generic search). Other channels
generated income from current donors as well as from new ones; an expensive way
of achieving this.
And KPIs determine your total investment levels
Had The Salvation Army allocated budget based purely on year one ROI then they
might not have created the volume of growth they enjoyed over five years.
MC&C notes that they had to sacrifice some short-term ROI over time (particularly
in regard to TV) in order to dramatically increase the new donor base and achieve
greater net growth in income. They reference IPA Databank work and Tim Ambler
Door drops TV Inserts Radio Mail Paid search
Press
£140.00
£120.00
£100.00
£80.00
£60.00
£40.00
£20.00
£0.00
£122.89
£57.54 £56.37 £52.80
£31.88£22.53
£2.08
Source: MC&C/The Salvation Army, 2010
COST PER NEW DONOR BY CHANNEL
Cost
per
new
don
or

52
of London Business School, who warn of relying on ROI, since it can be increased
simply by decreasing spend, which may well not be in the interest of driving growth.
They note that ROI always needs to be reviewed in the context of absolute levels of
marketing payback, as demonstrated in this case.
The four KPIs set, agreed and measured were:
1. Volume of new donors (not just donors who were prompted to give again by
other channels).
2. Value of each new donor over the next five years (this varies by channel and
other advertisers might use net income over a five year period).
3. Cost per new donor recruited.
4. Year one ROI (targets set).
The chart below shows the result of this clarity of objectives and measurement
in mail over five years.
16,000,000
14,000,000
12,000,000
10,000,000
8,000,000
6,000,000
4,000,000
2,000,000
0
£4,000,000
£3,500,000
£3,000,000
£2,500,000
£2,000,000
£1,500,000
£1,000,000
£500,000
£0
2007 2012
COLD MAIL INCOME COLD MAIL VOLUME
VOLUME GROWTH IN MAIL DROVE HIGHER NET INCOME
Source: The Salvation Army year on year giving comparison, 2007-12

53
It’s worth noting that these changes were developed across five years using tried
and tested direct marketing techniques. Changes were made within a controlled
test matrix, allowing a radical increase in marketing spend to be delivered with
minimal risk for a conservative organisation.
LEARNING 4: TAILOR THE CREATIVE TO THE INDIVIDUAL
Not all donors are equal, either equally wealthy or equally prepared to give at Christmas.
The Salvation Army deployed different messages to different groups: both to new
donors and to donors who have supported them for many years. One element of the
messaging strategy is the donation prompt, or how much they ask people to give them.
A simple example of this is shown below. If they ask for too much from donors who
give small amounts, donors tend not to give. Equally if they ask for too little from
people who will give more then an opportunity is wasted. So they ask from each
group an amount according to both their means and their behaviour.
The results show:
The higher value group were asked to give between £63-£168. This group achieved
an average gift of £164.
The lower value group were asked to give between £9-£28. This group achieved an
average gift of £19.
In both cases both volume and value of response was maximised.

54
LEARNING 5: DON’T SAY THE SAME THING OVER AND OVER AGAIN. IF YOU REPEAT MAIL THEN CONTINUE THE STORY
The Salvation Army mailed two packs to current donors at Christmas within three
weeks. By deploying a different creative, and not merely repeating the first letter,
the second pack generated an additional 40% response.

55
28. DMA Bronze Winner, 2012 Best use of Direct Mail, WPN Chameleon, 2012
LEARNING 6: UNDERSTAND HOW CONSUMERS BEHAVE WITH MAIL
Royal Mail’s ethnographic research has shown how mail is opened, read, shared and
displayed within the home.
The Salvation Army showed genuine understanding of these principles in their award
winning work.28 The pack had a headline on the outer to ensure it was opened.
The letters had copy with real depth to engage existing and potential donors.
Strong photography allowed the mail to act like posters within a household,
creating a mantelpiece reminder to drive response over time.
SUMMARY
Mail has created remarkable incremental value for The Salvation Army
“Mail, addressed and unaddressed, forms the absolute backbone of
The Salvation Army’s direct marketing fundraising operations.”
“It is the medium which quite literally changes lives by enabling us to raise
millions of pounds in donations to fund our community and social work.”
“Over the last five years, we have diversified and expanded our appeals and
acquisition programme as new media open up.”
“The ways in which people respond have changed too, but mail is still our
anchor medium to put The Salvation Army visibly on the doormat of many
millions of homes each year.”
Julius Wolff-Ingham, Head of Marketing and Fundraising, The Salvation Army
And established itself as a key player in the post-digital media world
“This case study reminds us of the role for mail in a modern media world. Like that
of Mark Twain, its death has been prematurely reported. Mail, both addressed and
unaddressed, has the unique capacity to generate more engagement, response
and income per thousand from consumers exposed to it than any other medium.
In these days of attention scarcity that’s a huge value to advertisers. When properly
integrated with broadcast and digital media its benefits are amplified.”
Source: The Salvation Army IPA Effectiveness Award entry, MC&C (Silver, 2014)

56
CONCLUSIONS
In a world that is changing so profoundly, business leaders and their marketing
agencies are grappling with two key questions:
How is digital technology changing the way consumers are buying my product
or service?
What does this mean for the effectiveness of the media I use?
After 18 months of research and analysis Royal Mail MarketReach is able to show
in unprecedented depth and detail how mail is used by consumers, what the
effectiveness of mail is and what value it can create as part of the media mix.
More importantly, we now understand why mail works the way it does. So brands not
only have the confidence to use or continue to use mail, but we can also equip them
with new insights into how to use it.
Our research confirms that mail delivers a strong ROI, similar in magnitude to TV.
However, The Salvation Army case study also demonstrates the limitations of using
ROI as the primary or only KPI and the risk this creates of incorrectly allocating
marketing investment. We have also highlighted the importance of offline to
online attribution, not just simple linear models such as last click. And we have
demonstrated the power of the media multiplier effect.
Looking at core measures of business value, we can see the positive and highly
efficient impact of mail on market share growth, sales, acquisition performance and
net income.
We can further link this performance to the ability of mail to engage new audiences,
and to promote specific behaviours such as brand switching.

57
THE BIG PICTURE
Integrating mail with broadcast and digital media enhances incremental value from
both new and existing customers. As good as this is to see, it’s even better to see and
understand the details that lie behind it.
From the moment it enters the home mail has an impact, not just on the individual but
on the whole household. Thanks to the way it is displayed and shared, people give
mail its own time and space. They have incorporated mail and reading mail into their
daily routines. And because mail gives brands the opportunity to enjoy an extended
life in the home, it can be a creative showcase to promote a brand’s values that will
be assured of multiple opportunities to be seen.
The physical nature of mail has always been one of its defining features, but as revealed
by our research, we can now appreciate the benefits this physicality creates for brands.
Neuroscience tests show the brain responds with greater emotional intensity to mail.
They also show the advantages it has over both TV and email for long-term memory
encoding. At a time when so many communications have migrated to the screen, the
value of touch has perhaps never been greater.
Consumers are receiving even more messages, even more often, so mail’s ability to
give the brain a faster way to process information is another reason why they prefer
it. It also explains why people are far more influenced by mail than they actually say
they are.
Above all, when marketing budgets need to achieve more for less, the ability of a single
piece of mail to have an enduring effect, to extend the brand reach, is a significant
finding. This endurance occurs in our homes, hearts and heads.
The conclusion is that mail can and should be used to deliver against a much wider
range of marketing objectives, including consideration and preference, not just direct
response. Digital has changed a great many things, including many of our behaviours,
but it hasn’t changed who we are or what we value. In a world of change, mail may just
be the medium whose strengths have never been greater, nor more needed.
58
APPENDIX
Details of the different research programmes
Our aim with this project was to use new, market-leading approaches to media
research to tell a powerful new story about mail. We therefore looked at some of the
most recently developed research methodologies and adapted them to the unique
nature of the medium.
Ethnography – consumers in their natural habitat
Ethnography encompasses a variety of research methodologies that are designed
to remove the active researcher from the equation, and observe individuals behaving
as closely as possible to the way they normally would. It has been effectively used by,
for example, Thinkbox, to catch consumers in the act of singing along to TV adverts.
In this case, our research agency used a combination of ethnography and more
traditional qualitative methods to observe behaviour around mail in 12 households in
Leeds and London. We covered as wide a range of life-stages as possible, looking at
three younger households without children, three young families, three older families
and three retired couples. In all cases the basic approach was similar:
Participants were given a specially designed welcome pack entitled ‘Media
Moments’, which explained that the project was about analysing how they
interacted with media. It did not specifically mention mail. They were asked
a set of screener questions intended to help us understand their attitudes
to media in general.
At the beginning of the project, researchers were embedded for a few hours with
each household, observing a morning and an evening routine.
Participants then had CCTV cameras set up in their main media room – typically
where the TV was. These were motion-triggered, and picked up over 800 hours
of footage.

59
After around a week of filming, the footage was collated, examined and edited
to find moments when consumers were interacting with mail and other media.
Finally, our researchers returned and conducted a more traditional qualitative
depth interview. At this point the true subject of the research was revealed.
Our participants were shown some of the footage we had taken of their
behaviour around mail and we investigated their thoughts about what they
were doing and why.
A typical CCTV camera set up in a participant’s home
Motion sensitive cameras are mounted on the tripod in the back right corner, on the
windowsill and on the coffee table.
Quantitative research – confirming the ethnography story
Via the ethnographic study we uncovered a wide range of behaviour around mail, some
of which was quite surprising. To confirm that these were genuinely representative
we investigated them with a UK-representative quantitative survey of 1,129 individuals
from an online panel.

60
One of the challenges we faced was that participants’ interaction with mail is mostly
subconscious, i.e. most of it is not consciously recalled. To get around this, the
survey asked people to refer to the mail they actually had in their homes on the day of
responding, asking them what they had done, rather than what they would do.
Neuroscience – a look inside the brain
Our neuroscience research was designed to investigate the findings that mail
should be having a strong and direct impact on brain activity, much of which could
be subconscious.
Neuroscience has been used in a number of ways to measure marketing effectiveness.
In this case we used the Steady State Topography (SST) methodology pioneered by
Australian research company Neuro-Insight.
SST requires participants to wear a light headset that transmits a signal to their brain
and measures response times. It measures how activated various areas of the brain
are – the quicker the response time, the higher the activation.

61
SST tracks a number of measures, but the three most strongly related to the immediate
and pre-rational processing of stimuli that we wanted to measure were:
Engagement
The extent to which the participant finds stimulus to be personally relevant to them.
Emotional intensity
How strongly the participant feels about the stimulus. This can be a positive or negative
sensation, either of which can create a positive commercial outcome (insurance
advertising, for example, can create a strong sense of worry and a need for security).
Long-term memory encoding
The extent to which the brain is storing the information it’s getting from the stimulus
for later use. A high score here doesn’t necessarily mean that the stimulus is actively
retained in memory, but similar subsequent stimuli are likely to trigger stronger recall.
In previous studies, all three of these measures have proven to lead directly to
commercially important outcomes such as a change in attitude to brands and/or
purchasing behaviour.
Although the use of SST to measure brain activity is well established in academic
circles since its discovery nearly 25 years ago,29 its use in market research is relatively
new, and there are a number of potential pitfalls that risk compromising the results.
Our methodology was therefore designed to ensure that results are real and that they
reflect the brain’s actual responses to media:
Statistical error is possible, as the raw readings of brain response can vary quite
widely. We therefore chose a large sample of 163 participants and took average
readings across the whole time individuals were exposed to stimuli. While this
approach masks some time-based effects (e.g. peaks in response to particular
scenes in TV advertising), it ensures that measures are robust.
Pre-existing bias towards the subject being tested will have a strong impact
on how participants respond unconsciously to stimuli. We therefore screened
participants to make sure they had neither unduly negative nor unduly positive
attitudes to mail.
29. Silberstein, R. B., Schier, M. A., Pipingas, A., Ciorciari, J., Wood, S. R. and Simpson D. G. (1990) Steady state visually evoked
potential topography associated with a visual vigilance task. Brain Topography 3: 337-347

62
To avoid priming participants, the screener questionnaire used included questions
covering attitudes to all media. Participants were not made aware that Royal Mail
was involved, or that advertising mail was the specific subject of the experiment,
until after research was completed.
Given the requirement for specialised measurement apparatus, it was important to
recreate the natural settings in which media are generally consumed. We took the
following steps to ensure that we replicated these settings as closely as possible:
Research was carried out in a home setting, using researchers’ homes in Leeds
and Croydon.
Participants were assessed in small groups of four rather than in large gatherings
as part of a ‘Hall Test’.
The stimulus material included mail, TV and email messages from clients
representing several different product categories.
Participants were asked to bring that day’s mail delivery from their homes.
Specific stimuli were mixed into these and they were then asked to deal with
the resulting mail in the way they normally would. They were not directed to
open or look at particular items. While this did mean that some participants
did not engage with all of the stimuli provided, open and read rates were
sufficient to maintain a statistically robust measure of response.
TV stimulus was transmitted as part of a commercial break in a popular light
entertainment programme (You’ve Been Framed) of a kind commonly used
to baseline TV responses in SST research.
Email stimulus was integrated into normal browsing behaviour. Participants were
asked to browse the web as they normally would and then check their emails.
Stimuli were sent directly to them during the experiment.

63
Tactility – understanding the meaning of physicality
Mail’s physicality is one of the things that make it unique. However, few studies have
been conducted to understand what that means or how advertisers can make it
work for them. To do this, we gave participants mail stimuli that contained the same
information and offers, only they were presented in different formats.
We had to be sure that we were only looking at the effects of tactility and not existing
brand perceptions, so we invented five new brands and created a mail campaign for
each one. Each campaign was printed in five separate versions with an increasing
investment in tactile production effects. These included heavier paper, foil blocking
and embossing and the use of differently textured elements in the item.
Participants were asked to discuss their reactions and likely responses to the item.
We also conducted some neuroscience measurements, this time focussing on
the overall amount of cognitive effort the participant had to make when dealing
with the mail.
TACTILITY STIMULI EXAMPLES – INVESTMENT IN PRODUCTION
VALUES INCREASE FROM LEFT TO RIGHT

64
Science Scan – understanding the underlying theory
To help us confirm that our results fitted with the bigger picture about how people
respond to both advertising messages and physical printed media, we asked
behavioural marketing specialists Decode to conduct a literature review, which
involved going through the published research in peer-reviewed scientific journals
that related to this subject. They looked at 1000+ papers.
This was collated into our Science Scan, an extensive document detailing the outcomes
of dozens of rigorous and professional studies into the effects of tactility and physicality
on the effectiveness of messages and their influence on mood.
BrandScience – econometric analysis
BrandScience are campaign analysts for Omnicom Media Group and other clients.
They specialise in Econometrics, in which statistical analysis is performed to
isolate the contribution of different factors, including media spend, to overall sales
performance over time. In August 2014 we asked them to perform a meta-analysis of
advertiser econometric models in their results vault – a record of data from thousands
of campaigns stretching back to 2001, to look at how mail has performed against
other media types.
For the analysis they looked at Revenue ROI (RROI – but generally referred to
as ROI) performance across nine media types – including mail and door drops.
They used 401 advertiser cases, of which 56 used mail and 42 door drops.
(69-70% of the mail and door drop cases are from 2010 onwards.) All of the
mail/door drop cases, except for two, were multi-channel and specifically covered
these categories: telecommunications, financial services, retail, public sector, media
and leisure/entertainment.
Each advertiser case covered one year of modelled data and, on average, covered
three campaigns. The RROI figures in the analysis were calculated across a period of
3-6 months during and after each campaign.
IPA Databank analytics – confirming commercial outcomes
We wanted to generate a fresh set of figures to confirm that mail delivers great ROI,
particularly when used alongside other media.
Working with Peter Field, we looked at the IPA’s campaign effectiveness awards
database. The awards are given to campaigns that succeeded across a number of

65
key metrics. Correct measurement and attribution is therefore a key part of the data
the IPA have on these campaigns.
The aim was to compare the outcomes of campaigns using mail with campaigns that
did not, looking at key marketing metrics – response, sales, ROI and share of market.
Mail and Digital – understanding the new relationship
In 2007 Royal Mail MarketReach ran a project specifically to look at how a developing
digital marketing industry was affecting the way consumers thought of mail advertising.
We wanted to understand the extent to which mail and digital media overlapped
in consumer minds, and the extent to which they could work together. So we asked
a panel of UK consumers to tell us.
Since then, the digital landscape has matured and changed considerably, and not
least in the rise of mobile platforms. We have therefore repeated this study, again with
a UK-representative panel, to understand how that has influenced results. In this case
we conducted two separate waves of research, Mail and Digital Parts 1 and 2.
The first part focussed on the interaction between mail and email and consisted
of 12 qualitative interviews. The results from the interviews fed into the design of
a quantitative survey that focussed on consumer preferences for mail or email
depending on communication type, as well as their perception of the two media.
An online panel of 1,000 UK consumers was used.
The second part looked at a wider range of digital media. To gain context for this,
30 in-depth telephone interviews were conducted with large advertisers to understand
how they viewed the role of mail in the digital landscape. We then conducted six focus
groups to understand consumers postal and digital lives, before undertaking a survey
with an online panel of 2,375 UK consumers.
Values: The value to consumers drives the value to businesses
(V2C drives V2B)
Having seen that consumers do indeed value mail as part of the communications
mix, we wanted to discover exactly what it was that made good mail so appealing,
and the effect that sending well-designed, well-targeted communications would
have on them.

66
To understand this in detail, we designed a multi-stage research project that asked
people to take note of not just the mail they received, but also the mail that they found
particularly useful. We also asked them to reflect on what might have caused them to
react positively to it.
We began by running six focus groups, discussing current attitudes to mail and
consumers’ behaviour around it in great detail.
We then recruited individuals to a qualitative study where they were asked to keep
a diary of the mail they received, paying special attention to the items they’d found
particularly useful.
This led to a series of general hypotheses about what was important to people
in terms of the mail they got from companies. We tested these hypotheses
quantitatively using an online panel of 2,000 individuals.
With a better understanding of consumers’ thoughts on mail, we engaged in
a further quantitative survey designed specifically around the results of the
work to date. This time, we expanded the panel size to 3,000 so that we could
ask questions about mail from specific commercial sectors (Utilities/Telecoms,
Government/Health, Financial Services, Retail, Travel & Tourism and Charities).
In all cases, respondents were asked to identify and describe a recent piece
of mail they had received from that specific sector, which they felt particularly
positive about. Subsequent questions asked them to consider why this might
have been and what kind of reaction mail produced.

Nik Roope – Founder, Poke
“ SOMETIMES IT IS A GOOD IDEA TO LEAD CLIENTS
UP THE GARDEN PATH. ”
MAILMEN.co.uk

68
THANK YOU
The first conversations that led to the research from which this report is drawn
happened around Christmas 2012. Between then and now many people have helped
create and shape the work and our thinking, offered support, opinions, criticism or
encouragement. All were useful.
To the following, whatever the nature or scale of your particular contribution, thank you
from my team and I. JH.
Adrian Brady
Adrian Gregory
Andy Halliwell
Alison Wright
Amanda Mackenzie OBE
Andy Jones
Andy Jonesco
Annette King
Ben Skelton
Charles Ping
Chris Combermale
Chris Ingram
Chris Walton
Dan Flynne
Danny Narey
David Brennan
David Kyffin
David Prideaux
David Reed
David Robinson
Derek Jones
Derek Morris
Elspeth Lynn
Gavin Wheeler
Graeme Hutcheson
Hamish Pringle
Heather Graham
Ian Haworth
Jamie Cregan
Janet Sneddon
Jess Burney
John Gambles
John Hinchliffe
John Hiney

69
John Hornby
John Watson
Judith Donovan CBE
Julius Wolf-Ingham
Karen Blackett OBE
Karen Trickett
Katie McQuaid
Kevin Allen
Kevin Langford
Lynne Robinson
Marco Scognamiglio
Mark Cridge
Mark Davies
Mark Runacus
Mark Young
Matt Atkinson
Melanie Morris
Mike Colling
Mike Cornwell
Mike Dodds
Mike Welsh
Nick Manning
Nigel Jones
Nigel Sharrocks
Nigel Swabey
Nik Roope
Patrick Sargeant
Paul Alexander
Paul Brazier
Paul Clarke
Paul Kendrick
Paul Keenan
Peter Field
Robert Campbell
Robert Senior
Robin Welch
Rosemary Smith
Sarah Bryan
Sarah Owen
Sir Chris Powell
Spencer McHugh
Spooner
Tim Duffy
Tim Lefroy
Tim Lindsay
Tony Mattson
Xavier Rees

70
SOURCES
1. IPA Touchpoints 5, 2014
Time diary activity – all recording ‘looking at post’ as primary activity at a
particular point in time.
Base: all respondents (51,366)
2. Royal Mail MarketReach, Ethnographic Quant, Trinity McQueen, 2014
Question asked: On average, how old are the items currently in that place?
Base: all with advertising mail items (169), unaddressed mail items (227),
or bills/statements (496)
3. TGI Kantar Media, 2014
Question asked: Thinking about addressed mail, which of the following types
have you seen/read, kept (for referral at a later date) or used (e.g. vouchers,
useful reference) in the past 4 weeks?
Base: all respondents (12,398)
4. Royal Mail MarketReach, Values: V2C Drives V2B, Quadrangle, 2014
Question asked: And what did you do as a result of getting this mail from
[SELECTED BRAND]?
Base: all respondents (3,000), all selecting mail from finance brands (560),
all selecting mail from tourism brands (430)
5. IPA Touchpoints 5, 2014
Question asked: Here is a list of things people have said about mail.
Please indicate the extent to which you agree/disagree with each –
‘There’s a specific place in the house where we keep catalogues and
brochures/there’s a specific place in the house where we keep letters
with vouchers and offers for later use’.
Base: all respondents (51,366)

71
6. Royal Mail MarketReach, Ethnographic Quant, Trinity McQueen, 2014
Question asked: What did you do with (ITEM)? If you don’t have the items with
you, think back to the most recent delivery, and see if you can recall: What day
was it? What time did it arrive? Where were you when you looked through it?
Being able to place yourself back to the time of the delivery will help you
answer more accurately.
Base: all respondents (1,129)
7. IPA Touchpoints 5, 2014
Questions asked: Direct Marketing is marketing or advertising messages which
are communicated to people on a personal basis through mail, email, a telephone
call or an SMS message. For each of these ways of communicating advertising
messages with you, please indicate which of the following descriptions apply
(welcome/memorable).
Here are some statements people have made about advertising mail. Please
indicate how much you agree or disagree – ‘I trust the advertising mail I
receive through my door’.
Which of the following types of information have been helpful to you in making
each of the following types of purchase in the last 12 months – changing a
service provider.
Base: 15 – 34 year olds (15,937)
8. Royal Mail MarketReach, Mail and Digital Part 2, Quadrangle, 2013
Question asked: Does the following apply to you: I look forward to finding
out what’s in today’s post?
Base: 18 – 24 year olds (313)
9. Royal Mail MarketReach, Media Moments, Trinity McQueen, 2013
CCTV observations.
10. The Reading Brain in the Digital Age – The Science of Paper vs Screens
– Scientific American, April 2013
11. Royal Mail MarketReach, Ethnographic Quant, Trinity McQueen, 2014
Question asked: To what extent do you agree or disagree with the following
statements? (I prefer to read on paper).
Base: all respondents (1,129)

72
12. Royal Mail MarketReach, Ethnographic Quant, Trinity McQueen, 2014
Question asked: To what extent do you agree or disagree with the following
statements? [I tend to ignore advertising sent by post] What did you do with
(ITEM)? If you don’t have the items with you, think back to the most recent
delivery, and see if you can recall: What day was it? What time did it arrive?
Where were you when you looked through it? Being able to place yourself
back to the time of the delivery will help you answer more accurately.
Base: all respondents (1,129)
13. Royal Mail, Roamler, 2011
Photographic observations.
14. IPA Touchpoints 5, 2014
Question asked: Here are some statements people have made about
advertising mail, please indicate to what extent you agree or disagree:
‘The quality of printing and material in a piece of mail tells me something
about the organisation that sent it’.
Base: all respondents (51,366)
15. Royal Mail MarketReach, Neuro-Insight, 2013
16. Royal Mail MarketReach, Values: V2C Drives V2B, Quadrangle, 2014
Question asked: And how did this mail from [SELECTED BRAND] make
you feel when you received it?
Base: all respondents (3,000)
17. Ernst – ‘Learning to Integrate Aribtrary Signals from Vision and Touch’,
Journal of Vision, 2007
18. Royal Mail MarketReach, Tactility, Trinity McQueen, 2013
19. http://www.psychwiki.com/wiki/Cognitive_Miser
20. TGI Kantar Media, 2014
Question asked: Thinking about addressed mail, which of the following types
have you seen/read, kept (for referral at a later date) or used (e.g. vouchers,
useful reference) in the past 4 weeks?
Base: all respondents (12,398)

73
21. Royal Mail MarketReach, Values: V2C Drives V2B, Quadrangle, 2014
Question asked: And what did this mail from [SELECTED BRAND]
make you think? – it kept their products and services top of mind.
Base: all respondents (3,000)
22. Royal Mail MarketReach, BrandScience, 2014
23. The definition is Revenue over a given period divided by Investment (cost),
so that if revenue = cost, it delivers a break-even result of £1.00
24. ESOV is defined as the percentage a brand’s communications advertising
spend represents of the total category communications spend across all
channels adspend (Share of Voice – SOV) minus the percentage that a brand’s
revenue represents of total revenue in that market (Share of Market – SOM).
25. Royal Mail MarketReach, Neuro-Insight, 2013
26. Royal Mail MarketReach, Mail and Digital Part 1, Quadrangle, 2013
Question asked: Overall, thinking generally about the communications
you receive, would you say you prefer to be contacted by post, email
or a combination of both?
Base: all respondents (1,000)
27. Royal Mail MarketReach, Mail and Digital Part 1, Quadrangle, 2013
Question asked: In the last 6 months, have you taken any of the following
action in response to the post/email you have received?
Base: all respondents (1,000)
28. DMA Bronze Winner, Best use of Direct Mail, WPN Chameleon, 2012
29. Silberstein, R. B., Schier, M. A., Pipingas, A., Ciorciari, J., Wood,
S. R. and Simpson D. G. (1990) Steady state visually evoked
potential topography associated with a visual vigilance task.
Brain Topography 3: 337-347

74
NOTES

We have a team of media experts and data planners ready to apply these learnings to your business.
To discuss how we can help you, call us on 0800 633 5350 or visit mailmen.co.uk for more information and to download this report online.
Royal Mail, the cruciform and all marks indicated with ® are registered trade marks of Royal Mail Group Ltd. Royal Mail Group Ltd 2014. Registered Office: 100 Victoria Embankment, London EC4Y 0HQ. © Royal Mail Group Ltd 2014. All rights reserved.


