484 International Journal of Modeling and Optimization, Vol. 3, No. 6, December 2013 Abstract—An efficient network is critical to support the rapid growth in traffic on mobile networks, since current network PCS1900 (2G) cannot support such a huge demand. The objective of the third-generation (3G) UMTS (Universal Mobile Telecommunication System) of wireless communication is to provide high speed wireless communication to support multimedia, large data, and video. However, the co-existence of the two mobile radio systems (PCS1900 and UMTS) which share the same frequency band leads to a major issue. A serious issue of co-existence occurs when the downlink of the system is closer to the frequency bands of the concerned system. The PCS-1900 downlink band (1,930-1,990) and WCDMA (UMTS) uplink band (1,920-1,980) widely overlap, which causes interference between UMTS mobile unit and PCS-1900 base station. Therefore the objectives of this paper is to study the effect from PCS 1900 base station interference on UMTS mobile unit performance in terms of the probability of bit error by developing the Probability of bit error equation of DSS-QPSK from the existing Probability of bit error equation. This paper also evaluates the degradation of UMTS mobile unit performance in terms of probability of bit error when the system is interfered by PCS1900 base station. Index Terms—Bit error, co-existence on network, DSS-QPSK, PCS 1900, UMTS. I. INTRODUCTION GSM (Global System for Mobile communication) age began in 1989. Commercial service was commenced in 1991, and by 1993 there were 36 GSM networks in over 22 countries. There more than 200 GSM networks comprising of both DCS1800 and PCS 1900 operated in 110 countries worldwide. In 1997, GSM subscribers had grown to more than 55 million. Present day, GSM has become global standard as an interface for Personal Communications Network (PCN) in United Kingdom, and Personal Communication System at 1900 (PCS-1900) in Northern America, South American and Asia. WCDMA technology is the most widely adopted third generation technology air interface. Its specification has been included in 3GPP, which is a standard that is a joint standard from Europe, Japan, Korea, the USA and China [1]. Illustrated in Fig. 1, is the frequency spectrum for PCS1900 and UMTS mobile system. “PCS-1900 is TDMA/frequency division duplex (FDD) systems”. In the TDMA system data from subscriber is in Manuscript received May 25, 2013; revised July 29, 2013. Full financial support for this paper is from National Broadcasting and Telecommunications Commission. The authors are with the National Broadcasting and Telecommunications Commission, Bangkok, Thailand (e-mail: [email protected], [email protected]). slots and each slot is expressed as time intervals while a number of slots are composed into a frame. Majority of TDMA systems adopt time division multiplexing which comprises of several time-divisions multiplexed onto a TDMA bit streams [2]. “The data is transmitted via radio carrier from a base station to several active mobiles in the downlink. In the reverse direction (Uplink), transmission from mobiles to base station is time sequenced and synchronized on common frequency for TDMA”[2]. The pair of bands of PCS1900 is (1850 – 1910 MHz (uplink), 1930 - 1990 MHz (downlink)) the nominal carrier spacing is 200 kHz and the data transmission rate is 270.833 kbps. The TDMA/FDMA/FDD is the multiple access technique for PCS-1900 with 4.62 ms for TDMA frame duration and Time-slots duration is 0.58 ms. GMSK is adopted as Modulation technology for PCS-1900. WCDMA used for for UMTS public, wide-area service, in the paired bands (1920 - 1980 MHz (uplink), 2110 - 2170 MHz (downlink)). Contrarily, a Time Division Duplex (TDD) mode is used for private, indoor services (1900-1920 MHz and 2010 - 2025 MHz) [3]. “The TDD mode is considered to be a complement to WCDMA to boost the capacity in local areas” [3]. The nominal carrier spacing is 5 MHz and the chip rate is 3.84 Mcps. The carrier can be adjusted in steps of 200 kHz [3], [4]. Fig. 1. Frequency spectrum for PCS1900 and UMTS mobile system The intention of this paper is to study the result of the interference from the co-existence between PCS1900 and UMTS in terms of the probability of bit error. By comprehending in depth, the root of the problem; it is highly possible to find a solution to avoid such problem. As a result, this could lead to a better and more efficient way of telecommunication in the future. II. PROBABILITY OF BIT ERROR FOR DIRECT SEQUENCE SPREAD SPECTRUM In this paper we develop the new DSSS-QPSK to calculate probability of bit error for UMTS mobile system. Based on Equation with the formula used to calculate the average probability of error for a coherent binary PSK system, we reproduce the equation here for convenience of presentation. Based on this equation, we see that as the calculation of bit error rate in a direct-sequence spread binary PSK system is concerned, the interference may be treated as wideband noise 1850 1910 1920 1930 1980 2110 1990 2170 PCS1900 UMTS The Probability of Bit Error Due to the Co-existence Interference of PCS1900 and UMTS Jesada Sivaraks and Settapong Malisuwan DOI: 10.7763/IJMO.2013.V3.326
Transcript
484
International Journal of Modeling and Optimization, Vol. 3, No. 6, December 2013
Abstract—An efficient network is critical to support the rapid
growth in traffic on mobile networks, since current network PCS1900 (2G) cannot support such a huge demand. The objective of the third-generation (3G) UMTS (Universal Mobile Telecommunication System) of wireless communication is to provide high speed wireless communication to support multimedia, large data, and video.
However, the co-existence of the two mobile radio systems (PCS1900 and UMTS) which share the same frequency band leads to a major issue. A serious issue of co-existence occurs when the downlink of the system is closer to the frequency bands of the concerned system. The PCS-1900 downlink band (1,930-1,990) and WCDMA (UMTS) uplink band (1,920-1,980) widely overlap, which causes interference between UMTS mobile unit and PCS-1900 base station. Therefore the objectives of this paper is to study the effect from PCS 1900 base station interference on UMTS mobile unit performance in terms of the probability of bit error by developing the Probability of bit error equation of DSS-QPSK from the existing Probability of bit error equation. This paper also evaluates the degradation of UMTS mobile unit performance in terms of probability of bit error when the system is interfered by PCS1900 base station.
Index Terms—Bit error, co-existence on network, DSS-QPSK, PCS 1900, UMTS.
I. INTRODUCTION GSM (Global System for Mobile communication) age
began in 1989. Commercial service was commenced in 1991, and by 1993 there were 36 GSM networks in over 22 countries. There more than 200 GSM networks comprising of both DCS1800 and PCS 1900 operated in 110 countries worldwide.
In 1997, GSM subscribers had grown to more than 55 million. Present day, GSM has become global standard as an interface for Personal Communications Network (PCN) in United Kingdom, and Personal Communication System at 1900 (PCS-1900) in Northern America, South American and Asia.
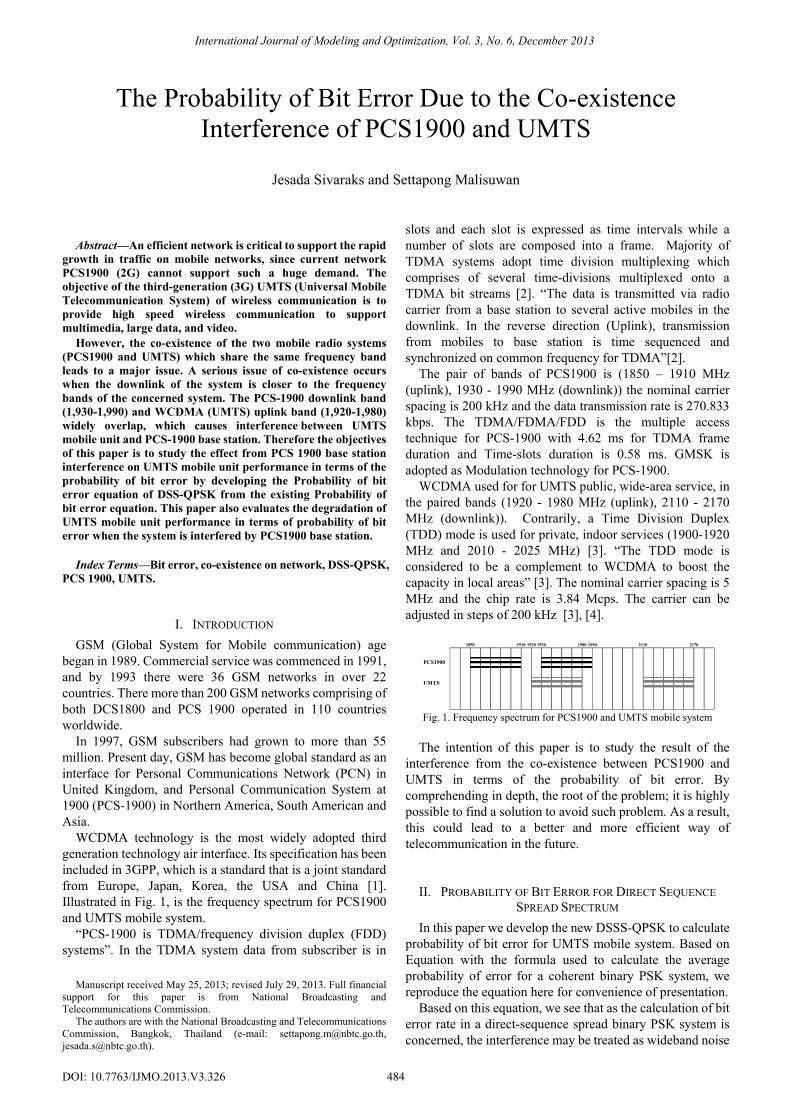
WCDMA technology is the most widely adopted third generation technology air interface. Its specification has been included in 3GPP, which is a standard that is a joint standard from Europe, Japan, Korea, the USA and China [1]. Illustrated in Fig. 1, is the frequency spectrum for PCS1900 and UMTS mobile system.
“PCS-1900 is TDMA/frequency division duplex (FDD) systems”. In the TDMA system data from subscriber is in
Manuscript received May 25, 2013; revised July 29, 2013. Full financial support for this paper is from National Broadcasting and Telecommunications Commission.
The authors are with the National Broadcasting and Telecommunications Commission, Bangkok, Thailand (e-mail: [email protected], [email protected]).
slots and each slot is expressed as time intervals while a number of slots are composed into a frame. Majority of TDMA systems adopt time division multiplexing which comprises of several time-divisions multiplexed onto a TDMA bit streams [2]. “The data is transmitted via radio carrier from a base station to several active mobiles in the downlink. In the reverse direction (Uplink), transmission from mobiles to base station is time sequenced and synchronized on common frequency for TDMA”[2].
The pair of bands of PCS1900 is (1850 – 1910 MHz (uplink), 1930 - 1990 MHz (downlink)) the nominal carrier spacing is 200 kHz and the data transmission rate is 270.833 kbps. The TDMA/FDMA/FDD is the multiple access technique for PCS-1900 with 4.62 ms for TDMA frame duration and Time-slots duration is 0.58 ms. GMSK is adopted as Modulation technology for PCS-1900.
WCDMA used for for UMTS public, wide-area service, in the paired bands (1920 - 1980 MHz (uplink), 2110 - 2170 MHz (downlink)). Contrarily, a Time Division Duplex (TDD) mode is used for private, indoor services (1900-1920 MHz and 2010 - 2025 MHz) [3]. “The TDD mode is considered to be a complement to WCDMA to boost the capacity in local areas” [3]. The nominal carrier spacing is 5 MHz and the chip rate is 3.84 Mcps. The carrier can be adjusted in steps of 200 kHz [3], [4].
Fig. 1. Frequency spectrum for PCS1900 and UMTS mobile system
The intention of this paper is to study the result of the
interference from the co-existence between PCS1900 and UMTS in terms of the probability of bit error. By comprehending in depth, the root of the problem; it is highly possible to find a solution to avoid such problem. As a result, this could lead to a better and more efficient way of telecommunication in the future.
II. PROBABILITY OF BIT ERROR FOR DIRECT SEQUENCE SPREAD SPECTRUM
In this paper we develop the new DSSS-QPSK to calculate probability of bit error for UMTS mobile system. Based on Equation with the formula used to calculate the average probability of error for a coherent binary PSK system, we reproduce the equation here for convenience of presentation.
Based on this equation, we see that as the calculation of bit error rate in a direct-sequence spread binary PSK system is concerned, the interference may be treated as wideband noise
1850 1910 1920 1930 1980 21101990 2170
PCS1900
UMTS
The Probability of Bit Error Due to the Co-existence Interference of PCS1900 and UMTS
Jesada Sivaraks and Settapong Malisuwan
DOI: 10.7763/IJMO.2013.V3.326
485
International Journal of Modeling and Optimization, Vol. 3, No. 6, December 2013
of power spectral density No/2 defined by
)(21
o
be
NEerfcP =
(2.1)
22cJTNo =
(2.2)
))((JP
TT
NE
c
b
o
b =
(2.3)
Using the definition of Equation processing gain (PG)
c
b
TTPG = we may reformulate that result as
o
b
NEPG
PJ =
(2.4)
We assume that P = 1 then
o
b
NEPGJ =
(2.5)
We may switch Eb/No with J
JPG
NE
o
b =
(2.6)
And finally we replace Eb/No from equation (2.4) with equation (2.1)
JPGerfcPe 2
1=
(2.7)
In fact the “coherent QPSK is equivalent to two coherent binary PSK working in parallel and using two carriers that are in-phase and quadrature” [3]. Hence we may state that the average probability of bit error in each channel of the DSSS-QPSK is
JPGerfcP
21'=
(2.8)
It is pertinent that the bit errors in the in-phase and quadrature channels of the coherent QPSK system are
statistically independent. Then in-phase channel makes a decision on one of the two bits constituting a symbol (dibit) of the QPSK signal, and the quadrature channel takes care of the other bit. Accordingly, the average probability of a accurate decision that results from the action of two channels working jointly is [4]
Pc = (1-P’) 2 (2.9)
Therefore the average probability of symbol error for DSSS-QPSK is
Pe = 1- Pc(2.10)
The result of this simple formula is probability of bit error for DSSS-QPSK used in this paper.
III. OKUMURA’S MODEL FOR PCS-1900 INTERFERENCE
In this paper we apply Okumura’s Model as the model for generating the interference from PCS-1900 because Okumura’s Model is a popular model for signal prediction in city areas. This model is suitable for frequencies ranging from 150 MHz to 1920 MHz with distances of 1 km to 100 km. Further it is suitable for in cases where base station antenna heights are between 30 m to 1000 m [5].
“Okumura developed a set of curves giving the median attenuation relative to free space (Amu), in an urban area over a quasi-smooth terrain with a base station effective antenna height (hte) of 200 m. and a mobile antenna height (hre) of 3 m”[3]. “These curves were developed from extensive measurement using vertical omni-directional antennae at both the base and mobile, and are plotted as function of frequency in the range 100 MHz to 1920 MHz and as a function of distance from the base station in the range 1 km. to 100 km”[5]. In determining the path loss by adopting Okumura’s model, the free space path loss between the point of interest is first calculated, and then the value of Amu (f, d) (as read from the curves) is added, hence expressed as [5]
“where L50 median value of propagation path loss, LF is the free space propagation loss, Amu is the median attenuation relative to free space, G(hte) is the base station antenna height gain factor, G(hre) is the mobile antenna height gain factor, and GAREA is the gain due to the type of environment”[5]. It is should be acknowledged that the antenna height gains is due to the function of height and is not because of the antenna patterns.
Plots of Amu (f, d) and GAREA for a wide range of frequencies are shown in Fig. 2-3. Okumura also discovered that “G (hte) varies at a rate of 20dB/decade and G(hre) varies at a rate of 10 dB/decade for heights less than 3 m” [3].
G(hte) = 20log ⎟⎠⎞
⎜⎝⎛
200)( teh
1000 m > hte > 30 m
(3.2)
where JTc/2 is the variance in term of the average interference of J
Since the signal energy per bit Eb = PTb where P is the average signal power and is the bit duration, we may express the signal energy per bit-to-noise spectral density ratio as
Tb
486
International Journal of Modeling and Optimization, Vol. 3, No. 6, December 2013
G(hte) = 10log ⎟⎠⎞
⎜⎝⎛
3)( reh
hre ≤ 3 m
(3.3) The free space path loss LF can be calculated by
( ) ⎥⎦
⎤⎢⎣
⎡−=
22
2
4log10
dLF π
λ
(3.4)
Illustrated in Fig. 2, is the median attenuation relative to free space over quasi smooth terrain. Therefore, the median received power or Interference from PCS-1900 is
Interference from PCS-1900 = EIRP – L50 + Gr Assume that Gr = 0
(3.5)
where Gr is the receiver antenna gain and EIRP is the effective isotropic radiated power is defined by
EIRP = PtGt
where Pt is transmitted power
Gt is transmitted antenna gain (3.6)
Alternative improvements should also be taken into an account for Okumura’s model. Pertinent are the “terrain
undulation height ( hΔ ), isolated ridge height, average slope of the terrain and the mixed land-sea parameter”[5].
Fig. 2. Median attenuation relative to free space (Amu (f,d)),
Once the terrain related parameters are calculated, the
necessary correction factor can be added or subtracted. All these correction factors are also available as Okumura curves. Therefore, Fig. 3 illustrates correction factor for different types of train.
Okumura’s model is entirely based on measured data and no analytical explanation is provided [5]. “For many
situations, extrapolations of derived curves can be made to obtain values outside the measurement range, although the validity of such extrapolations depends on the circumstances and the smoothness of the curve in question”[5].
Fig. 3. Correction factor, GAREA, for different types of terrain
(source: wireless communication, page 118) Okumura’s model is one of the simplest and most accurate
models in terms of path loss prediction for the mature cellular and land mobile radio system in cluttered environments. Presently it has become a standard for system planning in mobile system in Japan. A major setback of the model is its slow response to rapid changes in terrain; consequently the model is most fitting in city areas or urban areas. “Common standard deviations between predicted and measured path loss values are around 10 dB to 14 dB”[5].
IV. THE SIMULATION OF PROBABILITY OF BIT ERROR AFTER APPLYING INTERFERENCE
In order to analyses the probability of bit error of UMTS’s mobile system, we analyze it from the relationship between Pe and the J/P margin. The J/P margin is the margin of interference to signal power. Shown in Fig. 4 is the interference from PCS-1900’s base station to UMTS’s mobile station.
Based on Equation (2.4), we reproduce the equation here for convenience of presentation.
o
b
NEPG
PJ =
(4.1)
Accordingly, the J/P margin and the processing gain, both expressed in decibels, are related by
(J/P margin)dB = (Processing gain) dB - ⎟⎟⎠
⎞⎜⎜⎝
⎛
o
b
NE
10log10
(4.2)
Urban Areaht = 200mhr = 3m
70
60
50
40
30
20
1070 100 200 300 500 700 1000 2000 3000
1
2
5
1020
30
40
50
60
7080
100
12
5
1020
30
40
50
6070
80
100
Frequency | (MHz)
Med
ian
Atte
nual
ion,
A(f,
d) (d
B)
d (k
m)
35
30
25
20
15
10
5
0100 200 300 500 700 1000 2000 3000
Frequency | (MHz)C
orre
ctio
n Fa
ctor
, GA
REA
(dB)
487
International Journal of Modeling and Optimization, Vol. 3, No. 6, December 2013
In this paper we applied interference from PCS-1900 (the value from Okumura’ Model) by minus it into the J/P margin in order to study the relationship between probability of bit error and the J/P margin after applying interference from PCS-1900.
Therefore the J/P margin after applying interference is
The result of this simple formula is the new J/P margin after applying interference from PCS-1900 used in this thesis.
This computational experiment uses MatLab version 6.1 to obtain Probability of Bit Error (Pe) by using DSSS-QPSK equation value and finding out Jamming Margin (J/P) in urban area at different data rates and different distances between UMTS’s mobile and PCS1900’s base station.
Fig. 4. The interference from PCS-1900’s base station to UMTS’s mobile station
Also we applied Okumura’s model in order to generate the path loss (interference) from PCS-1900 because the model has slow response to rapid change in terrain which is fairly good in urban but not as good in rural areas. The graph generated by MatLab relates to probability of bit error and jamming margin. We use frequency (freq) in range 1930 MHz, 1960 MHz and 1980 MHz, Processing gain (PG) at [Mcps/Data rate]. Lastly we apply the level of probability of Bit Error to find out the effect from frame transmission of UMTS under interference from PCS-1900, the objects proposed to find out the probability of bit error of UMTS under the interference from PCS-1900. Therefore, “scenario 1: Probability of Bit Error without Interference from PCS-1900” is shown in Fig. 5.
Fig. 5. The UMTS’s relationship between Pe and J/P without Interference from PCS-1900 at data rate = 12.2 kbps
This computational experiment begins with calculating Pe and J/P margin without interference from PCS-1900 at 5 different data rates which are 12.2 kbps, 64 kbps, 128 kbps, 384 kbps, 2 Mbps
Fig. 5 illustrates the relationship between Pe and the J/P margin without interference from PCS-1900. If we transmit data at the data rate equal to 12.2 kbps, the lowest Pe value generated will be 10-5 at J/P approximately 14.9797139 dB and the highest value will be 10-1 at J/P approximately 24 dB.
Next, we change data rate to 64 kbps, 128 kbps, 384 kbps and 2 Mbps without Interference from PCS-1900. The result is shown as in Fig. 3-Fig. 6.
Fig. 6. The UMTS’s relationship between Pe and J/P without Interference from PCS-1900 data rate = 64 kbps
Fig. 7. The UMTS’s relationship between Pe and J/P without Interference from PCS-1900 at data rate = 128 kbps
In Fig. 6-Fig. 9, we changed the data rate to 64 kbps, 128 kbps, 384 kbps and 2 Mbps respectively. It was found that the J/P margin will decrease when data rates increase.
The decrease in the J/P margin means the ability to handle jamming or interference will be lessen. As a result, the BER and FER (Frame Error Rate) will increase leading to a decrease in QoS (Quality of Service).
For example, at the data rate equal to 64 kbps, Pe is -10-5 at J/P equal to 7.7815125 dB, at the data rate equal to 128 kbps, Pe is -10-5 at J/P equal to 4.7712125 dB, at the data rate equal to 384 kbps, Pe is -10-5 at J/P equal to 0 .0 dB, and at the data rate equal to 2 Mbps, Pe is -10-5 at J/P equal to -7.1669877 dB
UMTS’s base station PCS-1900’s base station
UMTS’s Mobile
100
10-1
10-2
10-3
10-4
10-5
10-6
15 16 17 18 19 20 21 22 23 24
The Relationship between Probability of Bit Error and J/P Margin
Prob
abili
ty o
f Bit
Erro
r
J/P - dB
J/P - dB
100
10-1
10-2
10-3
10-4
10-5
10-6
7 8 9 10 11 12 13 14 15 16 17
The Relationship between Probability of Bit Error and J/P Margin
Prob
abili
ty o
f Bit
Err
or
J/P - dB
100
10-1
10-2
10-3
10-4
10-5
10-6
4 5 6 7 8 9 10 11 12 13 14
The Relationship between Probability of Bit Error and J/P Margin
Prob
abili
ty o
f Bit
Err
or
488
International Journal of Modeling and Optimization, Vol. 3, No. 6, December 2013
Fig. 8. The UMTS’s relationship between Pe and J/P without Interference
from PCS-1900 at data rate = 384 kbps
Fig. 9. The UMTS’s relationship between Pe and J/P without interference
from PCS-1900 at data rate = 2 Mbps
Fig. 10. The comparison of the UMTS’s relationship between Pe and J/P
without Interference from PCS-1900 at data rate = 12.2 kbps, 64 kbps, 128 kbps, 384 kbps and 2 Mbps
From Fig. 10, it can be concluded that when the data rate
increases the J/P margin decreases and also when the data rate decreases the J/P margin increases under the condition of constant Pe. Therefore we can conclude that the data rate has the effect on the relationship between Pe and the J/P margin.
In the next scenario, we will show the result of the relationship between Pe and the J/P margin after we apply interference from PCS1900 that we get from Okumura’s model at different distances (1 Km, 2 Km, 5 Km) and also at different data rates (12.2 kbps, 64 kbps, 128 kbps, 384 kbps and 2 Mbps) in urban area environment.
Scenario II: Probability of Bit Error with Interference from PCS-1900
In this scenario, we applied Okumura’s model in order to generate the interference from PCS-1900 base station in an
urban area at different distances and also different data rates. In the first scenario we will show the result of relationship between Pe and the J/P margin after applying interference from PCS-1900 at the data rate 12.2 kbps and distance between UMTS’ mobile station and PCS-1900’ base station equal to 1 Km.
Fig. 11. The UMTS’s relationship between Pe and J/P with Interference from
PCS-1900 at data rate = 12.2 kbps and distance = 1Km Fig. 11 illustrates the relationship between Pe and J/P after
applying the interference from PCS-1900 under urban area environment. At the data rate equal to 12.2 kbps, the distance equal to 1 Km, and the lowest Pe value equal to 10-5 dB, it will generate J/P approximately 14.979705 dB.
Next, we change the data rate to 64 kbps, 128 kbps, 384 kbps and 2 Mbps without changing area and distance. The result is shown in Fig. 4-Fig. 12.
Fig. 11. The UMTS’s relationship between Pe and J/P with Interference from
PCS-1900 at data rate = 64 kbps and distance = 1 Km
Fig. 12. The UMTS’s relationship between Pe and J/P with Interference from
PCS-1900 at data rate = 128 kbps and distance = 1 Km
100
10-1
10-2
10-3
10-4
10-5
10-6
0 1 2 3 4 5 6 7 8 9
The Relationship between Probability of Bit Error and J/P Margin
Prob
abili
ty o
f Bit
Erro
r
J/P - dB
100
10-1
10-2
10-3
10-4
10-5
10-6
-8 -7 -6 -5 -4 -3 -2 -1 0 1 2
The Relationship between Probability of Bit Error and J/P Margin
Prob
abili
ty o
f Bit
Erro
r
J/P - dB
10-0
10-1
10-2
10-3
10-4
10-5
- 9.00 dB - 6.00 dB - 3.00 dB 0.00 dB 3.00 dB 6.00 dB 9.00 dB 12.00 dB 15.00 dB
- 7.1669877 dB
2 Mbps
0.0 dB
384 kbps
Prob
abili
ty o
f Bit
Erro
r
J/P - dB
4.7712125 dB 7.7815125 dB 14.9797139 dB
128 kbps64 kbps
12.2 kbps
100
10-1
10-2
10-3
10-4
10-5
10-6
15 16 17 18 19 20 21 22 23 24
The Relationship between Probability of Bit Error and J/P Margin
Prob
abili
ty o
f Bit
Erro
r
J/P - dB
J/P - dB
100
10-1
10-2
10-3
10-4
10-5
10-6
7 8 9 10 11 12 13 14 15 16 17
The Relationship between Probability of Bit Error and J/P Margin
Prob
abili
ty o
f Bit
Erro
r
J/P - dB
100
10-1
10-2
10-3
10-4
10-5
10-64 5 6 7 8 9 10 11 12 13 14
The Relationship between Probability of Bit Error and J/P Margin
Prob
abili
ty o
f Bit
Err
or
489
International Journal of Modeling and Optimization, Vol. 3, No. 6, December 2013
In Fig. 11-Fig. 14, we changed the data rate to 64 kbps, 128 kbps, 384 kbps and 2 Mbps respectively, while remained the distance and the area to be the same at 1 Km and urban area. We found that at the Pe equal to -10-5, J/P decreased for all data rates. For example, at the data rate 64 kbps, J/P will be equal to 7.781465 dB, at the data rate 128 kbps, J/P will be equal to 4.871119 dB, at the data rate 384 kbps, J/P will be equal to 0.100279 dB, and at the data rate 2 Mbps, J/P will be equal to -7.168443 dB
Fig. 13. The UMTS’s relationship between Pe and J/P with Interference from
PCS-1900 at data rate = 384 kbps and distance = 1 Km
Fig. 14. The UMTS’s relationship between Pe and J/P with Interference from
PCS-1900 at data rate = 2 Mbps and distance = 1 Km
Fig. 15. The comparison of the UMTS’s relationship between Pe and J/P with Interference from PCS-1900 at distance between UMTS’s mobile
Compared with Fig. 10, we found that, the J/P margin
values at each data rate in Fig. 4-13 are lower than those in Fig. 15. At distance equal to 1 Km after we applied interference from PCS-1900, the interference caused the J/P
values to be lower. Therefore, it can be concluded that PCS-1900’s mobile system has an effect on UMTS’s mobile system
V. CONCLUSION In this paper, we try to calculate UMTS’s probability of Bit
Error and the relationship between Pe and J/P by using DSSS-QPSK equation. We make computational experiment by using Okumura’s model to find out the interference between PCS-1900 base station and UMTS mobile unit.
The result of this thesis can be summarized as the DSSS-QPSK has the better performance than QPSK because DSSS-QPSK applies processing gain (PG) which is the properties of Spread Spectrum waveform that can primarily improve performance in the area of interference tolerance. The PG can be viewed as a signal to jammer ratio at the receiver after the dispreading operations. From the graph of DSSS-QPSK we will see that the relationship in the DSSS-QPSK graph is the relationship between Pe and J/P unlike the result from QPSK technique. This means that the signal can be transmitted even though a noise is presented.
REFERENCES [1] S. Sharma and V. Walia, "Performance Evaluation of Digital
Modulation Techniques for WCDMA Radio Over Fiber using BER & Fiber Length," International Journal of Electronics & Communication Technology, vol. 3, pp. 34-38, 2012.
[2] V. K. Garg and E. L. Sneed, "TDMA for North American PCS systems," Bell Labs Technical Journal, vol. 2, pp. 207-220, 1997.
[3] S. Malisuwan, A. Ieamgusonkit, and V. Ungvichian, "Bs-to-BS interference of wcdma AND PCS 1900 (IS-95)," 2000.
[4] S. Haykin, Communication Systems, 4th Edition ed. New York: John Wiley & Sons, 2004.
[5] L. P. I. Hissalle and S. Alahakoon, "Estimating signal strengths prior to field trials in wireless local loop networks," in Industrial and Information Systems, 2007. ICIIS 2007. International Conference on, 2007, pp. 409-414.
Settapong Malisuwan was born on 24 March 1966 in Bangkok, Thailand. He received his PhD in electrical engineering (telecommunications), specializing in mobile communication systems from Florida Atlantic University (State University System of Florida), Boca Raton in 2000. He received an MSc in electrical engineering in mobile communications system, from George Washington University in 1996, an MSc in electrical engineering in telecommunication engineering from Georgia Institute of Technology in 1992 and a BSc in electrical engineering from the Chulachomklao Royal Military Academy, Nakhon-Nayok, Thailand in 1990. He served in the Royal Thai Armed Forces for more than 25 years and is currently the Vice Chairman of National Broadcasting and Telecommunications, Bangkok, Thailand. His research interests are in efficient spectrum management and Telecommunications policy and management in Thailand. Col. Dr. Settapong Malisuwan is currently the Elected Vice Chairman and Board Member in the National Broadcasting and Telecommunications Commission, Thailand. Jesada Sivaraks was born on 12 May 1970 in Bangkok, Thailand. He received his MSEE degree from Oklahoma State University in 1996 and BEng from King Mongkut''s Institute of Technology, Thailand. He completed his PhD in electrical engineering at Florida Atlantic University, Boca Raton, FL in 2001. Since 2011, he has been working in National Broadcasting and Telecommunications Commission as the Secretary to the Vice Chairman. His PhD work is on the system aspects of Bluetooth, WLAN and Mobile IP/CDPD. His current research interests are in telecommunication planning and related system analysis and efficient spectrum management. He is a member of Tau Beta Pi, Florida Epsilon and was an Honorary Advisory’s Chairman of Science & Technology committee of Parliament in 2009.
100
10-1
10-2
10-3
10-4
10-5
10-6-1 0 1 2 3 4 5 6 7 8 9
The Relationship between Probability of Bit Error and J/P Margin
Prob
abili
ty o
f Bit
Erro
r
J/P - dB
100
10-1
10-2
10-3
10-4
10-5
10-6
-8 -7 -6 -5 -4 -3 -2 -1 0 1 2
The Relationship between Probability of Bit Error and J/P Margin
Prob
abili
ty o
f Bit
Err
or
J/P - dB
10-0
10-1
10-2
10-3
10-4
10-5
- 9.00 dB - 6.00 dB - 3.00 dB 0.00 dB 3.00 dB 6.00 dB 9.00 dB 12.00 dB 15.00 dB