Advances in Management Accounting The Profitability and Performance Measurement of U.S. Regional Banks Using the Predictive Focus of the “Fundamental Analysis Research” Glenn Growe Marinus DeBruine John Y. Lee José F. Tudón Maldonado Article information: To cite this document: Glenn Growe Marinus DeBruine John Y. Lee José F. Tudón Maldonado . "The Profitability and Performance Measurement of U.S. Regional Banks Using the Predictive Focus of the “Fundamental Analysis Research”" In Advances in Management Accounting. Published online: 02 Dec 2014; 189-237. Permanent link to this document: http://dx.doi.org/10.1108/S1474-787120140000024006 Downloaded on: 29 June 2015, At: 16:59 (PT) References: this document contains references to 0 other documents. To copy this document: [email protected]The fulltext of this document has been downloaded 57 times since NaN* Users who downloaded this article also downloaded: Yong Tan, Christos Floros, (2012),"Bank profitability and inflation: the case of China", Journal of Economic Studies, Vol. 39 Iss 6 pp. 675-696 http:// dx.doi.org/10.1108/01443581211274610 Kyriaki Kosmidou, (2008),"The determinants of banks' profits in Greece during the period of EU financial integration", Managerial Finance, Vol. 34 Iss 3 pp. 146-159 http:// dx.doi.org/10.1108/03074350810848036 Chong M. Lau, Vimala Amirthalingam, (2014),"The Relative Importance of Comprehensive Performance Measurement Systems and Financial Performance Measures on Employees’ Perceptions of Informational Fairness", Advances in Management Accounting, Vol. 24 pp. 77-115 http://dx.doi.org/10.1108/ S1474-787120140000024003 Access to this document was granted through an Emerald subscription provided by All users group For Authors If you would like to write for this, or any other Emerald publication, then please use our Emerald for Authors service information about how to choose which publication to write for and submission guidelines are available for all. Please visit www.emeraldinsight.com/authors for more information. About Emerald www.emeraldinsight.com Emerald is a global publisher linking research and practice to the benefit of society. The company manages a portfolio of more than 290 journals and over 2,350 books and book series volumes, as well as providing an extensive range of online products and additional customer resources and services. Downloaded by 189.237.67.151 At 16:59 29 June 2015 (PT)
Transcript
Advances in Management AccountingThe Profitability and Performance Measurement of U.S. Regional Banks Using thePredictive Focus of the “Fundamental Analysis Research”Glenn Growe Marinus DeBruine John Y. Lee José F. Tudón Maldonado
Article information:To cite this document: Glenn Growe Marinus DeBruine John Y. Lee José F. TudónMaldonado . "The Profitability and Performance Measurement of U.S. Regional BanksUsing the Predictive Focus of the “Fundamental Analysis Research”" In Advances inManagement Accounting. Published online: 02 Dec 2014; 189-237.Permanent link to this document:http://dx.doi.org/10.1108/S1474-787120140000024006
Downloaded on: 29 June 2015, At: 16:59 (PT)References: this document contains references to 0 other documents.To copy this document: [email protected] fulltext of this document has been downloaded 57 times since NaN*
Users who downloaded this article also downloaded:Yong Tan, Christos Floros, (2012),"Bank profitability and inflation: the caseof China", Journal of Economic Studies, Vol. 39 Iss 6 pp. 675-696 http://dx.doi.org/10.1108/01443581211274610Kyriaki Kosmidou, (2008),"The determinants of banks' profits in Greece during theperiod of EU financial integration", Managerial Finance, Vol. 34 Iss 3 pp. 146-159 http://dx.doi.org/10.1108/03074350810848036Chong M. Lau, Vimala Amirthalingam, (2014),"The Relative Importance ofComprehensive Performance Measurement Systems and Financial PerformanceMeasures on Employees’ Perceptions of Informational Fairness", Advancesin Management Accounting, Vol. 24 pp. 77-115 http://dx.doi.org/10.1108/S1474-787120140000024003
Access to this document was granted through an Emerald subscription provided by Allusers group
For AuthorsIf you would like to write for this, or any other Emerald publication, then pleaseuse our Emerald for Authors service information about how to choose whichpublication to write for and submission guidelines are available for all. Please visitwww.emeraldinsight.com/authors for more information.
About Emerald www.emeraldinsight.comEmerald is a global publisher linking research and practice to the benefit of society.The company manages a portfolio of more than 290 journals and over 2,350 booksand book series volumes, as well as providing an extensive range of online productsand additional customer resources and services.
Emerald is both COUNTER 4 and TRANSFER compliant. The organization is a partnerof the Committee on Publication Ethics (COPE) and also works with Portico and theLOCKSS initiative for digital archive preservation.
*Related content and download information correct attime of download.
Dow
nloa
ded
by 1
89.2
37.6
7.15
1 A
t 16:
59 2
9 Ju
ne 2
015
(PT
)
THE PROFITABILITY AND
PERFORMANCE MEASUREMENT
OF U.S. REGIONAL BANKS USING
THE PREDICTIVE FOCUS OF THE
“FUNDAMENTAL ANALYSIS
RESEARCH”
Glenn Growe, Marinus DeBruine, John Y. Lee and
Jose F. Tudon Maldonado
ABSTRACT
Purpose � This paper examines the profitability and performancemeasurement of U.S. regional banks during the period 1994�2011, usingthe GMM estimator technique. Our study extends prior research byincluding several factors not previously considered using U.S. data.
Approach � We use bank-specific, industry-specific, and macroeconomicdeterminants of profitability contemporaneous with our performanceindicators. We follow the accounting fundamental analysis path inexplaining the bank performance.
Advances in Management Accounting, Volume 24, 189�237
Copyright r 2014 by Emerald Group Publishing Limited
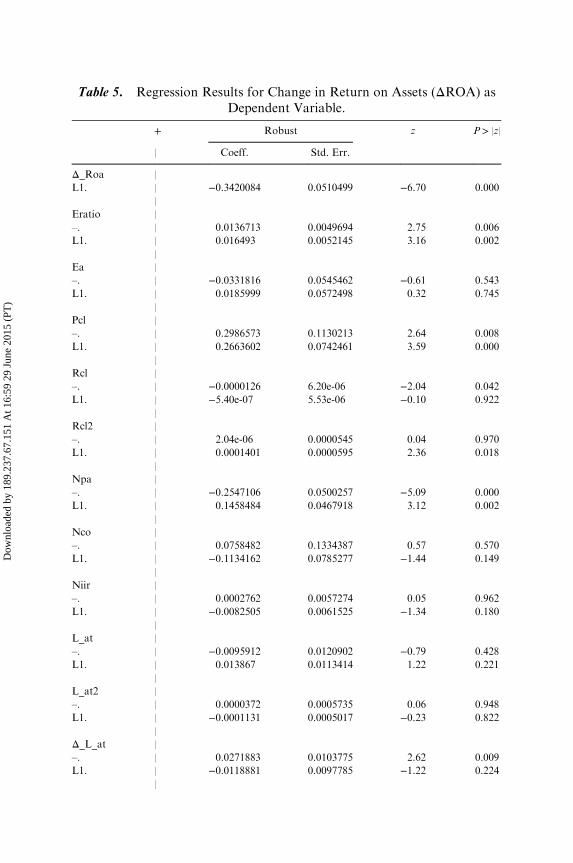
Findings � Among the performance measures, the efficiency ratio andprovisions for credit losses are negatively and equity scaled by assets ispositively related to profitability. However, these relationships eitherreverse (efficiency ratio and provisions for credit losses) or become insig-nificant (equity scaled by assets) when the target becomes change inprofitability. The level of nonperforming assets is negatively related toprofitability across all measures of profitability used. Macroeconomicvariables are largely unrelated to profitability during the year they aremeasured. However, they have a significant relationship with earningschange measures, suggesting they have a lagged effect on profitability.The slope of the yield curve is especially strong in this regard.
Originality � We use our determinants to model changes in bank profit-ability one year ahead, in addition to including several factors notpreviously considered, using the predictive focus of the fundamentalanalysis research.
Keywords: Banking profitability; return on assets (ROA); returnon equity (ROE); efficiency ratio; macroeconomic factors;fundamental analysis research
INTRODUCTION
In this paper, we examine the profitability and performance measurementof U.S. regional banks during the period 1994�2011. Our study extendsprior research (1) by including several factors not previously consideredusing U.S. data and (2) by using our determinants to model changes inbank profitability one year ahead. Research over the last two decadesindicates that the development of a nation’s financial system, including itsstock markets and banks, is an important force furthering its economicwell-being. Banks further economic growth by providing instruments fordiversifying risk and enhancing liquidity (Levine, 2005). Wurgler (2000)shows that countries, in which financial institutions are more developed,capital is allocated to industries based upon their growth potential. Whenthey experience financial distress, economic growth is impeded (Kroszner,Laeven, & Klingebiel, 2007). Declines in bank profitability have also beenlinked to financial instability (Borio, 2003; Tsomocos, 2003).
In the economic environment where the ability to bounce back fromeconomic shocks is highly important, profitability is a critical attribute
190 GLENN GROWE ET AL.
Dow
nloa
ded
by 1
89.2
37.6
7.15
1 A
t 16:
59 2
9 Ju
ne 2
015
(PT
)
(Golin & Delhaise, 2013). Retained profits are a significant source of bankequity (Rime, 2001). Equity is a buffer between losses and insolvency whena bank loses money. During the recent financial crisis, failed banks hadroughly half the equity cushion of surviving banks (Kerstein & Kozberg,2013). Bank profitability has been operationalized as the financialstatement ratios return on assets (ROA) and return on equity (ROE).Other profitability measures include net interest income divided by averageearning assets (net interest margin) and certain economic measures, such aseconomic value added.
Bank-specific, industry-specific, and macroeconomic factors have beenrelated to the measures of bank profitability. Bank-specific variables pri-marily include ratios developed from financial statement accounts, such asthe amount of equity to total assets and the amount of noninterest incometo total revenue. Industry-specific factors characterize industry conditions:For example, the level of concentration in the bank’s market area and theratio of all bank assets to a nation’s gross domestic product (GDP).Macroeconomic factors characterize aspects of overall economic conditionsaffecting all of a nation’s banks during a given period, such as the changesin the GDP or the inflation rate.
A large, international, and rapidly growing literature on the determi-nants of bank profitability regresses bank performance measures on deter-minants contemporaneous with the performance measures (Athanasoglou,Brissimis, & Delis, 2005; Dietrich & Wanzenried, 2011; Trujillo-Ponce,2013). The discovered relationships are proffered as providing perspectiveson enhancing bank performance and avoiding bank failures. In addition todeterminants employed in other studies, we test the usefulness of severalratios from the practitioner literature (Compustat, n.d., and Golin &Delhaise, 2013), as well as certain relatively novel industry-specific andmacroeconomic variables.
The focus on contemporaneous determinants of bank earnings differenti-ates banking profitability studies from a stream of accounting research invol-ving nonfinancial companies which predicts future earnings. This work iscategorized as “fundamental analysis” research. It utilizes financial state-ment, industry, and economic data to predict accounting earnings and equityreturns (Abarbanell & Bushee, 1997; Lev, Li, & Sougiannis, 2010; Seng &Hancock, 2012; Wahlen & Wieland, 2011). Prediction of future earnings hasbeen identified as the central task of “fundamental analysis” research(Abarbanell & Bushee, 1997; Penman, 1992). The approach of predictingfuture performance has been applied to the banking industry only byChronopoulos, Liu, McMillan, and Wilson (2012). In the present paper,
191Profitability and Performance Measurement of U.S. Regional Banks
Dow
nloa
ded
by 1
89.2
37.6
7.15
1 A
t 16:
59 2
9 Ju
ne 2
015
(PT
)
we follow the predictive focus of fundamental analysis research. We buildupon the work of Chronopoulos et al. (2012) by applying our expandedarray of profitability measures to the prediction of bank profitability.
Our results confirm and extend previous research on the bank-specific,industry-specific, and macroeconomic factors determining profitabilitycontemporaneous with those factors. Noninterest expense scaled by incomeand provisions for credit losses are negatively related to profitability.Equity scaled by assets is positively related to profitability. However, theserelationships either reverse (efficiency ratio and provisions for credit losses)or become insignificant (equity scaled by assets) when the dependentvariable becomes change in profitability. Noninterest income measures areunrelated to profitability. Profitability is positively related to spending onnoninterest expenses when scaled by total assets. Macroeconomic factors,while unrelated to profitability during the year they are measured tend tosignificantly relate to the change in profitability, suggesting they have adelayed effect.
The paper is organized as follows. The next section reviews the literatureon determinants of bank profitability. The section that follows thisdescribes the measures of bank profitability and the determinant variableswe use. The next section describes our data and methodology. The nextsection details our empirical results and the final section presents thediscussion of our findings.
LITERATURE REVIEW
We review the literature on the determinants of bank profitability. Becauseof its widespread acceptance, for the sake of conciseness, and to facilitatecomparisons across studies, we cite ROA results unless otherwise specified.We will also describe the approach of fundamental analysis to earningsprediction.
Geographic Scope of Banking Profitability Studies
Several studies have focused on bank profitability in individual countries.Single country studies are of Bangladesh (Sufian & Habibullah, 2009),China (Garcia-Herrero, Gavila, & Santabarbara, 2009; Heffernan & Fu, 2008;
Other studies have examined profitability across multiple countries.These cover South Eastern European countries (Athanasoglou, Delis, &Staikouras, 2006), 12 countries or territories in Europe, North America,and Australia (Bourke, 1989), 80 industrial and developing countries(Demirguc-Kunt & Huizinga, 1999), 5 major European Union countries(Goddard, Molyneux, & Wilson, 2004), countries from the Middle Eastand North Africa region (Olson & Zoubi, 2011), 15 European Union coun-tries (Pasiouras & Kosmidou, 2007), 4 South Asian countries (Perera,Skully, & Chaudhry, 2013), 13 European Union countries (Staikouras &Wood, 2004), 12 advanced economies (Shen, Chen, Kao, & Yeh, 2009),twelve West-European countries (van Ommeren, 2011), 41 countriesfrom Sub-Saharan Africa (Flamini, McDonald, & Schumacher, 2009; 18European countries (Molyneux & Thornton, 1992), twelve Middle Easterncountries (Mirzaei & Mirzaei, 2011), 12 countries including Canada, Japan,and several in Europe (Short, 1979), 42 countries in Sub-Saharan Africa(Francis, 2013), and 3 ASEAN countries (Wahidudin, Subramanian, &Kamaluddin, 2013).
193Profitability and Performance Measurement of U.S. Regional Banks
Dow
nloa
ded
by 1
89.2
37.6
7.15
1 A
t 16:
59 2
9 Ju
ne 2
015
(PT
)
Considering the Results
Generalizing from studies of bank profitability is challenging. Given thedifferences in regulatory standards, accounting rules, and economic envir-onments across countries and time periods covered it is to be expected thatthe results will vary. Diverse statistical regression analyses across studies(i.e., pooled OLS, random effects and fixed effects models, generalizedmethod of moments) may also contribute to the nonuniformity of results.Finally, sample sizes vary widely.
Italicized in parentheses following the initial description of each determi-nant variable will appear the number of studies respectively showing asignificant positive, negative, and insignificant relationship with profitabil-ity. The format will be (<# of studies with + relationship> , <# of studieswith � relationship> , <# of studies with N.S. relationship> ). Thus, if avariable has a relationship with profitability that is positive in 17 studies,negative in 8 studies, and not significant in 7 studies this will be shown as(17, 8, 7).
Bank-Specific Determinants
Almost all bank-specific determinants of profitability are ratios of thevalues of various financial statement accounts. A unique feature of finan-cial statement ratio analysis with banks is that ratio levels represent thebusiness model of the organization. With nonfinancial companies, ratiovalues tend more to represent the outcome of operating activities resultingfrom the firm’s business model. Management’s effect on the values of suchratios is indirect. Examples include accounts receivable or inventory turn-over. Among banks, where money is the “raw material” of the business,ratio values embody aspects of the banks business model. Financial state-ment ratios tend to represent factors over which the bank’s managementexercises control. For example, significant bank ratios include the ratio ofliquid to total assets, the level of equity to total assets, and the degree towhich income is derived from earning interest or from charging fees fornonloan related activities. Thus, how bank financial ratios relate to profit-ability is taken as indicative of how a successful bank should be managed.
Bank-specific determinants include financial statement ratios in fourareas: (1) capital; (2) earnings, profitability, and efficiency; (3) liquidity;and (4) asset quality (Golin, 2001). We will describe several key ratios fromthese areas and show how research has found them related to profitability.
194 GLENN GROWE ET AL.
Dow
nloa
ded
by 1
89.2
37.6
7.15
1 A
t 16:
59 2
9 Ju
ne 2
015
(PT
)
Capital indicators measure the strength of the bank’s capital position,including its ability to withstand and recover from economic shocks. Suchratios include equity to assets, leverage (assets to shareholder’s equity),debt to equity, and equity growth.
Theoretical expectations, as well as empirical results, for the equity toassets ratio (Total equity/Total assets) suggest that the ratio will be posi-tively related to bank profitability (41, 4, 8). More capital means less needfor external funding and a lower cost of capital when it is sought.Bankruptcy risk costs will be less due to the larger safety net in case ofnegative developments. On the other hand, when capital levels are high,low levels of leverage and risk are implied. Some have contended thatshareholders’ profits should be higher when equity level decreases and riskincreases. However, recent theoretical work indicates that, when earningsare mean-reverting, the relationship between leverage and current earningsshould be negative (Sarkar & Zapatero, 2003). There is substantial evidencethat earnings in banking mean-revert (Knapp, Gart, & Chaudhry, 2006). Inaddition, studies across industries have found that the actual relationshipbetween leverage and profitability was negative (Fama & French, 2000;Rajan & Zingales, 1995). The implication is that the level of equity in abank’s capital structure should be positively related to profitability.
Studies showing a positive relationship between capital levels and profit-ability include: Alp et al. (2010), Ameur and Mhiri (2013), Athanasoglouet al. (2005, 2006), Ayadi and Boujelbene (2012), Ayaydin and Karakaya(2014), Ben Naceur and Goaied (2008); Bourke (1989), Demirguc-Kuntand Huizinga (1999), Dietrich and Wanzenried (2011), Flamini et al.(2009), Francis (2013), Garcia-Herrero et al. (2009), Jabbar (2014), Javaidet al. (2011), Kanas et al. (2012), Khrawish (2011), Kosmidou et al. (2005),Lee (2012), Lee and Hsieh (2013), Liu and Wilson (2010), Macit (2012),Mamatzakis and Remoundos (2003), Mirzaei and Mirzaei (2011),Molyneux and Thornton (1992), Olson and Zoubi (2011), Ongore and Kusa(2013), Pasiouras and Kosmidou (2007), Perera et al. (2013), Poposka andTrpkoski (2013), Ramadan et al. (2011), Saeed (2014), Sastrosuwito andSuzuki (2012), Shen et al. (2009), Sufian and Chong (2008), Trujillo-Ponce(2013), van Ommeren (2011), Vong and Chan (2009), Wahidudin et al.(2013), Wall (1985), and Zimmerman (1996). Studies finding a negative rela-tionship include: Ali et al. (2011), Chronopoulos et al. (2012), Goddardet al. (2004), Guru et al. (2002). In other studies, this relationship was notsignificant (Al-Jafari & Alchami, 2014; Almumani, 2013; Alper & Anbar,2011; Heffernan & Fu, 2008; Sufian & Noor, 2012; Tan & Floros, 2012;Tregenna, 2009; Turgutlu, 2014).
195Profitability and Performance Measurement of U.S. Regional Banks
Dow
nloa
ded
by 1
89.2
37.6
7.15
1 A
t 16:
59 2
9 Ju
ne 2
015
(PT
)
In the earnings, profitability, and efficiency area, a key ratio is the effi-ciency or cost to income ratio (Noninterest expense/Total income) (0, 18, 3).Included in noninterest expenses are administrative, compensation, market-ing, and property costs. Higher numbers indicate a bank is operating lessefficiently. Its relationship with profitability is almost uniformly negative(Alexiou & Sofoklis, 2009; Almumani, 2013; Ameur & Mhiri, 2013; Bhatiaet al., 2012; Bourke, 1989; Cerci et al., 2012; Dietrich & Wanzenried, 2011;Francis, 2013; Heffernan & Fu, 2008; Kosmidou et al., 2005; Liu &Wilson, 2010; Olson & Zoubi, 2011; Pasiouras & Kosmidou, 2007; Rachdi,2013; Sastrosuwito & Suzuki, 2012; Trujillo-Ponce, 2013; Turgutlu, 2014;van Ommeren, 2011). Failure of this variable to significantly relate to prof-itability was found in the work by Ali et al. (2011), Flamini et al. (2009),and Vong and Chan (2009). Mixed results have also been reported(Tregenna, 2009).
Another earnings, profitability, and efficiency ratio is the cost to assetsratio (Noninterest expense/Total assets) (5, 10, 1). This ratio is less variablethan the efficiency ratio which fluctuates with yearly income. Several stu-dies have found that high values on it lower profitability (Alp et al., 2010;Athanasoglou et al., 2005, 2006; Demirguc-Kunt & Huizinga, 1999; Sohailet al., 2013; Staikouras & Wood, 2004; Sufian, 2011; Sufian & Chong,2008; Tan & Floros, 2012; Wahidudin et al., 2013). Other studies(Al-Jafari & Alchami, 2014; Ben Naceur & Goaied, 2008; Mirzaei &Mirzaei, 2011; Sufian & Habibullah, 2009; Sufian & Noor, 2012) found apositive and significant relationship with bank performance. One explana-tion offered was that more qualified staff whose presence boosts perfor-mance may, in some contexts, require higher compensation. Anotherpossibility is that the direction of causality is from more profitable banksbeing willing to spend more money on noninterest expenses. One studyfound this ratio did not significantly relate to profitability (Chantapong,2005).
While banks’ main income source is interest income, noninterest revenuehas become increasingly significant in recent years. Noninterest incomeincludes bank fees, service charges, dividend income, securitization, andtrading profit/loss. Legal changes in the United States, such as the 1994Riegle-Neal Interstate Banking and Branching Efficiency Act, the 1999Gramm-Leach-Bliley Act, as well as technological and competitive changeshave encouraged banks to expand into nonbanking activities. While thistype of income offers banks a degree of diversification, it is seen as lesssustainable and of lower quality than interest income (Golin & Delhaise,2013).
196 GLENN GROWE ET AL.
Dow
nloa
ded
by 1
89.2
37.6
7.15
1 A
t 16:
59 2
9 Ju
ne 2
015
(PT
)
One measure of revenues from such activities is the noninterest contribu-tion to revenues (Noninterest income/Operating income or revenues) ratio(2, 4, 1). In a minority of studies, noninterest income has been found tosignificantly and positively affect profitability (Alper & Anbar, 2011;van Ommeren, 2011). It failed to reach significance in another study(Kanas et al., 2012). Other studies report that the proportion of non-interest income was negatively related to profitability (Agustini, 2011;Chronopoulos et al., 2012; Raza et al., 2013; Tan & Flores, 2012). Somehave suggested that this may be due to lower margins in these highlycompetitive business activities. The apparently mixed relationship of thesenewer activities to profitability adds to concerns that such activities tend tobe difficult to monitor and control, while increasing risk (DeYoung & Rice,2004; Morris, 2011; Stiroh & Rumble, 2006). A variant ratio also reflectingthe degree of the mix of interest and noninterest revenue (Net interest rev-enues/Other operating income) showed that bank activity diversificationpositively influenced profitability (Flamini et al., 2009).
Another indicator of the contribution of noninterest income is the nonin-terest income to total assets ratio (Noninterest income/Assets) (4, 1, 2).Positive and significant relationships with profitability have been reported(Bhatia et al., 2012; Sufian, 2011; Sufian & Chong, 2008; Sufian & Noor,2012). A significantly negative relationship was also reported (Sufian &Habibullah, 2009). A nonsignificant relationship has been reported(Chantapong, 2005; Heffernan & Fu, 2008).
A measure of diversification of assets is noninterest-bearing assets inrelation to total assets (Nonloan assets/Total assets) (0, 1, 1). A multina-tional study using this ratio (Demirguc-Kunt & Huizinga, 1999) found nosignificant relationship to profitability for the entire sample. They went onto explore the interaction of noninterest earning assets and per capita GDPand found that the presence of noninterest earning assets depressedearnings in high-income countries more than in low-income nations.Apparently, at higher income levels lending activities are more profitablethan noninterest activities. A negative relationship of this variable withprofitability has also been reported (Wahidudin et al., 2013).
The economic contribution to the bank on a per employee basis has beenstudied with an expected effect that labor productivity (<Profit measure> /Number of employees) has a positive effect upon bank profits (3, 1, 1).Most studies support this view (e.g., Athanasoglu et al., 2005; Bhatia et al.,2012; Tan & Floros, 2012). A study from Greece found a negative and sig-nificant effect on profitability (Alexiou & Sofoklis, 2009). The explanationoffered was that Greek banks had a suboptimal number of employees for
197Profitability and Performance Measurement of U.S. Regional Banks
Dow
nloa
ded
by 1
89.2
37.6
7.15
1 A
t 16:
59 2
9 Ju
ne 2
015
(PT
)
the assets under management. One study shows no significant relationship(Aburime, 2008).
A key liquidity ratio is the liquid assets ratio (Liquid assets/Total assets)(4, 4, 1). Components of liquid assets may vary across countries, but gener-ally include cash, government securities, interbank deposits, and short-termmarketable securities (Golin & Delhaise, 2013). Lower liquidity meanshigher risk. The portfolio theory suggests higher risk leads to higher profit-ability. In accordance with this perspective, some studies have found thatthe liquidity ratio was negatively related to profitability (Alp et al., 2010;Goddard et al., 2004; Lee & Hsieh, 2013; Molyneux & Thornton, 1992).Liquid assets typically earn a lower rate of return than the longer termloans banks make. However, in some studies, liquidity was found to bepositively related to profitability, despite the conventional wisdom thatliquidity holdings represented assets earning a smaller profit (Bourke, 1989;Kosmidou et al., 2005; Poposka & Trpkoski, 2013; Shen et al., 2009). Therationale offered was that more liquid banks had less need to resort tocostly external funding. Less expensive funding meant increased income.Bordeleau and Graham (2010) posited that liquidity levels affected profit-ability in two ways. First, liquidity lowers a bank’s insolvency risk reducingfinancing costs and improving profitability. Second, liquid assets have alower return than nonliquid assets, reducing profitability. At low levels ofliquidity, the first effect is more pronounced. As liquidity increases, theopportunity cost of foregone income comes to predominate and increasingliquidity lowers profitability. Thus, the overall relationship between liquid-ity and profitability is nonlinear. In a sample of United States andCanadian banks, Bordeleau and Graham (2010) found evidence of adownward-concave parabolic relationship between liquidity and profitabil-ity. Thus, holding some liquid assets increases profitability, but a point isreached where holding further liquid assets lessens profitability. Duringeconomically stressful and risky times, the profit-maximizing liquidity levelincreases. One study found that this ratio did not relate significantly toprofitability (Alper & Anbar, 2011).
Liquidity has also been measured by liquid assets to total deposits(Liquid assets/deposits) (0, 1, 2). It has been negatively related to profitabil-ity in one study (Al-Jafari & Alchami, 2014) and found to be not signifi-cantly related in others (Almumani, 2013; Ayaydin & Karakaya, 2014).
A widely used liquidity measure is the loans-to-total assets ratio (Totalloans/Assets) (12, 12, 13). Loans are less liquid than the other main compo-nent of a bank’s asset portfolio � investment securities. Hence, highervalues of this ratio denote less liquidity. Because loans earn higher raw
198 GLENN GROWE ET AL.
Dow
nloa
ded
by 1
89.2
37.6
7.15
1 A
t 16:
59 2
9 Ju
ne 2
015
(PT
)
rates of return than more secure assets, this ratio may be positively relatedto profitability. This advantage may be eroded by the higher administrativeand transaction costs of loans. If there are substantial loan defaults,because a bank’s credits are substandard or economic conditions areadverse, a large loan portfolio can lead to reduced profitability. If a bank ispaying a high cost to fund the loans their impact on profitability will benegative. Higher liquidity may act to increase profitability by reducinginsolvency risk costs. Studies, finding that the larger the share of loans onthe balance sheet the greater will be the bank’s profitability, includeFrancis (2013), Gul et al. (2011), Karimzadeh et al. (2013), Lee (2012),Mamatzakis and Remoundos (2003), Olson and Zoubi (2011), Ramadanet al. (2011), Sastrosuwito and Suzuki (2012), Sufian (2011), Sufian andHabibullah (2009), Trujillo-Ponce (2013), and Zimmerman (1996). In otherstudies, this relationship failed to reach significance (Almumani, 2013;Alp et al., 2010; Athanasoglou et al., 2006; Ayadi & Boujelbene, 2012;Ayaydin & Karakaya, 2014; Ben Naceur & Goaied, 2008; Chantapong,2005; Javaid et al., 2011; Lee, 2012; Liu & Wilson, 2010; Rachdi, 2013;Saeed, 2014; Tan & Floros, 2012). In other studies, the relationship of thesize of the credit portfolio and profitability was negative (Aburime, 2008;Chronopoulos et al., 2012; Demirguc-Kunt & Huizinga, 1999; Heffernan &Fu, 2008; Lee & Hsieh, 2013; Mirzaei & Mirzaei, 2011; Naseem et al, 2012;Raza et al., 2013; Staikouras & Wood, 2004; Sufian & Noor, 2012; Vong &Chan, 2009; Wall, 1985). The widespread nonperformance of bank loans,typical in the country in which the study was performed, was cited in onestudy. Another suggested that, in certain contexts, nonloan assets may bemore profitable. Intense competition in the credit market may drive loansrates down, reducing lenders’ profits.
Another liquidity ratio is net loans-to-deposits (Net loans/deposits)(2, 3, 3). A figure in the 70�90% range is seen as optimal (Golin &Delhaise, 2013), with higher numbers being on the risky side and below thisrange is conservative. Alexiou and Sofoklis (2009) found a significantlynegative relationship for Greek banks although the average level of thisratio in their sample was 79%. Perera et al. (2013) also found that highervalues on this ratio lessened profitability. Higher amounts of nonperform-ing assets and increased liquidity costs were cited. In a Chinese sample, theratio averaged 198.34% and the relationship with profitability was negative(Lee & Hsieh, 2013). Positive and significant relationships with profitabilityhave also been reported (Flamini et al., 2009; Sohail et al., 2013). Both ofthese studies reported averages on this ratio below 70%. This may suggestthat when most banks in a sample are conservative in their credit risk
199Profitability and Performance Measurement of U.S. Regional Banks
Dow
nloa
ded
by 1
89.2
37.6
7.15
1 A
t 16:
59 2
9 Ju
ne 2
015
(PT
)
levels, those with higher exposures can be more profitable. Other studiesfound this ratio not significantly related to profitability (Bhatia et al., 2012;Lee & Kim, 2013; Ongore & Kusa, 2013).
Asset quality indicators provide indications of difficulties with a bank’sloan portfolio. Problems with a bank’s asset quality are usually assumed tolower profitability. One asset quality indicator is the NPL (nonperformingloans) ratio (Nonperforming loans/Total loans) (0, 5, 0). This measure hasbeen found to be significantly and negatively related to profitability (Lee,2012; Macit, 2012; Ongore & Kusa, 2013; Poposka & Trpkoski, 2013,Trujillo-Ponce, 2013).
Another widely used asset quality measure is the reserves to loans ratio(Loan loss reserves/Total loans) (4, 16, 2). Banks with a higher proportionof reserves may be those with more aggressive lending strategies. High riskloans can be expected to lead to nonperforming loans and reductions ininterest revenue. However, this effect may be offset by higher interest ratescharged by lenders to riskier borrowers. The usefulness of this ratio hasbeen questioned, because the level of reserves may not indicate the levelof problem loans they are meant to provide against (Golin & Delhaise,2013). Several studies have found this ratio to be negatively and signifi-cantly related to profitability (Alexiou & Sofoklis, 2009; Ali et al., 2011;Al-Jafari & Alchami, 2014; Athanasoglou et al., 2005, 2006; Ayaydin &Karakaya, 2014; Kanas et al., 2012; Liu & Wilson, 2010; Ramadan et al.,2011; Raza et al., 2013; Shen et al., 2009; Staikouras & Wood, 2004;Sufian & Chong, 2008; Tan & Floros, 2012; Trujillo-Ponce, 2013; Vong &Chan, 2009). In Switzerland, a country with historically low loan loss provi-sions, such loss provisions prior to the financial crisis years did not have astatistically significant effect on profitability. During the crisis years of2007�2009, they increased and did have a significantly negative relationshipwith profitability (Dietrich & Wanzenried, 2011). Some studies reported apositive relationship between this ratio and profitability (Heffernan & Fu,2008; Olson & Zoubi, 2011; Riaz, 2013; Sufian & Habibullah, 2009). Oneexplanation, referred to as the “skimping hypothesis,” is that a bank mayrationally reduce loan underwriting and monitoring costs as doing so mayoffset higher nonperformance costs (Berger & DeYoung, 1997). The gener-ally negative effect of this measure on profitability has been taken toindicate that banks should focus on credit risk management. Two studiesfound an insignificant relationship between this variable and profitability(Kosmidou et al., 2005; Mamatzakis & Remoundos, 2003).
Loan loss reserves to total assets (Loan loss reserves/Total assets) (0, 1, 0)have been found to relate negatively to profitability (Chantapong, 2005).
200 GLENN GROWE ET AL.
Dow
nloa
ded
by 1
89.2
37.6
7.15
1 A
t 16:
59 2
9 Ju
ne 2
015
(PT
)
Loan loss provisioning to average assets (Loan loss provisioning/Averageassets) is also reflective of asset quality (0, 4, 0). It has exclusively beenfound to be significantly and negatively related to profitability (Bhatiaet al., 2012; Chaudhry et al., 1995; Jabbar, 2014; Sohail et al., 2013).
Loan loss provisioning to loans (Loan loss provisions/Total loans) wassignificantly and negatively related to profitability (Mirzaei & Mirzaei,2011) in one study and not significantly related in another (Almumani,2013) (0, 1, 1).
Another asset quality indicator is net charge-offs to total loans (Netcharge-offs/Loans) (1, 0, 0). Charge-offs reflect a recognition of bad loansand the consequent cleaning up of the bank’s loan book. The usefulness ofthis ratio may be limited, since write-offs can arise from either forward-looking adjustments or remedial action for situations long determined tobe unfavorable. A study which examined determinants of profitability oneyear ahead found a positive relationship with profitability. The interpreta-tion was that actions improving the quality of the bank’s assets in one yearfavorably affect profits the following year (Chronopoulos et al., 2012).
Loan growth measures growth in the bank’s primary business activitywhich presumably would not be undertaken unless profitable investmentopportunities were present (Percentage change in total loans) (0, 0, 1).Thus, a positive relationship to profitability is expected. However, suchgrowth can reflect negatively on asset quality if it is too robust. Theconcern is that the bank may not have adequately evaluated prospectiveborrowers (Golin & Delhaise, 2013). However, the prevailing methodologyof looking at profitability, contemporaneous with the determinant indepen-dent variables may hide the significance of high values on this ratio, sincethere will be a lag of months to years between the creation of a pool ofloans and their falling to a nonperforming status. Only one study thus farhas included this measure, and found it to be insignificantly related toprofitability (van Ommeren, 2011).
The size of the bank, as measured by the logarithm of total assets isanother bank-specific variable (16, 9, 15). Increased size is presumed toconfer benefits which can enhance profitability. Included are greater marketpower, improved technological efficiency, and the ability to secure fundingat a lower cost. However, increasing size beyond a certain point may leadto scale inefficiencies as the organization’s bureaucracy impedes communi-cation. Larger size may allow banks to diversify, affecting both risk andprofitability and decision making. Thus, the relationship between sizeand profitability may be nonlinear or ambiguous. Studies have founda positive relationship between size and profitability (Agustini, 2011;
201Profitability and Performance Measurement of U.S. Regional Banks
Dow
nloa
ded
by 1
89.2
37.6
7.15
1 A
t 16:
59 2
9 Ju
ne 2
015
(PT
)
Alexiou & Sofoklis, 2009; Al-Jafari & Alchami, 2014; Alper & Anbar,2011; Alp et al., 2010; Athanasoglou et al., 2006; Ayadi & Boujelbene,2012; Gul et al., 2011; Jabbar, 2014; Karimzadeh et al., 2013; Khrawish,2011; Lee, 2012; Mirzaei & Mirzaei, 2011; Naseem et al., 2012; Sufian &Noor, 2012; Zimmerman, 1996). Others report a negative relationship(e.g., Ameur & Mhiri, 2013; Kosmidou et al., 2005; Lee & Hsieh, 2013;Macit, 2012; Pasiouras & Kosmidou, 2007; Perera et al., 2013; Rachdi,2013; Sohail et al., 2013; Sufian & Chong, 2008). Some studies have foundsize unrelated to profitability (Aburime, 2008; Almumani, 2013;Athanasoglou et al., 2005; Goddard et al., 2004; Guru et al., 2002;Heffernan & Fu, 2008; Olson & Zoubi, 2011; Ramadan et al., 2011; Saeed,2014; Sastrosuwito & Suzuki, 2012; Sufian, 2011; Tan & Floros, 2012;Trujillo-Ponce, 2013; Turgutlu, 2014; van Ommeren, 2011).
To assess the possible presence of a nonlinear relationship between sizeand profitability as discussed above, the square of the logarithm of totalassets is related to profitability. A nonlinear relationship is indicated whenthe size is positively related and the square of the size variable is negativelyrelated to profitability. Several recent studies have found just such a rela-tionship (Chronopoulos et al., 2012; Flamini et al., 2009; Lee & Kim, 2013;Mamatzakis & Remoundos, 2003; Mirzaei & Mirzaei, 2011; Shen et al.,2009; Tregenna, 2009). This was taken as confirmation of the theory thateconomies of scale enhance profitability up to a certain size beyond whichthe effect diminishes and scale inefficiencies predominate. A similar resultwas obtained by Staikouras and Wood (2004) who split their sample intolarge and small banks. Among small banks, size was positively related toprofitability. Among large banks, the relationship was negative. This wastaken as evidence for diseconomies of scale from a certain size upwards.
There is substantial evidence that bank profitability levels persist fromone year to the next. Thus, the lagged profitability is used as a determinantof profitability in the base year (13, 1, 0). Studies of bank profitability havefound lagged profitability to be significantly predictive of current profitabil-ity (Ameur & Mhiri, 2013; Athanasoglou et al., 2005; Ayaydin & Karakaya,2014; Chronopoulos et al., 2012; Dietrich & Wanzenried, 2011;Garcia-Herrero et al., 2009; Lee & Hsieh, 2013; Mirzaei & Mirzaei, 2011;Perera et al., 2013; Rachdi, 2013; Tan & Floros, 2012; Trujillo-Ponce,2013; van Ommeren, 2011). One study has found a negative relationshipbetween previous and current year’s profitability (Al-Jafari & Alchami,2014). Other studies have explored the determinants of this persistence(Berger, Bonime, Covitz, & Hancock, 2000; Goddard, Liu, Molyneux, &Wilson, 2011).
202 GLENN GROWE ET AL.
Dow
nloa
ded
by 1
89.2
37.6
7.15
1 A
t 16:
59 2
9 Ju
ne 2
015
(PT
)
Industry-Specific Determinants
Bank industry determinants are external factors that may relate to bankprofitability, such as the extent of industry concentration and the size ofthe banking system in relation to the size of the economy as a whole.
Industry concentration is the degree to which the industry in a market isserved by just a few or by many banks (19, 6, 10). When a banking marketis more concentrated, customers have fewer choices, competition is less,and the market power of individual banks is greater. With greater industryconcentration, the profitability of individual banks may be enhanced by theearning of monopolistic profits. That the overall profitability of banks maynot be enhanced by market concentration is suggested by the “noisiness” ofbank profits. That is, bank profits are multi-determined and concentrationalone may not have a discernible effect. Another possibility is that concen-tration may offer competitive advantages but profitability is not increased,because the benefits are expended by management pursuing a “quiet life” inthe form of a more relaxed environment in which costs are allowed to riseand revenue-enhancing opportunities are foregone (Berger & Humphrey,1994). Thus, concentration may lead to greater revenues, but these will beoffset by greater expenses incurred by banks in more concentrated markets,such that the effect of concentration on profitability is negligible. There issome evidence that this is indeed what happens (Wall, 1985). In addition,any correlation between concentration and profitability may be spuriousbecause increased managerial efficiency can lead to both increased marketshare and greater profits (Berger, 1995).
Concentration can be assessed as the assets of the top X number ofbanks to the total assets held by banks. Another common method is theHerfindahl�Hirschman Index. However, for banks greater in size thancommunity banks (i.e., regional and diversified banks), the measurement ofmarket concentration is problematic. Larger banks operate in several mar-kets, and using the location of the home office most likely will not necessa-rily reflect the market concentration faced by the bank. More complexschemes, such as weighting the concentration indices for the multiplemarkets the bank operates in by the proportion of the deposits derivedfrom the market also have difficulties (Wall, 1985). A new concentrationindex, using the weighted share of the largest 2% and 5% of institutions,has also been developed (Tregenna, 2009).
Studies finding a positive relationship between the degree of industryconcentration and profitability include Athanasoglou et al. (2006), Ayaydinand Karakaya (2014), Bourke (1989), Demirguc-Kunt and Huizinga (1999),
203Profitability and Performance Measurement of U.S. Regional Banks
Dow
nloa
ded
by 1
89.2
37.6
7.15
1 A
t 16:
59 2
9 Ju
ne 2
015
(PT
)
Dietrich and Wanzenried (2011), Goddard et al. (2004), Karimzadeh et al.(2013), Kosmidou et al. (2005), Lee and Hsieh (2013), Molyneux andThornton (1992), Pasiouras and Kosmidou (2007), Perera et al. (2013),Rachdi (2013), Sastrosuwito and Suzuki (2012), Shen et al. (2009), Short(1979), Sufian (2011), Tregenna (2009), Trujillo-Ponce (2013). Bourke(1989) reports findings in conjunction with the concentration measure sug-gesting that profits rise with increased concentration because overheadexpenses are squeezed along with concentration. Studies have found a sig-nificant negative relationship between concentration and profitability(e.g., Ameur & Mhiri, 2013; Chronopoulos et al., 2012; Kanas et al., 2012;Liu & Wilson, 2010; Ramadan et al., 2011; Tan & Floros, 2012). Othershave found no significant relationship (e.g., Al-Jafari & Alchami, 2014;Athanasoglou et al., 2005; Ayadi & Boujelbene, 2012; Ben Naceur &Goaied, 2008; Mamatzakis & Remoundos, 2003; Olson & Zoubi, 2011;Staikouras & Wood, 2004; Turgutlu, 2014; van Ommeren, 2011; Vong &Chan, 2009). Findings on the relationship between concentration and profit-ability have policy implications. Results suggesting that concentrationincreases bank profitability at the expense of nonbanking entities have beentaken to justify intensifying the regulation of banks (Tregenna, 2009).
The relative size of the banking system to the entire economy (Total bankassets/GDP) has also been related to overall profitability (2, 3, 2). A nega-tive relationship is expected, because when the banking sector is larger, itcan be expected to be more competitive, which lowers the profitability ofindividual banks. Negative relationships between this ratio and bank profit-ability were found by Ameur and Mhiri (2013), Ayadi and Beoujelbene(2012), and Demirguc-Kunt (1999). A positive and significant effect ofbanking sector development and profitability has been found in certainstudies (Raza et al., 2013; Tan & Floros, 2012). These latter results werefound in China and Pakistan. The authors speculated that, in less devel-oped countries, greater financial system development can enhance efficiencyand profitability. A finding of no significant relationship has also beenreported (Agustini, 2011; Ramadan et al., 2011).
Another industry-based indicator is the ratio of stock market capitaliza-tion to the total assets of the banking system (Stock market capitalization/Total bank assets) (2, 1, 0). The size of the stock market may signal a com-petitive challenge to banks, or be complementary to banking operations.Companies can meet their financing needs from issuing stock, as well asborrowing from banks. The better developed the stock market and thehigher the values in it, the more easily the stock market can substitutefor bank finance. Stock market size may be complementary to bank
204 GLENN GROWE ET AL.
Dow
nloa
ded
by 1
89.2
37.6
7.15
1 A
t 16:
59 2
9 Ju
ne 2
015
(PT
)
profitability, if this increases the information flow about companies,enabling banks to make wiser lending decisions and better monitor loancustomers. Two studies have supported the complementarity relationship,as larger stock market size increased bank profits (Ben Naceur & Goaied,2008; Kosmidou et al., 2005). A negative relationship between stock marketdevelopment and bank profitability has also been reported (Agustini,2011).
Macroeconomic Determinants
Economic growth is thought to impact bank profitability favorably, byincreasing loan demand, decreasing loan default rates, and allowing banksto charge more for their services. This may be offset by increasing thesupply of banking services, as expansions and new entrants are encouragedby perceived favorable conditions. This variable is assessed by the year’sreal change in gross domestic product (GDP) for the nation the bank islocated in, sometimes on a per capita basis (14, 5, 21). GDP growth waspositively related to profitability in a number of studies (Ali et al., 2011;Chronopoulos et al., 2012; Dietrich & Wanzenried, 2011; Goddard, et al.,2004; Gul et al., 2011; Karimzadeh et al., 2013; Kosmidou et al., 2005;Lee & Hsieh, 2013; Lee & Kim, 2013; Shen et al., 2009; Trujillo-Ponce,2013, Turgutlu, 2014; van Ommeren, 2011; Vejzagic & Zarafat, 2014). Thisvariable was not significantly related in several studies (Alexiou & Sofoklis,2009; Alper & Anbar, 2011; Ameur & Mhiri, 2013; Ayadi & Boujelbene,2012; Ben Naceur & Goaied, 2008; Demirguc-Kunt & Huizinga, 1999;Francis, 2013; Kiganda, 2014; Macit, 2012; Mirzaei & Mirzaei, 2011;Ongore & Kusa, 2013; Poposka & Trpkoski, 2013; Ramadan et al., 2011;Riaz, 2013; Saeed, 2014; Naseem et al., 2012; Sufian, 2011; Sufian &Chong, 2008; Sufian & Habibullah, 2009; Sufian & Noor, 2012; Vong &Chan, 2009). There are also reports of a negative association between thisvariable and profitability (Al-Jafari & Alchami, 2014; Ayaydin &Karakaya, 2014; Khrawish, 2011; Liu & Wilson, 2010; Staikouras & Wood,2004). The negative association was interpreted as reflecting increasedease of entry and consequent competition and reduced profitability withGDP growth.
The GDP growth variable has been lagged by one year under theassumption that, it will take time for the effect of a change to filter throughto banks and their customers (Heffernan & Fu, 2008). When used in thisway, it had a positive relationship with profitability.
205Profitability and Performance Measurement of U.S. Regional Banks
Dow
nloa
ded
by 1
89.2
37.6
7.15
1 A
t 16:
59 2
9 Ju
ne 2
015
(PT
)
The inflation rate is assessed by entering in the CPI change rate for thenation and the year (14, 7, 15). It can have both direct and indirect effectsupon bank profits (Staikouras and Wood (2004). Direct effects include anincrease in prices banks pay for inputs, such as labor, equipment, and facil-ities. Indirect effects on profitability may come through changes in interestrates and asset values. The extent to which inflation is successfully foreseenby bank management may determine its effect upon bank profitability(Perry, 1992). When anticipated, banks can adjust their rates to offset it.If it is not anticipated, costs may increase faster than revenues and profitswill decline. It has been suggested that, because banks, in their maturitytransformation role, lend money for longer periods than they borrow it for,inflation tends to decrease their margins and profits (Bordeleau & Graham,2010). CPI was negatively related to profitability across a number ofstudies: (Ali et al., 2011; Ayaydin & Karakaya, 2014; Francis, 2013;Khrawish, 2011; Ongore & Kusa, 2013; Rachdi, 2013; Sufian & Chong,2008). Inflation rate was found to be unrelated to profitability in manystudies: (Alexiou & Sofoklis, 2009; Al-Jafari & Alchami, 2014; Alper &Anbar, 2011; Ameur & Mhiri, 2013; Ayadi & Boujelbene, 2012; BenNaceur & Goaied, 2008; Karimzadeh et al., 2013; Kiganda, 2014; Macit,2012; Mamatzakis & Remoundos, 2003; Mirzaei & Mirzaei, 2011; Ramadanet al., 2011; Saeed, 2014; Sastrosuwito & Suzuki, 2012; Vejzagic & Zarafat,2014). In other studies, the relationship was positive (Athanasoglou et al.,2005, 2006; Guru et al., 2002; Demirguc-Kunt & Huizinga, 1999; Flaminiet al., 2009; Garcia-Herrero et al., 2009; Gul et al., 2011; Raza et al., 2013;Riaz, 2013; Shen et al., 2009; Sufian, 2011; Tan & Floros, 2012; Trujillo-Ponce, 2013; Vong & Chan, 2009).
Inflation was positively related to profitability among a nation’sdomestically-owned banks, and negatively related among foreign-ownedbanks (Pasiouras & Kosmidou, 2007). This could have been due to differ-ences in the ability to anticipate nation-specific economic news dependingupon their understanding of the country’s economic condition.
Another macroeconomic variable studied is the ratio of the nation’s stockmarket capitalization to GDP (Stock market capitalization/GDP) (3, 1, 3).A complementary effect between the development of a nation’s bankingsystem and stock markets has been suggested by Levine (1997). A moredeveloped equity market makes it easier for banks to raise capital. As notedabove, higher capitalization is associated with increased profitability. Also,a more developed stock market means company information is more avail-able. This enables banks to better judge credit risk. A positive value forthis variable was found in Ben Naceur and Goaied (2008), Sufian (2011),
206 GLENN GROWE ET AL.
Dow
nloa
ded
by 1
89.2
37.6
7.15
1 A
t 16:
59 2
9 Ju
ne 2
015
(PT
)
Tan and Floros (2012). A negative relationship arose in Liu and Wilson’s(2010) work. This was interpreted as due to a high value of this ratio asreflecting a buoyant stock market associated with firm decisions to financethrough equity issues rather than bank loans, thereby reducing bank’s busi-ness opportunities. A lack of a significant relationship was noted in otherstudies (Raza et al., 2013; Sufian & Chong, 2008; Sufian & Noor, 2012).
The term structure of interest rates has been related to bank profitability(1, 0, 1). It has been defined as the difference between the yield on the10-year Treasury note (United States) or interest rate swap (Europe)and the 3-month Treasury bill (United States) or EURIBOR (Europe)(Estrella & Mishkin, 1996; Golin & Delhaise, 2013; van Ommeren, 2011).Because banks tend to utilize short-term customer deposits to financelonger term loans, a steeper yield curve leads to a greater differencebetween their revenues and costs. Thus, a positive relationship between theyield curve and bank profitability is expected. This expected positive rela-tionship was found by Dietrich and Wanzenried (2011). However, thisstudy assessed the yield curve using the difference between the five-year andtwo-year Swiss Treasury bills. In a study of European banks, no relation-ship with profitability was found between the yield curve as measured bythe difference between the 10-year EUR interest rate swap and the three-month EURIBOR (van Ommeren, 2011).
It has been suggested that the absolute level of interest rates (as mea-sured by the real interest rate on government bonds or the average interestrate charged by banks) may be a determinant of bank profitability(van Ommeren, 2011) (4, 1, 3). This is because, it is expected to correlate tothe difference between what a bank can earn on interest-bearing loans andthose sources of funds on which it pays zero interest � equity and customerdeposit accounts. The higher the interest rate level, the greater the profit-ability. A positive effect on profitability of real interest rates has beenfound (Demirguc-Kunt & Huizinga, 1999; Garcia-Herrero et al., 2009;Macit, 2012; Molyneux & Thornton, 1992). One study found a negativerelationship (Riaz, 2013). Insignificant relationships have also been found(Karimzadeh et al., 2013; Turgutlu, 2014; Vejzagic & Zarafat, 2014).
Earnings Prediction by Fundamental Analysis Research
Fundamental analysis uses financial ratios and other information about thecompany, or its industry, to predict future earnings and/or equity values(Richardson, Tuna, & Wysocki, 2010). This task involves practitioners,
207Profitability and Performance Measurement of U.S. Regional Banks
Dow
nloa
ded
by 1
89.2
37.6
7.15
1 A
t 16:
59 2
9 Ju
ne 2
015
(PT
)
such as equity analysts, as well as academics (Stickney, 1997). Futureearnings performance in the academic literature in this area has been opera-tionalized as changes in earnings per share (Abarbanell & Bushee, 1997;Seng & Hancock, 2012) or changes in a core earnings measure (Li, 2003)between a base year and one or more years into the future. The predictiveratios used have been applicable across a wide range of industries.Financial services companies have been excluded due to the unique natureof their financial statement accounts. There have been calls for the develop-ment of industry-specific or “contextual” fundamental analysis models(Sloan, 2001).
MEASURES OF BANK PROFITABILITY AND
DETERMINANT VARIABLES
Next, we will describe the measures of bank profitability, followed by adescription of the independent variables.
Dependent Variables: Measures of Profitability
We use return on assets (ROA) and the change in ROA from year t to t+ 1as our primary measures of bank profitability. Return on equity (ROE)and the change in return on equity from year t to year t+ 1 are our second-ary measures of profitability. We designate the dependent variable of ROAcontemporaneous with the primary determinant variables as ROAt. Thedependent variable of the change in ROA between the base year and thefollowing year is designated ΔROA. The corresponding ROE dependentvariables are designated ROEt and ΔROE.
In calculating ROA, we use the averaged assets in the denominator. Weretain the designation ROA. ROE uses the most current year’s equity inthe denominator.
ROA has been the most widely used in the literature, and is invariablypresent among whichever the subset of measures used. There are severalreasons why the ROA measure is preferred. First, assets directly reflectboth income and expense levels (Olson & Zoubi, 2011). Second, ROA doesnot vary according to the amount of leverage employed, as does ROE(Golin & Delhaise, 2013). Thus, high ROE may reflect good profitability orrestricted equity capital (European Central Bank, 2010). By measuring
208 GLENN GROWE ET AL.
Dow
nloa
ded
by 1
89.2
37.6
7.15
1 A
t 16:
59 2
9 Ju
ne 2
015
(PT
)
profitability solely in relation to a bank’s asset base, ROA has attributescharacteristic of a core profitability indicator. A downside is that it doesnot include off-balance sheet items.
Independent Variables: Determinants of Profitability
Factors explaining bank profitability have been divided among those withinthe bank and reflecting managerial actions (bank-specific determinants)and those external to the bank mirroring banking industry and macroeco-nomic conditions. Bank-specific determinants are largely derived fromratios of financial statement accounts, and assume unique values for eachbank-year. Macroeconomic and industry variables take a value determinedfor the entire economy or banking industry for a given year.
Bank-Specific (Internal) DeterminantsThe ratio measures employed, while reflective of the literature on bankprofitability, are specifically derived from those detailed in the comprehen-sive reference on bank credit analysis by Golin and Delhaise (2013) and inthe Compustat white paper on bank and thrift industry-specific data(Compustat, n.d.). Most bank-specific determinants are classifiable ascapital, earnings, profitability, and efficiency (EP&E), liquidity, and assetquality ratios.
A capital ratio we employ is equity to assets (EA). This measure ofequity, relative to total assets, reflects the bank’s capital strength orsolvency (Golin & Delhaise, 2013). Higher values mean the bank will havelower interest expenses and expenses related to insolvency risk. While therelationship of this variable to profitability may vary across the stages ofthe business cycle (Berger, 1995), we expect it will have an overall positiverelationship to profitability.
Three capital ratios from the practitioner literature (Golin, 2001) areadded. Equity growth, (EG) measures the yearly change in shareholder’sequity (Golin, 2001). Such growth may come from various sources (i.e.,retained earnings, sale of new shares, merger, etc.). The growth rate inequity is compared to the growth in total assets in the equity to asset growth(EAG) measure. The growth in equity is compared to the growth in loansin the equity to loan growth (ELG) measure. Because of the newness of theuse of these measures in the empirical literature, there are no predictionson how they relate to profitability.
209Profitability and Performance Measurement of U.S. Regional Banks
Dow
nloa
ded
by 1
89.2
37.6
7.15
1 A
t 16:
59 2
9 Ju
ne 2
015
(PT
)
Several ratios fall into the category of earnings, profitability, andefficiency (EP&E) ratios (Golin, 2001). The efficiency ratio (ERATIO) isthe ratio of noninterest expenses to total income. It reflects the extent towhich overhead expenses are impacting on profitability (Compustat, n.d.;Golin & Delhaise, 2013). Better control of personnel, occupancy andequipment costs improve (lower) this ratio. Our expectation is that it willbe negatively related to profitability.
The cost to assets (CA) ratio is a variation on the efficiency ratio. Itplaces the noninterest (overhead) expenses in relation to average assetsinstead of income (Golin, 2001). The volatility of this measure is lowerthan that of the efficiency ratio.
In recent years, noninterest income has become increasingly important.Noninterest income may be less stable than interest income, but does pro-vide the bank with diversification of income streams. It is measured by theratio noninterest income to revenue (NIIR). Given the mixed results withthis variable, we have no expectation of its relationship with profitability.
The ratio of loans to assets (LA) has been regarded as a measure ofliquidity (Golin, 2001). Higher values result in lower liquidity. Given themixed results of previous studies, we have no prediction regarding itsrelationship with profitability.
Several of our measures reflect the bank’s asset quality. The provision forcredit losses (PCL) is the amount charged against income for provisionsagainst loan losses, in relationship to total loans. It reflects the riskiness ofthe bank’s loan portfolio. Our expectation is for a negative relationshipwith profitability.
There are two asset quality indicators reflecting reserve for credit losses(RCL). This reserve is the cumulative stock for loan losses, after new provi-sions have been added, and write-offs have been deducted. These ratiosplace the reserves for credit losses in relation to either the annualized netcharge-offs or to the level of nonperforming assets. They show the reservesset aside for net charge-offs or nonperforming assets, and are expected torelate negatively to profitability.
The nonperforming assets (NPA) ratio is also another asset qualityindicator. Loan delinquencies, real-estate foreclosures, and restructuredand renegotiated debt comprise this asset category. The ratio divides thisquantity by the bank’s total assets. In that nonperforming assets providediminished interest revenue and are at risk for failure to return loan princi-pal, it is expected this ratio will be negatively related to profitability.
Net charge-offs are seen as the bottom line for asset quality analysis(Compustat, n.d.). They are put in ratio to total loans as net charge-offs
210 GLENN GROWE ET AL.
Dow
nloa
ded
by 1
89.2
37.6
7.15
1 A
t 16:
59 2
9 Ju
ne 2
015
(PT
)
(NCO). As another indicator of loans not producing profit, it is expectedthe relationship to profitability will be negative.
Loan growth (LG) indicates that funds raised are being converted intoloans. This means growth in the bank’s primary business activity.However, such growth can reflect negatively on asset quality if it is toorobust. The concern is that the bank may not have adequately evaluatedprospective borrowers (Golin, 2001). Hence, there is no prediction as to thedirection of the relationship with profitability.
A measure reflecting the size of the bank is the logarithm of total assets(L_AT). This data was adjusted for inflation using the GDP price deflator.To test for a nonlinear, convex relationship the square of the logarithm oftotal assets (L_AT2) is also related to profitability. In line with recentresults using these measures, we expect the logarithm of total assets will bepositively related to profitability, but that the relationship of the square ofthe logarithm of total assets will be negative. Such a finding will indicatethat, there are economies of scale across lower parts of the size range, butdiseconomies of scale predominate after a certain point on this range isreached. To assess whether a change in the size of the bank affects profit-ability, we employ the difference between the logarithm of total assetst andthe logarithm of total assetst− 1 (Δ_L_AT).
The profitability value of the year prior to that of the dependent variablemay have an effect. Both profitability persistence and regression to themean have been reported in banking. Thus, we use lagged profitability as adeterminant variable.
Macroeconomic DeterminantsAnnual values of several macroeconomic variables were also related tobank profitability. GDP growth (GDP) is a measure of overall economicgrowth. In general, this variable has been positively related to bank profit-ability. The rationale has been that, favorable economic times increasebank profit opportunities.
Inflation rate (CPI) is assessed by change in the CPI. Most studies haveshown that, inflation favorably affects bank profitability. This is presum-ably because banks are able to anticipate inflation and favorably adjusttheir rate structure upwards to compensate for it. However, in the UnitedStates during the years of this study, inflation rates were subdued henceno prediction is made that it will significantly influence bank profitabilityduring the study period.
The yield curve (YIELDC) measures the difference between the yield onthe U.S. government 10-Year notes and that on the 3-Month Treasury bill.
211Profitability and Performance Measurement of U.S. Regional Banks
Dow
nloa
ded
by 1
89.2
37.6
7.15
1 A
t 16:
59 2
9 Ju
ne 2
015
(PT
)
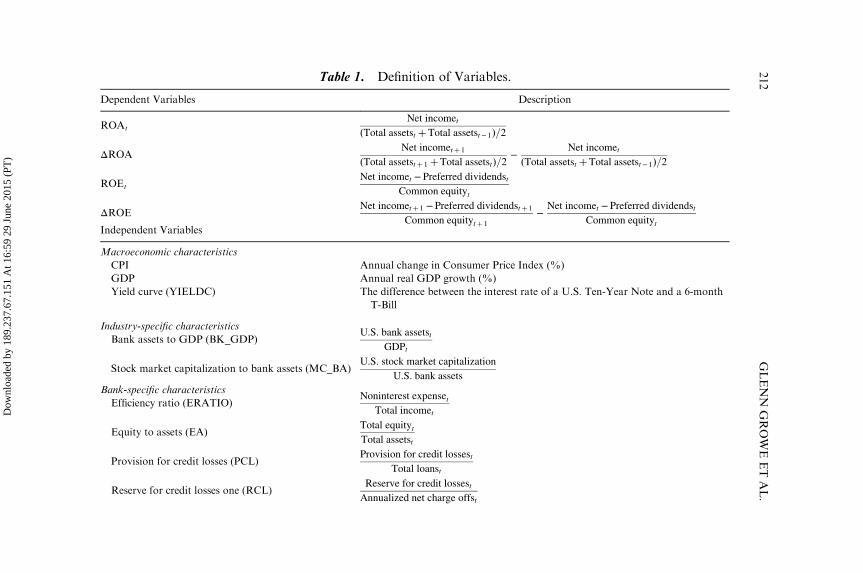
Table 1. Definition of Variables.
Dependent Variables Description
ROAt
Net incomet
ðTotal assetst þTotal assetst− 1Þ=2
ΔROANet incometþ 1
ðTotal assetstþ 1 þTotal assetstÞ=2−
Net incomet
ðTotal assetst þTotal assetst− 1Þ=2ROEt
Net incomet − Preferred dividendst
Common equityt
ΔROENet incometþ 1 −Preferred dividendstþ 1
Common equitytþ 1
−Net incomet − Preferred dividendst
Common equitytIndependent Variables
Macroeconomic characteristics
CPI Annual change in Consumer Price Index (%)
GDP Annual real GDP growth (%)
Yield curve (YIELDC) The difference between the interest rate of a U.S. Ten-Year Note and a 6-month
T-Bill
Industry-specific characteristics
Bank assets to GDP (BK_GDP)U:S: bank assetst
GDPt
Stock market capitalization to bank assets (MC_BA)U:S: stock market capitalization
U:S: bank assets
Bank-specific characteristics
Efficiency ratio (ERATIO)Noninterest expenset
Total incomet
Equity to assets (EA)Total equitytTotal assetst
Provision for credit losses (PCL)Provision for credit lossest
Total loanst
Reserve for credit losses one (RCL)Reserve for credit lossest
Annualized net charge offst
212
GLENN
GROWEETAL.
Dow
nloa
ded
by 1
89.2
37.6
7.15
1 A
t 16:
59 2
9 Ju
ne 2
015
(PT
)
Reserve for credit losses two (RCL2)Reserve for credit lossest
Nonperforming assetst
Nonperforming assets (NPA)Nonperforming assetst
Total assetst
Net charge offs (NCO)Annualized net charge offst
Total loanst
Noninterest income to revenue (NIIR)Noninterest incomet
Net interest incomet þNoninterest incometNatural logarithm of total assets (L_AT) LN (Total assets)
Square of the natural logarithm of total assets
(L_AT^2)
(LN (Total assets))2
ΔNatural logarithm of total assets (Δ_L_AT) LN (Total assets)t−LN (Total assets)t− 1
Equity to Asset Growth (EAG)Shareholder0s equityt −Shareholder0s equityt− 1
Shareholder0s equityt− 1
−Total assetst −Total assetst− 1
Total assetst− 1
Loan Growth (LG)Total loanst −Total loanst− 1
Total loanst− 1
Equity to Loan Growth (ELG)Shareholder0s equityt −Shareholder0s equityt− 1
Shareholder0s equityt− 1
−Total loanst −Total loanst− 1
Total loanst− 1
Cost to Assets (CA)Noninterest expenset
Average assets
213
Profitability
andPerfo
rmance
Measurem
entofU.S.RegionalBanks
Dow
nloa
ded
by 1
89.2
37.6
7.15
1 A
t 16:
59 2
9 Ju
ne 2
015
(PT
)
Empirical work has determined that, the size of the difference has prognos-tic significance for the growth rate of the economy approximately one-yearout (Estrella & Mishkin, 1996). Because its effects may be felt severalmonths in the future, the one-year lagged values of this variable, as well asthe end of year values, are entered into the models. Higher values indicateboth that future economic conditions are likely to be favorable and thatthe spread between what banks receive from interest on long-term loansand what they are paying short-term depositors is favorable. Thus, a posi-tive relationship between this variable and bank profitability is anticipated.
Industry-Specific DeterminantThese are determinants characteristic of the industry itself for a particularyear. Here, we include the relative size of bank industry assets to GDP(BK_GDP). This ratio has been negatively related to profitability whenexamined in developed economies. It has been taken as a proxy forincreased competition in the industry.
We also use the ratio of the capitalization of the nation’s stock market tothe total assets of the banking system (MC_BA). A preponderance of thesmall number of studies using this variable found it positively related toprofitability. Also, buoyant share prices suggest a favorable economic cli-mate which may auger well for bank profits. Hence, a positive relationshipwith profitability is expected.
A summary of our dependent and explanatory variables is in Table 1.
DATA AND METHODOLOGY
Data
The data used to develop the banking industry ratios was annual data fromStandard and Poor’s Compustat’s Industry-Specific dataset for the Bankingand Thrift industry (Compustat, n.d.). The banks studied belong to theregional banking sector (GICS sub-industry 40101015), as defined by theGlobal Industry Classification Standard (GICS Structure, n.d.). Regionalbanks operate chains of banks in regional geographic regions. They deriverevenue from lending to small and medium size corporations. We do notinclude institutions from the GICS classification diversified banks(40101010), because they derive significant revenues from nonbankingoperations. GICS classifications have been shown to be consistently
214 GLENN GROWE ET AL.
Dow
nloa
ded
by 1
89.2
37.6
7.15
1 A
t 16:
59 2
9 Ju
ne 2
015
(PT
)
superior to other classification schemes on several important criteria(Bhojraj, Lee, & Oler, 2003). Our dataset is comprised of regional bankswith complete Compustat data on the variables necessary for measuringprofitability and the bank-specific determinants for the period 1994through 2011. This gave us a sample of 4,546 bank-years from 452 separatebanks.
Data to construct the industry-specific and macroeconomic variables,including the consumer price index, GDP growth, interest rates for the 10-year Note and the 6-month T-Bill, Total bank assets, and stock marketcapitalization were downloaded from U.S. Government Web sites, such asthe U.S. Department of Commerce: Bureau of Economic Analysis (GDPchange and GDP Price Deflator) and Federal Reserve Economic Data(Commercial Bank Assets).
Our data consists of varying number of years of bank data, which char-acterizes our sample as unbalanced panel data.
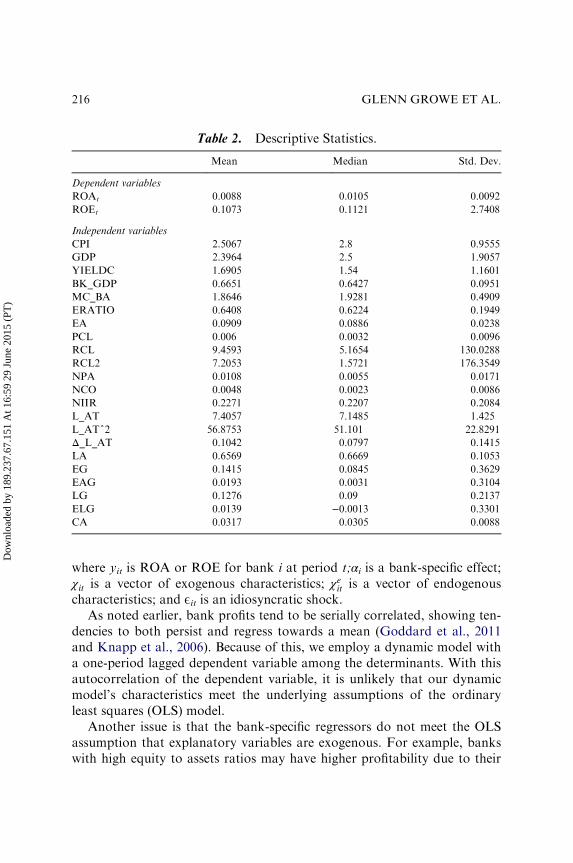
Descriptive statistics for the variables used are presented in Table 2.Values on some of the most commonly used variables are reasonablyclose to those reported in other recent studies. For example, the mean effi-ciency ratio in our data was .6408 while in Dietrich and Wanzenried’s(2011) sample of Swiss banks, it was 0.6497, and in Trujillo-Ponce’s (2013)Spanish bank sample, it was 0.5734. The mean equity to assets ratio in oursample was 0.0909, while in the Swiss and Spanish samples, the correspond-ing values were 0.0855 and 0.0699, respectively. The mean ROA valuesacross the American, Swiss and Spanish samples were 0.0088, 0.0063,and 0.0099. The mean provision for credit losses to total loans was 0.0035in the conservative Swiss banking culture and 0.0060 in our Americansample.
The data was “winsorized” at the top and bottom 1% of the outliers bythe top and bottom 1% of values of the distribution.
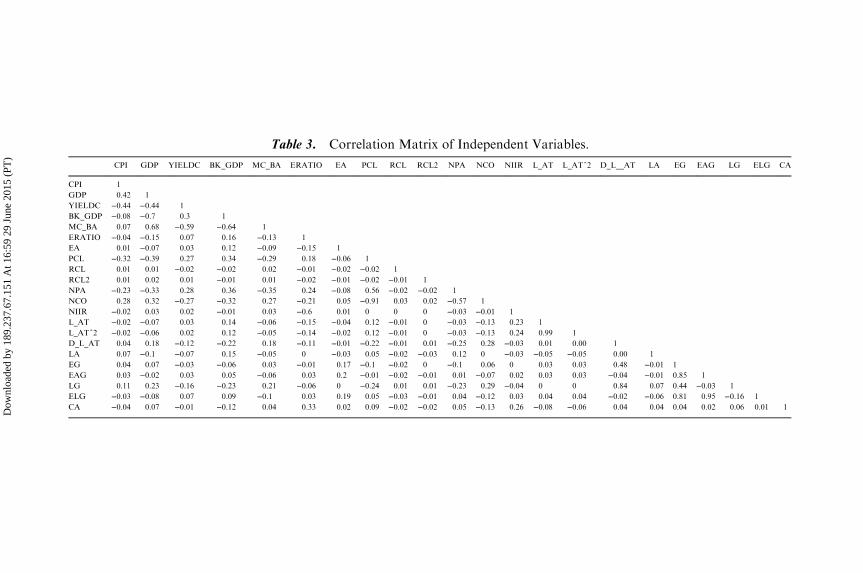
The correlation matrix of independent variables is found in Table 3.
Methodology
To investigate the effects of our bank-specific, industry-specific, and macro-economic determinants on bank profitability, we closely follow Garcia-Herrero et al. (2009) and Dietrich and Wanzenried (2011). The mainregression will be:
yit = αi þ δyi;t− 1 þ χitβþ χeitβe þ Eit ð1Þ
215Profitability and Performance Measurement of U.S. Regional Banks
Dow
nloa
ded
by 1
89.2
37.6
7.15
1 A
t 16:
59 2
9 Ju
ne 2
015
(PT
)
where yit is ROA or ROE for bank i at period t;αi is a bank-specific effect;χit is a vector of exogenous characteristics; χeit is a vector of endogenouscharacteristics; and Eit is an idiosyncratic shock.
As noted earlier, bank profits tend to be serially correlated, showing ten-dencies to both persist and regress towards a mean (Goddard et al., 2011and Knapp et al., 2006). Because of this, we employ a dynamic model witha one-period lagged dependent variable among the determinants. With thisautocorrelation of the dependent variable, it is unlikely that our dynamicmodel’s characteristics meet the underlying assumptions of the ordinaryleast squares (OLS) model.
Another issue is that the bank-specific regressors do not meet the OLSassumption that explanatory variables are exogenous. For example, bankswith high equity to assets ratios may have higher profitability due to their
Table 2. Descriptive Statistics.
Mean Median Std. Dev.
Dependent variables
ROAt 0.0088 0.0105 0.0092
ROEt 0.1073 0.1121 2.7408
Independent variables
CPI 2.5067 2.8 0.9555
GDP 2.3964 2.5 1.9057
YIELDC 1.6905 1.54 1.1601
BK_GDP 0.6651 0.6427 0.0951
MC_BA 1.8646 1.9281 0.4909
ERATIO 0.6408 0.6224 0.1949
EA 0.0909 0.0886 0.0238
PCL 0.006 0.0032 0.0096
RCL 9.4593 5.1654 130.0288
RCL2 7.2053 1.5721 176.3549
NPA 0.0108 0.0055 0.0171
NCO 0.0048 0.0023 0.0086
NIIR 0.2271 0.2207 0.2084
L_AT 7.4057 7.1485 1.425
L_AT^2 56.8753 51.101 22.8291
Δ_L_AT 0.1042 0.0797 0.1415
LA 0.6569 0.6669 0.1053
EG 0.1415 0.0845 0.3629
EAG 0.0193 0.0031 0.3104
LG 0.1276 0.09 0.2137
ELG 0.0139 −0.0013 0.3301
CA 0.0317 0.0305 0.0088
216 GLENN GROWE ET AL.
Dow
nloa
ded
by 1
89.2
37.6
7.15
1 A
t 16:
59 2
9 Ju
ne 2
015
(PT
)
Table 3. Correlation Matrix of Independent Variables.
CPI GDP YIELDC BK_GDP MC_BA ERATIO EA PCL RCL RCL2 NPA NCO NIIR L_AT L_AT^2 D_L__AT LA EG EAG LG ELG CA
lower financing and bankruptcy risk costs. However, causality may alsoflow from profitability to a high equity to assets ratio. More profitablebanks may choose to retain more earnings, raising the equity to assetsratio. Such variables are endogenous.
A further problem for any model of bank profitability is unobservableheterogeneity among banks (Dietrich & Wanzenried, 2011). For example, ithas been shown that individual managers affect corporate behavior andperformance (Bertrand and Schoar, 2003), yet we are unable to measurethis influence.
We follow Dietrich and Wanzenried (2011), Garcia-Herrero et al.(2009), Trujillo-Ponce (2013), and van Ommeren (2011) in using the gener-alized method of moments (GMM) approach developed by Arellano andBond (1991) to address these problems. This method, explicitly shown inEq. (1), uses lagged values of dependent variables as instrumental variablesto solve the problem of endogeneity. GMM is also flexible enough toinclude serial correlation and unobserved heterogeneity into the model.Due to a specific interest in our set of explanatory variables, we consideras endogenous all bank-specific variables, which concurs with the relatedliterature. We also include a one-period lagged value for the yield curvedeterminant, as it has been shown to have a delayed effect upon economicperformance (Estrella & Mishkin, 1996).
We instrument the endogenous variables with lags 1 through 4 (Roodman,2009). We used the one-step GMM estimator which is known to outperformthe two-step estimator with short samples (Inkmann, 2000). Due to this verynature of the sample, we conduct a robustness check where macroeconomicregressors are substituted by time dummies. Results are very similar.
The use of several ratios based upon bank financial accounts raises theissue of multicollinearity. We employ tests to remove variables with thisissue from our models.
EMPIRICAL RESULTS
The L. variable notation in the tables means that it is the 1 lagged value ofthe variable, or in other words, variablet− 1.
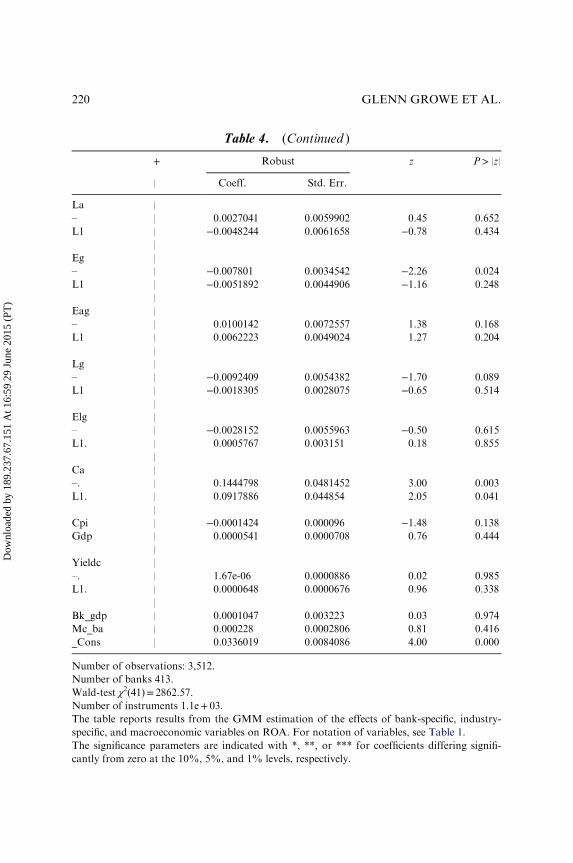
ROAt
Tables 4 and 5 show the regression results for our primary profitabilitymeasures, ROAt and ΔROA, respectively. Table 4 presents the empirical
218 GLENN GROWE ET AL.
Dow
nloa
ded
by 1
89.2
37.6
7.15
1 A
t 16:
59 2
9 Ju
ne 2
015
(PT
)
Table 4. Regression Results for Return on Assets (ROAt) as DependentVariable.
+ Robust z P> |z|
| Coeff. Std. Err.
Roat |
L1 | −.0795784 .051488 −1.55 0.122
|
Eratio |
–. | −0.0420327 0.0026854 −15.65 0.000
L1 | −0.0043243 0.0028882 −1.50 0.134
|
Ea |
–. | 0.0743801 0.034417 2.16 0.031
L1 | −0.0562869 0.0336434 −1.67 0.094
|
Pcl |
– | −0.6179929 0.0502062 −12.31 0.000
L1 | −0.0261818 0.0599006 −0.44 0.662
|
Rcl |
– | 2.22e-06 2.90e-06 0.77 0.444
L1 | −8.78e-07 3.48e-06 −0.25 0.801
|
Rcl2 |
– | −0.000036 0.0000257 −1.40 0.161
L1 | −0.0000248 0.0000254 −0.97 0.330
|
Npa |
– | −0.0439919 0.0241565 −1.82 0.069
L1 | 0.0028657 0.0277458 0.10 0.918
|
Nco |
– | −0.1399112 0.0625961 −2.24 0.025
L1 | −0.0045657 0.0582718 −0.08 0.938
|
Niir |
– | −0.0033748 0.0028381 −1.19 0.234
L1 | 0.0047078 0.003269 1.44 0.150
|
L_at |
– | 0.0114252 0.0079673 1.43 0.152
L1 | −0.0104927 0.0076616 −1.37 0.171
|
L_at2 |
– | −0.0006283 0.0003837 −1.64 0.102
L1 | 0.000521 0.0003454 1.51 0.131
|
Δ_l_at |
– | 0.0173521 0.0072504 2.39 0.017
L1 | 0.0069451 0.0059791 1.16 0.245
|
Dow
nloa
ded
by 1
89.2
37.6
7.15
1 A
t 16:
59 2
9 Ju
ne 2
015
(PT
)
Table 4. (Continued )
+ Robust z P> |z|
| Coeff. Std. Err.
La |
– | 0.0027041 0.0059902 0.45 0.652
L1 | −0.0048244 0.0061658 −0.78 0.434
|
Eg |
– | −0.007801 0.0034542 −2.26 0.024
L1 | −0.0051892 0.0044906 −1.16 0.248
|
Eag |
– | 0.0100142 0.0072557 1.38 0.168
L1 | 0.0062223 0.0049024 1.27 0.204
|
Lg |
– | −0.0092409 0.0054382 −1.70 0.089
L1 | −0.0018305 0.0028075 −0.65 0.514
|
Elg |
– | −0.0028152 0.0055963 −0.50 0.615
L1. | 0.0005767 0.003151 0.18 0.855
|
Ca |
–. | 0.1444798 0.0481452 3.00 0.003
L1. | 0.0917886 0.044854 2.05 0.041
|
Cpi | −0.0001424 0.000096 −1.48 0.138
Gdp | 0.0000541 0.0000708 0.76 0.444
|
Yieldc |
–. | 1.67e-06 0.0000886 0.02 0.985
L1. | 0.0000648 0.0000676 0.96 0.338
|
Bk_gdp | 0.0001047 0.003223 0.03 0.974
Mc_ba | 0.000228 0.0002806 0.81 0.416
_Cons | 0.0336019 0.0084086 4.00 0.000
Number of observations: 3,512.
Number of banks 413.
Wald-test χ2(41)= 2862.57.
Number of instruments 1.1e+ 03.
The table reports results from the GMM estimation of the effects of bank-specific, industry-
specific, and macroeconomic variables on ROA. For notation of variables, see Table 1.
The significance parameters are indicated with *, **, or *** for coefficients differing signifi-
cantly from zero at the 10%, 5%, and 1% levels, respectively.
220 GLENN GROWE ET AL.
Dow
nloa
ded
by 1
89.2
37.6
7.15
1 A
t 16:
59 2
9 Ju
ne 2
015
(PT
)
Table 5. Regression Results for Change in Return on Assets (ΔROA) asDependent Variable.
+ Robust z P> |z|
| Coeff. Std. Err.
Δ_Roa |
L1. | −0.3420084 0.0510499 −6.70 0.000
|
Eratio |
–. | 0.0136713 0.0049694 2.75 0.006
L1. | 0.016493 0.0052145 3.16 0.002
|
Ea |
–. | −0.0331816 0.0545462 −0.61 0.543
L1. | 0.0185999 0.0572498 0.32 0.745
|
Pcl |
–. | 0.2986573 0.1130213 2.64 0.008
L1. | 0.2663602 0.0742461 3.59 0.000
|
Rcl |
–. | −0.0000126 6.20e-06 −2.04 0.042
L1. | −5.40e-07 5.53e-06 −0.10 0.922
|
Rcl2 |
–. | 2.04e-06 0.0000545 0.04 0.970
L1. | 0.0001401 0.0000595 2.36 0.018
|
Npa |
–. | −0.2547106 0.0500257 −5.09 0.000
L1. | 0.1458484 0.0467918 3.12 0.002
|
Nco |
–. | 0.0758482 0.1334387 0.57 0.570
L1. | −0.1134162 0.0785277 −1.44 0.149
|
Niir |
–. | 0.0002762 0.0057274 0.05 0.962
L1. | −0.0082505 0.0061525 −1.34 0.180
|
L_at |
–. | −0.0095912 0.0120902 −0.79 0.428
L1. | 0.013867 0.0113414 1.22 0.221
|
L_at2 |
–. | 0.0000372 0.0005735 0.06 0.948
L1. | −0.0001131 0.0005017 −0.23 0.822
|
Δ_L_at |
–. | 0.0271883 0.0103775 2.62 0.009
L1. | −0.0118881 0.0097785 −1.22 0.224
|
Dow
nloa
ded
by 1
89.2
37.6
7.15
1 A
t 16:
59 2
9 Ju
ne 2
015
(PT
)
Table 5. (Continued )
+ Robust z P> |z|
| Coeff. Std. Err.
La |
–. | 0.0011723 0.0113349 0.10 0.918
L1. | 0.0127638 0.0111227 1.15 0.251
|
Eg |
–. | −0.0038259 0.006088 −0.63 0.530
L1. | 0.0037648 0.0051096 0.74 0.461
|
Eag |
–. | 0.0147218 0.0093895 1.57 0.117
L1. | −0.0086429 0.0077495 −1.12 0.265
|
Lg |
–. | −0.00778 0.0073441 −1.06 0.289
L1. | 0.0049617 0.0074096 0.67 0.503
|
Elg |
–. | −0.0125505 0.0100245 −1.25 0.211
L1. | 0.0027668 0.0076662 0.36 0.718
|
Ca |
–. | 0.2531935 0.0779876 3.25 0.001
L1. | −0.1701098 0.0914445 −1.86 0.063
|
Cpi | 0.0002672 0.0001784 1.50 0.134
Gdp | −0.0005862 0.0001341 −4.37 0.000
|
Yieldc |
–. | 0.0003687 0.000172 2.14 0.032
L1. | 0.0008101 0.0001306 6.20 0.000
|
Bk_gdp | −0.0484918 0.0064856 −7.48 0.000
Mc_ba | 0.0014438 0.0005723 2.52 0.012
_Cons | −0.0296535 0.015791 −1.88 0.060
Number of observations: 3,506.
Number of banks 413.
Wald-test χ2(41)= 657.45.
Number of instruments 1.1e+ 03.
The table reports results from the GMM estimation of the effects of bank-specific, industry-
specific, and macroeconomic variables on ΔROA. For notation of variables, see Table 1.
The significance parameters are indicated with *, **, or *** for coefficients differing signifi-
cantly from zero at the 10%, 5%, and 1% levels, respectively.
222 GLENN GROWE ET AL.
Dow
nloa
ded
by 1
89.2
37.6
7.15
1 A
t 16:
59 2
9 Ju
ne 2
015
(PT
)
estimation of Eq. (1) for ROAt with regressors contemporaneous with thedependent variable. This is the standard approach taken by studies of bankprofitability.
As with almost all previous studies where it was evaluated, we find thatthe efficiency ratio is significantly and negatively related to profitability.Banks that spend more on expenses in relation to current income depressprofitability.
The level of bank capitalization in the year contemporaneous withthis profitability measure is significantly and positively related to profitabil-ity. This is in line with the large majority of other research, both in thebanking industry and elsewhere showing that more equity in relation todebt financing improves profitability. However, there is a weaker, but sig-nificant, negative relationship with one-year lagged equity levels andprofitability.
Provisions for credit losses are direct deductions from the current year’sincome. Thus, it is not surprising that they have a strongly negative andsignificant relationship with a measure of contemporaneous profitability,such as ROAt.
The base year’s values of two asset quality indicators (nonperformingassets and net charge-offs) have significant negative relationships withROAt. In line with expectations, high levels of problem assets are negativefor profitability.
A measure of the difference in bank size from the previous year wassignificantly and positively related to ROAt. Measures of current bank sizewere unrelated to profitability.
Growth in bank equity from the previous year was significantly nega-tively related to profitability. While this result was not large, it is surprising,given the big positive relationship between current year equity level andprofitability. This may be because an increase in equity can be due to rea-sons that depress profitability. For example, equity may increase through asale of new stock. New issues of stock have been found to relate to strongearnings in previous years but weaker performance going forwards (Firth,1997; Loughran & Ritter, 1997). If equity increases due to strong previousyear’s earnings with a significant amount of new retained earnings, thecurrent year’s results may suffer due to mean reversion.
Loan growth was negatively related to ROAt. Possible explanationsinclude a tendency for banks with rapidly growing loan portfolios to fundit from more expensive capital sources.
Both the current and lagged values of the cost to assets ratio are signifi-cantly related to profitability. This contrasts with the strong negative
223Profitability and Performance Measurement of U.S. Regional Banks
Dow
nloa
ded
by 1
89.2
37.6
7.15
1 A
t 16:
59 2
9 Ju
ne 2
015
(PT
)
relationship between the cost to income ratio and profitability. The implica-tion is that banks can benefit from spending on noninterest expenses, aslong as they do not cut into profitability.
None of the macroeconomic regressors related significantly to ROAt.Other studies exploring the determinants of contemporaneous profitabilitymeasures also have noted absent or weak relationships between macro-economic variables and bank profitability (Al Jafari & Alchami, 2014;Kanwal & Nadeem, 2013). In our literature review, the largest frequency ofthe type of relationship with profitability for three of four macroeconomicdeterminants was “insignificant.”
ΔROA
Table 5 presents the empirical estimation of Eq. 1 for ΔROA with thedependent variable being the change in ROA between year t and t+ 1.Building a model to predict the change in a core earnings variable is theapproach followed in the fundamental analysis literature.
The lagged change in ROA is significantly negatively related to the ROAchange from the current (base) year to the next year. This indicates a strongtendency for earnings to mean-revert in the competitive U.S. bankingindustry. Profit bulges are quickly eroded away. Banks performing poorlytake corrective actions that improve their situations.
The current year and lagged efficiency ratio values are significantly andpositively related to ΔROA. This is diametrically opposite their relation-ship with ROAt. It may be that higher spending on noninterest items maydepress current but improve future profitability.
Provisions for credit losses for the current and lagged years are alsopositively related to ΔROA. This suggests that banks frequently elect totake a stiff charge against current income which “clears the books” andallows for greater future profitability.
Nonperforming assets in the current year are negatively related toΔROA, while lagged values of this variable are positively related. Thus,the extent to which borrowers are not paying back money lent to them haspredictive value for bank profitability.
The change in bank size is also positively related to ΔROA. Our findingssuggest a robust link between asset growth and profitability change. Thisaccords with the findings of another study which related this variable to thefollowing year’s profitability (Chronopoulos et al., 2012).
224 GLENN GROWE ET AL.
Dow
nloa
ded
by 1
89.2
37.6
7.15
1 A
t 16:
59 2
9 Ju
ne 2
015
(PT
)
The extent of spending on noninterest expense scaled by total assets ispositively related to ΔROA. Spending in this area appears to be productivefor many banks.
While macroeconomic variables were unrelated to ROAt, they signifi-cantly determine ΔROA. GDP growth was significantly negatively relatedto ΔROA. This may be because favorable economic times reduce bankprofits by encouraging bank expansion and increase competition.
The size of the yield curve is predictive of positive ΔROA values. Whenthe yield curve is high, the rate of return from banks’ lending activities,which tend to be longer term, will contrast favorably with the low rate theypay for the short-term borrowing which funds their lending. This state willfavorably affect future profitability, as more loans reflecting this disparityare booked.
Bank assets scaled by GDP are negatively related to ΔROA. This rela-tionship was expected, as the larger the banking sector in relation to theentire economy, the greater the competition among banks.
Stock market capitalization in relationship to the assets of the bankingsystem positively and significantly predicts ΔROA. In the U.S. context,buoyant stock values are a leading indicator of economic prosperity whichimproves banks profitability.
The multiple significant relationships found between macroeconomicvariables and ΔROA contrast with the absence of such relationships withcontemporaneously assessed profitability (ROAt). It appears that theseeconomic fundamentals take time to manifest their effects on bank profits.A research approach examining changes in profitability allows such effectsto become apparent.
ROE
Table 6 presents the empirical estimation of Eq. 1 for ROEt. This is a sec-ondary measure of profitability in the banking industry. Findings largelyparallel those for ROAt.
Values on the efficiency ratio are significantly negatively related to thismeasure of profitability. Asset quality measures, such as the provision forcredit losses, the reserve for credit losses, and nonperforming assets, havesignificant negative relationships.
There was a positive relationship between the natural logarithm of totalassets and a negative one with the square of the logarithm of total assets
225Profitability and Performance Measurement of U.S. Regional Banks
Dow
nloa
ded
by 1
89.2
37.6
7.15
1 A
t 16:
59 2
9 Ju
ne 2
015
(PT
)
Table 6. Regression Results for Return on Equity (ROEt) as DependentVariable.
+ Robust z P> |z|
| Coeff. Std. Err.
Roet |
L1. | −0.0723296 0.0533628 −1.36 0.175
|
Eratio |
–. | −0.5069181 0.0691667 −7.33 0.000
L1. | 0.0457898 0.0582261 0.79 0.432
|
Ea |
–. | 0.0449836 0.7629382 0.06 0.953
L1. | −0.3282236 0.8728977 −0.38 0.707
|
Pcl |
–. | −6.884404 1.18109 −5.83 0.000
L1. | −0.4383844 0.9458337 −0.46 0.643
|
Rcl |
–. | 0.0000598 0.000053 1.13 0.259
L1. | −0.0000707 0.0000689 −1.03 0.305
|
Rcl2 |
–. | −0.0018762 0.0005831 −3.22 0.001
L1 | −0.0010063 0.0005551 −1.81 0.070
|
Npa |
–. | −2.079217 0.5762687 −3.61 0.000
L1. | −0.2236372 0.6864288 −0.33 0.745
|
Nco |
–. | −0.1686589 1.314991 −0.13 0.898
L1. | −0.6164112 1.001218 −0.62 0.538
|
Niir |
–. | −0.0740949 0.0702636 −1.05 0.292
L1. | 0.0967756 0.0657434 1.47 0.141
|
Lat |
–. | 0.479647 0.2126915 2.26 0.024
L1. | −0.4357771 0.2038124 −2.14 0.033
|
Lat2 |
–. | −0.0193091 0.0089028 −2.17 0.030
L1. | 0.0150409 0.0077862 1.93 0.053
|
Δ_Lat |
–. | 0.2219241 0.1569593 1.41 0.157
L1. | 0.2952402 0.1137181 2.60 0.009
|
Dow
nloa
ded
by 1
89.2
37.6
7.15
1 A
t 16:
59 2
9 Ju
ne 2
015
(PT
)
Table 6. (Continued )
+ Robust z P> |z|
| Coeff. Std. Err.
La |
–. | 0.024311 0.1518792 0.16 0.873
L1. | −0.1529212 0.1500289 −1.02 0.308
|
Eg |
–. | 0.0145471 0.0949682 0.15 0.878
L1. | −0.0389018 0.0884305 −0.44 0.660
|
Eag |
–. | 0.3123679 0.130858 2.39 0.017
L1. | 0.2646025 0.0953866 2.77 0.006
|
Lg |
–. | −0.3781102 0.1170118 −3.23 0.001
L1. | −0.2031707 0.0698194 −2.91 0.004
|
Elg |
–. | −0.244354 0.1450173 −1.68 0.092
L1. | −0.1794317 0.0710202 −2.53 0.012
|
Ca |
–. | 0.1156672 1.341999 0.09 0.931
L1. | 0.7337927 0.93592 0.78 0.433
|
Cpi | 0.0026521 0.0019425 1.37 0.172
Gdp | 0.0007413 0.0015716 0.47 0.637
|
Yieldc |
–. | 0.0038284 0.0018268 2.10 0.036
L1. | −0.001319 0.0013738 −0.96 0.337
|
Bk_gdp | 0.1509169 0.0837456 1.80 0.072
Mc_ba | 0.0147312 0.0076323 1.93 0.054
_Cons | 0.30857 0.1767721 1.75 0.081
Number of observations: 3,512.
Number of banks 413.
Wald-test χ2(41)= 1102.09.
Number of instruments 1.1e+ 03.
The table reports results from the GMM estimation of the effects of bank-specific, industry-
specific, and macroeconomic variables on ROE. For notation of variables, see Table 1.
The significance parameters are indicated with *, **, or *** for coefficients differing signifi-
cantly from zero at the 10%, 5%, and 1% levels, respectively.
227Profitability and Performance Measurement of U.S. Regional Banks
Dow
nloa
ded
by 1
89.2
37.6
7.15
1 A
t 16:
59 2
9 Ju
ne 2
015
(PT
)
Table 7. Regression Results for Change in Return on Equity (ΔROE) asDependent Variable.
+ Coeff. Std. Err. z P> |z|
Δ_Roe |
L1. | −0.3567961 0.0576094 −6.19 0.000
|
Eratio |
–. | 0.0696453 0.1236538 0.56 0.573
L1. | 0.2137609 0.1034151 2.07 0.039
|
Ea |
–. | −0.3100916 0.9829488 −0.32 0.752
L1. | −0.0653919 1.084534 −0.06 0.952
|
Pcl |
–. | 2.612171 1.809985 1.44 0.149
L1. | 2.730283 1.467948 1.86 0.063
|
Rcl |
–. | −0.0002219 0.0001133 −1.96 0.050
L1. | −0.0000724 0.0000889 −0.81 0.416
|
Rcl2 |
–. | 0.0001279 0.0008428 0.15 0.879
L1. | 0.0023004 0.0010439 2.20 0.028
|
Npa |
–. | −3.107688 1.05642 −2.94 0.003
L1. | 2.1261 0.9652558 2.20 0.028
|
Nco |
–. | 0.8155946 2.177983 0.37 0.708
L1. | −2.07413 1.688759 −1.23 0.219
|
Niir |
–. | 0.0220051 0.0964282 0.23 0.819
L1. | 0.0344931 0.1262238 0.27 0.785
|
Lat |
–. | −0.5613051 0.2124176 −2.64 0.008
L1. | 0.572765 0.2058806 2.78 0.005
|
Lat2 |
–. | 0.0124998 0.0094571 1.32 0.186
L1. | −0.010205 0.0084694 −1.20 0.228
|
228 GLENN GROWE ET AL.
Dow
nloa
ded
by 1
89.2
37.6
7.15
1 A
t 16:
59 2
9 Ju
ne 2
015
(PT
)
Table 7. (Continued )
+ Coeff. Std. Err. z P> |z|
Δ_Lat |
–. | 0.3638026 0.2045412 1.78 0.075
L1. | −0.2696268 0.1900726 −1.42 0.156
La |
–. | −0.1275913 0.1878457 −0.68 0.497
L1. | 0.2952105 0.1927465 1.53 0.126
|
Eg |
–. | −0.0526832 0.1128729 −0.47 0.641
L1. | 0.0323868 0.0958768 0.34 0.736
|
Eag |
–. | −0.0038534 0.1318954 −0.03 0.977
L1. | −0.1731478 0.1627729 −1.06 0.287
|
Lg |
–. | 0.1104266 0.122503 0.90 0.367
L1. | 0.1544589 0.1404749 1.10 0.272
|
Elg |
–. | 0.0112661 0.1630506 0.07 0.945
L1. | 0.0969619 0.1442406 0.67 0.501
|
Ca |
–. | 3.939799 1.544977 2.55 0.011
L1. | −2.468265 1.819392 −1.36 0.175
|
Cpi | −0.005641 0.0032124 −1.76 0.079
Gdp | −0.0036908 0.0028069 −1.31 0.189
|
Yieldc |
–. | −0.0046399 0.0030762 −1.51 0.131
L1. | 0.0127877 0.0022948 5.57 0.000
|
Bk_gdp | −0.6152791 0.114245 −5.39 0.000
Mc_ba | 0.0087191 0.0099694 0.87 0.382
_Cons | −0.1598763 0.2693447 −0.59 0.553
Number of observations: 3,414.
Number of banks 406.
Wald-test χ2(41)= 344.16.
Number of instruments 1.1e+ 03.
The table reports results from the GMM estimation of the effects of bank-specific, industry-
specific, and macroeconomic variables on ΔROE. For notation of variables, see Table 1.
The significance parameters are indicated with *, **, or *** for coefficients differing signifi-
cantly from zero at the 10%, 5%, and 1% levels, respectively.
229Profitability and Performance Measurement of U.S. Regional Banks
Dow
nloa
ded
by 1
89.2
37.6
7.15
1 A
t 16:
59 2
9 Ju
ne 2
015
(PT
)
with ROEt. This is in line with previous research indicating a curvilinearrelationship between bank size and profitability.
Growth in equity, in relationship to growth in assets, is positively relatedto ROEt. This accords with the reported finding that earnings for the yearin which firms issue new equity tend to be favorable although they trail offthereafter (Loughran & Ritter, 1997). However, the growth in equity mayalso be coming from retained earnings.
Growth in total loans was negatively related to ROEt. A high rate ofgrowth in loans can hurt profitability if banks are funding this growth fromcostly sources of capital.
When growth in loans is faster than growth in equity ROEt falters. Thisis another indication that bank profitability is best served by a balancebetween equity and loan levels.
The macroeconomic variables yield curve, bank assets to GDP, andmarket capitalization to bank assets were positively related to ROEt.
ΔROE
Table 7 presents the empirical estimation of Equation 1 for ΔROE. Thefindings largely parallel those of ΔROA.
Lagged ΔROE is negatively related to current ΔROE, suggesting meanreversion in this change in profitability measure as well. Findings with sev-eral asset quality measures, and asset size variables mirrored those forΔROA.
Spending on noninterest expenses scaled by total assets is significantlyrelated to favorable ROE growth. The lagged yield curve is positively andsignificantly related to ΔROA. Bank assets in relation to GDP are nega-tively related to ΔROE. These findings are all in accord with but less exten-sive than those with ΔROA.
CONCLUSIONS
This paper studies the profitability of a sample of U.S. regional banks usingbank-specific, industry-specific, and macroeconomic determinants over theperiod 1994 through 2011. Due to autocorrelation and endogeneity issues,we employed the GMM regression analysis. Our study extends previousresearch, by modeling not only bank profitability contemporaneous with
230 GLENN GROWE ET AL.
Dow
nloa
ded
by 1
89.2
37.6
7.15
1 A
t 16:
59 2
9 Ju
ne 2
015
(PT
)
the determinant variables, but also modeling changes in bank profitabilitylevels between a base year and the next year. Our focus upon pre-dicting changes in profitability follows fundamental analysis research.Another contribution was the use of a more extensive series of determinantfactors.
Our results show that profitability contemporaneous with the determi-nants is negatively related to a measure of noninterest expenses, provisionsfor credit losses and measures of asset quality. Noninterest income did notrelate significantly to profitability.
Noninterest spending scaled by assets was positively related toprofitability. Thus, spending on noninterest items can enhance profitabilityso long as it does not become too large related to income.
Changes in profitability were positively related to spending on noninter-est items and to the current and lagged provisions for credit losses. Takingsubstantial credit loss provisions in one year may pave the way for subse-quent gains in profitability.
A high proportion of nonperforming assets presages a negative changein subsequent year profitability. The rate of nonperforming assets thusappears to be a critical asset quality indicator. It appears to be a more reli-able indicator of negative future bank performance than traditional assetquality indicators, such as the levels of provisions, reserves for credit losses,or net charge-offs.
Growth in asset size was positively related to profitability across profit-ability measures.
Macroeconomic factors, although not related to profitability in the yearduring which they are measured, have significant relationships with changesin profitability levels for the subsequent year. In particular, a steep yieldcurve presages positive future changes in bank profitability. A smaller sizeof bank assets, in relation to the overall economy, is favorable for the direc-tion of the future change in bank profits. It appears that the effects ofmacroeconomic variables take time to filter through to banks and theircustomers (Heffernan & Fu, 2008).
REFERENCES
Abarbanell, J. S., & Bushee, B. J. (1997). Fundamental analysis, future earnings, and stock
prices. Journal of Accounting Research, 35(1), 1�24.
Aburime, U. T. (2008). Determinants of bank profitability: Company-level evidence from
Nigeria. International Journal of Nigerian Studies and Development, 14, 21�34.
231Profitability and Performance Measurement of U.S. Regional Banks