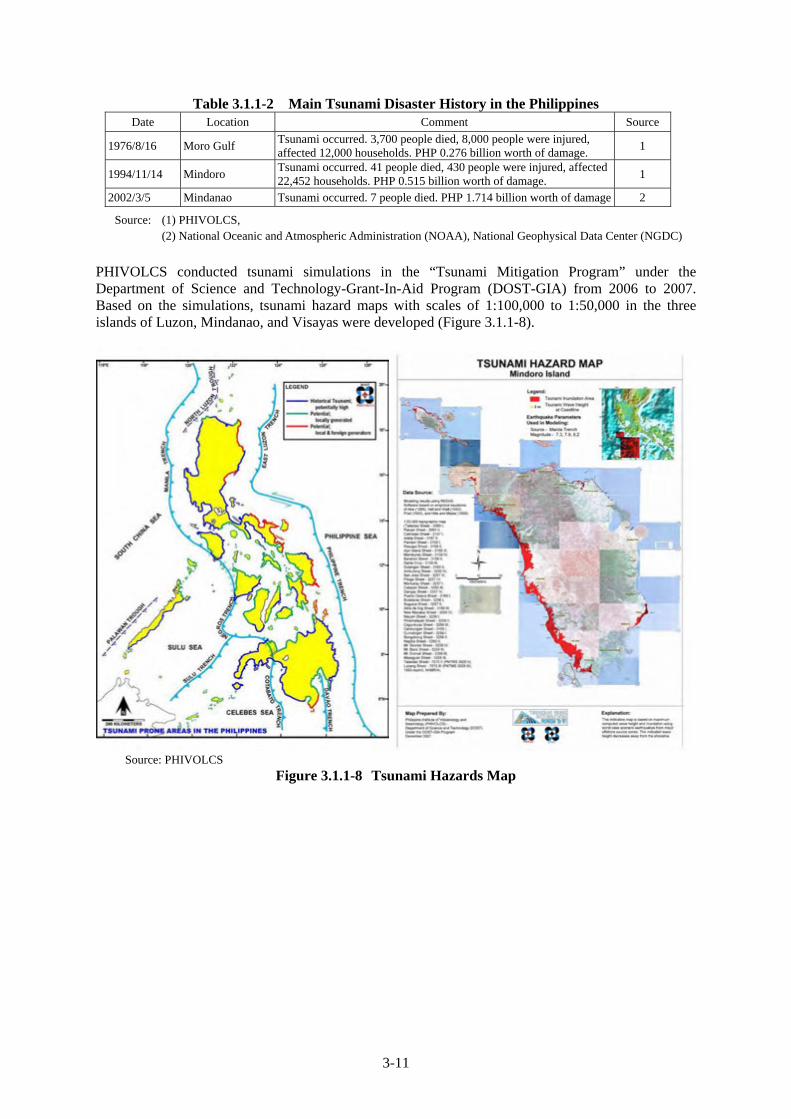
THE REPUBLIC OF THE PHILIPPINES DEPARTMENT OF PUBLIC WORKS AND HIGHWAYS (DPWH) THE PROJECT FOR STUDY ON IMPROVEMENT OF BRIDGES THROUGH DISASTER MITIGATING MEASURES FOR LARGE SCALE EARTHQUAKES IN THE REPUBLIC OF THE PHILIPPINES FINAL REPORT MAIN TEXT [1/2] DECEMBER 2013 JAPAN INTERNATIONAL COOPERATION AGENCY (JICA) CTI ENGINEERING INTERNATIONAL CO., LTD CHODAI CO., LTD. NIPPON KOEI CO., LTD. EI JR(先) 13-261(2)
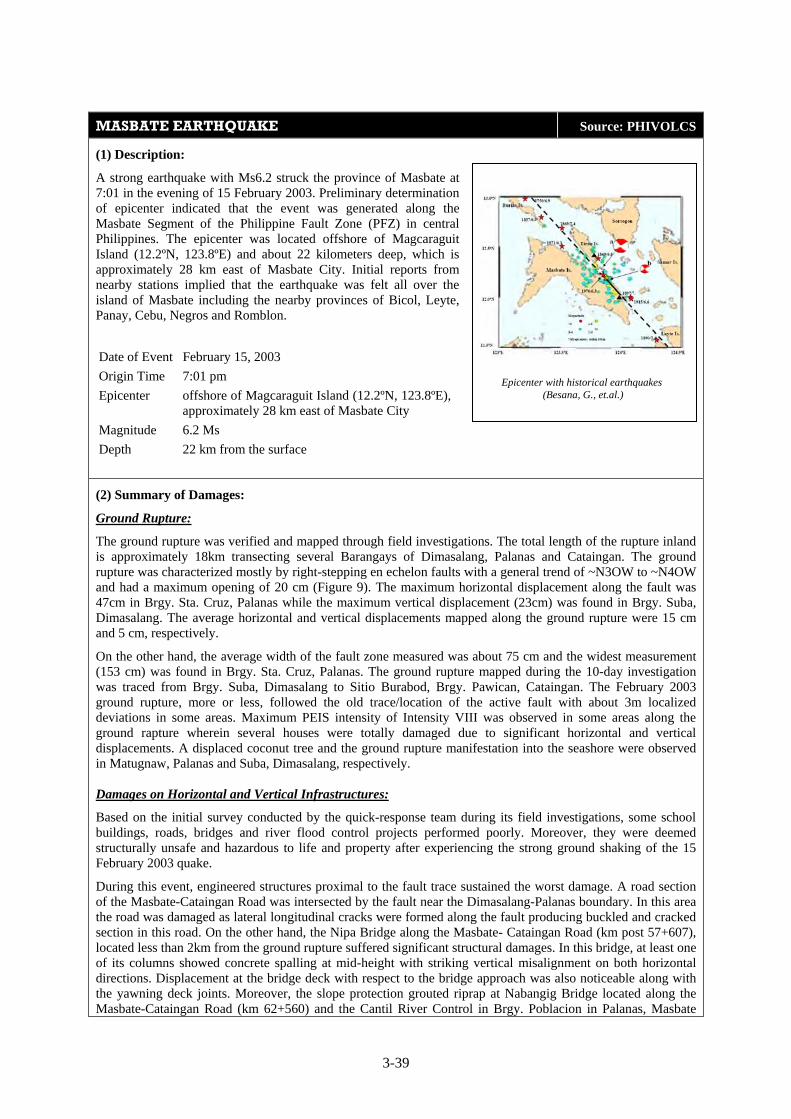
Transcript
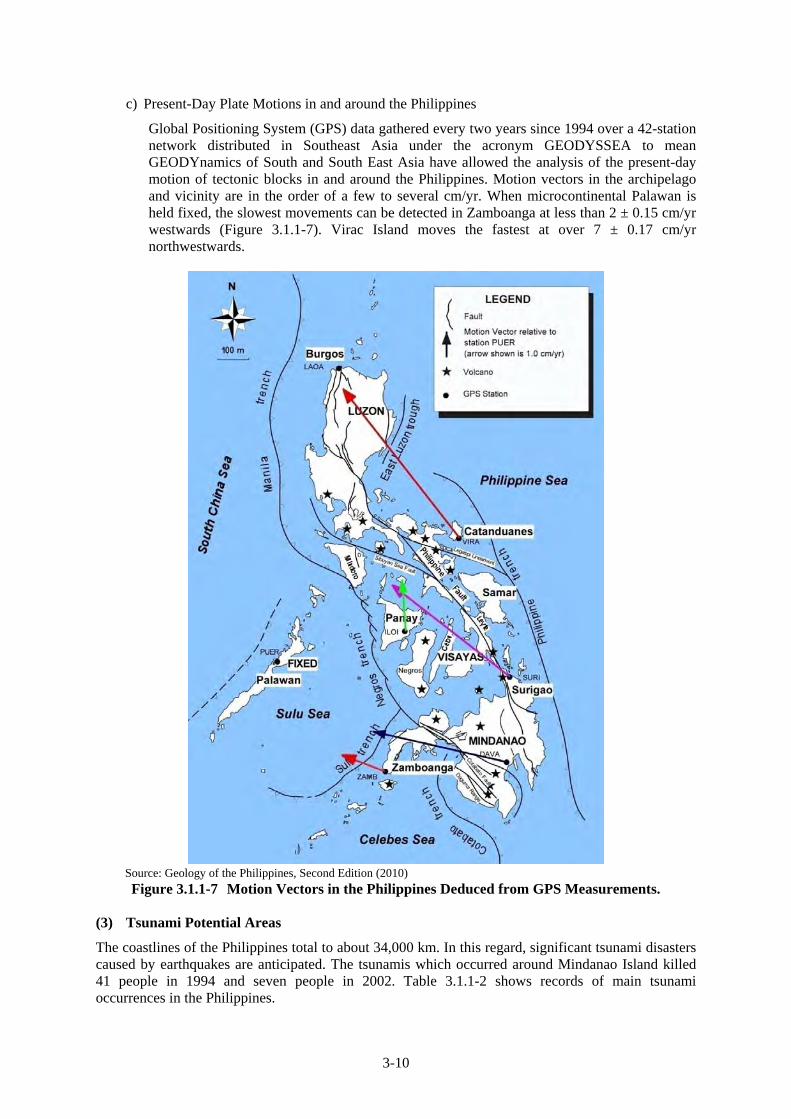
THE REPUBLIC OF THE PHILIPPINES
DEPARTMENT OF PUBLIC WORKS AND HIGHWAYS (DPWH)
THE PROJECT FOR STUDY ON
IMPROVEMENT OF BRIDGES THROUGH
DISASTER MITIGATING MEASURES FOR LARGE SCALE EARTHQUAKES
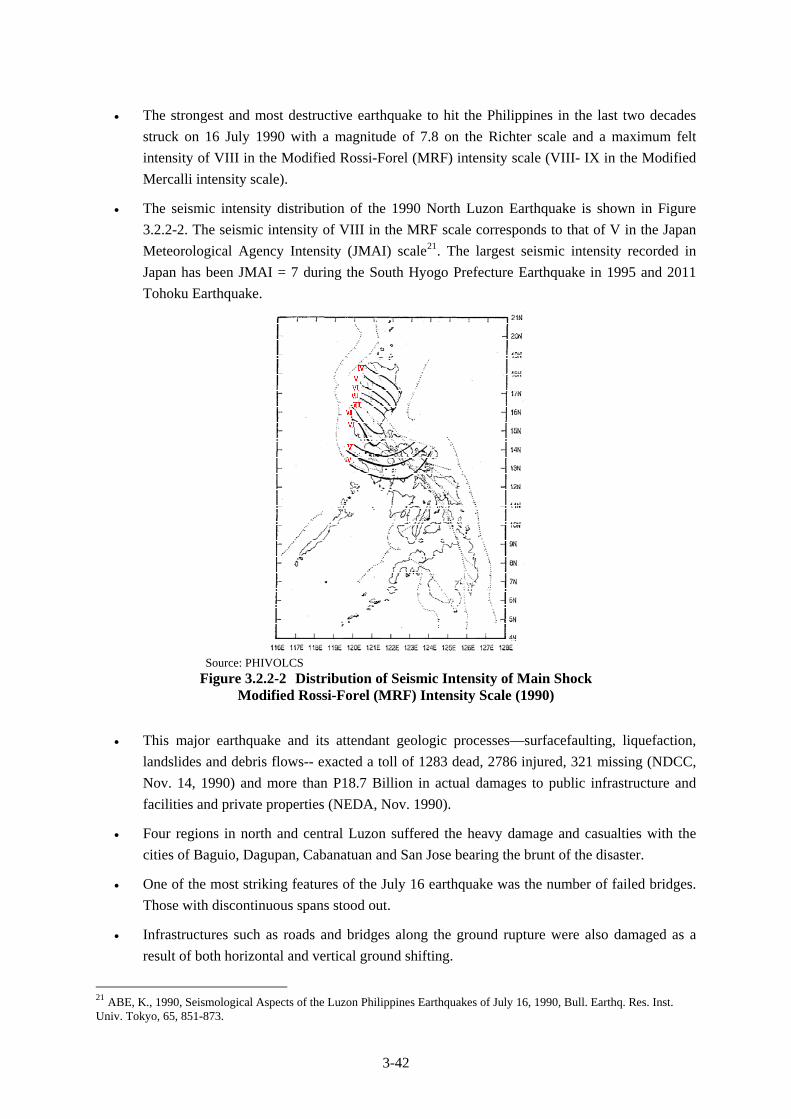
IN THE REPUBLIC OF THE PHILIPPINES
FINAL REPORT
MAIN TEXT [1/2]
DECEMBER 2013
JAPAN INTERNATIONAL COOPERATION AGENCY (JICA)
CTI ENGINEERING INTERNATIONAL CO., LTD
CHODAI CO., LTD. NIPPON KOEI CO., LTD.
EI
JR(先)
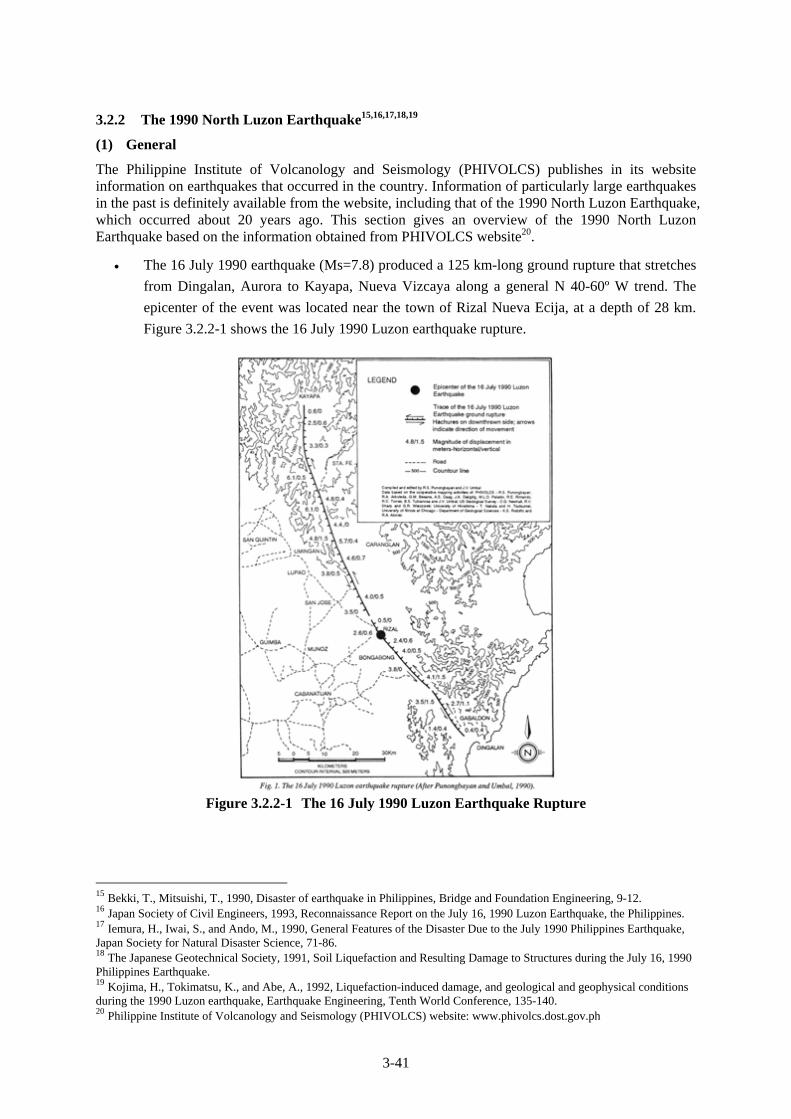
13-261(2)
Exchange Rate used in the Report is:
PHP 1.00 = JPY 2.222
US$ 1.00 = JPY 97.229 = PHP 43.756
(Average Value in August 2013, Central Bank of the Philippines)
i
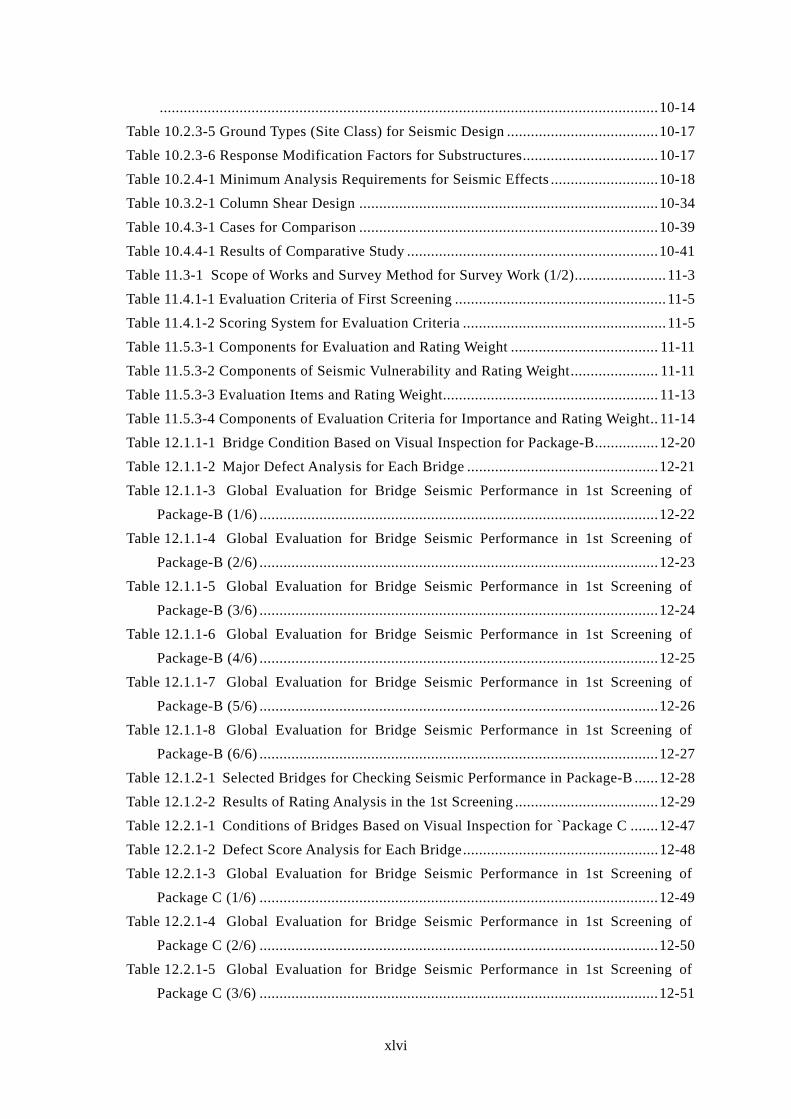
LOCATION MAP OF STUDY BRIDGES (PACKAGE B : WITHIN METRO MANILA)
ii
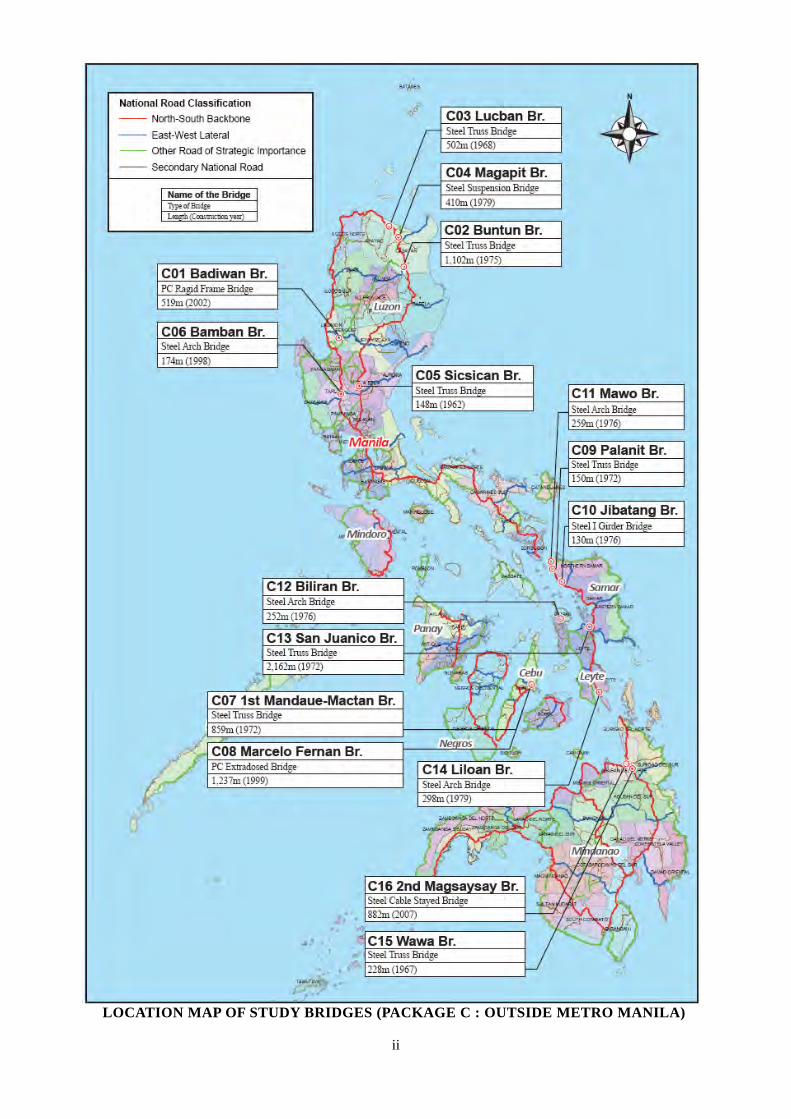
LOCATION MAP OF STUDY BRIDGES (PACKAGE C : OUTSIDE METRO MANILA)
Table 22.3.2-1 Features of Improvement Levels ............................................................. 21-9
Table 22.3.2-2 Proposal for the Improvement of Traffic Situations around MRT Guadalupe
Station .................................................................................................................. 21-10
lx
ABBREVIATIONS
AADT : Annual Average Daily Traffic
AASHTO : American Association of State Highway and Transportation Officials
ABC : Approved Budget for the Contract
AH : Asian Highway
AHTN : Asean Harmonized Tariff Nomenclature
ASD : Allowable Stress Design
ASEP : Association of Structural Engineers of the Philippines
B/C : Benefit Cost
BCGS Bureau of Coast and Geodetic Survey
BCR : Benefit Cost Ratio
BIR : Bureau of Internal Revenue
BOC : Bureau of Construction
BOD : Bureau of Design
BOM : Bureau of Maintenance
BRS : Bureau of Research and Standards
BSDS : Bridge Seismic Design Specification
CBD : Central Business District
CCA : Climate Change Adaptation
CCP : Cast-in-place concrete pile
CDA : Cooperative Development Authority
CLOA : Certificates of Land Ownership Award
CP : Counter Part
CPI : Consumer Price Index
DAO : Department Administrative Order
DEO : District Engineering Office
DIA : direct impact area
DL : Dead Load
DOF : Degree of Freedom
DPWH : Department of Public Works and Highways
DRR : Disaster Risk Reduction
DSWD : Department of Social Welfare and Development
ECA : Environmentally Critical Area
lxi
ECC : Environmental Compliance Commitment
EDC : Estimated Direct Cost
EDSA : Epifanio de los Santos Avenue
EGM : Earthquake Ground Motion
EIA : Environmental Impact Assessment
EIRR : Economic Internal Rate of Return
EIS : Environmental Impact Statement
EMB : Environmental Mnagement Bureau
EMoP : Environmental Monitoring Plan
EQ : Earthquake Load
ESCAP : Economic and Social Commission for Asia and the Pacific
ESSO : Environmental and Social Services Office
GRS : Grievance Redress System
ICC : Investment Coordinating Committee
IEE : Initial Environmental Examination
IMF : International Monetary Fund
IR : Involuntary Resettlement
IRR : Internal Rate of Return
ITC : Intersection Traffic Count
JBA : Japan Bridge Association
JCC : Joint Coordinating Committee
JICA : Japan International Cooperation Agency
JPCCA : Japan Prestressed Concrete Contractors Association
JRA : Japan Road Association
LAP : Land Acquisition Plan
LARRIPP : Land Acquisition, Resettlement, Rehabilitation and Indigenous Peoples’
LD : Longitudinal Direction
LFD : Load Factors Design
LGUs : Local Government Units
LL : Live Load
LOS : Level-of-Service
LPG : Liquefied Petroleum Gas
LRB : Laminated Rubber Bearing
LRFD : Load and Resistance Factor Design
MAD : Mean Absolute Difference
lxii
MC : Memorandum Circular
MGB : Mines and Geosciences Bureau
MHWL : Mean High Water Level
MRT : Mass Rapid Transit
MSL : Mean Sea Level
NAMRIA : National Mapping and Resource Information Authority
NCR : National Capital Region
NGO : Non-Governmental Organization
NIED : National Research Institute for Earth Science and Disaster Prevention
NLEX : North Luzon Expressway
NPV : Net Present Value
NSCP : National Structural Code of the Philippines
OC : Operational Classification
OD : Origin and Destination
OJT : On-the-Job Training
PAF : Project Affected Family
PAP : Project Affected Person
PC : Prestressed Concrete
PCG : Philippine Coast Guard
PD : Presidential Decree
PEIS : Philippine Earthquake Intensity Scale
PFI : Private Finance Initiative
PGA : Peak Ground Acceleration
PHIVOLCS : Philippine Institute of Volcanology and Seismology
PICE : Philippine Institute of Civil Engineers
PMO : Project Management Office
PPP : Public Private Partnership
R/D : Record and Discussion
RA : Republic Act
RAP : Resettlement Action Plan
RC : Reinforced Concrete
RIC : Resettlement Implementation Committee
RO : Regional Office
ROW : Right of Way
RTC : Roadside Traffic Count
lxiii
SER : Shadow Exchange Rate
SLEX : South Luzon Expressway
SMR : Self-Monitoring Report
SPL : Seismic Performance Level
SPP : Steel Pipe Pile
SPSP : Steel Pipe Sheet Pile
SPT Standard Penentration Test
SPZ : Seismic Performance Zone
SR : Superstructure Replacement
SWMP : Solid Waste Management Plan
SWR : Shadow Wage Rate
TCT : Transfer Certificate of Title
TD : Transversal Direction
TESDA : Technical Education and Skills Development Authority
TTC : Travel Time Cost
VAT : Value Added Tax
VOC : Vehicle Operating Cost
WB : World Bank
PART 1
GENERAL
1-1
CHAPTER 1 INTRODUCTION
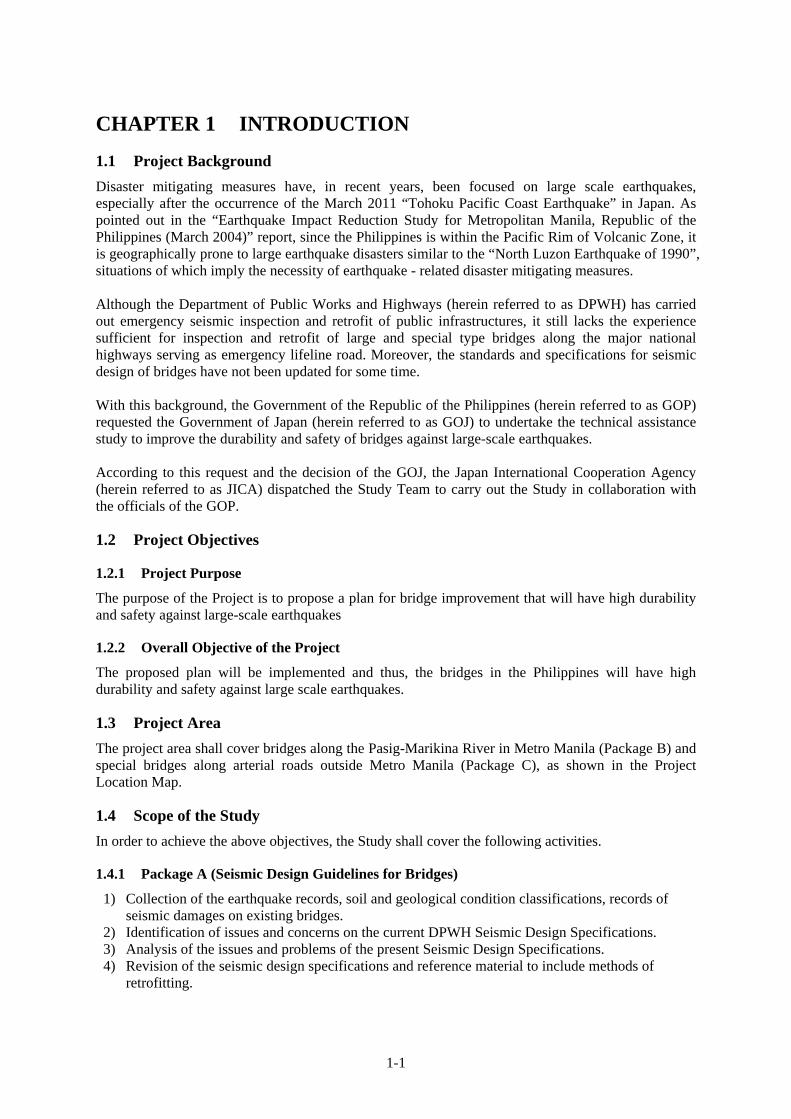
1.1 Project Background
Disaster mitigating measures have, in recent years, been focused on large scale earthquakes, especially after the occurrence of the March 2011 “Tohoku Pacific Coast Earthquake” in Japan. As pointed out in the “Earthquake Impact Reduction Study for Metropolitan Manila, Republic of the Philippines (March 2004)” report, since the Philippines is within the Pacific Rim of Volcanic Zone, it is geographically prone to large earthquake disasters similar to the “North Luzon Earthquake of 1990”, situations of which imply the necessity of earthquake - related disaster mitigating measures. Although the Department of Public Works and Highways (herein referred to as DPWH) has carried out emergency seismic inspection and retrofit of public infrastructures, it still lacks the experience sufficient for inspection and retrofit of large and special type bridges along the major national highways serving as emergency lifeline road. Moreover, the standards and specifications for seismic design of bridges have not been updated for some time. With this background, the Government of the Republic of the Philippines (herein referred to as GOP) requested the Government of Japan (herein referred to as GOJ) to undertake the technical assistance study to improve the durability and safety of bridges against large-scale earthquakes. According to this request and the decision of the GOJ, the Japan International Cooperation Agency (herein referred to as JICA) dispatched the Study Team to carry out the Study in collaboration with the officials of the GOP.
1.2 Project Objectives
1.2.1 Project Purpose
The purpose of the Project is to propose a plan for bridge improvement that will have high durability and safety against large-scale earthquakes
1.2.2 Overall Objective of the Project
The proposed plan will be implemented and thus, the bridges in the Philippines will have high durability and safety against large scale earthquakes.
1.3 Project Area
The project area shall cover bridges along the Pasig-Marikina River in Metro Manila (Package B) and special bridges along arterial roads outside Metro Manila (Package C), as shown in the Project Location Map.
1.4 Scope of the Study
In order to achieve the above objectives, the Study shall cover the following activities.
1.4.1 Package A (Seismic Design Guidelines for Bridges)
1) Collection of the earthquake records, soil and geological condition classifications, records of seismic damages on existing bridges.
2) Identification of issues and concerns on the current DPWH Seismic Design Specifications. 3) Analysis of the issues and problems of the present Seismic Design Specifications. 4) Revision of the seismic design specifications and reference material to include methods of
retrofitting.
1-2
5) Conduction of seminars about seismic design and related seismic design and construction technology for technology transfer.
1.4.2 Package B (Inside Metro Manila Area)
1) Determination of the bridges which require retrofitting / replacement to mitigate the seismic disaster.
2) Inspection of the bridges conditions including environmental and social conditions, around the bridges.
3) Carrying-out traffic volume survey on the roads related to the bridges. 4) Prioritizing and selecting the bridges to be retrofitted / replaced. 5) Preparing the outline design for replacement and estimating the cost for the selected bridges to
be replaced.
1.4.3 Package C (Outside Metro Manila Area)
1) Determination of the bridges which require retrofitting / replacement to mitigate the seismic disaster.
2) Inspection of the bridges conditions including environmental and social conditions, around the bridges.
3) Carrying-out traffic volume survey on the roads related to the bridges. 4) Prioritizing and selecting the bridges to be retrofitted / replaced. 5) Preparing the outline design for retrofitting and estimating the cost for the selected bridges to be
retrofitted.
1-3
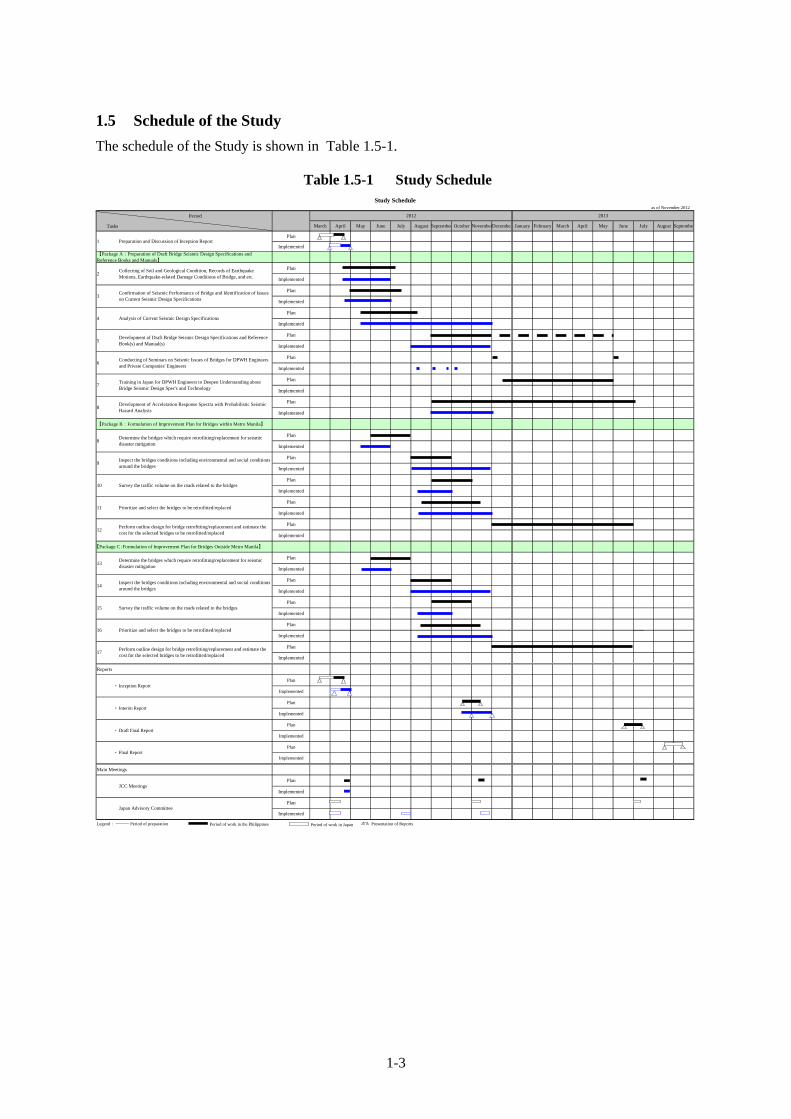
1.5 Schedule of the Study
The schedule of the Study is shown in Table 1.5-1.
Table 1.5-1 Study Schedule
as of November 2012
Period
Tasks
Plan
Implemented
Legend: ─── Period of preparation Presentation of Reports
Plan
Plan
Implemented
Plan
Plan
Plan
Plan
Implemented
Implemented
Main Meetings
Reports
・ Final Report
AugustAugust July
Plan
Plan
MayApril September
Plan
Plan
Implemented
Study Schedule
March April May JanuaryJulyJune September
20132012
【Package B:Formulation of Improvement Plan for Bridges within Metro Manila】
【Package C:Formulation of Improvement Plan for Bridges Outside Metro Manila】
・
12
Draft Final Report
JuneDecemberNovember
【Package A:Preparation of Draft Bridge Seismic Design Specifications andReference Books and Manuals】
October February March
Implemented
Confirmation of Seismic Performance of Bridge and Identification of Issueson Current Seismic Design Specifications
3
Interim Report・
Inception Report・
Plan
Plan
Implemented
Implemented
Analysis of Current Seismic Design Specifications4
Implemented
Implemented
Training in Japan for DPWH Engineers to Deepen Understanding aboutBridge Seismic Design Spec's and Technology
7
Implemented
Plan
Plan
Implemented
Implemented
Implemented
Perform outline design for bridge retrofitting/replacement and estimate thecost for the selected bridges to be retrofitted/replaced
Plan
Implemented
Implemented
Perform outline design for bridge retrofitting/replacement and estimate thecost for the selected bridges to be retrofitted/replaced
17
Prioritize and select the bridges to be retrofitted/replaced16
Implemented
Implemented
Survey the traffic volume on the roads related to the bridges15
Inspect the bridges conditions including environmental and social conditionsaround the bridges
14Plan
Plan
Development of Draft Bridge Seismic Design Specifications and ReferenceBook(s) and Manual(s)
5
1 Preparation and Discussion of Inception Report
Collecting of Soil and Geological Condition, Records of EarthquakeMotions, Earthquake-related Damage Conditions of Bridge, and etc.
2
Survey the traffic volume on the roads related to the bridges10
Conducting of Seminars on Seismic Issues of Bridges for DPWH Engineersand Private Companies' Engineers
6
Determine the bridges which require retrofitting/replacement for seismicdisaster mitigation
13
Development of Acceleration Response Spectra with Probabilistic SeismicHazard Analysis
8
Inspect the bridges conditions including environmental and social conditionsaround the bridges
9
Determine the bridges which require retrofitting/replacement for seismicdisaster mitigation
8
Prioritize and select the bridges to be retrofitted/replaced11
Implemented
Plan
Implemented
Plan
Implemented
Plan
Implemented
Plan
JCC Meetings
Implemented
Plan
Implemented
Plan
Japan Advisory Committee
Period of work in the Philippines Period of work in Japan
1-4
1.6 Organization of the Study
1.6.1 Joint Coordinating Committee (JCC)
The JCC has two roles for this project as stated below;
To discuss and approve each report submitted through the project, and
To review and exchange views on major issues arising from or in connection with the project. The members of the JCC are shown below. The Chairperson will be responsible for the overall administration and implementation of the project while the Vice Chairperson will assist the Chairperson. Officials of the Embassy of Japan may attend the meetings as observer. Personnel concerned to be nominated by the Japan side, if needed.
Name Organization Position
1 Raul C. Asis Undersecretary, Technical Services, DPWH
Chairperson
2 Eugenio R. Pipo Assistant Secretary, Technical Services, DPWH
Vice Chairperson
3 Gilberto S. Reyes Director, Bureau of Design, DPWH
Project Manager
4 Walter R. Ocampo Director, Bureau of Construction, DPWH
1.6.2 Counter Part Team (CP)/Technical Working Group (TWG)
The role of the CP is shown as below;
To undertake the works related to the project activities with the Study Team members
To function as Technical Working Group (TWG) The current members are:
Name Organization Position
1 Adriano M. Doroy OIC, Assistant Director, BOD, DPWH
Head
2 Edwin C. Matanguihan OIC, Chief, Bridges Division, BOD, DPWH
Member
3 Aristarco M. Doroy Chief, Project Assistance Division Area 1, BOC, DPWH
Member
4 Carolina S. Canuel Chief, Development Planning Division, PS, DPWH
Member
5 Dominador P. Aquino Chief, Planning and Programming Division, BOM, DPWH
Member
6 Reynaldo P. Faustino Chief, Research and Development Division, BRS, DPWH
Member
7 Lydia G. Chua Chief, Planning and Design Division, NCR, DPWH
Member
8 Guillerma Jayne Atienza
Senior Geologist, Survey and Investigation Division, BOD, DPWH
Member
1-6
1.6.3 JICA Advisory Committee (JAC)
The five members of JICA Advisory Committee to give directions to the Study are as follows;
Name Organization Position
1 Yukihiro TSUKADA Director Road Department, National Institute for Land and Infrastructure Management, Ministry of Land, Infrastructure, Transport and Tourism
Chairperson
2 Junichi HOSHIKUMA Chief Researcher Bridge and Structural Engineering Group, Center for Advanced Engineering Structural Assessment and Research, Public Works Research Institute
Member
3 Shojiro KATAOKA Senior Researcher Earthquake Disaster Prevention Division, National Institute for Land and Infrastructure Management, Ministry of Land, Infrastructure, Transport and Tourism
Member
4 Nodoka OSHIRO Senior Researcher Bridge and Structures Division, National Institute for Land and Infrastructure Management, Ministry of Land, Infrastructure, Transport and Tourism
Member
5 Mitsuyoshi AKIYAMA Professor, Infrastructure Engineering Division, Department of Civil and Environmental Engineering, WASEDA University
Member
1-7
1.6.4 JICA Study Team (JST)
The members of JICA Study Team to conduct the study including preparation of all reports and materials are as follows.
Name Assignment Task (Responsibility) Company
1 Dr. Shingo GOSE Team Leader/Seismic Design
Specifications CTII
2 Dr. Takayuki TSUCHIDA
Assistant Team Leader/Bridge Inspection and Condition Survey/Seismic Replacement/Strengthening Design
CTII
3 Mr. Toshio ICHIKAWA Seismic Design Specifications/Bridge
Inspection and Condition Survey NK
4 Dr. Jovito C. SANTOS Seismic Design Specifications/Bridge
Inspection and Condition Survey /Development of Book (s) and Manual (s)
CTII
5
Mr. Hiroaki OHTAKE Seismic Design Specifications Assistant /Inspection and Condition Survey Assistant/Seismic Rehabilitation / Strengthening Design Assistant
CTII
6 Dr. Akira TAKAUE Replacement Bridge Design(Superstructure) CHODAI
7 Mr. Kei KATAYAMA Replacement Bridge Design(Substructure) (1) CHODAI
9 Mr. Hiroshi SAITO Approach Road Design/Revetment & Slope
Protection CHODAI
10 Mr. Kenichi TANAKA Geotechnical Investigation NK
11 Mr. Tomoyuki NISHIKAWA
Topographic Survey NK
12 Mr. Ryo TANAHASHI Hydrology/Meteorology NK
13 Mr. Yasushi OYAMA Earthquake Motion Analysis CHODAI
14 Mr. Yasufumi WATANABE
Construction Planning/Cost Estimate CTII
15 Mr. Hiroshi KANEKO Traffic Planning/Economical Analysis (1) CTII
16 Mr. Ryuichi UENO Traffic Planning/Economical Analysis (2) CTII
17 Mr. Daisuke YAMASITA
Traffic Micro Simulation
18 Mr. Kunihiko HARADA Social and Environmental Consideration CHODAI
19 Ms. Yumi IWASHITA Training Plan (1) CTII
20 Ms. Minami KATO Training Plan (2) CTII
21 Dr. William Tanzo Adviser CTII
1-8
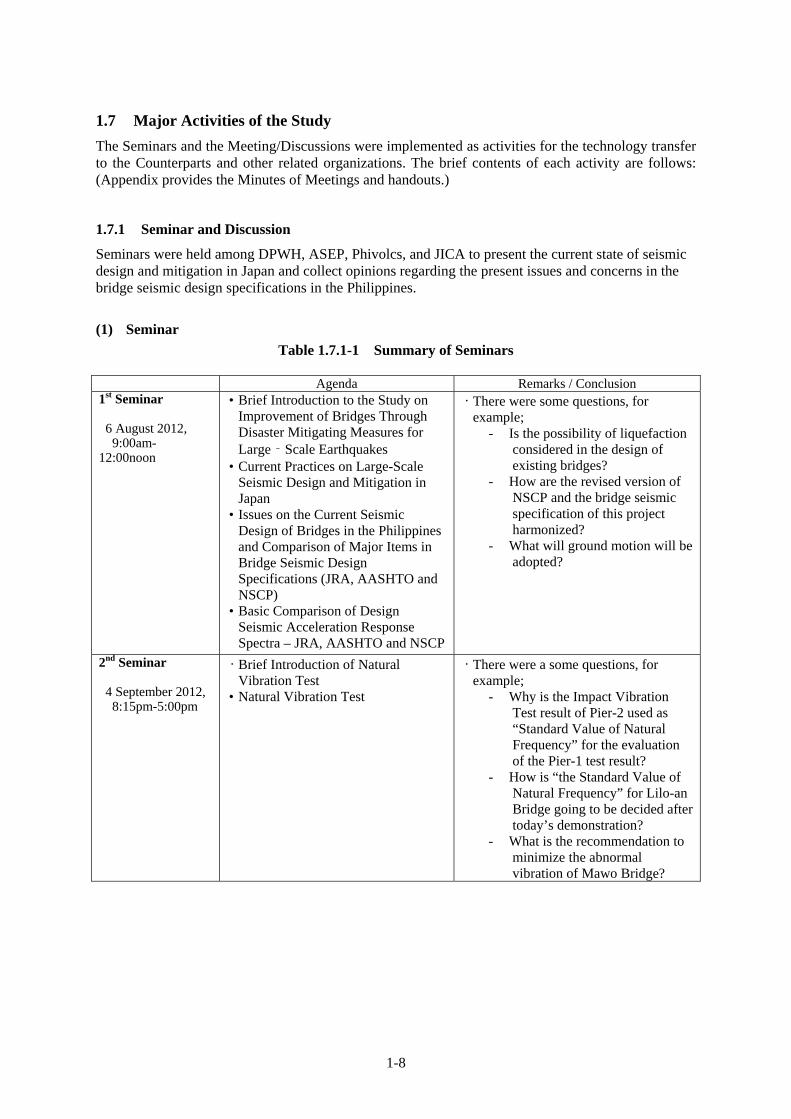
1.7 Major Activities of the Study
The Seminars and the Meeting/Discussions were implemented as activities for the technology transfer to the Counterparts and other related organizations. The brief contents of each activity are follows: (Appendix provides the Minutes of Meetings and handouts.)
1.7.1 Seminar and Discussion
Seminars were held among DPWH, ASEP, Phivolcs, and JICA to present the current state of seismic design and mitigation in Japan and collect opinions regarding the present issues and concerns in the bridge seismic design specifications in the Philippines.
• Brief Introduction to the Study on Improvement of Bridges Through Disaster Mitigating Measures for Large‐Scale Earthquakes
• Current Practices on Large-Scale Seismic Design and Mitigation in Japan
• Issues on the Current Seismic Design of Bridges in the Philippines and Comparison of Major Items in Bridge Seismic Design Specifications (JRA, AASHTO and NSCP)
• Basic Comparison of Design Seismic Acceleration Response Spectra – JRA, AASHTO and NSCP
• There were some questions, for example;
- Is the possibility of liquefaction considered in the design of existing bridges?
- How are the revised version of NSCP and the bridge seismic specification of this project harmonized?
- What will ground motion will be adopted?
2nd Seminar 4 September 2012,
8:15pm-5:00pm
• Brief Introduction of Natural Vibration Test
• Natural Vibration Test
• There were a some questions, for example;
- Why is the Impact Vibration Test result of Pier-2 used as “Standard Value of Natural Frequency” for the evaluation of the Pier-1 test result?
- How is “the Standard Value of Natural Frequency” for Lilo-an Bridge going to be decided after today’s demonstration?
- What is the recommendation to minimize the abnormal vibration of Mawo Bridge?
1-9
Agenda Remarks / Conclusion 3rd Seminar 11 October 2012,
2:30 pm-4:00pm
• Brief explanation on DSWT demonstration
• Demonstration of DSWT • Discussion • Natural Vibration Test at the Site
• There were a some questions, for example;
- Is the distance between the trigger point and the borehole long enough to obtain good data?
- How do we know the depth of the borehole geophones in consecutive testing at the site?
- Is hammer energy sufficient enough for the test and are the counterweights sufficient enough to stabilize the wooden plank as the trigger point of shear waves?
4th Seminar
17 January 2013, 9:00am-4:20pm
18 January 2013, 9:00am-4:30pm
• Session 1: Major Damages due to Large Scale Earthquake in the Philippines
• Session 2: Earthquake Disaster Mitigation Strategies for Roads
• Session 3: Outline of the Proposed Bridge Seismic Design Specification
• Session 4: Development of Design Earthquake Motions for Bridges in the Philippines
• Session 5: Evaluation Results and Selection of Objective Bridges for Outline Design in the Project
• Session 6: Seismic Retrofit of Concrete Pier
• Session 7: Introduction of Seismic Devices in Japan
• Session 8: Seismic Retrofitting Practices on Bridge
• Session 9: Ground Improvement Countermeasures against Liquefaction in Japan
• There were some questions for each session, for example;
- Will the Study Team prepare some types of spectrum depending on soil conditions of the sites?
- Is it possible to use the past earthquake records for the development of the spectrum?
- What kind of earthquake data used in Japanese bridge designs?
• It was proposed that ASEP and the Study Team need coordinate and the team stated that one of them would attend future ASEP meetings.
1-10
Agenda Remarks / Conclusion 5th Seminar
20 June 2013, 9:00am-5:00pm
21 June 2013, 9:00am-5:10pm
• Session 1: Outline of the Study • Session 2: Explanation of Draft
Design of Earthquake Ground Motions for the Objective Bridge
• Session 3: Improvement Scheme for Guadalupe Bridge and Mawo Bridge and Retrofitting Outline Design of 1st Mandaue-Mactan Bridge and Lilo-an Bridge
• Session 4: Explanation of Countermeasure on the Bridge to be Replaced
• Special Lecture: Performance-Based Bridge Seismic Design Methodology
• Session 5: Practice on Press-in Piling Technologies
• Session 6: Practice on Bearings and Unseating Prevention System
• Session 7: Practice on Ground Improvement Under Limited Space
• There were some questions for each session, for example;
- Why don’t the retrofit plans in this study include the retrofit of superstructures?
- Is there any practical method in Japan to define the skeleton curves of deteriorated pier columns?
- What is the minimum required overhead clearance for pile-driving work under existing superstructures?
• There was a comment that in order to prevent the change of target bridges’ improvement measures due to the inaccuracy of cost estimation, please show not ratio but the actual estimated cost of the improvement measures.
6th Seminar 13 November 2013,
9:00am-5:00pm 14 November 2013,
9:00am-5:00pm
• Background and Outline of BSDS • BSDS Section 1: Introduction • Basics of Structural Dynamics and
Earthquake Engineering • BSDS Section 3: General
Requirements • Development of Design Spectral
Acceleration Mapping for Philippine Bridges – Part 1
• BSDS Section 4: Analysis Requirements
• Example of Analysis Model of a bridge Including Soil Springs
• BSDS Section 5: Design Requirements
• Example of Design of Pier and Foundation
• BSDS Section 6: Effects of Seismically Unstable Ground
• Example of Foundation Design considering Ground Liquefaction
• BSDS Section 7: Unseating Prevention System
• Example of Unseating Prevention System Design
• BSDS Section 8: Requirements for Seismically Isolated Bridges
• Design Example of Multi Span Continuous Bridge
• There were some questions for each session, for example;
- If bridge span length is more than 150m, which is the limit length as conventional bridge, what specific measures should be taken besides basic requirements in BSDS?
- What’s the difference in definition between recurrence intervals and return period?
- Is 30m-depth of SPT good enough to determine the value of acceleration coefficient, PGA?
- Is there any established procedure to update contour maps?
- What is the appropriate foundation type as a countermeasure against forces caused by liquefaction or very soft clay layers?
- In the presentation, 1% of pile diameter is applied as displacement limit of pile foundations. What is the reason of application of 1%? Is it explained in BSDS?
• DPWH requested JICA Study Team to provide the technical assistance of institutionalization of the new BSDS during the transition period.
• DPWH agreed with Study Team’s proposal to develop PGA and design seismic acceleration using probabilistic approach, and also agreed to decide the use of either the 475-yr or 1,000-yr return period as the design earthquake.
• DPWH agreed to adjust the present design response spectra used by DPWH following the JRA soil classification.
• Study Team suggested more detailed discussions with DPWH on the soil classification for the new BSDS during the development of the specifications.
2nd Discussion
26 September 2012, 2:00pm-5:15pm
• Presentation by JICA Advisory Committee “Seismic Design and Retrofit for Highway Bridges Based on Lessons Learned From Damage Due to Past Earthquake in Japan”
• Discussions
• Counterpart mentioned that the biggest concern for Metro Manila is the potential movement of the Marikina Valley Fault System.
• There were questions whether the use of TEMPCORE steel is allowed in Japan and whether multi-column type piers are preferable than single-type due to better redundancy.
• Counterpart commented the financial issue of countermeasures against lateral spreading.
3rd Discussion 27 September 2012, 2:00pm-5:30pm
• Presentation by JICA Study Team
- Second Screening Criteria for Package B and C
- Progress of Hydraulic Study
- Study on Seismic Retrofit Plans for the Target Bridges (Package B & C)
• Discussions
• DPWH requested that the criteria system should be in more quantitative manner though the proposed system was rather in qualitative manner based on engineer’s judgments.
• DPWH requested Study Team to introduce new seismic technologies such as countermeasures for liquefaction-induced lateral spreading and base isolation devices.
4th Discussion
18 October 2012, 10:00am-1:30pm
• Discussions - Flowchart of 2nd
screening implementation category for Package B and C selection of bridges for outline design
- Evaluation criteria for non-technical issues
• The evaluation for “Economic Loss” criteria is not finalized and Study Team will propose the parameters for calculating economic loss.
• It was agreed that the Evaluation and Recommendation will be revised including technical and non-technical issues to prioritize bridge improvements.
• Study Team will prepare a more systematic Evaluation System for Bridge Retrofit Prioritization to be included in the Retrofit Manual.
1-13
Agenda Remarks / Conclusion 5th Discussion
7 February 2013, 9:00am-10:30am
• Discussions - Road Design
Conditions of Lambingan Bridge
• There was a discussion about the bridge replacement plan and it was agreed that Study Team will propose the bridge replacement plan with the result of the comparison study.
6th Discussion
27 February 2013, 9:00am – 11:40am
• Discussions - Comparison study
results of improvement measure schemes for Lambingan Bridge
- Comparison study results of improvement measure schemes for Guadalupe Bridge
• There was a suggestion for the abutment relocation by DPWH and Study Team will re-check the proposed abutment locations with the finalized dike plan.
• Study Team will propose the finalized improvement measure scheme after further comparative study.
• There was a request of the seismic retrofit of the inside bridge and Study Team will have further study on the proper improvement measure scheme.
7th Discussion
8 July 2013, 2:00pm – 6:00pm
• Discussions - Proposed Draft
Provisions for Bridge Seismic Design Specifications
- Proposed PGA and Spectral Coefficients
- Site Specific Spectra for 7 Bridges under Study
• BSDS was basically agreed though there were some suggestions to rewrite or insert sentences in each section.
8th Discussion
11 July 2013, 2:00pm-5:40pm
• Discussion - Proposed Draft
Provisions for DPWH LRFD Seismic Bridge Design Specifications
• DPWH LRFD Seismic Bridge Design Specifications was basically agreed though there were some suggestions to rewrite sentences and reconsider parts in each section.
1-14
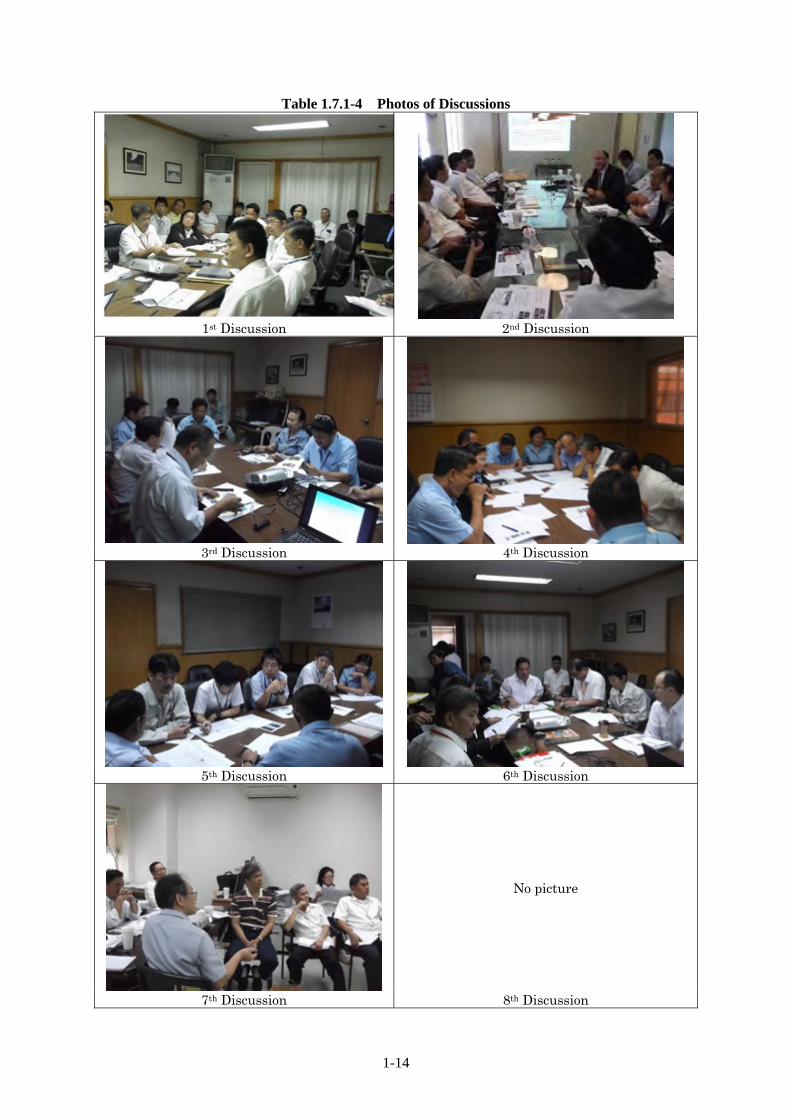
Table 1.7.1-4 Photos of Discussions
1st Discussion 2nd Discussion
3rd Discussion 4th Discussion
5th Discussion 6th Discussion
No picture
7th Discussion 8th Discussion
1-15
1.7.2 Meeting
(1) TWG
Table 1.7.2-1 Summary of TWG Meetings Agenda Remarks / Conclusion 1st Meeting of TWG
18 April 2012, 2:00pm
• Introduction of members • Discussion of Package B, C
and A. • Discussion of seismic design
specifications
• There was a discussion regarding old bridges with no drawings. DPWH mentioned that they would use backward calculations.
• There was a discussion on policy of judgment for replacement. DPWH has an existing replacement policy.
• It was affirmed that the CP agrees to cooperate with the JICA Study Team in different activities of the study.
2nd Meeting of TWG 1 June 2012,
10:00am
• Report on the progress of the 1st screening of Package C
• Discussion of the scoring system for evaluation of 1st screening
• It was suggested by CP that road importance and loading capacity should be separated in the scoring system for evaluation of the 1st screening.
• The scoring system for seating length was discussed and it was recommended to be reviewed.
• CP asked if structural type should be included in the scoring and how it should be reflected.
• CP would like to clarify how scoring for liquefaction will be conducted. It is suggested that liquefaction scoring should be based on boring data if available; or PHIVOLCS liquefaction mapping if boring data are not available.
3rd Meeting of TWG
2 July 2012, 10:00am
• Report on the result of the 1st screening of Package B and C
• Discussion
• It was suggested by CP that a closer inspection of the substructure of Nagtahan Bridge be made since some tabular steel piles are already exposed.
• It was suggested by CP that the seismic retrofit of Sicsican Bridge was already implemented by DPWH so 2nd screening should instead include Biliran Bridge.
• CP Engr. Matanguihan commented that criteria should emphasize more on seismic considerations. Asst.-Dir. Doroy asked if distance from fault line is a factor to consider; and suggested that the selection should be more on seismic performance, not on condition assessment.
1-16
Agenda Remarks / Conclusion 4th Meeting of TWG
27 November 2012, 2:00pm-5:00pm
• Explanation of Draft Interim Report
• Discussions
• DPWH basically accepted the overall contents of the interim report.
• Design seismic performance requirements and design earthquake levels will be decided by DPWH after JICA Study Team’s proposal.
• DPWH requested the preparation of seismic bridge retrofit manual in this project.
• DPWH requested that Study Team should conduct outline designs in accordance with the number of bridges said in TOR
5th Meeting of TWG
17 May 2013, 2:00pm-5:00pm
• Major contract modifications between JICA and Study Team
• Detail comparison study on improvement scheme selection for Guadalupe Bridge and Mawo Bridge
• Retrofitting outline design of 1st Mandaue-Mactan Bridge and Lilo-an Bridge
• Explanation of countermeasure on the Bridge to be replaced and draft design of earthquake ground motions for the objective bridges
• Asst-Dir. Doroy asked about the difficulty of reconstruction of bridge pier without closure of existing traffic flow.
• Asst-Dir. Doroy asked about clearance requirement of the bridge and the inhibition ratio.
• There was a question as to whether fabrication can be made in the Philippines.
• There was a question about clearance requirement of the bridge and the inhibition ratio.
6th Meeting of TWG
27 September 2013, 10:00am-1:00pm
• Explanation on the Draft Bridge Seismic Design Specifications
• Explanation on Construction Planning and Cost Estimation of Seven Selected Bridges
• DPWH agreed on the overall content of the draft bridge seismic design specifications.
• JICA Study Team will include 1000-yr return as the design earthquake and 2500-yr return as the earthquake greater than the design earthquake in answer to the request of DPWH.
• DPWH basically agreed on the construction planning schemes of selected bridges.
• JICA Study Team will reconsider the construction planning to minimize the duration and include the repair work in the plan.
7th Meeting of TWG
11 November 2013, 2:15pm-5:15pm
• Explanation of the Draft Final Report
• Discussions
• DPWH basically agreed on the overall content of the report.
• DPWH requested to revise the presentation content shown in the meeting before JCC meeting and Study Team will revise it based on the request.
• As for the bridge operational classification, DPWH pointed out that although Lambingan Bridge is categorized as “Essential Bridge” in BSDS the bridge is initially designed as “Critical Bridge” in the outline design. Lambingan Bridge can be categorized as “Essential Bridge” during the detailed design.
1-17
Table 1.7.2-2 Photos of TWG Meetings
1st Meeting of TWG 2nd Meeting of TWG
3rd Meeting of TWG 4th Meeting of TWG
No Picture
5th Meeting of TWG 6th Meeting of TWG
7th Meeting of TWG
1-18
(2) JCC
Table 1.7.2-3 Summary of JCC Meetings Agenda Remarks / Conclusion
1st Meeting of JCC
27th April 2012, 2:00pm-4:00pm
• Introduction of the Members • Explanation on the Inception
Report • Discussion
• There was a question as to whether the Japanese code will be used as the basis for revision of Philippine seismic bridge design code
• Dir. Reyes asked if the copies of the manual for distribution will be included in the Project.
• Dir. Navarro of Planning Service asked if the study will include recommendations to JICA for funding for the implementation of the study results.
• There was a discussion about the possibility for the Study to recommend some bridges for implementation to be funded by PPP.
2nd Meeting of JCC 11 December 2012,
2:00pm-4:30pm
• Explanation of Draft Interim Report
• Discussion
• DPWH requested that DPWH needs transition period to shift from the existing LFD to the latest LRFD.
• DPWH requested a bridge seismic retrofit design manual that includes step-by-step retrofit methods and design examples for the widespread use of the new design specifications in all the regions
• There were questions about the cost criterion to choose either replacement or seismic retrofit in this study and the reason why soil classification criterion with three soil types will be recommended in the new design specifications, while criterion with four soil types is used in the current DPWH code
3rd Meeting of JCC 15 November 2013,
2:30pm-5:00pm
• Explanation of Draft Final Report• Discussion
• DFR were almost approved in the meeting although there were some questions as follows;
- How often we need to update the spectral acceleration maps?
- If the spectral acceleration maps developed for BSDS could be adopted for building design
• Asst.-Dir. Doroy has recommended in the TWG that minimum of PGA for 1000-year return period be raised to 0.3g from 0.2g as computed in the PSHA study; and asked ASEP regarding its implication in the new revisions of the NSCP bridge code. ASEP replied that the latest revised NSCP bridge code submitted for approval still made use of the 2-zone map; but if DPWH will adopt the BSDS, ASEP will convene the bridge committee to discuss harmonization of their code with the BSDS.
• ASEP will convene as soon as possible to
1-19
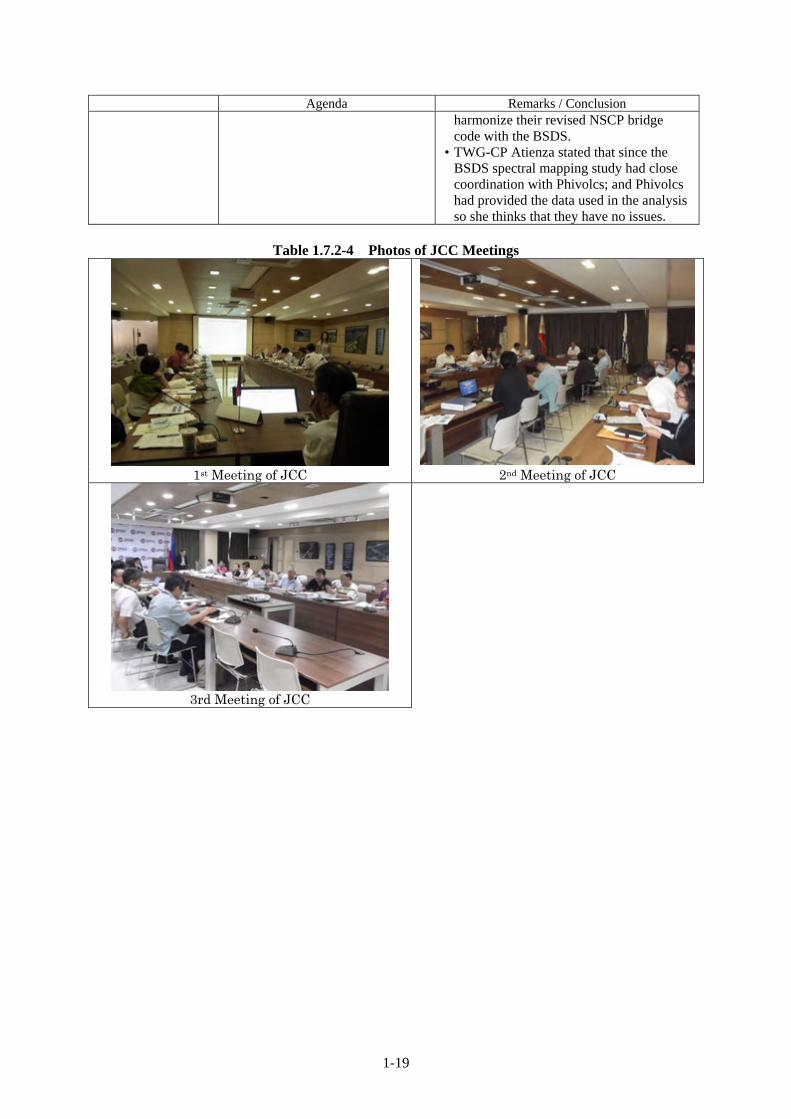
Agenda Remarks / Conclusion harmonize their revised NSCP bridge code with the BSDS.
• TWG-CP Atienza stated that since the BSDS spectral mapping study had close coordination with Phivolcs; and Phivolcs had provided the data used in the analysis so she thinks that they have no issues.
Table 1.7.2-4 Photos of JCC Meetings
1st Meeting of JCC 2nd Meeting of JCC
3rd Meeting of JCC
1-20
1.7.3 Training in Japan
(1) 1st Training Duration: April 14 - 27, 2013
Objective:Capacity development through the following training
- Understand mechanism of earthquake generation and seismic engineering - Understand Japanese planning and administration system for bridge protection from earthquakes Participants: 3
- Mr. Adriano M. Doroy (DPWH) - Mr. Edwin C. Matanguihan (DPWH) - Mr. Aristarco M. Doroy (DPWH)
Table 1.7.3-1 Schedule of Training Date Type Contents Lecturer
14-Apr Flight (Manila - Narita) 15-Apr Lecture Orientation 16-Apr Lecture Restoration of Damages to Roads and Bridges
Caused by Tohoku Region Pacific Coast Earthquake
CTII
17-Apr Lecture Basic Knowledge of Seismic Engineering Kyushu University Tour Observation of Test Room
General Information of Construction Work in Shimizu
NEXCO Central Japan
Tour Observation of Bridges in High-Standard Highways
NEXCO Central Japan
20-Apr Lecture Preparation for Evaluation Meeting 21-Apr Lecture Preparation for Evaluation Meeting 22-Apr Tour Observation of Seismic Retrofit Works and
Repair Works CTII
23-Apr Lecture Bridge Seismic Design Specifications in Japan Public Works Research Institute (PWRI)
Tour Observation of Test Room PWRI 24-Apr Tour Observation of Large and Long Span Bridges
(Rainbow Bridge, Bay Bridge, Aqua-line, Tokyo Gate Bridge)
CTII
25-Apr Lecture Introduction of Damages Caused by Tsunami CTI Engineering Co., Ltd. (CTIE)
26-Apr Preparation for Evaluation Meeting 27-Apr Flight (Narita - Manila)
1-21
Table 1.7.3-2 Photos of 1st Training
Photo 1 Photo 2
Photo 3 Photo 4
Photo 5 Photo 6
1-22
(2) 2nd Training Duration: July 14 - 27, 2013
Objective:Capacity development through the following training
- Understand of seismic engineering and mechanism of seismic force for seismic design - Understand Japanese planning and administration system for bridge protection from earthquakes
- Mr. Gilberto S. Reyes (DPWH) - Mr. Mamitag (Asec, DPWH) - Ms. Guillerma Jayne T. Atienza (DPWH/Geological Society) - Dr. Benito Pacheco(UP) - Mr. Villaraza (ASEP) - Mr. Penarubia (PHIVOLCS) - Dr. William Tanzo (JICA Study Team Advisor) *CTI shoulder the fee
Table 1.7.3-3 Schedule of Training
Date Type Contents Lecturer 14-Jul Flight (Manila - Narita) 15-Jul Tour Observation of Seismically Improved Bridges
(Rainbow Bridge, Bay Bridge, Tokyo bay Aqualine, Tokyo Gate Bridge)
CTII
16-Jul Lecture Orientation JICA, CTII 17-Jul Tour Observation of Ohito Bridge and East Suruga Port
Ring Road Numazu Public Works Office, Shizuoka Prefecture
18-Jul Lecture Microtremor measurements and site amplification in Metro Manila
Tokyo Institute of Technology
19-Jul Lecture Seismic response analysis in Japan NILIM Lecture K-NET/KIK-NET NIED
Tour Observation of K-NET/KIK-NET Institute NIED 20-Jul Tour Nikko Tour (Sightseeing) Tour conductor 21-Jul Travel by Train (Tokyo - Hyogo) 22-Jul Tour
Observation of large shaking table and other testing equipment
E-defense
Tour Observation of Fault Museum Nojima Fault Preservation Museum
23-Jul Lecture
Expressway in Urban Area Damaged by "Hyogo‐ken Nanbu Earthquake" in 1995
Hanshin Expressway Co., Ltd.
Tour Site Observations (Minato Bridge, Kizu-Ichiba Viaduct, Umeda Exit Ramp Viaduct)
Hanshin Expressway Co., Ltd.
24-Jul Tour Observation to Disaster Reduction and Human Renovation Institute
Disaster Reduction and Human Renovation Institute
Lecture Active Fault in the Philippines Kyoto University 25-Jul Travel by Train (Hyogo - Tokyo)
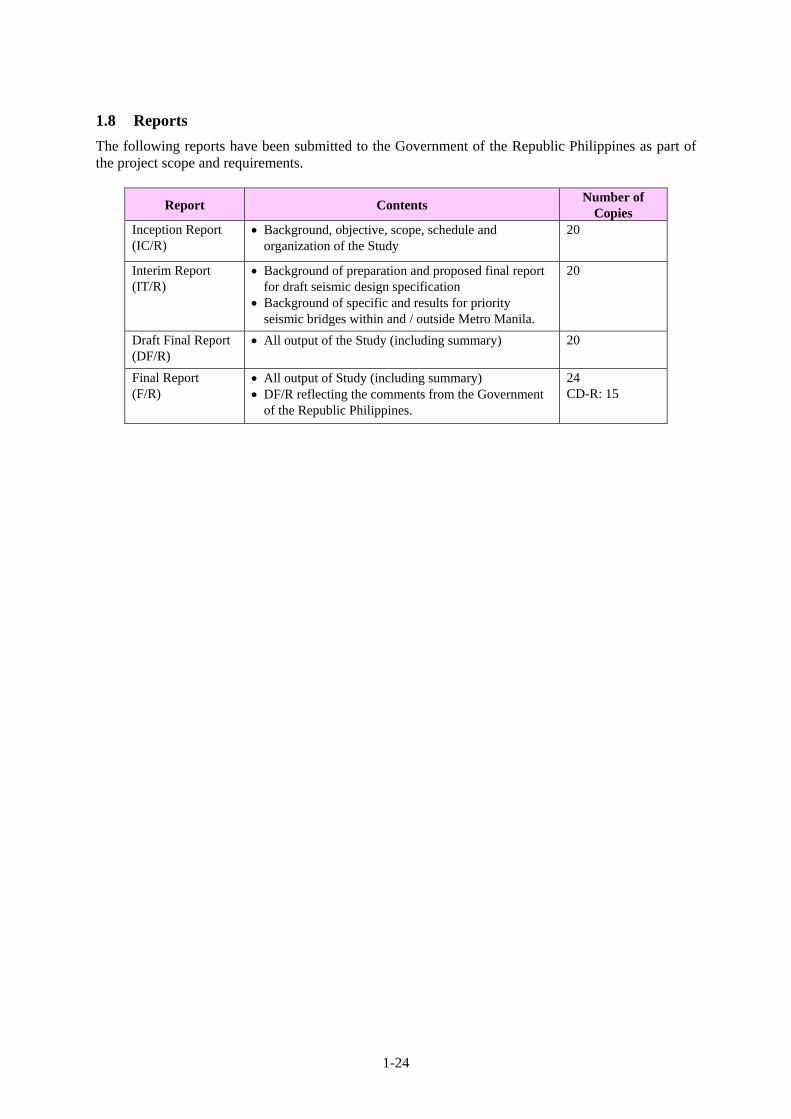
The following reports have been submitted to the Government of the Republic Philippines as part of the project scope and requirements.
Report Contents Number of
Copies Inception Report (IC/R)
Background, objective, scope, schedule and organization of the Study
20
Interim Report (IT/R)
Background of preparation and proposed final report for draft seismic design specification
Background of specific and results for priority seismic bridges within and / outside Metro Manila.
20
Draft Final Report (DF/R)
All output of the Study (including summary) 20
Final Report (F/R)
All output of Study (including summary) DF/R reflecting the comments from the Government
of the Republic Philippines.
24 CD-R: 15
2-1
CHAPTER 2 ORGANIZATIONS CONCERNED FOR SEISMIC DESIGN OF BRIDGES
2.1 Functions of the Concerned Organizations
2.1.1 Department of Public Works and Highways (DPWH)
(1) Background/History
DPWH, into its present structure, underwent a long process of evolution spanning a century of colorful and significant events in laying the groundwork for the physical foundation of the country. The DPWH historical evolution is shown in Figure 2.1.1-1.
Source: DPWH
Figure 2.1.1-1 DPWH History
1565
1968
1987
2012
Year Description
1867
DPWH is considered as old as the Philippine government, its existence dates back to about four (4) centuries at the time of the Spanish colonial era. It emerged from its embryonic form when settlement roads were constructed by forced labor.
In order to pursue Spanish objective, the King of Spain designated the Spanish Governor General in the country as Chief of Public Works assisted by “Junta Consultiva” through a Royal Degree.
The Bureau of Public Works and Highways (Obras Publicas) and Bureau of Communications and Transportation (Communicationes y Meteologia) were organized under a civil engineer known as “Director General”.
The agency is now known as the Department of Public Works and Highways (DPWH) with five (5) bureaus, six (6) services, sixteen (16 regional offices, twenty-four (24) project management offices sixteen (16) regional equipment services and one-hundred eighteen (118) district engineering offices.
1898 The Organic Decree issued by Gen. Emilio Aquinaldo establishing the Philippine Revolutionary Government created four (4) government departments among which was the “Department of War and Public Works”
1902 The Bureau of Engineering and Construction of Public Works and Bureau of Architecture and Construction of Public Buildings - were created by Act. Nos 22 and 268 of the Philippine Commission and placed under “The Department of Commerce and Police”
1916 The Department of Commerce and Police transformed to “The Department of Commerce and Communications”
1931 The Department of Commerce and Communications renamed as “The Department of Public Works and Communications”
1951 The Department of Public Works and Communications (DPWC) was reconstituted as “The Department of Public Works, Transportation and Communications”
1974 BPH was expanded as “The Department of Public Highways”.
1976 DPWTC became Ministry of Public Works, Transportation and Communications (MPWTC) & DPH as Ministry of Public Highways (MPH).
1979 MPWTC was restructed into two (2) separate Ministries - one, the Ministry of Transportation and Communication and two, “The Ministry of Public Works”.
1981 MPW and MPH were merged to become “The Ministry of Public Works and Highways”.
2-2
(2) Mandate and Function
Mandate DPWH is one of the three departments of the government undertaking major infrastructure projects. The DPWH is mandated to undertake (a) the planning of infrastructure, such as national roads and bridges, flood control, water resources projects and other public works, and (b) the design, construction, and maintenance of national roads and bridges, and major flood control systems.
Function The Department of Public Works and Highways functions as the engineering and construction arm of the Government tasked to continuously develop its technology for the purpose of ensuring the safety of all infrastructure facilities and securing for all public works and highways the highest efficiency and quality in construction. DPWH is currently responsible for the planning, design, construction and maintenance of infrastructure, especially the national highways, flood control and water resources development system, and other public works in accordance with national development objectives. (3) Organization Chart
DPWH organization chart is shown in Figure 2.1.1-2.
Figure 2.1.1-2 Organization Chart of DPWH
2-3
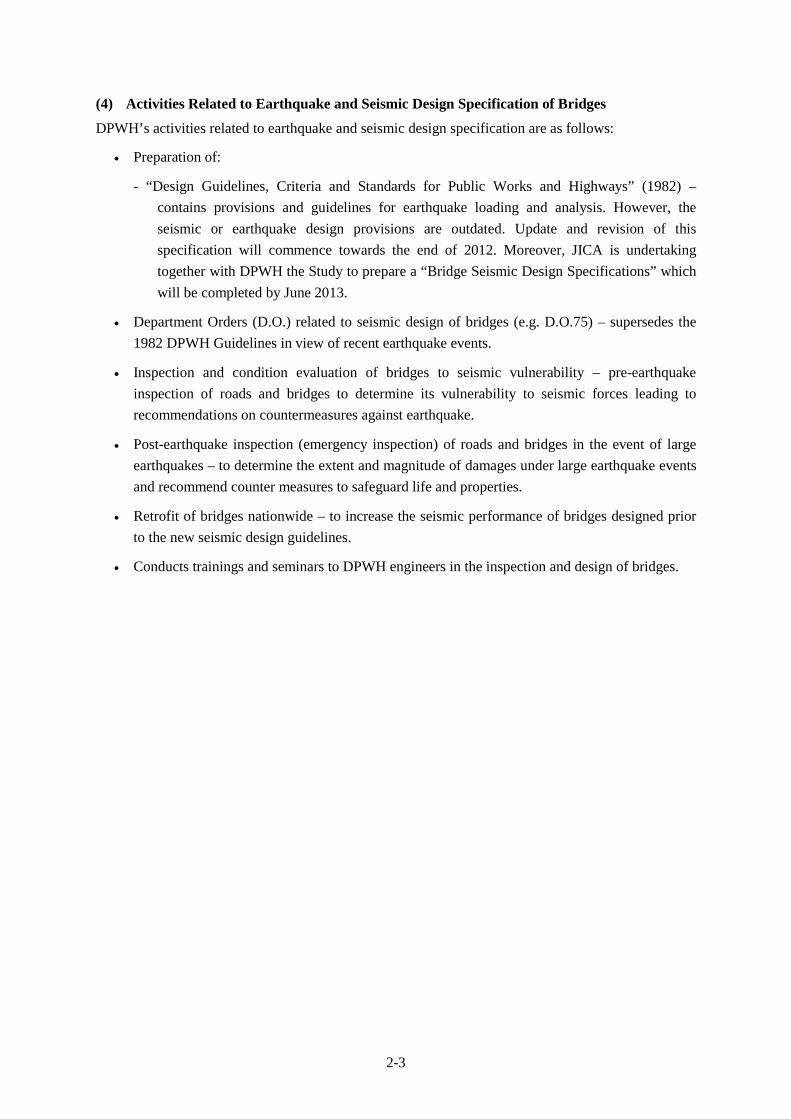
(4) Activities Related to Earthquake and Seismic Design Specification of Bridges
DPWH’s activities related to earthquake and seismic design specification are as follows:
Preparation of:
- “Design Guidelines, Criteria and Standards for Public Works and Highways” (1982) –
contains provisions and guidelines for earthquake loading and analysis. However, the
seismic or earthquake design provisions are outdated. Update and revision of this
specification will commence towards the end of 2012. Moreover, JICA is undertaking
together with DPWH the Study to prepare a “Bridge Seismic Design Specifications” which
will be completed by June 2013.
Department Orders (D.O.) related to seismic design of bridges (e.g. D.O.75) – supersedes the
1982 DPWH Guidelines in view of recent earthquake events.
Inspection and condition evaluation of bridges to seismic vulnerability – pre-earthquake
inspection of roads and bridges to determine its vulnerability to seismic forces leading to
recommendations on countermeasures against earthquake.
Post-earthquake inspection (emergency inspection) of roads and bridges in the event of large
earthquakes – to determine the extent and magnitude of damages under large earthquake events
and recommend counter measures to safeguard life and properties.
Retrofit of bridges nationwide – to increase the seismic performance of bridges designed prior
to the new seismic design guidelines.
Conducts trainings and seminars to DPWH engineers in the inspection and design of bridges.
2-4
2.1.2 Philippine Institute of Volcanology and Seismology (PHIVOLCS)
(1) Background/History
PHIVOLCS is a service institute of the Department of Science and Technology (DOST) that is principally mandated to mitigate disasters that may arise from volcanic eruptions, earthquakes, tsunami and other related geotectonic phenomena. PHIVOLCS history is shown in Figure 2.1.2-1.
Source: PHIVOLCS
Figure 2.1.2-1 PHIVOLCS History
(2) Mandates
As specified in Executive Order No. 128, PHIVOLCS has been mandated to perform the following functions:
Predict the occurrence of volcanic eruptions and earthquakes and their geotectonic phenomena.
Determine how eruptions and earthquakes shall occur and also areas likely to be affected.
Exploit the positive aspects of volcanoes and volcanic terrain in furtherance of the socio-
economic development efforts of the government.
Generate sufficient data for forecasting volcanic eruptions and earthquakes.
Formulate appropriate disaster-preparedness and mitigation plans.
(3) Mission
PHIVOLCS provide timely and quality information and services for warning, disaster preparedness and mitigation. This is done through the development and application of technologies for the monitoring and accurate prediction of and determination of areas prone to volcanic eruptions, earthquakes, tsunamis and other related hazards, and capacity enhancement for comprehensive disaster risk reduction.
1951
1982
1984
1987
2011
Year Description
1952
The violent eruption and resulting casualties and damages from Hibok-hibok Volcano made the nation realize the necessity to seriously monitor and conduct studies on active volcanoes in the country
There was no government agency at that time that is in-charge of this task, the Commission on Volcanology (COMVOL) was created through Republic Act No. 766, primarily to "safeguard life and property against volcanic eruptions and its dangers." COMVOL was initially placed under the Executive Board of the National Research Council and later under the National Science Development Board (NSDB)
Executive Order 784 reorganized the NSDB and its agencies into the National Science and Technology Authority (NSTA). COMVOL was restructured and renamed Philippine Institute of Volcanology (PHIVOLC).
Seismology or the science that deals with earthquakes, was transferred to the Institute from Philippine Atmospheric, Geophysical and Astronomical Services Administration (PAGASA). PHIVOLC was renamed Philippine Institute of Volcanology and Seismology (PHIVOLCS)
The NSTA was structurally and functionally transformed into the Department of Science and Technology was granted its present mandates.
2-5
(4) Organization Chart
PHIVOLCS organization chart is shown in Figure 2.1.2-2.
Figure 2.1.2-2 Organization Chart of PHIVOLCS
(5) Activities Related to Earthquake and Seismic Design Specification of Bridges
PHIVOLCS’s activities related to earthquake and seismic design are as follows:
Monitors volcanic and earthquake activities in the entire Philippines – to gather data on
possible volcanic eruptions and tremors that could affect public and private infrastructures.
Monitors locations and movements of known active faults and identifies new faults.
Identifies epicenters and magnitudes of earthquakes occurring within the Philippine area of
responsibility – plots source/location and magnitude of past earthquakes and the effect
intensities in surrounding areas.
Collects ground motion acceleration records (strong motion records) during earthquakes that
can be utilized in determining seismic design forces.
Collects and analyze other data related to volcanoes and earthquakes in the Philippines.
2.1.3 Association of Structural Engineers of the Philippines (ASEP)
(1) Background/History
ASEP is the recognized organization of Structural Engineers of the Philippines. Established in 1961, ASEP has been in existence for more than 50 solid years. ASEP is known for its publications like the different volumes of the National Structural Code of the Philippines, the approved referral codes of the Philippine National Building Code. (2) Mission/Vision
ASEP is a nationally-recognized association which exists to advance structural engineering practice, uphold high ethical values, and promote national and international professional collaborations with governments, industry and academe. It serves as a respected, authoritative and proactive voice in the development of codes and standards, and shall contribute to nation building by advocating public safety and welfare, and sustainability of the built environment. ASEP envisions itself to be a dynamic internationally-known structural engineering organization, equipped with resources and competent members, dedicated to the improvement of the quality of life.
2-6
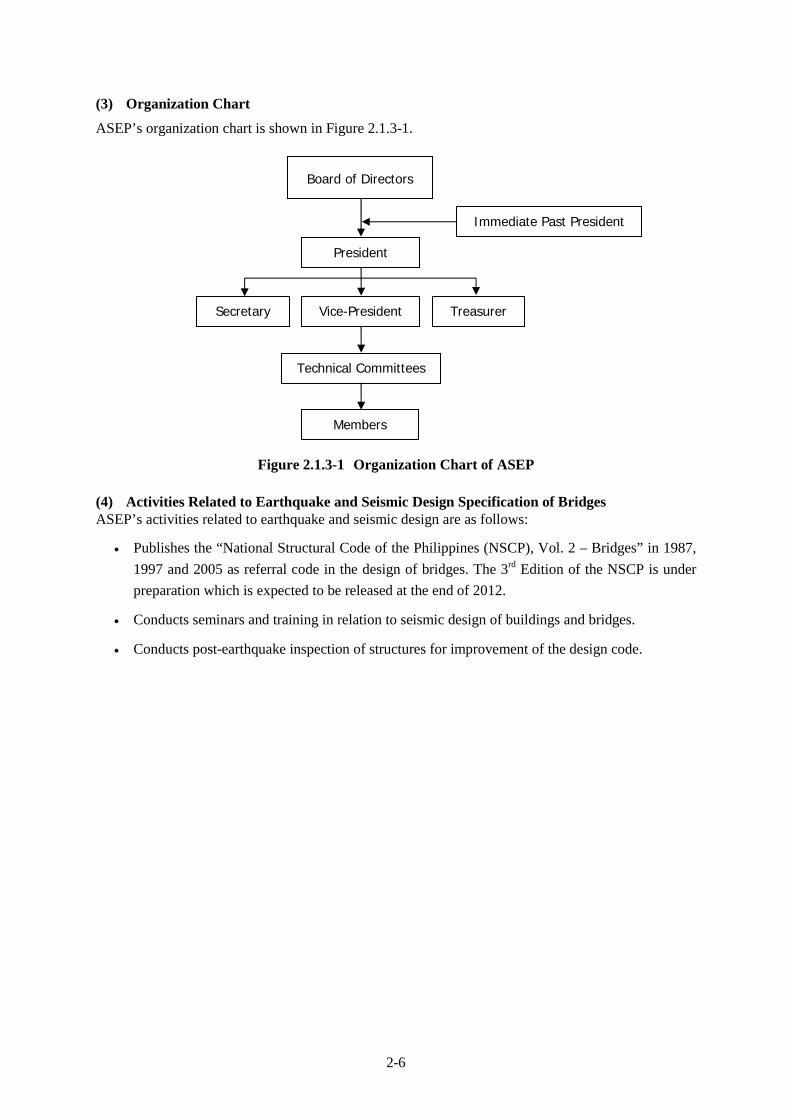
(3) Organization Chart
ASEP’s organization chart is shown in Figure 2.1.3-1.
Figure 2.1.3-1 Organization Chart of ASEP
(4) Activities Related to Earthquake and Seismic Design Specification of Bridges ASEP’s activities related to earthquake and seismic design are as follows:
Publishes the “National Structural Code of the Philippines (NSCP), Vol. 2 – Bridges” in 1987,
1997 and 2005 as referral code in the design of bridges. The 3rd Edition of the NSCP is under
preparation which is expected to be released at the end of 2012.
Conducts seminars and training in relation to seismic design of buildings and bridges.
Conducts post-earthquake inspection of structures for improvement of the design code.
Board of Directors
Immediate Past President
President
Vice-President Secretary Treasurer
Technical Committees
Members
2-7
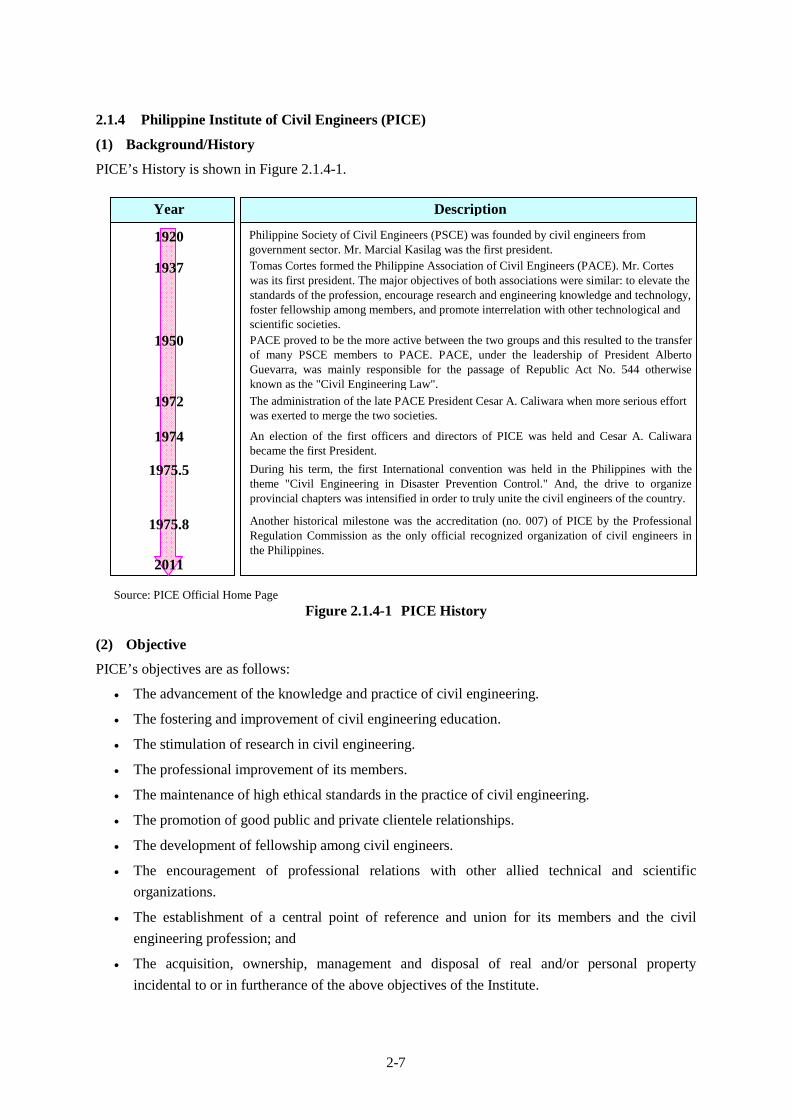
2.1.4 Philippine Institute of Civil Engineers (PICE)
(1) Background/History
PICE’s History is shown in Figure 2.1.4-1.
Source: PICE Official Home Page
Figure 2.1.4-1 PICE History
(2) Objective
PICE’s objectives are as follows:
The advancement of the knowledge and practice of civil engineering.
The fostering and improvement of civil engineering education.
The stimulation of research in civil engineering.
The professional improvement of its members.
The maintenance of high ethical standards in the practice of civil engineering.
The promotion of good public and private clientele relationships.
The development of fellowship among civil engineers.
The encouragement of professional relations with other allied technical and scientific
organizations.
The establishment of a central point of reference and union for its members and the civil
engineering profession; and
The acquisition, ownership, management and disposal of real and/or personal property
incidental to or in furtherance of the above objectives of the Institute.
1937
1972
2011
Year Description
1950
Tomas Cortes formed the Philippine Association of Civil Engineers (PACE). Mr. Cortes was its first president. The major objectives of both associations were similar: to elevate the standards of the profession, encourage research and engineering knowledge and technology, foster fellowship among members, and promote interrelation with other technological and scientific societies.PACE proved to be the more active between the two groups and this resulted to the transfer of many PSCE members to PACE. PACE, under the leadership of President Alberto Guevarra, was mainly responsible for the passage of Republic Act No. 544 otherwise known as the "Civil Engineering Law".
The administration of the late PACE President Cesar A. Caliwara when more serious effort was exerted to merge the two societies.
1974 An election of the first officers and directors of PICE was held and Cesar A. Caliwara became the first President.
1975.5 During his term, the first International convention was held in the Philippines with the theme "Civil Engineering in Disaster Prevention Control." And, the drive to organize provincial chapters was intensified in order to truly unite the civil engineers of the country.
Another historical milestone was the accreditation (no. 007) of PICE by the Professional Regulation Commission as the only official recognized organization of civil engineers in the Philippines.
1975.8
1920 Philippine Society of Civil Engineers (PSCE) was founded by civil engineers from government sector. Mr. Marcial Kasilag was the first president.
2-8
(3) Specialty Divisions
The Institute has initially six (6) Specialty Divisions in the areas of Structural Engineering, Transportation Engineering, Water Engineering, Geotechnical Engineering, Project Management and Construction Engineering, and Environmental and Energy Engineering which shall serve as the technical arms of the Institute at the national level. The Board may create other specialty divisions as the need arises. Each division shall be headed by a Fellow, duly appointed by the Board upon the recommendation of the PICE President. Membership in any of the divisions is open to any regular members or Fellows in good standing. Activities of the Specialty Divisions include:
(a) periodic assessment of the quality of practice,
(b) setting of standards and practices,
(c) preparations of CPE programs for direct implementation and/or implementation by the various
chapters,
(d) administration of technical sessions during national conventions, conferences and seminars,
and
(e) identification of recipients of PRC certificate of Recognition.
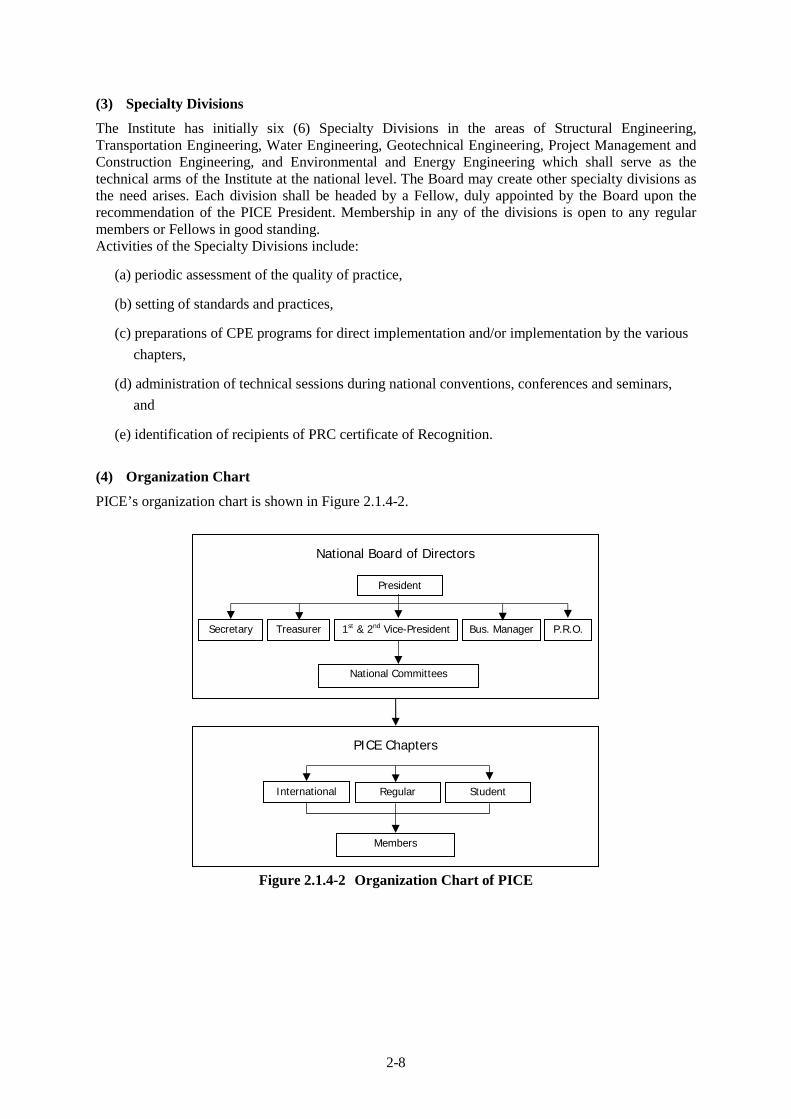
(4) Organization Chart
PICE’s organization chart is shown in Figure 2.1.4-2.
(5) Activities Related to Earthquake and Seismic Design Specification of Bridges
PICE’s activities related to earthquake and seismic design are as follows:
Conducts symposium and conferences related to earthquake and seismic design.
Undertake post-earthquake inspection to determine extent of damages to country’s
infrastructure during large earthquakes.
2.1.5 Geological Society of the Philippines
(1) Background/History
Geological Society of the Philippines History is shown in Figure 2.1.5-1.
Source: PICE Official Home Page
Figure 2.1.5-1 Geological Society of the Philippines History
(2) Objective
Objectives of Geological Society of the Philippines are as follows:
To promote the science of geology and allied earth sciences,
To foster the spirit of scientific research,
To disseminate knowledge concerning the geology of the Philippines and the regions
immediately surrounding it; and
To protect and maintain a high professional and ethical standard in the practice of geology
amongst its members.
1945
1947 - 1953
2011
Year Description
1946
The Geological Society of the Philippines was organized, amidst the ruins of the newly liberated City of Manila when a group of geologists (mostly Americans) attached to the office of the Chief Engineer, GHQ AFPSC, met with a group of Filipino geologists and mining engineers under the chairmanship of Lt. Col. H. G. Scherick.
The first issue of “The Philippine Geologist” the quarterly journal of the Society, came out. This publication filled the need for a local medium for the dissemination of information in various fields of geology, mining, metallurgy in so far as they pertain to the Philippines and the neighboring areas.
Despite its inherent handicaps, much of the success of the publication may be attributed to the tireless efforts of the late Mr. Jose R. Barcelon who edited it.
1959 In order to conform with the latest trend in publication of technical papers or bulletins, the Society decide to change its old mimeographed format into a more presentable and handy form.
1965
1966
Motivated by the strong desire to uphold a high standard of geological profession in the country, the Society sponsored in Congress House Bill 401 and worked continuously for several years until it was finally enacted and passed into law.
the Geological Society of the Philippines was incorporated in order to pursue effectively the different plans and activities designed toward the attainment of its goals.
2-10
2.2 Relationships between Concerned Organizations for Seismic Design Issues on Bridges
2.2.1 DPWH Seismic Design Guidelines Development
The Department of Public Works and Highways (DPWH) is mandated to supervise and control the design and construction of highways, bridges, hydraulic structures and waterworks, buildings and related structures, and port works including mechanical-electrical systems. Considering the role of the DPWH to establish an acceptable level of standards in the design, preparation of plans, specifications and related documents required for infrastructure projects, the Bureau of Design (BOD) is tasked to prepare the design guidelines and criteria as follows:
“Design Guidelines, Criteria and Standards for Public Works and Highways”, 1982 (DPWH Guidelines) based on the AASHTO 1977 edition.
: The purpose of the guidelines, criteria and standards is to provide unity and uniformity of design approach in the preparation of preliminary and detailed engineering for all categories of infrastructure projects. The DPWH Guidelines recommends the use of the J.P. Hollings reports entitled “Earthquake Engineering for the Iligan-Butuan-Cagayan de Oro Road in the Island of Mindanao” and the “Earthquake Engineering for the Manila North Expressway Structures in Luzon, Philippines” to guide in determining the seismic forces and serves as a guide for earthquake design criteria. However, the calculated seismic design forces based on these reports shall not be less than the force produced by 10% (DL + ½LL) – where DL is the dead load and LL is the live load.
Department Order No. 75 (D.O.75) “DPWH Advisory for Seismic Design of Bridges”, 1992
: The deficiencies in the seismic design of structures in the Philippines were seen in the devastating effects and damages to bridges of the “1990 North Luzon Earthquake”. This event prompted the DPWH to issue the Department Order No. 75 (D.O.75) “DPWH Advisory for Seismic Design of Bridges” amending the DPWH Guidelines on seismic design of bridges and requiring the design of bridges to conform with the latest edition of the AASHTO Standard Specifications for Highway Bridges and the Guide Specifications for Seismic Design. The D.O.75 is currently in effect with the seismic design of bridges under the DPWH infrastructure projects following the AASHTO provisions for load factor and allowable stress design using the force-based R-factor approach.
Draft “Design Guidelines, Criteria and Standards for Public Works and Highways – Part IV Bridge Design”, 2004 (DPWH Guidelines) based on the AASHTO 1996, 16th edition.
: Owing to the need to update the seismic design specifications for DPWH bridge projects, the DPWH issued the Draft Design Guidelines in 2004 referring to the 1996 AASHTO seismic design provisions. This Guideline, however, refer to the ASEP seismic zone map of the Philippines for the ground acceleration coefficient. A section on “Guidelines for Seismic Retrofitting” was also added to guide the DPWH seismic retrofit projects. However, this Guideline remains a draft.
2-11
Proposed Revision to the DPWH Design Guidelines, Criteria and Standards under the project “Enhancement of Management and Technical Processes for Engineering Design in the DPWH” (implementation from December 2012)
: Since the existing DPWH Guidelines published in 1982 have not been updated to address the advances in engineering technology, the design standards and techniques contained in the guidelines are outdated and in some cases do not represent the generally accepted design practices. With the objective of enhancing the engineering design process and upgrading the engineering design standards the DPWH will undertake the project “Enhancement of Management and Technical Processes for Engineering Design in the DPWH” under the National Road Improvement and Management Program 2 (NRIMP-2). One component of this project is to develop the new Design Guidelines, Criteria and Standards.
2.2.2 ASEP Bridge Seismic Structural Code Development
On the other hand, the Association of Structural Engineers of the Philippines, Inc. (ASEP), which is a nationally recognized association of structural engineers, is proactive in the development of structural codes in the Philippines to guide engineers in the design of buildings and bridges. ASEP Published the code specifications “National Structural Code of the Philippines (NSCP), Vol. 2 Bridges ASD (Allowable Stress Design) adopting the AASHTO Standard Specifications for Highway Bridges with the following seismic provisions:
First Edition, 1987 : The seismic design provision under this edition uses the equivalent static force method to calculate the design earthquake loading considering the expected peak ground acceleration (A), the soil amplification factor (S) and the normalized acceleration response spectral value for a rock site (R, PGA=1g). However, the force-reduction factor (Z) was not clearly defined making it difficult to assess the ductility demand.
Second Edition, 1997 Reprint Edition, 2005
: The 2nd edition is based on the 1992 edition of the AASHTO Standard Specifications where instead of the equivalent static force method, the structures were analyzed using the elastic response spectrum analysis approach. Some design considerations which differ from the 1st edition includes: the design acceleration spectrum based on the soil type at the bridge site, contribution of the orthogonal horizontal seismic components, use of the response-modification factor, R, to represent column ductility demand and emphasis of column ductile detailing. In this edition, the Philippine seismic zone map is divided into two (2) seismic zones with acceleration coefficient (A) of 0.4 and 0.2. However, the design acceleration response spectrum used is that of the AASHTO spectra. Localizing the seismic zones and design response spectra are necessary in order to generate a more realistic seismic design forces for bridges.
2-12
Third Edition, 2011 Draft
“NSCP Vol.2 Bridge Code and Specifications”
: Following the AASHTO’s shift to the Load and Resistance Factor Design (LRFD), the 3rd edition is an attempt to apply the LRFD method in the code specifications moving away from the conventional load factor and the allowable stress design methods. As opposed to the 2nd edition, the ground acceleration for different soil types are presented as contour maps of seismic acceleration for the entire Philippines. However, the applicability of such map is still under review by ASEP. As mentioned earlier, local engineers are not yet familiar with the LRFD method which will need a transition period for training in the use of the LRFD specifications.
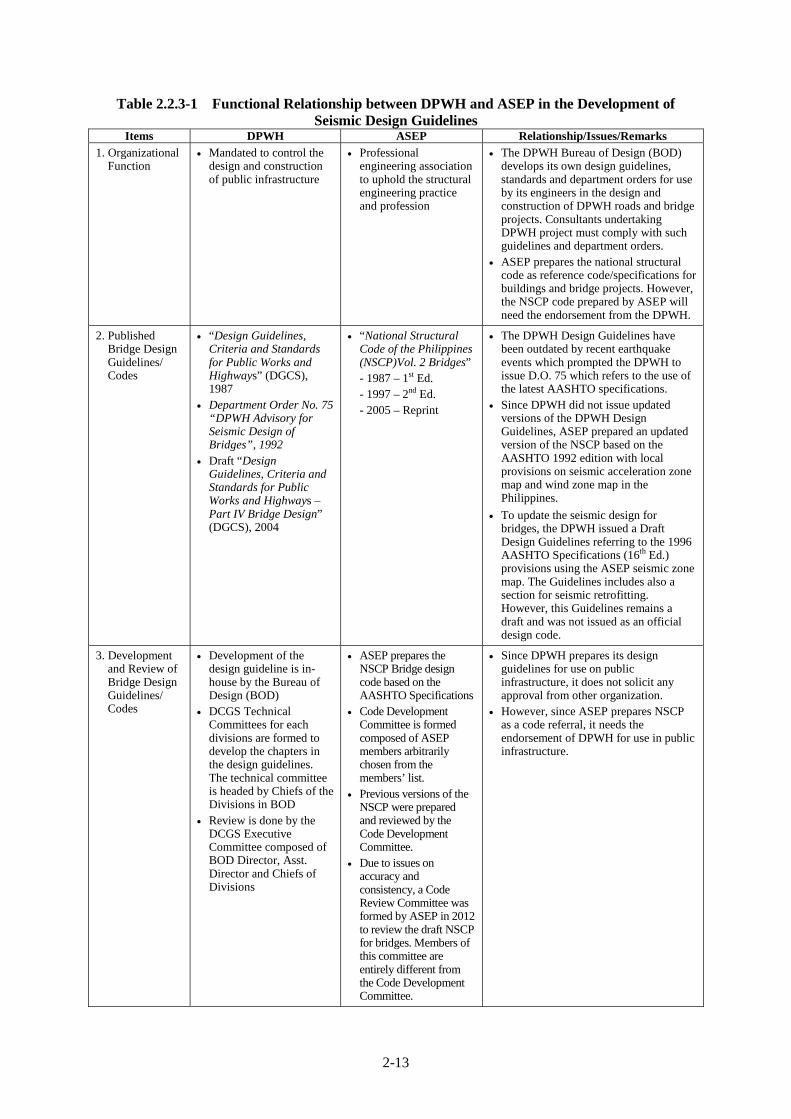
2.2.3 Relationship in Functions between Organizations Concerned for Bridge Seismic Design Issue
Basically, the DPWH and ASEP are the organizations developing the design guidelines and specifications for bridges in the Philippines. The DPWH, being mandated to control the design and construction of roads and bridges, prepares the design guidelines and specifications to have a standard and uniform approach in bridge design and construction. On the other hand, the ASEP, being a professional engineering association, has the mission to uphold the structural engineering profession through standardizing the national structural code for bridge design. Both DPWH Guidelines and ASEP’s NSCP incorporate some provisions for seismic design. However, the NSCP codes prepared by ASEP will need the DPWH endorsement for use in public infrastructures. The functions and relationships between DPWH and ASEP regarding seismic design issues are summarized in Table 2.2.3-1.
2-13
Table 2.2.3-1 Functional Relationship between DPWH and ASEP in the Development of Seismic Design Guidelines
Items DPWH ASEP Relationship/Issues/Remarks
1. Organizational Function
Mandated to control the design and construction of public infrastructure
Professional engineering association to uphold the structural engineering practice and profession
The DPWH Bureau of Design (BOD) develops its own design guidelines, standards and department orders for use by its engineers in the design and construction of DPWH roads and bridge projects. Consultants undertaking DPWH project must comply with such guidelines and department orders.
ASEP prepares the national structural code as reference code/specifications for buildings and bridge projects. However, the NSCP code prepared by ASEP will need the endorsement from the DPWH.
2. Published Bridge Design Guidelines/ Codes
“Design Guidelines, Criteria and Standards for Public Works and Highways” (DGCS), 1987
Department Order No. 75 “DPWH Advisory for Seismic Design of Bridges”, 1992
Draft “Design Guidelines, Criteria and Standards for Public Works and Highways – Part IV Bridge Design” (DGCS), 2004
The DPWH Design Guidelines have been outdated by recent earthquake events which prompted the DPWH to issue D.O. 75 which refers to the use of the latest AASHTO specifications.
Since DPWH did not issue updated versions of the DPWH Design Guidelines, ASEP prepared an updated version of the NSCP based on the AASHTO 1992 edition with local provisions on seismic acceleration zone map and wind zone map in the Philippines.
To update the seismic design for bridges, the DPWH issued a Draft Design Guidelines referring to the 1996 AASHTO Specifications (16th Ed.) provisions using the ASEP seismic zone map. The Guidelines includes also a section for seismic retrofitting. However, this Guidelines remains a draft and was not issued as an official design code.
3. Development and Review of Bridge Design Guidelines/ Codes
Development of the design guideline is in-house by the Bureau of Design (BOD)
DCGS Technical Committees for each divisions are formed to develop the chapters in the design guidelines. The technical committee is headed by Chiefs of the Divisions in BOD
Review is done by the DCGS Executive Committee composed of BOD Director, Asst. Director and Chiefs of Divisions
ASEP prepares the NSCP Bridge design code based on the AASHTO Specifications
Code Development Committee is formed composed of ASEP members arbitrarily chosen from the members’ list.
Previous versions of the NSCP were prepared and reviewed by the Code Development Committee.
Due to issues on accuracy and consistency, a Code Review Committee was formed by ASEP in 2012 to review the draft NSCP for bridges. Members of this committee are entirely different from the Code Development Committee.
Since DPWH prepares its design guidelines for use on public infrastructure, it does not solicit any approval from other organization.
However, since ASEP prepares NSCP as a code referral, it needs the endorsement of DPWH for use in public infrastructure.
2-14
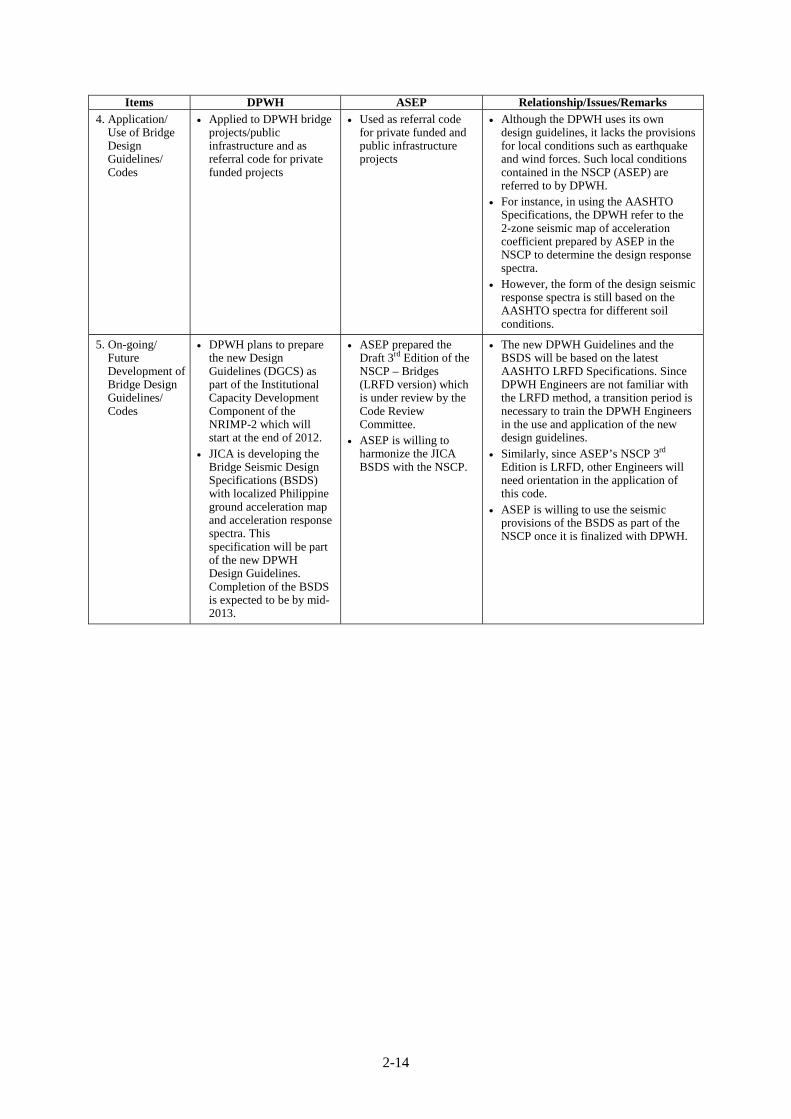
Items DPWH ASEP Relationship/Issues/Remarks
4. Application/ Use of Bridge Design Guidelines/ Codes
Applied to DPWH bridge projects/public infrastructure and as referral code for private funded projects
Used as referral code for private funded and public infrastructure projects
Although the DPWH uses its own design guidelines, it lacks the provisions for local conditions such as earthquake and wind forces. Such local conditions contained in the NSCP (ASEP) are referred to by DPWH.
For instance, in using the AASHTO Specifications, the DPWH refer to the 2-zone seismic map of acceleration coefficient prepared by ASEP in the NSCP to determine the design response spectra.
However, the form of the design seismic response spectra is still based on the AASHTO spectra for different soil conditions.
5. On-going/ Future Development of Bridge Design Guidelines/ Codes
DPWH plans to prepare the new Design Guidelines (DGCS) as part of the Institutional Capacity Development Component of the NRIMP-2 which will start at the end of 2012.
JICA is developing the Bridge Seismic Design Specifications (BSDS) with localized Philippine ground acceleration map and acceleration response spectra. This specification will be part of the new DPWH Design Guidelines. Completion of the BSDS is expected to be by mid-2013.
ASEP prepared the Draft 3rd Edition of the NSCP – Bridges (LRFD version) which is under review by the Code Review Committee.
ASEP is willing to harmonize the JICA BSDS with the NSCP.
The new DPWH Guidelines and the BSDS will be based on the latest AASHTO LRFD Specifications. Since DPWH Engineers are not familiar with the LRFD method, a transition period is necessary to train the DPWH Engineers in the use and application of the new design guidelines.
Similarly, since ASEP’s NSCP 3rd Edition is LRFD, other Engineers will need orientation in the application of this code.
ASEP is willing to use the seismic provisions of the BSDS as part of the NSCP once it is finalized with DPWH.
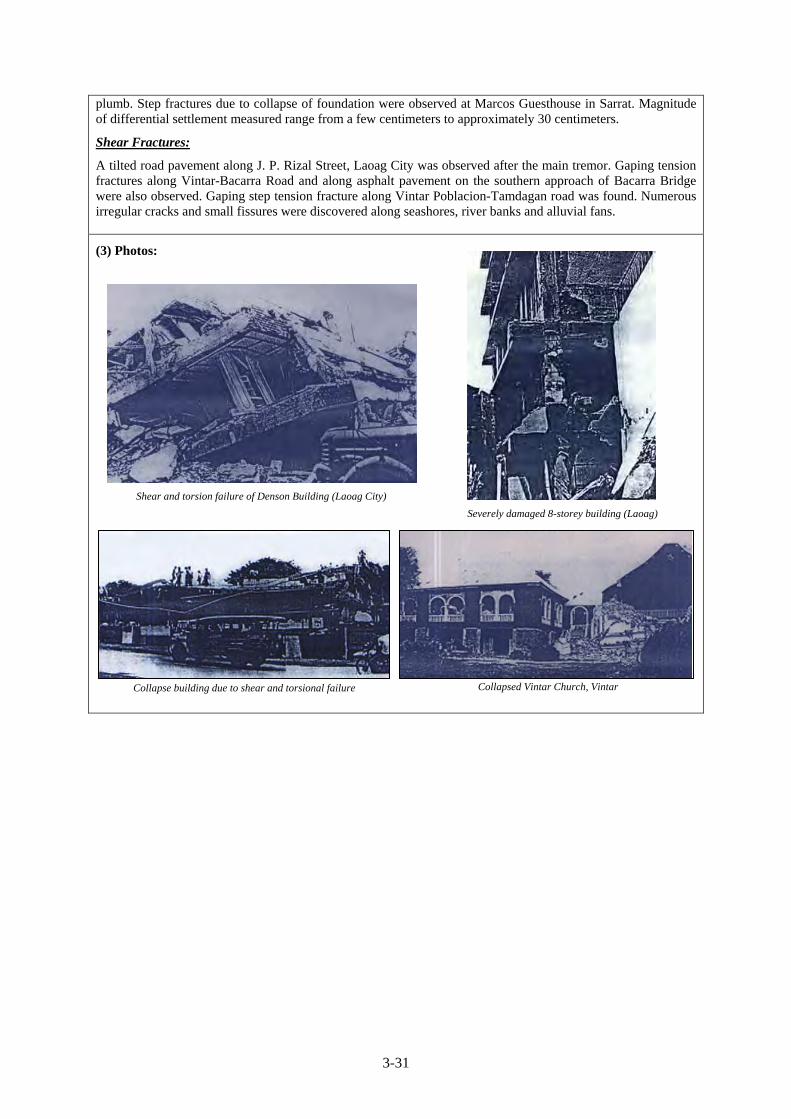
3-1
CHAPTER 3 SEISMIC VULNERABILITIES OF BRIDGES IN THE PHILIPPINES
3.1 Natural Environment Related to Earthquakes
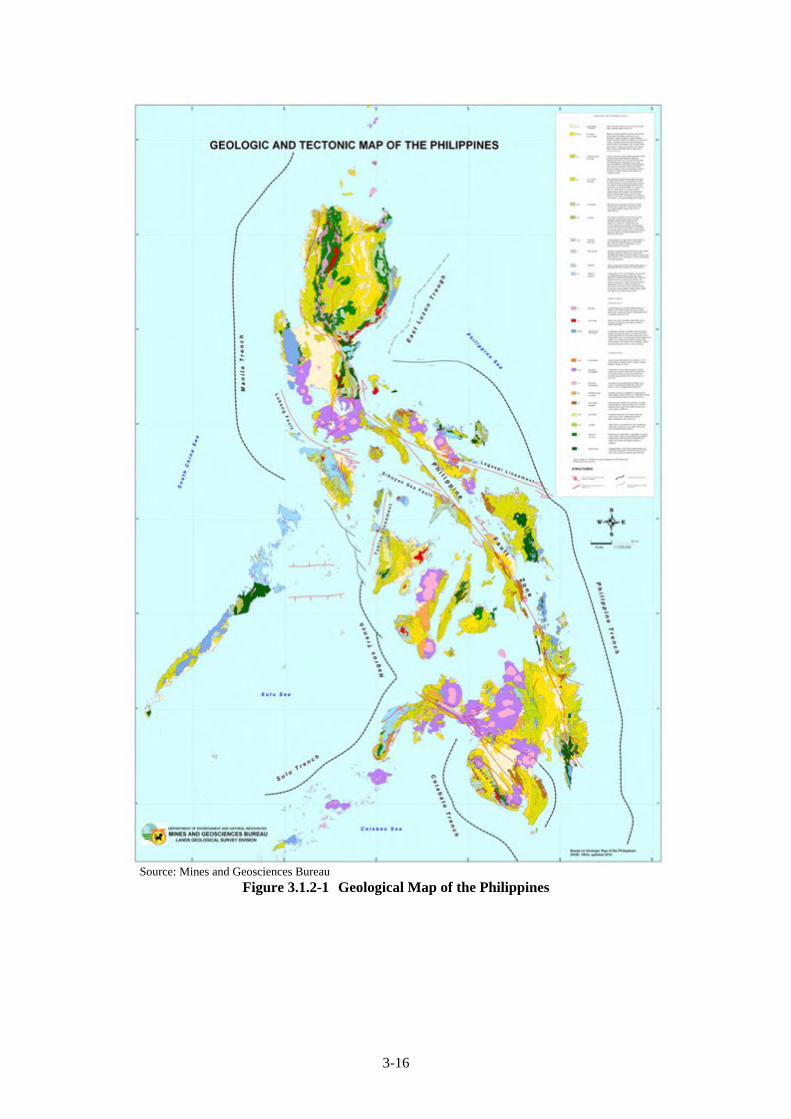
3.1.1 Geographical Characteristics
(1) General (Overview)
The Philippines is an archipelago comprising about 7,100 islands with a total land area of 300,000 km2. The eleven largest islands contain 94% of the total land area. The islands are volcanic in origin, being part of the Pacific Ring of Fire, and are mostly mountainous. The highest point in the country is the peak of Mount Apo in Mindanao, which is 2,954 m above sea level. The islands typically have narrow coastal plains and numerous swift-running streams. There are few large plains or navigable rivers. The longest river is the Cagayan River or Rio Grande de Cagayan in northern Luzon measuring 354 kilometers. The summer monsoon brings heavy rains to most of the archipelago from May to October. Annual average rainfall ranges from as much as 5,000 millimeters in the mountainous east coast section of the country, to less than 1,000 millimeters in some of the sheltered valleys. (2) Active Faults, Volcanoes and Tectonic Plates/Ocean Trenches
1) Tectonic Plates / Ocean Trenches
a) Regional Geodynamic Setting
Philippine tectonics is indeed one of the most active in the world. Tectonic activity such as the devastating Luzon Earthquake of 1990 and the catastrophic 1991 eruption of Mt. Pinatubo is the result of the interaction of three major tectonic plates of the Western Pacific Domain, namely; the Pacific, the Eurasian and the Indo-Australian Plates (Figure 3.1.1-1).
3-2
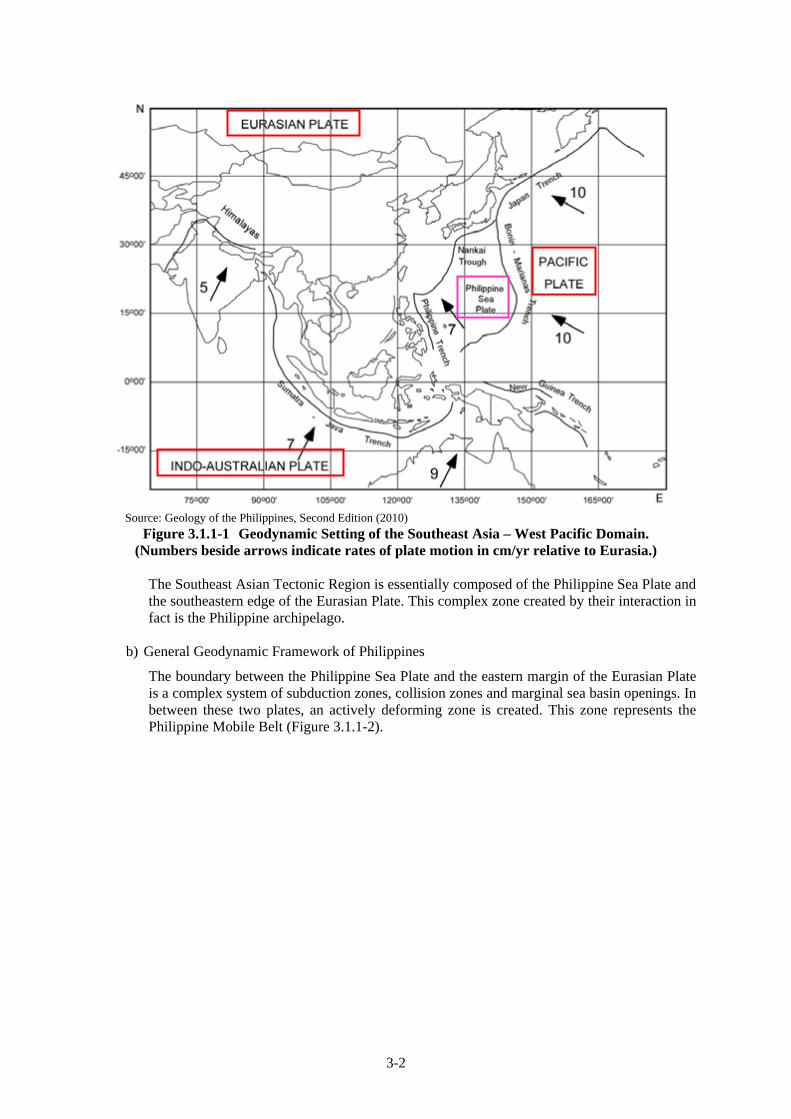
Source: Geology of the Philippines, Second Edition (2010)
Figure 3.1.1-1 Geodynamic Setting of the Southeast Asia – West Pacific Domain. (Numbers beside arrows indicate rates of plate motion in cm/yr relative to Eurasia.)
The Southeast Asian Tectonic Region is essentially composed of the Philippine Sea Plate and the southeastern edge of the Eurasian Plate. This complex zone created by their interaction in fact is the Philippine archipelago.
b) General Geodynamic Framework of Philippines
The boundary between the Philippine Sea Plate and the eastern margin of the Eurasian Plate is a complex system of subduction zones, collision zones and marginal sea basin openings. In between these two plates, an actively deforming zone is created. This zone represents the Philippine Mobile Belt (Figure 3.1.1-2).
3-3
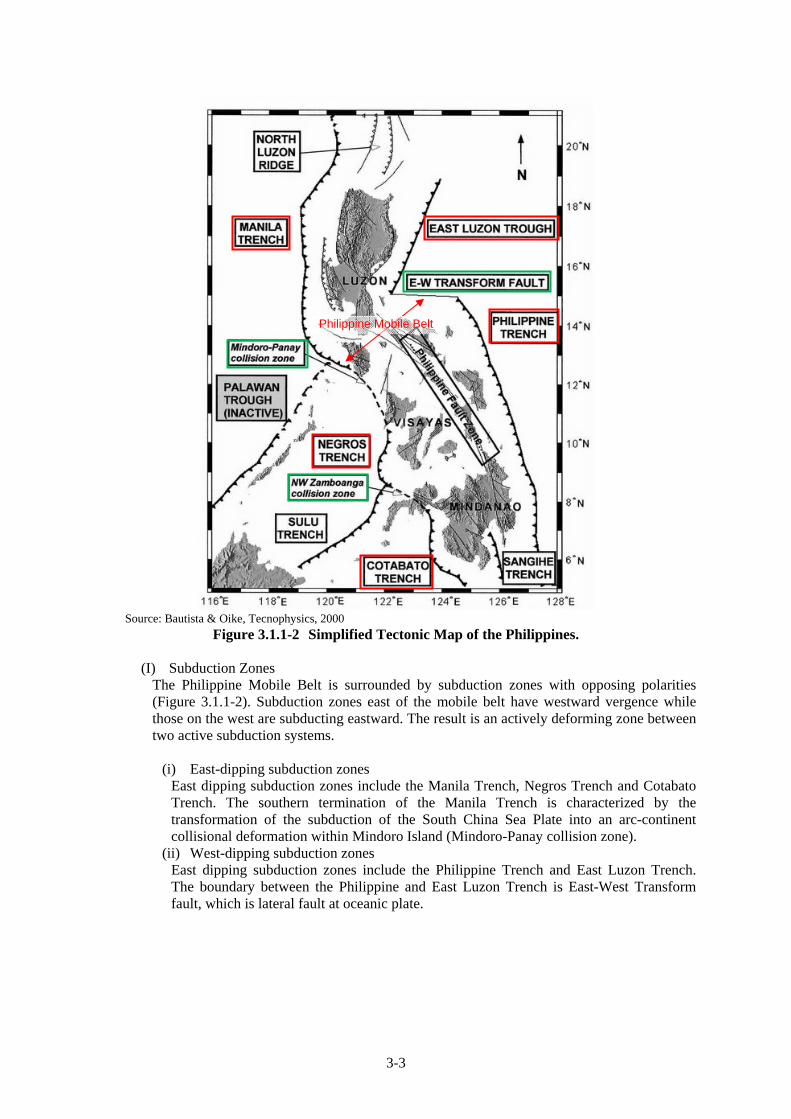
Source: Bautista & Oike, Tecnophysics, 2000
Figure 3.1.1-2 Simplified Tectonic Map of the Philippines.
(I) Subduction Zones The Philippine Mobile Belt is surrounded by subduction zones with opposing polarities (Figure 3.1.1-2). Subduction zones east of the mobile belt have westward vergence while those on the west are subducting eastward. The result is an actively deforming zone between two active subduction systems.
(i) East-dipping subduction zones
East dipping subduction zones include the Manila Trench, Negros Trench and Cotabato Trench. The southern termination of the Manila Trench is characterized by the transformation of the subduction of the South China Sea Plate into an arc-continent collisional deformation within Mindoro Island (Mindoro-Panay collision zone).
(ii) West-dipping subduction zones East dipping subduction zones include the Philippine Trench and East Luzon Trench. The boundary between the Philippine and East Luzon Trench is East-West Transform fault, which is lateral fault at oceanic plate.
Philippine Mobile Belt
3-4
2) Fault
a) Philippine Fault
(I) Extent and Activity Approximately co-axial with the mobile belt is the Philippine Fault, a major strike slip fault that apparently developed partially in response to the kinematic forces from the subduction from the east and west of the mobile belt. The fault has been observed to extend for more than 1,200 km from Luzon to Mindanao.
Source: PHIVOLCS
Figure 3.1.1-3 Distribution of Active Faults and Trenches in the Philippines
3-5
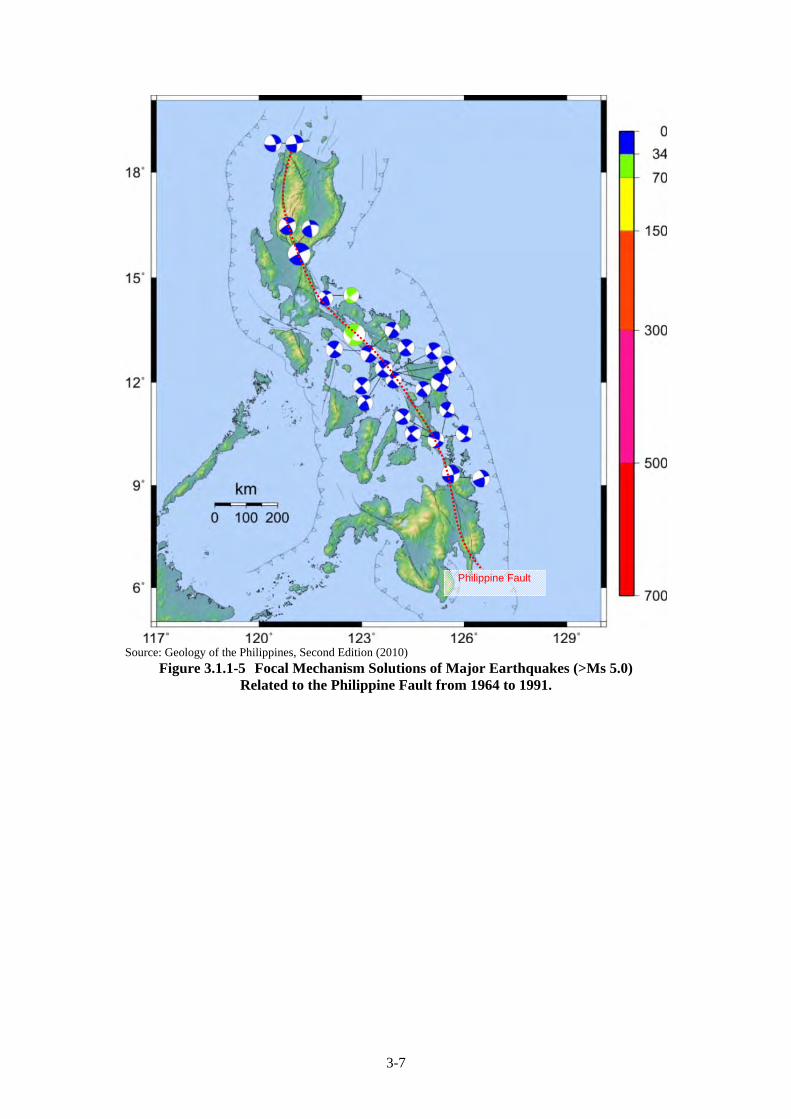
Historically, the most recent activity is the great earthquake of Luzon on July 16, 1990. This Ms 7.8 earthquake was caused by movement of a northern segment of the fault in the vicinity of Cabanatuan. Rupture was observed for over 90 km with left-lateral displacements of as much as 5 m (Ringenbach and others, 1991, 1992; Punongbayan and others, 1990)1,2,3. About two decades earlier on March 17, 1973, southern Luzon was also struck with a magnitude 7.3 earthquake with epicenter located at Ragay Gulf. Rupture observations onshore showed left-lateral displacements of 2 to 3m (Morante and Allen, 1973)4. The following isoseismic map of the Ragay Gulf earthquake shows an elongated contour the long axis of which is parallel to the strike of the fault in the region (Figure 3.1.1-4). This led Garcia and others (1985)5 to offer confirmation that the earthquake was caused by the fault. Cardwell and others (1980)6 also observed that focal mechanism solutions of shallow events along the Philippine Fault show essentially left lateral displacement vectors. Focal mechanism solutions of Philippine Fault related earthquakes that occurred in the past 30 years (reliable instrumental data) and with magnitudes greater than 5 are shown on Figure 3.1.1-5.
1 Ringenbach, J.C., Pinet, N., Muyco, J. et Billedo, E., 1991. Analyse de la rupture associee au seisme du 16 juillet 1990 le long de la faille philippine (Luzon, Philippines). C.R. Acad. Sci., 312 (II), 317-324. 2 Ringenbach, J.C., Pinet, N., Deltail, J. et Stephan, J.F., 1992. Analyse des structures engendrees en regime decrochant par le seisme de Nueva Ecija du 16 juillet 1990, Luzon, Philippines. Bull. Soc. geol. France, 163 (2), 109-123. 3 Punongbayan, R.S., Rimando, R.E., Daligdig, J.A., Besana, G.M. and Daag, A.S., 1990. Ground rupture of the 16 July 1990 Earthquake. In: The third annual geological convention, 5-7 December 1990, UP-NIGS Quezon City, Philippines. Abstracts, p.32. 4 Morante, E. M. and C. R. Allen, Displacement of the Philippine Fault during the Ragay Gulf earthquake of 17 March, 1973, Geol. Soc. Am., 5, 744–745, 1973. 5 Garcia, C.L., Valenzuela, R., Arnold, E.P., Macalinag, T.G., Ambubuyog, G.F., Lance, N .T., Cordeta, J.D., Doniego, A.G. Dabi, A.C., Balce, G.R. and Fr. Su, S.,1985 Series on Seismology: Philippines. In: Arnold, E.P. (ed.), Southeast Asia Association of Seismology and Earthquake Engineering, 4, 792-743. 6 Cardwell, R.K., Isacks, B.L., and Karig, D.E., 1980. The spatial distribution of earthquakes, focal mechanism solutions and subducted lithosphere in the Philippine and northeastern Indonesian Islands. In: Hayes, D.E. (ed.) The Tectonic and Geologic Evolution of Southeast Asian Seas and Islands, Part 1. Am. Geophys. Union Monograph, 23, 1-35.
3-6
Source: Geology of the Philippines, Second Edition (2010)
Figure 3.1.1-4 Intensity Isoseismal Map of the Ms 7.3 Ragay Gulf Earthquake of 1973, Showing the Elongation of the Source: Philippine Fault.
Philippine Fault
3-7
Source: Geology of the Philippines, Second Edition (2010)
Figure 3.1.1-5 Focal Mechanism Solutions of Major Earthquakes (>Ms 5.0) Related to the Philippine Fault from 1964 to 1991.
Philippine Fault
3-8
(II) Extent of Displacement, Slip Rate and Age The more delicate aspects of the problem involve estimates on the fault's extent of displacement, slip rate and age of formation. A bibliographic summary reveals that calculated values for these parameters considerably differ according to author and studied segment (Table 3.1.1-1).
Table 3.1.1-1 Estimate of Extent of Displacement, Slip Rate and Age of the Philippine Fault
Author Region Displacement (km) Time Velocity
(cm/yr)
Gervacio, 1971 Mindanao 28 - -
Acharya, 1980 Philippines - - 6.85
Karig, 1983 Luzon 200 Middle Miocene to Present 1.5
Barcelona, 1986 Leyte 5 - 8 - -
Mitchell,et al., 1986 Luzon 200 Middle Miocene to Present 1.7
Cole, et al., 1989 Leyte 110 Tertiary 0.55
Pinet and Stephan, 1990 Luzon 80 - 100 Upper Miocene to Lower Pliocene
1.3
Pinet, 1990 Luzon, Vigan Aggao Fault 35 4.0 Ma to Present >1.0
Ringenbach, et al., 1992 Luzon, Digdig Fault 17 1.3 Ma to Present >1.3
Source: Geology of the Philippines, Second Edition (2010)
Duquesnoy and others (1994) 7 performed a geodetic survey (GPS) on the Leyte segment of the Philippine Fault between 1991 and 1993 and confirmed an average left-lateral slip rate of 2.48 ± 1.0 cm/yr. In 1997, Duquesnoy recomputed more recent data sets and modified the rate to 3.5 cm/yr. The fault in this segment moves by creep. Aurelio and others (1997, 1998, 1999, and 2000)8,9,10,11,12 and Rangin and others (1999)13 further presented results of GPS measurements of an ASEAN-wide network from 1994 to 1998 confirming a 2 to 3 cm/yr slip rate on the Philippine Fault from Luzon to Mindanao.
7 Duquesnoy, Th., Barrier E., Kasser M., Aurelio M.A., Gaulon R., Punongbayan R.S., R angin C. & the French-Filipino Cooperation Team. 1994. Detection of creep along the Philippine Fault: first results of geodetic measurements in Leyte Island, central Philippines: Geophys. Res. Lett., 21(11), 975-978. 8 Aurelio, M.A., Simons W., Almeda R.L. and the EC-Philippine GPS Team, 1997. Present-day plate motions in the Philippines from GEODYSSEA data. In: Prog. and Abs. Stratigraphy and Tectonic Evolution of Southeast Asia and the South Pacific, Bangkok, Thailand, 19-24 August, 1997, p.360. 9 Aurelio, M.A., Simons, W.F. Almeda, R.L. and the Philippine GPS Team, 1998a. Present-day plate motions in the Philippines from GEODYSSEA GPS Data. In: The GEODYnamics of S and SE Asia (GEODYSSEA) Project Eds. Wilson, P. and Michel, G. Scientific Technical Report STR98/14 Potsdam, Germany, December 1998. 10 Aurelio, M.A., Walpersdorf, A., Simons W., Almeda R.L. and the EC-Philippine GPS Team, 1998b. Displacement rates and block rotation in and around the Philippines -results from GEODYSSEA data Part II. In: Prog. and Abs. GEOSEA 98 – Ninth Regional Congress on Geology, Mineral and Energy Resources of Southeast Asia. Kuala Lumpur, Malaysia, 17-19 August, 1998, p.238. 11 Aurelio, M.A., and Almeda R.L., 1999. Active deformation and stress state in and around the Philippines: present-day crustal motion from GEODYSSEA. In: Prog. and Abs. GPS 99 – The international Symposium on GPS. Tsukuba, Japan, 18-22 October 1999. 12 Aurelio, M., Le Pichon, X., Loevenbruck, A., Pubellier, M., Vigny, C., Becker, M., Tran, D.T., and Quebral, R., 2000. Quantifying block rotation along active strike-slip boundaries in Visayas and Mindanao (Philippines) by GPS: GEODYSSEA Part III. In: The 13th Annual Geological Convention, Abstracts. 6-8 December 2000, Pasig City, Philippines. 13 Rangin, C., Le Pichon, X., Mazzotti, S., Pubellier, M., Chamot-Rooke, N., Aurelio, M., Walpersdorf, A. and Quebral, C., 1999. Plate convergences measured by GPS across the Sundaland/Philippine Sea Plate deformed boundary: the Philippines and eastern Indonesia. Geophys. J. Int., 139, 296-316.
3-9
(III) Structural Regime Variations along the Philippine Fault: the three Segments As it traverses the whole length of the archipelago, the Philippine Fault presents at least three varying structural regimes. Consequently, three major segments can be distinguished according to structural character and data availability.
- Northern Segment: NW Luzon to Lamon Bay - Central Segment: Bondoc Peninsula to Leyte - Southern Segment: Mindanao and the Moluccas
(IV) Mechanism
Fitch (1972) 14 suggested that the Philippine Fault functions in a shear partitioning environment. In this setting, the fault accommodates a component of the oblique convergence between the Philippine Sea Plate and the Philippine archipelago (Figure 3.1.1-6).
Source: Geology of the Philippines, Second Edition (2010)
Figure 3.1.1-6 Diagram Explaining the Concept of Shear Partitioning
b) Other Active Faults
Other active faults can be identified in addition to the Philippine Fault system and its branches (Figure 3.1.1-3).
14 Fitch, T.J., 1972. Plate convergence, transcurrent faults, and internal deformation adjacent to Southeast Asia and the Western Pacific. J. Geophys. Res., 77 (23), 44 32-4460.
3-10
c) Present-Day Plate Motions in and around the Philippines
Global Positioning System (GPS) data gathered every two years since 1994 over a 42-station network distributed in Southeast Asia under the acronym GEODYSSEA to mean GEODYnamics of South and South East Asia have allowed the analysis of the present-day motion of tectonic blocks in and around the Philippines. Motion vectors in the archipelago and vicinity are in the order of a few to several cm/yr. When microcontinental Palawan is held fixed, the slowest movements can be detected in Zamboanga at less than 2 ± 0.15 cm/yr westwards (Figure 3.1.1-7). Virac Island moves the fastest at over 7 ± 0.17 cm/yr northwestwards.
Source: Geology of the Philippines, Second Edition (2010)
Figure 3.1.1-7 Motion Vectors in the Philippines Deduced from GPS Measurements.
(3) Tsunami Potential Areas
The coastlines of the Philippines total to about 34,000 km. In this regard, significant tsunami disasters caused by earthquakes are anticipated. The tsunamis which occurred around Mindanao Island killed 41 people in 1994 and seven people in 2002. Table 3.1.1-2 shows records of main tsunami occurrences in the Philippines.
3-11
Table 3.1.1-2 Main Tsunami Disaster History in the Philippines Date Location Comment Source
1976/8/16 Moro Gulf Tsunami occurred. 3,700 people died, 8,000 people were injured, affected 12,000 households. PHP 0.276 billion worth of damage.
1
1994/11/14 Mindoro Tsunami occurred. 41 people died, 430 people were injured, affected 22,452 households. PHP 0.515 billion worth of damage.
1
2002/3/5 Mindanao Tsunami occurred. 7 people died. PHP 1.714 billion worth of damage 2
Source: (1) PHIVOLCS, (2) National Oceanic and Atmospheric Administration (NOAA), National Geophysical Data Center (NGDC)
PHIVOLCS conducted tsunami simulations in the “Tsunami Mitigation Program” under the Department of Science and Technology-Grant-In-Aid Program (DOST-GIA) from 2006 to 2007. Based on the simulations, tsunami hazard maps with scales of 1:100,000 to 1:50,000 in the three islands of Luzon, Mindanao, and Visayas were developed (Figure 3.1.1-8).
Source: PHIVOLCS
Figure 3.1.1-8 Tsunami Hazards Map
3-12
3.1.2 Geological Characteristics
Geological Characteristics of Philippines are summarized based on “Geology of Philippines” as below. (1) General (Overview)
The Philippine archipelago can be divided into two geologic zones that are the Philippine Mobile Belt and the Palawan-Mindro microcontinent. Those two geologic zones are composed of different types of lithologic units that can be classified into four groups: 1) metamorphic rocks; 2) ophiolites and ophiolitic rock; 3) magmatic rocks and active volcanic arcs; and 4) sedimentary basins.
1) Metamorphic Rocks
Metamorphic rocks present in the Philippines can be divided into two categories: 1) pre-Cretaceous metamorphic rocks of continental origin; and 2) Cretaceous metamorphic rocks of insular arc affinity. Pre-Cretaceous metamorphic rocks are located in North Palawan, Mindoro, Panay and neighboring islands. This metamorphic group is characterized by the abundance of silica (continental provenance). Cretaceous metamorphic rocks are distributed sporadically within the Philippine archipelago. They are essentially basic to ultra-basic in character.
2) Ophiolites and Ophiolitic Rocks
Ophiolites and ophiolitic rocks in the Philippines are widespread in the whole archipelago and usually occurring together with the pre-Tertiary metamorphic rocks. These rocks represent basement on which magmatic arcs were developed.
3) Magmatic Arcs
The oldest known magmatic rocks in the Philippines are found in Cebu, and Cretaceous-Paleogene intrusions are sporadically distributed within the archipelago. Oligo-Miocene magmatic belts are recognized through the whole archipelago in the Philippines.
4) Active Volcanic Arcs
The distribution of Pliocene-Holocene volcanoes generally reflects the activity along subduction zones presently bounding the archipelago. Five distinct volcanic belts can be defined: 1) the Luzon Volcanic Arc; 2) the East-Philippine Volcanic Arc; 3) the Negros-Panay Arc; 4) the Sulu-Zamboanga Arc; and 5) Cotabato Arc.
3-13
Table 3.1.2-1 List of Active and Potentially Active Volcanoes of the Philippines Activitiy Name of Volcano Latitude
(N)Longitude(E)
Region or Provinces
Active Babuyan Claro 19.525 121.950 Cagayan (Babuyan Is.) Active Banahaw Volcano Complex 14.067 121.483 Laguna, Quezon Active Biliran(Suiro) 11.650 121.467 Biliran Province Active Bud Dajo 5.983 121.217 Sulu Active Bulusan 12.770 124.050 Sorsogon Active Cabalian 10.281 125.214 Southern Leyte Active Cagua 18.222 122.123 Cagayan Active Camiguin De Babuyanes 18.833 121.860 Cagayan (Babuyan Is.) Active Didicas 19.077 122.202 Cagayan (Babuyan Is.) Active Hibok-hibok 9.203 124.675 Camiguin Active Iraya 20.483 122.017 Batanes Active Iriga 13.457 123.457 Camarines Sur Active Kanlaon 10.412 123.132 Negros Oriental/ Occidental Active Leonard Valley Kniaseff 7.382 126.047 Compostela Active Makaturing 7.642 124.342 Lanao Del Sur Active Matutum 6.367 125.367 Cotabato Active Mayon 13.257 123.685 Albay Active Musuan 7.867 125.073 Bukidnon Active Parker 6.113 124.892 Cotabato
Active Pinatubo 15.133 120.350 Boundaries of Pampanga, Tarlac and Zambales
Active Ragang 7.692 124.505 Cotabato Active Smith 19.540 121.917 Cagayan (Babuyan Is.) Active Taal 14.017 120.985 Batangas Potentially Apo 6.989 125.269 Davao Del Sur and North Cotabato Potentially Balut 5.392 125.375 Davao Del Sur Potentially Cancajanag 11.067 124.778 Leyte Potentially Corregidor 14.400 120.567 Bataan Potentially Cuernos De Negros (Magasu, Magaso) 9.250 123.167 Negros Oriental Potentially Dakut 5.733 120.933 Sulu Potentially Gorra 5.557 120.817 Sulu Potentially Isarog 13.658 123.375 Camarines Sur Potentially Kalatungan 7.953 124.802 Bukidnon Potentially Labo 14.017 122.792 Camarines Sur Potentially Lapac (Lapak) 5.517 120.760 Sulu Potentially Mahagnao 10.896 124.867 Leyte Potentially Malinao (buhi, Takit) 13.417 123.608 Albay Potentially Malindig (Marlanga) 13.250 122.000 Marinduque Potentially Mandalagan 10.650 123.250 Negros Occidental Potentially Maripipi 11.800 124.330 Biliran Potentially Mariveles 14.517 120.467 Bataan Potentially Natib 14.717 120.400 Bataan Potentially Negron 15.083 120.333 Zambales Potentially Parang 5.817 121.167 Sulu Potentially Parangan 5.975 121.400 Sulu Potentially Pitogo 5.905 121.300 Sulu Potentially San Cristobal 14.067 121.433 Laguna, Quezon and San Pablo City Potentially Silay 10.775 123.233 Negros Occidental Potentially Sinumaan 6.033 121.100 Sulu Potentially Tukay 5.933 120.950 Sulu Potentially Tumatangas 5.998 120.967 Sulu Potentially Vulcan (Camiguin) 9.215 124.647 Camiguin
Source: PHIVOLCS
3-14
5) Sedimentary Basins
a) Ilocos-Central Luzon Basin
The northern part of the basin (Ilocos) is filled with Upper Oligocene - Middle Miocene marine detrital sediments (mostly conglomerates and sandstones) derived from the Luzon Central Cordillera Range located to the east. These sediments are overlain by an Upper Miocene - Pliocene sedimentary sequence dominated by sandstones, shales and shallow water carbonates and tuffaceous deposits. On the southern part, the eastern and western segments of the Central Luzon Basin are stratigraphically distinguished from each other. Sediments on the east are characterized by a significant amount of volcanic sources (volcanic sandstones and shales, and tuffs) and by a shallow marine depositional environment (carbonates). To the west, Neogene sediments dominated by Middle Miocene turbidites overlie directly the Eocene ophiolites of Zambales.
b) Cagayan Valley Basin
The Cagayan Valley Basin is filled with sedimentary formations, basically marine in nature, are intruded by Oligocene - Miocene plutonic rocks in portion of its segments. The Late Oligocene - Early Miocene interval is represented by platform limestones and coarse-grained clastic deposits (conglomerates) while the Middle Miocene is characterized by turbiditic sequences with intercalated fine layers of coal-bearing carbonates. Upper Miocene - Pliocene deposits are essentially shallow marine, upgrading into deltaic then fluviatile beds.
c) Southern Luzon - Bicol Basin
The lower layers of the basin are composed mainly of Upper Oligocene - Lower Miocene platform limestones and highly deformed Middle Miocene turbidites. Plio-Pleistocene sequences are dominated by shallow water fine-grained deposits and reefal limestones.
d) Mindoro Basin
The basin is developed over arc volcanic sequences of tuffs, tuffities and volcanic conglomerates. The sedimentary fill is composed of lower-Miocene limestone overlain by a Lower Miocene - early Upper Miocene volcaniclastic sequence becoming more carbonaceous towards the top. The Upper Miocene-Recent sedimentary cover envelops both the basin as well as the continental platform.
e) Iloilo Basin
The basin is filled with Oligocene to Recent deposits. The Lower Oligocene - Miocene layers are uplifted and highly deformed, while the Pliocene-Quaternary deposits are generally undeformed.
f) Visayan Sea Basin
The layers of the basin are dominated by Middle to Upper Oligocene platform limestones and clastic sequences, while the Plio-Pleistocene layers are characterized by a succession of volcaniclastics and carbonates, separated by at least three major unconformities. The youngest major unconformity separates Pleistocene formations from Upper Miocene - Lower Pliocene units. The second major unconformity, well developed in the entire basin, is end of Middle Miocene.
3-15
g) Samar Basin
Upper Oligocene - Lower Miocene volcaniclastics unconformably overlie a mixed basement of ophiolites and metamorphic rocks. The Middle Miocene interval is represented by a widespread deformed limestone formation which presently covers almost 25% of Samar Island. This limestone body is unconformably overlain by Upper Miocene - Pleistocene shales and carbonates.
h) Agusan - Davao Basin
It is formed over a mixed basement composed of ophiolitic and metamorphic rocks of unknown age, of pre-Oligocene arcs and Eocene limestones. The sedimentary fill is composed of Upper Oligocene - Lower Miocene limestones, followed by alternating beds of conglomerates, sandstones, shales and sometimes thin Middle Miocene carbonaceous beds. The Pliocene - Quaternary cover is dominated by shallow marine deposits upgrading into fluviatile facies.
i) Cotabato Basin
The Upper Miocene - Pleistocene units are more exposed than Agusan-Davao Basin. This sequence of the basin is composed mainly of relatively undeformed shallow marine deposits dominated by conglomerates, sandstones and shales, grading into deltaic and fluviatile deposits towards the south. The more deformed lower sequence is principally composed of volcaniclastics with minor intercalations of limestones.
3-16
Source: Mines and Geosciences Bureau
Figure 3.1.2-1 Geological Map of the Philippines
3-17
Table 3.1.2-2 Summary of Stratigraphic Column for the Philippines SEDIMENTARY AND METAMORPHIC ROCKS Qh Quaternary
(Holocene) Alluvium, fluviatile, lacustrine, paludal, and beach deposits; raised coral reefs, atolls, and beachrock
N3+Q1 Pliocene – Pleistocene
Marine and terrestrial sediments. Associated with extensive reef limestone in the western coastal area of Luzon, Bicol region, Visayas, and Mindanao; with pyroclastics in western and southern Central Luzon Basin and in northern Bicol Lowland. Predominantly marl and reworked tuff in places. Sporadic terrace gravel deposits in some coastal and fluvial tracts. Plateau red earths and/or laterites in some elevated flat land surfaces. Deformation limited to gentle warping and vertical dislocation.
N2 Upper Miocene – Pliocene
Largely coarse marine clastics overlain by extensive, locally transgressive pyroclastics (chiefly tuff, tuffities) and tuffaceous sedimentary rocks. Associated with calcarenite and/or silty limestone in some parts of Luzon, central Visayas, and Mindanao. Reef limestone lenses intercalated with dacite and andesite flows in Zamboanga (western Mindanao). Chiefly sandstones and limestones in Palawan, Local bog iron; laterite deposits in some elevated near-peneplaned surfaces.
N1 Oligocene – Miocene
Thick, extensive, transgressive mixed shelf marine deposits, largely wackes, shales, and reef limestone. Underlain by conglomerate and/or associated with paralic coal measures in places. Sometimes associated with basic to intermediate flows and pyroclastics within Luzon, Visayas, and Mindanao. Largely arkosic and quartzose clastics in southern Mindoro, with associated carbonate platform in Palawan. Generally well indurated. Folded and locally intruded by quartz diorite. The epidermal cover of many folded mountains. In some places probably includes Oligocene.
Pg3 Oligocene Minor limestone and/or wackes and shales. Generally associated with andesite flows. Limestone remnants in Luzon central Cordillera, Cagayan Valley, Cebu and Central Mindanao.
Pg2 Eocene Thick, extensive, transgressive mixed shelf and deeper water marine deposits, largely wackes and shales associated with minor basal conglomerate, reef limestone, and calcarenite, sometimes with dacitic and/or andesitic flows and pyroclastics; with intertongues of paralic coal measures in Catanduanes. Largely arkosic and quartzose clastics in southern Mindoro, with associated limestone in Palawan. Generally moderately folded and intruded by quartz diorite.
KPg Undifferentiated Largely greywacke and metamorphosed shale interbedded and/or intercalated with spilitic, basic and intermediate flows, and/or pyroclastics. Undifferentiated as to age. Probably Cretaceous or Paleogene.
K Cretaceous Extensive, transgressive greywacke-shale sequence intercalated with spilites. Associated with tuffaceous clastics in Rizal. Limestone in Bicol Region (Caramoan Peninsula, Cagraray Island, Albay), Marinduque, and Central Cebu. Low grade metamorphism up to greenschist facies.
J Jurassic Arkose, subgraywacke, mudstone in Mindoro (Mansalay Fm.). Associated with chert in Busuanga and northern Palawan.
PJ Permian – Jurassic
Undifferentiated gneiss, quartzofeldspathic and mica schist, and phyllites-slates frequently associated with marble, limestone, and arenite. Permian-Triassic cherts, marbles and limestone in Palawan, Permian gneiss in Mindoro. The Permian – Jurassic units in northern Palawan are considered olistostromes or tectono-succession of exotic blocks. Broadly folded; some narrow zones of close folding broken by upthrusts. Prevailing foliation in schists generally parallel, some oblique and/or perpendicular to bedding.
3-18
Table 3.1.2-3 Summary of Igneous and Intrusive Rocks for the Philippines IGNEOUS ROCKS INTRUSIVE ROCKS NI Neogene Largely intra-Miocene quartz diorite. Mostly batholiths and stocks, some
laccoliths; also sills, dikes, plugs and other minor bodies. Includes granodiorite and diorite porphyry facies and late Miocene – Pliocene dacite.
PGI Paleogene Mostly quartz diorite as batholiths (Northern Sierra Madre) and stocks. Late Oligocene monzonites and syenites in Northern Sierra Madre.
KEoph Cretaceous – Paleogene
Undifferentiated ophiolites and ophiolitic rocks. Predominantly peridotite associated with gabbro and/or diabase dikes, pillow basalts. Generally thrusted or upfaulted into Cenozoic and older rock formations. Forms a Cretaceous belt in eastern Philippines from northern Luzon to Bicol region, Samar, Leyte, Dinagat Island, Pujada Peninsula. Also in Antique, Bohol, Zamboanga, Palawan. Cretaceous – Paleogene in Mindoro, Eocene in Zambles.
Table 3.1.2-4 Summary of Volcanic Rocks for the Philippines
VOLCANIC ROCKS QAV Quaternary Active volcanoes (with eruptions and/or activity since 1616) such as
Didicas, Taal, Mayon, Bulusan, Canlaon, Camiguin, Makaturin, Ragang, and Calayo.
QVP Pliocene – Quaternary
Volcanic plain or volcanic piedmont deposits. Chiefly pyroclastics and/or volcanic debris at foot of volcanoes. Plateau basalt in Pagadian and Lanao regions, Mindanao; associated with pyroclastics north and east of Laguna de Bay, Luzon.
QV Pleistocene – Quaternary
Non-active cones (generally pyroxene andesite); also dacitic and/or andesitic plugs. Basaltic dikes in Binga, Mt. Province, Luzon and Misamis Oriental, Mindanao.
N2 Upper Miocene – Pliocene
Principally dacite and/or andesite flows, generally with pyroclastic deposits. Sporadic in north Luzon. Locally thick and associated with reef limestone lenses in southern Zamboanga.
N1 Oligocene – Miocene
Mostly submarine andesite and/or basalt flows. Intercalated with pyroclastics and clastic sedimentary rocks and/or reef limestone lenses. Largely confined within the axial zones of Luzon, Visayas, and Mindanao.
PG2 Oligocene Essentially andesite flows. Often with pyroclastics and chert of volcanic origin. Undifferentiated from early Miocene sedimentary rocks in some areas.
PG1 Eocene Limited dacite and andesite flows and dikes, generally intercalated with and/or intrude Eocene clastics. Included with Eocene sedimentary rocks in this map.
UV Undifferentiated Metamorphosed submarine flows, largely spilites and basalts, some andesites. Confined to structural highs and/or principal mountain ranges. Often designated in early literature as “Metavolcanics”. Most units probably Cretaceous or Paleogene.
K Cretaceous Essentially spilitic and basic flows. Usually intercalated with graywackes. Transgressive on “basement” rocks. Some are included with Cretaceous sedimentary rocks in this map.
Source: “Geologic and Tectonic Map of the Philippines”, Department of Environment and Natural Resources, MINES AND GEOSCIENCE BUREAU, LANDS GEOLOGICAL SURVEY DIVISION, Third Edition 2010
3-19
(2) Liquefaction Potential Areas
Liquefaction potential areas in Philippines are shown as a thematic map, “Liquefaction Susceptibility Map” (Figure 3.1.2-2), prepared by PHIVOLCS. Based on this map series, liquefaction potential areas are supposed to be distributed in areas with the following topographic/geographic characters. 1) Most cases of liquefaction susceptibility areas are distributed in terrain with relatively young
deposits of, poorly consolidated alluvial soils with a high water table (alluvium plains). 2) These sites are identifiable from a basic understanding of the geomorphology. Typical areas
having liquefaction susceptibility include river meander, point bar deposits, lake shore delta deposits, estuarine deposits, beach ridge, backwater deposits, abandoned river channels, former pond, marsh and swamp, and reclamation fills.
PHIVOCLS prepared a series of the liquefaction susceptibility maps for each region, and details can be seen on those regional maps. However practically to assess liquefaction potential at each bridge site has to be studied based on data that are obtained from field geological investigation (boring with SPT) and laboratory tests. The liquefaction potential at each site is shown in CHAPTER 16 of this interim report.
3-20
Source: PHIVOLCS
Figure 3.1.2-2 Liquefaction Susceptibility Map of the Philippines
3-21
3.1.3 Hydrological Characteristics
The climate of the Philippines is tropical and maritime. It is characterized by relatively high temperature, high humidity and abundant rainfall. Based on the average of all weather stations in the Philippines, excluding Baguio, the mean annual temperature is 26.6℃. The coolest months fall in January with a mean temperature of 25.5℃ while the warmest month occurs in May with a mean temperature of 28.3℃. Latitude is an insignificant factor in the variation of temperature while altitude shows greater contrast in temperature. There is essentially no difference in the mean annual temperature of places in Luzon, Visayas or Mindanao measured at or near sea level. Due to the high temperature and the surrounding bodies of water, the Philippines has a high relative humidity. The average monthly relative humidity varies between 71 % in March and 85 % in September.
The Philippines is located southeast of the big Asian continent, with an almost north to south
orientation (from 4’23” N to 21.25’N latitude and from 117’ E to127’ E). Due to its geographic
location, the Philippines is influenced by weather-producing systems which occur at various space
and time scales. Since the variability of rainfall is more pronounced compared with the variability in
temperature, the climate is classified according to the rainfall distribution. As shown in ****, the
various areas in the Philippines are thus characterized by 4 types of climates, which are based on dry
and wet seasons induced by minimum or maximum rain periods, according to the modified Corona’s
Climate Classification:
Type I: Two pronounced seasons, dry from November to April, wet during the rest of the year
Type:II: No dry season with a very pronounced maximum rainfall period from November to January
Type III: Seasons are not very pronounced with relatively dry season from November to April and wet season during the rest of the year
Type IV: Rainfall more or less evenly distributed throughout the year
Rainfall in the Philippines is brought by different rainfall-causing weather patterns such as air streams, tropical cyclones, the Intertropical Convergence Zone (ITCZ), fronts, easterly waves, local thunderstorm, etc. About 47% of the average annual rainfall in the country is attributed to the occurrence of tropical cyclones, 14% to the monsoons while 39% are due to the effects of the other weather disturbances. The significance of each of these climatic influences varies with the time of the year. In the Philippines, typhoons come in during the whole year. January to April are a bit less probable. 99% of the typhoons come from southeast and then turn to north and later to northeast or northwest.
Source: PAGASAFigure 3.1.3-1 Climate Map of the Philippines
Based on the Modified Coronas Classification
3-22
Figure 3.2.1-3 Active Faults and Trenches
3.2 Seismic Vulnerabilities of Bridges Based on Typical Damages due to the Past Relatively Large Earthquakes
3.2.1 Outlines of the Past Relatively Large Scale Earthquakes
Located along the Pacific Ring of Fire (Figure 3.2.1-1) where a large number of earthquakes and volcanic eruptions have occurred, the Philippines is geographically prone to natural disasters particularly large-scale earthquakes caused by plate boundary movement and active faults and volcanoes.
Source: http://en.wikipedia.org/wiki/Pacific_Ring_of_Fire Figure 3.2.1-1 Pacific Ring of Fire
Figure 3.2.1-2 Eurasian Plate and Philippine
Ocean Trench The Philippine archipelago lies on the Philippine Plate at the boundary between the Eurasian Plate and the Philippine Ocean Trench as shown in Figure 3.2.1-2. The Philippine Plate, consisting of several micro-plates, is actually squeezed in between the Eurasian Plate and the Pacific Plate with the Philippine Islands being surrounded by complex plate boundaries. The Eurasian Plate is being subducted along the western side of Luzon and Mindoro while the Philippine Fault Zone decouples the northwestward motion of the Pacific with the southwestward motion of the Eurasian Plate. Movements along other active faults are responsible for the present-day high seismicity of the Philippine Archipelago with earthquakes with magnitude greater than 7.0 occurring in the recent years. As seen in Figure 3.2.1-3, active faults and ocean trenches run through almost the entire archipelago generating recent earthquakes that significantly caused damages to the country’s infrastructure. Moreover, the Philippine seismicity can be seen from the density of the recorded past earthquakes that have occurred in the entire country, as shown in Figure 3.2.1-4.
3-23
(a) Record of Past Earthquakes (b) Number of Earthquakes Occurring per Year
Source: USGS Figure 3.2.1-4 Past Earthquakes in the Philippines
Recent major earthquakes causing damages to bridges along the national roads and significantly affecting road transport are summarized in Table 3.2.1-1 below.
Table 3.2.1-1 Major Earthquakes that Have Occurred in the Philippines in Recent Years No. Name of Earthquakes Time Magnitude Remarks
5 Bohol Earthquake Feb 8, 1990 M6.8 Collapse (Jagna-Duero Br.)
6 Panay Earthquake June 14, 1990 M7.1 Collapse (4 bridges)
7 North Luzon Earthquake July 16, 1990 M7.9 Collapse (many bridges) Fatalities: 1,621
8 Mindoro Earthquake Nov 15, 1994 M7.1 Damaged (24 bridges)
9 Bohol Earthquake May 27, 1996 M5.6
10 Bayugan Earthquake June 7, 1999 M5.1
11 Palimbang Earthquake March 6, 2002 M6.8 Fatalities: 11
12 Masbate Earthquake Feb 15, 2003 M6.2 Fatalities: 1
13 Negros Oriental Earthquake
Feb 6, 2012 M6.9 Collapse (several bridges) Fatalities: 41
14 Eastern Samar (Guiuan) Earthquake
Aug 31, 2012 M7.6 Fatalities: 1
Number of Earthquake per Year
3-24
Epicenter and Seismic Intensities
The following describes the damages brought about by some of the major earthquakes in Table 3.2.1-1. The literature review below is taken from PHIVOLCS website.
CASIGURAN EARTHQUAKE Source: PHIVOLCS
(1) Description:
At 4:19 AM (local time) on August 02, 1968 an earthquake with an intensity of VIII in the Rossi-Forel Intensity Scale rocked the town of Casiguran, Aurora. This was considered the most severe and destructive earthquake experienced in the Philippines during the last 20 years. Two hundred seventy (270) persons were killed and 261 were injured as a result of the earthquake. A six-storey building in Binondo, (Ruby Tower) Manila collapsed instantly during the quake while several major buildings near Binondo and Escolta area in Manila sustained varying levels of structural damages. The cost of property damage was several million dollars. Extensive landslides and large fissures were observed in the mountainous part of the epicentral area. Tsunami was also observed and recorded as far as observation in tide gauge station in Japan.
Date of Event August 02, 1968 Origin Time 4:19 am (20:19 GMT)
Epicenter 16.3 N Latitude 122.11 E Longitude or approximately
Magnitude Ms: 7.3 Mb: 5.9 (ISC) Depth Approximately 31 km from the surface.
(2) Summary of Damages:
Damage to Particular Buildings in Manila
The severely damaged area was concentrated in a relatively small part of Greater Manila. This part of Manila lies in the mouth of Pasig River (a major river system in Metro Manila) and includes the deepest and most recent alluvial deposits in the city. Buildings either collapsed or severely damaged include Ruby Tower, Philippine Bar Association Building, Aloha Theater and Tuason Building.
Landslides
Landslides occurred in several places on the steep slopes of surrounding mountains near the epicentral area. Landslides produced by the main shock were mostly on the slopes of mountains north of the town of Casiguran, while those that accompanied the big aftershocks were observed on mountains both to the north and to the west. The largest landslide took place on the cliff at Dinajawan Point facing Casiguran Bay while another landslide was observed in Manglad River, a tributary of Cagayan River. Manglad River traverses behind a cornfield and beside this, the transported unconsolidated sediments produced a small hill.
Ground Ruptures
In the epicentral area, around the town of Casiguran, cracks that were parallel to the nearest rivers were observed. Surface soil in this part is mostly loose deltaic sand. The length of the fissures varies from 10 to 20 meters but in some areas, it reached a length of 400 to 500 meters. The space between the cracks varies from 5 to 20 meters Fissures on the road from Casiguran to Barrio Tabas produced a 0.5 meters crack and the surface subsidence varied to as much as two meters. This road is approximately 8 meters from the Casiguran River at the top of a steep bank approximately 2.5 meters high. Other fissure is on a logging road, 30 meters away from and parallel to river bank in Casiguran area.
3-25
(3) Photos:
Fissures on road from Casiguran to
Barrio Tabas
Landslide at bank of Manglad River
Abutment failure at Casiguran Bridge Ruby Tower collapse
3-26
RAGAY GULF EARTHQUAKE Source: PHIVOLCS
(1) Description:
Date of Event March 17, 1973 Origin Time 4:19 am (20:19 GMT)
The town worst hit by the earthquake is Calauag, Quezon where 98 houses were totally destroyed and 270 others were partially destroyed. In barrio Sumulong of the same town, 70% of the school buildings were damaged. Most of the partially to completely destroyed houses and buildings were situated along the seashore in the northern section of the town proper. The damaged houses were largely wooden and some were poorly built concrete buildings.
The town of Lopez ranks next to Calauag with respect to the extent of destruction. The place is relatively farther from the causative fault and the epicenter of the mainshock, but soft underlying sediments present in Calauag are similarly found in Lopez. The facade of the Sto. Rosario Catholic Church of Lopez suffered cracks and some parts of the CHB walls on both sides toppled down.
The 1 km. long concrete seawall along the ESE coast of Calauag suffered minor cracks mostly along construction joints. About its mid-section in one of its stairways there was a 10 cms. crack. One section was displaced 5 cms to the north from the other section.
In Barrio Hondagua, Lopez 5 km east of Calauag, some buildings were totally or partially damaged. The Hondagua Theater which had been converted into a restaurant completely collapsed and the Catholic chapel of the Barrio was partially destroyed. There was differential settlement of the ground along fills in the pier such that floorings of some of the buildings became uneven and were cracked.
Transportation / Communication Lines and Underground Pipes
The earthquake wrought damages to roads, railroads and bridges. This hampered travel to and from Bicol Region. At least four highway bridges on the Manila South Road were reported to have suffered damages ranging from a partial to total collapse. The bridge which totally collapsed was the Sumulong highway bridge in Sumulong, Calauag. A PNR bridge crossing the Calauag River and situated about 600 meters north of the highway bridge was badly damaged although it did not collapse. The rails along the bridge were badly twisted.
A slight movement was detected at the PNR bridge in Morato Tagkawayan. Its ties were observed to have moved to 8 cms. to the east, and base plate of its western abutment was moved 5 cm. to south. Damages to national and municipal roads were limited to cracking of the concrete slabs along the Manila South Road. Subsidence occurred along the Sumulong-Guinayangan road. Minor cracks were observed along the national highway from Km 217, up to Km 234 in Calauag.
Betweeen the town of Lopez and Calauag the rails of the PNR were reported to have been badly twisted. The major twisting of the raiways however occurred some 300 meters from the southwestern approach of the PNR trestle bridge in Sumulong. This provided a remarkable manifestation of the lateral movement of the ground.
Electric systems, waterwoks systems and telegraph systems in the town of Lopez, Calauag and Guinayangan were severely disrupted. In Calauag, water main pipes were either fracured or severed. Electric and telegraph lines snapped due to appreciable horizontal movements of the ground. Fires which broke out during the earthquake were immediatel controlled by alert local firefighters.
Epicenter and Seismic Intensities
3-27
Geologic Features and Effects
Features and Effects Related to Faulting
The most interesting feature in this earthquake was the remarkable extent of faulting. The farthest observable fault trace from the epicenter is 90 km away in the coastal barrio of Sumulong, Calauag.
Ground breakages were seen along the segment of the Philippine Fault, from the western coast of Ragay Gulf to Calauag Bay, a stretch of about 30 km. The fault traces exhibited moletrack features with ground fissures arranged in enchelon to one another in an E-W trend. From Barrio Cibong towards barrio Sintones in the town of Guinayangan, some 6 kms. northwestward, the traces were observed to have followed a moderate depression.
During the second field survey to the epicentral area, a 3.4 meters offset of the shoreline in Barrio Cabong, Guinayangan was observed. Ground displacement was laso left lateral.
Other Geologic Features:
The strong shaking of the ground during the Ragay Gulf Earthquake caused two areas along the Calauag-Guinayangan municipal road between km 236-238 to subside. One of the resulting depressions was 225 meters long while the other was 95 meters long. The longer depression was 2 km NW from the first. A fissure, 15 cm wide with 2 unknown length, lies along the foothills some 200 meter NW of the PNR terminal in Calauag. Its orientation is N80W. In Lopez, two fissures were observed along Lopez-Jaena St. These may be due to settlement of the bank of Talolong River. Close to the eastern bank of the Calauag River in Barrio Sumulong and Mabini, several sand boils were found.
Mudboils are formed when water- laden sediments are subjected to compressional forces thereby causing the
water and fine sands and muds to be injected into the air through fissures or to just upwell towards the surface.
(3) Figures:
Aftershock distribution of the Ragay Gulf Earthquakeof March 17,
1973 to March 25, 1973
3-28
MORO GULF EARTHQUAKE Source: PHIVOLCS
(1) Description:
A few minutes after the last stroke of midnight on August 17, 1976, a violent earthquake occurred in the island of Mindanao spawning a tsunami that devastated more than 700 km of coastline bordering Moro Gulf in the North Celebes Sea. This offshore event generated by Cotabato trench, a less prominent trench system in the Philippines, was the largest tsunamigenic earthquake to have occurred in Mindanao in the last two decades. It was an earthquake that resulted in massive destruction of properties and great loss of lives. The tsunami generated contributed immensely to the devastation. The cities and provinces of Cotabato took the brunt of the earthquake while the tsunami generated cast its doom on the provinces bordering Moro Gulf especially on the shores of Pagadian City. According to surveys during the event, the tsunami was responsible for 85% of deaths, 65% of injuries and 95% of those missing. After the sea spent its fury and rolled back to its natural flow, thousands of people were left dead, others homeless or missing and millions of pesos lost with the damages of properties. Properties lost not only include establishments for residential and commercial use, but also bancas that, as a whole, represents the livelihood of hundreds of families.
Date of Event: 17 August 1976 Time: 12:11 A.M. (Local) Epicenter: 06.3° N, 124.0° E Magnitude: 7.9
(2) Summary of Damages:
Damage to Particular Buildings
Most of the damages occurred in Cotabato City with some in Zamboanga City and Pagadian City. Building types damaged include schools, hotels, restaurants, churches, stores, police station, bakeries, hardware stores, etc. Damages to buildings include ranges from minor cracks to falling of walls, shearing of walls, residual displacements, structure settlement, partial structure member collapse, total collapse.
Damages to Bridges
QUIRINO BRIDGE
This is a four-span structural steel bridge over the Rio Grande. Each span is 40 m long. The second span from the south end collapsed into the river during the earthquake. The third span from the south end nearly collapsed and cracks appeared several centimeters below the base of the south abutment. TAMONTAKA BRIDGE
This bridge spans about 230 m across Tamontaka River approximately 6 km south-southwest of Cotabato City. The bridge is made up of six spans resting on pile-supported piers. The girders, piers and piles are made of reinforced concrete. The bridge was constructed in three sections. After the earthquake, the center section moved east and west in excess of 38 cm each way evidenced by the broken concrete keepers on each end of the supporting piers. The northern section moved even greater distances. The southern section moved but with lesser distance. There was damage to the railings at the abutments and the expansion joints. Damage due to Tsunami
Just after the earthquake stopped, the sea, stirred by the powerful movement of the earthquake, swelled and moved away from the coastline for about three kilometers. About ten minutes later, it roared back to the shore and beyond in three succeeding waves soaring as high as the treetops according to some reports. The sea unloaded its fury on everything near the shore. Houses and properties along the coastal beaches of Lanao del Sur and Pagadian were practically washed out. Bits of houses littered the sea and bodies littered the shore. The casualties and victims of the earthquake and tsunami numbered thousands just in Regions 9 and 12. (Region 9
Epicenter and Seismic Intensities
3-29
covers Pagadian City, Zamboanga del Sur, Zamboanga City, Basilan, and Sulu while Region 12 covers the areas of Sultan Kudarat, Maguindanao, Cotabato City, Lanao del Sur and Lanao del Norte.)
A tabulation of the victims and casualties in these regions is as follows. Area Dead Missing Injured Homeless*
Region 9 1,440 909 7,701 49,848 Region 12 3,351 1,379 2,227 43,534
Source: Badillo, V.L. and Astilla, Z.C.: Moro Gulf Tsunami of August 17 1976 *Some of the data in this section was estimated at 6 members per family The major cause of the great number of casualties during the event could be attributed to the fact that (1) the tremor happened just after midnight when most people were sleeping; (2) a great tsunami was spawned, struck the coasts from different directions and caught the people unaware.
(3) Photos:
Ground fissure at
Quirino Bridge Centerline offset at Tamontaka Bridge
Collapse of Tamontaka Church Failure of lower floors at Harvadian College
3-30
LAOAG EARTHQUAKE Source: PHIVOLCS
(1) Description:
At 8:18 P.M. of 17 August 1983, an earthquake with a magnitude of 5.3 (Ml) on the Richter Scale and an intensity of VII on the Rossi-Forel Scale hit the province of Ilocos Norte. The tremor was perceptible over a distance of 400 kilometers from the epicenter. This was the most sever earthquake in North-western Luzon in 52 years and probably the second largest earthquake event to hit Laoag city and it's immediate vicinity in historical times. This earthquake has caused death of 16 people and injuries of forty seven persons (PDE).
Date of Event August 17, 1983
Origin Time 8:17 pm (12:17 GMT)
Epicenter 18.231 N Latitude 120.860 E Longitude or approximately 30 aerial kilometers east-northeast of Laoag City.
Magnitude 6.5 Ms ( 5.3 Ml on the Richter Scale)
Depth approximately 42 km from the surface.
(2) Summary of Damages:
Historical Background:
Since 1862 up to 1981, (excepting the years 1941 to 1949) fifty-six earthquakes have affected Laoag City. Of these, the strongest was recorded on 19 March, 1931. This earthquake reportedly had an intensity of VII - IX. Prior to the 17 August earthquake, two tremors were recorded on the eleventh and the thirteenth of August 1983. These were believed to be foreshocks of the intensity VII earthquake (Macalincag, T. G., personal communication). The first had an intensity of V and the succeeding one an intensity of II in the Rossi-Forrel Scale.
Damages on buildings:
A number of reinforced concrete buildings either totally crumbled or sustained major structural damage beyond rehabilitation. The failure in most of the damaged buildings can be attributed to shear and compressional waves, thereby producing horizontal and vertical stresses. The most heavily damaged structures in Laoag City are those situated near the Laoag River flood plain and along reclaimed stream channels. These buildings were condemned by the City Engineer's Office. Nearly all the damaged buildings in the area were of reinforced concrete frame. Most of the external walls and internal partitions were of concrete hollow blocks. There are however, some buildings with wood partitions.
Landslides:
Several earthquake induced landslides were observed in places where the slopes along road cuts were steep to very steep. This condition had been aggravated by prolonged rainy days, absence of vegetation to hold the soil, moderately weathered and indurated rocks. Areas affected by landslides were the Sarong Valley in Vintar and Patapat Mountains in Pagudpud, both in Ilocos Norte.
Sandboils or Sandblows:
Several sandboils were reportedly observed in Barangay Zamboanga, Laoag City; Barangay Puyupuyan, Pasuquin; and Barangay Calayab, Paoay. The diameters of their craters vary from a few centimeters to 2.5 meters. Sandblows or sandboils are the spouting of hydrated sand caused by moderate to severe earthquakes. This connote water that has been entrapped in the interstices of sediments at the time of deposition may have come from either South China Sea or Laoag River.
Differential Settlement:
Majority of the bridges in Ilocos Norte had experienced differential settlement of approach roads and or abutments. Some of the buildings were also observed to have differential settlement in addition to being out of
Epicenter and Seismic Intensities
3-31
plumb. Step fractures due to collapse of foundation were observed at Marcos Guesthouse in Sarrat. Magnitude of differential settlement measured range from a few centimeters to approximately 30 centimeters.
Shear Fractures:
A tilted road pavement along J. P. Rizal Street, Laoag City was observed after the main tremor. Gaping tension fractures along Vintar-Bacarra Road and along asphalt pavement on the southern approach of Bacarra Bridge were also observed. Gaping step tension fracture along Vintar Poblacion-Tamdagan road was found. Numerous irregular cracks and small fissures were discovered along seashores, river banks and alluvial fans.
(3) Photos:
Severely damaged 8-storey building (Laoag)
Shear and torsion failure of Denson Building (Laoag City)
Collapse building due to shear and torsional failure Collapsed Vintar Church, Vintar
3-32
BOHOL EARTHQUAKE Source: PHIVOLCS
(1) Description:
This shallow seated tectonic earthquake with magnitude 6.8, struck the island of Bohol at 3:15 pm (February 8, 1990), caused panic to general public, damaged several houses and infrastructure and presented several geologic disturbances. Its epicenter was located about 17 kilometers east of Tagbilaran City with a maximum felt intensity of VIII, based on Rossi-Forel Intensity Scale, in the towns of Jagna, Duero and Guindulman all situated on the lower area of the NE quadrant of the island. It was felt at intensity VII in Garcia Hernandez, Loboc, Valencia and Anda, Intensity VI in Tagbilaran City, the rest among the 16 municipalities of Bohol and in the neighboring islands of Cebu and Camiguin. Intensity V was felt over areas of Cagayan de Oro in Mindanao, Dumaguete City in Negros, Intensity IV in the areas of Canlaon in Negros and Cotabato City in Mindanao. Reported felt intensities ranging from I to III was also felt as far as Palo in Leyte and Bislig in Surigao.
Observed geologic phenomena related to this event include ground fissures, landslides, rockfalls, ground subsidence and collapse, sand/mud fountaining and sudden increase on the sea level. Most of the manifestations were particularly observed and experienced by the towns of Jagna, Valencia, Duero, Guindulman and Garcia Hernandez. The force of the incoming waves from the sea caused Alijuan River in Duero to flow inland immediately after the earthquake.
Based on the orientation of the main fracture zones, focal mechanism solution and aftershock distribution, the earthquake may have represented subsurface rupture along segments of the NE-SW Alicia thrust fault. Studies by the Bureau of Mines (1986), however, point to the fact that in most portion of the fault is being overlained by Miocene to recent limestone which does not reflect any deformation suggesting that the fault has been inactive for quite a long time. This would pose a question as to whether the earthquake represented reactivation of an old fault or indicated new fault movement in the island.
Six fatalities were reported and more than 200 were injured in the event. About 46,000 people were displaced by the event and at least 7,000 among them were rendered homeless. Estimated damage to properties is amounting to 154 million pesos.
(2) Summary of Damages:
Damages to buildings:
Impact and damage documentation revealed that the worst affected portion of the island was sustained by the eastern and southeastern coastal areas, observed to be mostly underlain by alluvial deposits which have tendency to amplify ground motions generated by an earthquake. Likewise, most of the damaged buildings were either old/poorly-built or lacked the necessary reinforcements to resist strong ground shaking. About 3,000 units of houses, buildings and churches were affected and damaged where a total of 182 were totally collapsed including two historical churches built centuries ago. Some 200,000 sq.m. of fishpond in the town of Guindulman sustained damage due to cracked and collapsed dikes. Mud eruptions on these fishpens contributed to the death of fishes and prawns.
Damages to Bridges:
The bridge connecting the towns of Jagna and Duero collapsed. Roads to Anda sustained cracks and fissuring. Landslides and rockfalls blocked some portions of the roads that caused inaccessibility to some areas between Anda and Garcia Hernandez.
3-33
PANAY EARTHQUAKE Source: PHIVOLCS
(1) Description:
On 14 June 1990, an earthquake measuring 7.1 in the Richter Scale hit Panay Island at 3:41 P.M., killing 8 and injuring 41 people. The epicenter was located at 11.34° North latitude; 122.10° East longitude, in the vicinity of Culasi, Antique.
The depth was computed to be 15 kilometers. It was generated by fault movement in the collisional zone off western Panay Island.
(2) Summary of Damages:
A quick response team dispatched to the area reported the following observations:
Culasi, Antique
Seven persons perished and 31 others suffered mild to severe injuries.
About 15% of the residential houses collapsed, the rest were partially damaged.
Several commercial buildings, namely: San Miguel Beer and Coca-cola warehouse; half portion of the Rural Bank of Culasi building; the Esperanza Elementary School, and the Seventh-Day Adventist church collapsed.
Four bridges totally collapsed.
Fissures measuring 82.5 x 0.8 x 0.91meters, and 4 x 0.8 x 0.9meters were noted in two barangays.
Upliftment occurred in Barangay Bagacay of 0.6 meters with an approximate area of 3,000 square meters.
Landslides were noted along the slope of Mt. Madya-as. The volume of materials carried by the landslide was approximately 30,000 cubic meters in Bagacay.
Fifty-seven families (about 342 persons) were evacuated.
Libacao, Aklan
Five concrete residential buildings were totally damaged, while thirty structures were partially damaged.
Two churches and a river control project were heavily damaged.
Five highway bridges were partially damaged.
Balete, Aklan
The Baptist church and the public market were heavily damaged, while an icon was toppled down.
The Rural Health Center and a rice mill collapsed.
The Balete district hospital was badly damaged and was declared dangerous for future use.
Partial damage to another public market and on the approach of some bridges.
One residential house totally collapsed and ten others were partially damaged.
Thirty-five people were evacuated to the Catholic Church.
A fissure measuring 2 km long and 136 cm wide, trending N50W was noted along Jaro River.
Madalag, Aklan
The municipal and district hospital sustained some cracks.
Epicenter and Seismic Intensities
3-34
Kalibo, Aklan
Aklan Science High School and Alan Cinema were partially damaged.
The Catholic Church of Kalibo that is made of bricks suffered cracks on its walls.
A house made of ceramics was partially damaged.
Numancia, Aklan
Sandboil was observed.
Altavas, Aklan
The wharf was partially damaged.
There were cracks on the walls of the Cathedral and the head of an icon was damaged.
Makato, Aklan
The sports complex was partially damaged.
The posts and beams of the public market were damaged.
Kalinog, Iloilo
Various buildings of the Philippine Constabulary Regional Command were damaged.
The Catholic Church was partially damaged.
Cuartero, Capiz
A church and several houses were partially damaged.
Sigma, Capiz
A bridge and a communication tower were partially damaged.
(3) Photos:
Partial collapse and total collapse of houses Partial collapse of building; shear cracks
3-35
MINDORO EARTHQUAKE Source: PHIVOLCS
(1) Description:
Compared to the magnitude 7.8 July 16, 1990 Northern Luzon earthquake, the magnitude 7.1 November 15, 1994 Mindoro earthquake was weaker and less destructive but nonetheless dramatic and can be considered another classic. Both events were tectonic in origin, related to movement along zones of weakness transecting the Philippine Archipelago, the former along the well-known Philippine Fault Zone and the latter along a hitherto unacknowledged active fault which we are now calling as Aglubang River Fault. Like the 1990 event, the 1994 Mindoro earthquake produced geologic features such as fault-related ground rupture and secondary ground failures like liquefaction and landslides though these were minor compared to those brought about by the 1990 Luzon earthquake. In addition, the 1994 event generated a tsunami which accounted for majority of the casualties and wrought significant damage on the northern shoreline communities of Mindoro. Without this tsunami, total casualty would have been only 29 instead of 78.
(2) Summary of Damages:
Casualties and Damages
The 15 November 1994 earthquake affected 13 out of 15 municipalities or a total of 273 barangays in Oriental Mindoro. As per official report of the Provincial Social Welfare and Development Office (PSWDO), about 22452 families were affected. Casualties numbered 78 confirmed dead and 430 injured. The municipality of Baco sustained the biggest number of casualties, with 41 confirmed deaths from drowning due to the tsunami that hit the coastal area of Malaylay, San Andres, Baco. The capital town, Calapan, has the second most number of casualties, with 17 deaths from Wawa, also a coastal area in Calapan. Almost half of the casualties were children below 10 years old who were drowned.
The table below presents a summary of damaged buildings and infrastructures in the affected towns:
Municipality Bridges Buildings River
ControlSeawall Pier
Calapan
Baco
Bansud
Bongabong
Naujan
Socorro
Victoria
Pola
Pinamalayan
Gloria
San Teodoro
6
14
3
4
13
6
10
-
5
5
1
2
-
-
-
-
-
-
-
-
-
-
2
3
3
2
-
1
1
1
-
-
-
1
-
-
1
1
-
-
1
1
-
-
1
-
-
-
-
-
-
-
-
-
-
Total 67 2 13 5 1
Some 7566 houses were damaged: 1530 totally or washed away by tsunami, and 6036 partially. The municipalities of Calapan and Baco had the biggest number of totally destroyed houses. However, Naujan and Gloria had the biggest number of partially damaged houses with 2204 and 1138 houses respectively.
Damages to Roads, Bridgse and Other Infrastructure:
Damaged infrastructures include 24 bridges 8 of which were rendered impassable for days, isolating villages and towns in the interior. Roads with a combined span of 500 km likewise sustained damage. With round-the clock emergency work and fast track repairs by the Provincial Engineering Office, the Provincial Disaster Coordinating Council and the Department of Public Works and Highways, all the bridges and road connections from Puerto Galera to Bulalacao became passable to light vehicles by the end of November.
Three major power plants--two in Luzon Grid and on in Visayas--tripped during the earthquake, causing brown outs on Mindoro Island and parts of Leyte and Samar. Some areas in Metro Manila also experienced brief power interruption. In Calapan itself, the floating 7.2 megawatt power barge was swept inland by the tsunami. This ran
3-36
aground 2 kilometers away from its original location. Power was partially restored in Mindoro before the end of November, but it took another month before the power situation in the province was normalized.
Total Cost of rehabilitating damaged buildings and infrastructures is placed at P5.15 Million.
(3) Photos:
Collapse of old house due to ground shaking
(Calapan town proper)
Wall and flooring of nipa hut swept away by tsunami
(Brgy. Malaylay, Baco)
3-37
PALIMBANG EARTHQUAKE Source: PHIVOLCS
(1) Description:
The earthquake occurred on March 6, 2002 at 05:15 am (local time). Its epicenter as located by PHIVOLCS is at 6.1 N; 124.0 E; 81 km or about 81 km SW of Isulan, Sultan Kudarat. PHIVOLCS computed its depth of focus at 15 km. Its surface magnitude was computed by the Pacific Tsunami Warning Center as 6.8 while its moment magnitude (Mw) and body wave magnitude (mB) were computed by the the U.S. Geological Survey (USGS) as 7.2 and 6.3, respectively. Based on the earthquake location and mechanism solutions, its source is attributed by PHIVOLCS to subduction along the Cotabato Trench.
As of March 9, 2002, the Office of Civil Defense (OCD) records show that 8 people had died and 41 were injured due to the earthquake. It affected 7,684 families in the provinces of Sultan Kudarat, Sarangani, North Cotabato and South Cotabato including four cities and 17 municipalities (OCD Memorandum dated March 9, 2002). The quake damaged 4 road networks, 7 bridges, 36 school buildings, 29 business establishments, 1 megadike, 2 health centers and 17 public buildings. Damage amounted to 4.175 million pesos or about 80,000 US dollars.
Date of Event March 6, 2002
Origin Time 05:15 am
Epicenter 6.1 N; 124.0 E; 81 km or about 81 km SW of Isulan, Sultan Kudarat
Magnitude 6.8 Ms
Depth 15 km
(2) Actual Observations (Partial):
Palimbang, Sultan Kudarat:
Palimbang is a coastal town of 40,000 people (NCS), 1995). In this place, a concrete chapel collapsed due to intense shaking (PHIVOLCS QRT Report). No one died as a result of the collapse because the church has previously been abandoned due to military operations in the area. However, one person was reported dead and seven wfrom Barangays Poblacion, Badiangan and Colubo were injured. Two people were injured and were hospitalized (OCD Region XII, March 9, 2002). General Magsino reported to PHIVOLCS Main Office that the sea was observed to have receded 150 m from the shoreline. It then went back 75 m inland damaging two boats (General Magsino and PHIVOLCS QRT Report).
Maitum, Sarangani
Maitum (pop: 35,000) is the neighboring town of Palimbang. It belongs to the province of Sarangani province. The highway linking Maitum and Palimbang and places in Barangays Pinol and Lipo were affected by landslides. In Barangay Mabay and Sitio Talikod, three sandboils measuring 8-10 cm wide and 12 cm deep were observed. Cracks on the ground measuring 5-10 cm wide, 2 cm deep and 30 cm long were observed at Sitio Saub in Barangay Mabay and in Nolasco St. Water was observed to have receded 300 m.
Kiamba, Sarangani
Kiamba (pop: 39,000) is the next shore town after Maitum. Two public markets made of wood located in Barangay Kiamba and Lagundi collapsed. Walls of several houses collapsed leaving only posts and beams behind. Tual Bridge sank by 6 cm. Water receded 5-8 m three times (Mr. Rommel Palge, local govt ofc (083) 509 4038). Afterwards, water was again observed to rise (Mr. Leonardo Esteban, local resident (083) 509 4069). As a result, people went up the mountain. About 32,000 people or more than 80% of its local population were evacuated at the Tumadang Elementary School and Iglesia ni Cristo Church (OCD Region XII, March 7,
Epicenter and Seismic Intensities
3-38
2002).
Glan, Sarangani
Glan (pop: 74,000) is another coastal town along Sarangani Bay. In this place, a big rock fell disrupting traffic. Landslides were also reported in Barangays Kapatan and Alegado (OCD Region XII, March 7, 2002; Malaya, March 7, 2002). A bridge collapsed in Barangay Small Margus isolating the barangays of Batulaki, Kaltuad and Santo Nino (OCD Region XII, March 7, 2002). The quake caused a one-m wide depression on the concrete road at the Glan subport (Philippine Daily Inquirer, March 7, 2002). A mosque in Barangay Burias and a Barangay Multipurpose hall at Barangay Baliton collapsed (OCD Region XII, March 7, 2002). An old school building in Barangay Kapatan was totally damaged (OCD Region XII, March 7, 2002).
Koronadal City, South Cotabato
Koronadal (pop: 118,000) is the capital of South Cotabato and is found NE of the town of Surallah after the Roxas Mountain Range. The Masagan Bridge, concrete bridge and walls of Barangay Saravia Elementary School at Barangay Saravia, the approach of the Ferry Bridge, the San Roque Elementary School in Barangay San Roque, the MSST College of Technology Building, the KCC Mall, the overpass of the South Cotabato Provincial Hospital and the Elan Building suffered cracks (OCD Region XII, March 7, 2002; Malaya, Philippine Daily Inquirer and Manila Bulletin, March 7, 2002).
Banga, South Cotabato
Nine houses were partially damaged while three houses were totally damaged (OCD region XII, March 11, 2002). A span of the Rizal Elementary School collapsed while the altar of a Catholic Church in Barangay Kusan was partially damaged (OCD region XII, March 11, 2002). The Sapali Bridge cracked (OCD Region XII, March 11, 2002).
General Santos City
General Santos City (pop:327,000) is the prime city of South Cotabato. A house totally collapsed (OCD-Region XII, March 7 and 11, 2002). The approach of a bridge in Barangay General Paulino Santos was damaged (Philippine Daily Inquirer, March 7, 2002).
3-39
MASBATE EARTHQUAKE Source: PHIVOLCS
(1) Description:
A strong earthquake with Ms6.2 struck the province of Masbate at 7:01 in the evening of 15 February 2003. Preliminary determination of epicenter indicated that the event was generated along the Masbate Segment of the Philippine Fault Zone (PFZ) in central Philippines. The epicenter was located offshore of Magcaraguit Island (12.2ºN, 123.8ºE) and about 22 kilometers deep, which is approximately 28 km east of Masbate City. Initial reports from nearby stations implied that the earthquake was felt all over the island of Masbate including the nearby provinces of Bicol, Leyte, Panay, Cebu, Negros and Romblon.
Date of Event February 15, 2003
Origin Time 7:01 pm
Epicenter offshore of Magcaraguit Island (12.2ºN, 123.8ºE), approximately 28 km east of Masbate City
Magnitude 6.2 Ms
Depth 22 km from the surface
(2) Summary of Damages:
Ground Rupture:
The ground rupture was verified and mapped through field investigations. The total length of the rupture inland is approximately 18km transecting several Barangays of Dimasalang, Palanas and Cataingan. The ground rupture was characterized mostly by right-stepping en echelon faults with a general trend of ~N3OW to ~N4OW and had a maximum opening of 20 cm (Figure 9). The maximum horizontal displacement along the fault was 47cm in Brgy. Sta. Cruz, Palanas while the maximum vertical displacement (23cm) was found in Brgy. Suba, Dimasalang. The average horizontal and vertical displacements mapped along the ground rupture were 15 cm and 5 cm, respectively.
On the other hand, the average width of the fault zone measured was about 75 cm and the widest measurement (153 cm) was found in Brgy. Sta. Cruz, Palanas. The ground rupture mapped during the 10-day investigation was traced from Brgy. Suba, Dimasalang to Sitio Burabod, Brgy. Pawican, Cataingan. The February 2003 ground rupture, more or less, followed the old trace/location of the active fault with about 3m localized deviations in some areas. Maximum PEIS intensity of Intensity VIII was observed in some areas along the ground rapture wherein several houses were totally damaged due to significant horizontal and vertical displacements. A displaced coconut tree and the ground rupture manifestation into the seashore were observed in Matugnaw, Palanas and Suba, Dimasalang, respectively. Damages on Horizontal and Vertical Infrastructures:
Based on the initial survey conducted by the quick-response team during its field investigations, some school buildings, roads, bridges and river flood control projects performed poorly. Moreover, they were deemed structurally unsafe and hazardous to life and property after experiencing the strong ground shaking of the 15 February 2003 quake.
During this event, engineered structures proximal to the fault trace sustained the worst damage. A road section of the Masbate-Cataingan Road was intersected by the fault near the Dimasalang-Palanas boundary. In this area the road was damaged as lateral longitudinal cracks were formed along the fault producing buckled and cracked section in this road. On the other hand, the Nipa Bridge along the Masbate- Cataingan Road (km post 57+607), located less than 2km from the ground rupture suffered significant structural damages. In this bridge, at least one of its columns showed concrete spalling at mid-height with striking vertical misalignment on both horizontal directions. Displacement at the bridge deck with respect to the bridge approach was also noticeable along with the yawning deck joints. Moreover, the slope protection grouted riprap at Nabangig Bridge located along the Masbate-Cataingan Road (km 62+560) and the Cantil River Control in Brgy. Poblacion in Palanas, Masbate
Epicenter with historical earthquakes (Besana, G., et.al.)
3-40
were also severely damaged. The riprap structures in these areas suffered numerous large cracks as their foundation failed most probably due to compaction and slumping.
Furthermore, several school buildings at Masbate National Comprehensive High School suffered severe shear cracks and column-wall joint failure. In the same structures, some longitudinal and transversal fractures along the length of the beam and of the column were likewise observed. The Provincial Health Office's Administration building's middle concrete roof beam reveals a possible longitudinal rupture. The same failure characteristic was observed on at least two school buildings in Jose Zurbito Sr. Elementary School (also known as Jose Masbate South Elem. School) in Masbate City.
(3) Photos:
The observed ground rupture in
Brgy. Sta Cruz, Palanas Ground rupture in Dimasalang Brgy. Matugnaw, Palanas
The Nipa Bridge in Dimasalang (left photo) nd the riprap structures (right photo) that were damaged during the February quake.
Collapsed concrete wall of a school building in Dimasalang, Masbate.
3-41
3.2.2 The 1990 North Luzon Earthquake15,16,17,18,19
(1) General
The Philippine Institute of Volcanology and Seismology (PHIVOLCS) publishes in its website information on earthquakes that occurred in the country. Information of particularly large earthquakes in the past is definitely available from the website, including that of the 1990 North Luzon Earthquake, which occurred about 20 years ago. This section gives an overview of the 1990 North Luzon Earthquake based on the information obtained from PHIVOLCS website20.
The 16 July 1990 earthquake (Ms=7.8) produced a 125 km-long ground rupture that stretches
from Dingalan, Aurora to Kayapa, Nueva Vizcaya along a general N 40-60º W trend. The
epicenter of the event was located near the town of Rizal Nueva Ecija, at a depth of 28 km.
Figure 3.2.2-1 shows the 16 July 1990 Luzon earthquake rupture.
Figure 3.2.2-1 The 16 July 1990 Luzon Earthquake Rupture
15 Bekki, T., Mitsuishi, T., 1990, Disaster of earthquake in Philippines, Bridge and Foundation Engineering, 9-12. 16 Japan Society of Civil Engineers, 1993, Reconnaissance Report on the July 16, 1990 Luzon Earthquake, the Philippines. 17 Iemura, H., Iwai, S., and Ando, M., 1990, General Features of the Disaster Due to the July 1990 Philippines Earthquake, Japan Society for Natural Disaster Science, 71-86. 18 The Japanese Geotechnical Society, 1991, Soil Liquefaction and Resulting Damage to Structures during the July 16, 1990 Philippines Earthquake. 19 Kojima, H., Tokimatsu, K., and Abe, A., 1992, Liquefaction-induced damage, and geological and geophysical conditions during the 1990 Luzon earthquake, Earthquake Engineering, Tenth World Conference, 135-140. 20 Philippine Institute of Volcanology and Seismology (PHIVOLCS) website: www.phivolcs.dost.gov.ph
3-42
The strongest and most destructive earthquake to hit the Philippines in the last two decades
struck on 16 July 1990 with a magnitude of 7.8 on the Richter scale and a maximum felt
intensity of VIII in the Modified Rossi-Forel (MRF) intensity scale (VIII- IX in the Modified
Mercalli intensity scale).
The seismic intensity distribution of the 1990 North Luzon Earthquake is shown in Figure
3.2.2-2. The seismic intensity of VIII in the MRF scale corresponds to that of V in the Japan
Meteorological Agency Intensity (JMAI) scale21. The largest seismic intensity recorded in
Japan has been JMAI = 7 during the South Hyogo Prefecture Earthquake in 1995 and 2011
Tohoku Earthquake.
Source: PHIVOLCS
Figure 3.2.2-2 Distribution of Seismic Intensity of Main Shock Modified Rossi-Forel (MRF) Intensity Scale (1990)
This major earthquake and its attendant geologic processes—surfacefaulting, liquefaction,
landslides and debris flows-- exacted a toll of 1283 dead, 2786 injured, 321 missing (NDCC,
Nov. 14, 1990) and more than P18.7 Billion in actual damages to public infrastructure and
facilities and private properties (NEDA, Nov. 1990).
Four regions in north and central Luzon suffered the heavy damage and casualties with the
cities of Baguio, Dagupan, Cabanatuan and San Jose bearing the brunt of the disaster.
One of the most striking features of the July 16 earthquake was the number of failed bridges.
Those with discontinuous spans stood out.
Infrastructures such as roads and bridges along the ground rupture were also damaged as a
result of both horizontal and vertical ground shifting.
21 ABE, K., 1990, Seismological Aspects of the Luzon Philippines Earthquakes of July 16, 1990, Bull. Earthq. Res. Inst. Univ. Tokyo, 65, 851-873.
3-43
Many bridges on national, provincial and barangay roads were damaged due to landslide and
liquefaction. The Earthquake Reconstruction Project (ERP) was initiated by the Government of Philippines under the Republic Act 6,960 and provides for the reinstatement, and/or strengthening of damaged public facilities. The ERP is funded by the Philippine Government with the backing of loans from the Asian Development Bank (US$ 100 million) and World Bank (US$ 125 million). (2) Peak Ground Acceleration (PGA)
Since all strong motion seismographs having been installed were damaged due to the
earthquake (M 7.8), no strong earthquake ground motion records exist.
Estimations of acceleration at the ground surface was carried out based on the analytical
method, hearing from local residents, the extent of damages of structures, and
etc.(Higashihara, Earthquake Research Institute (ERI), the University of Tokyo (UOT);
Konagai, UOT; Sato, Disaster Prevention Research Institute (DPRI), Kyoto University;
199122).
Figure 3.2.2-3, Table 3.2.2-1 and Table 3.2.2-2 show the results of those estimations. From
the estimations, the maximum ground accelerations are estimated to be 200 – 400 gals (0.2 –
0.4G) at near the epicenter.
Figure 3.2.2-4 shows the design acceleration coefficients used today for seismic designs of
bridges in the Philippines. An acceleration coefficient of 0.4 (0.4G) is widely used except in
some regions. The distribution shows that the design acceleration coefficient almost agrees
with the distribution of the estimated maximum ground accelerations during the earthquake.
Figure 3.2.2-3 Contours of Maximum Acceleration (gal) (3Falts Planes Model, M=7.0)
22 Sato, T., Higashihara, H., and Konagai, K., 1991, Structural Damage and Intensity og Ground Shaking During The 1990 Philippines Earthquake, Annuals of Disas., Prev. Res. Inst., Kyoto Univ., 34A, 1-18.
Table 3.2.2-2 Maximum Acceleration at Ground Surface Estimated Based on the Phenomena of Structures after the Earthquake
City Name Distance from Faults23
Estimated Maximum Acceleration Coefficient
Incidents (B/H= Aspect Ratio (H: Height, B: Width))
Puncan 0.5 km > 0.27 (270 gal) Fall of Gate Post (B/H = 0.27)
Culba 1.0 km > 0.60 (600 gal) Rocking of Oil Storage (B/H = 0.66)
Bongabon 6.0 km > 0.22 (220 gal) Fall of Video Screen (B/H = 0.22)
San Jose-Lupao 10.0 km > 0.23 (230 gal) Fall of Cabinet (B/H = 0.23)
Lupao 11.0 km > 0.28 (280 gal) Fall of Wardrobe (B/H = 0.28)
Umingan 15.0 km > 0.21 (210 gal) Fall of Statue of God (B/H = 0.21)
La Paz 55.0 km > 0.25 (250 gal) Fall of Statue of God (B/H = 0.25)
Tarlac 60.0 km > 0.27 (270 gal) Fall of Wardrobe (B/H = 0.27)
Moncada 50.0 km > 0.20 (200 gal) Fall of Statue of God (B/H = 0.20)
Agoo 50.0 km 0.3 - 0.5 ( 300 – 500 gal) Sliding of Flower Pot
Lingayen 77.0 km < 0.20 (200 gal ) No Fall of Statue of God
Mangatarem 76.0 km < 0.20 (200 gal) No Fall of Statue of God
Camiling 68.0 km < 0.20 (200 gal) No Fall of Statue of God
23 Shortest distance from Digdig Fault and Gabaldon Fault
3-45
Source: NSCP24
Figure 3.2.2-4 Acceleration Coefficient (3) Bridge Damage Due to 1990 Luzon EQ
The North Luzon Earthquake in 1990 caused serious damages particularly in the mid and northern areas of the country. Informed of the extensive damages, Japan immediately dispatched emergency rescue and medical teams and also sent investigative teams consisting of earthquake engineering experts in accordance to the law concerning the Dispatch of Japan Disaster Relief (JDR) Team, including those from the Ministry of Education, Science and Culture, Japan Society of Civil Engineers, and Architectural Institute of Japan. The investigative team of the Japan Society of Civil Engineers summarized damages to roads, bridges and other civil engineering structures in a report25. The report also mentions data provided from other investigative teams and reports damages to a number of civil engineering structures. The reported damages also include those for which causes were not clear, but the data is informative for understanding which damage to which part of bridge has led to serious destruction of the entire bridge. This section summarizes damages to bridges in the Philippines during the 1990 Luzon Earthquake, which were revealed based on the surveys by the investigative team of the Japan Society of Civil Engineers.
24 Association of Structural Engineers of the Philippines, 2005, National Structural Code of the Philippines, Vol. II, Bridges. 25 Japan Society of Civil Engineers, 1993, Reconnaissance Report on the July 16, 1990 Luzon Earthquake, the Philippines.
The seismic vulnerability of bridges that were revealed from the damages caused by the 1990 North Luzon Earthquake is shown in Table 3.2.2-3. As described in 3.2.2(3)3.2.2(3), serious damages to bridges are mainly attributable to collapse and damages to bridge piers and foundations. To improve the seismic performance of bridges, bridges should be reinforced and/or designed so as to minimize factors that may lead to weak bridge piers and foundations. Of many factors that may lead to weak piers and foundations shown in,Table 3.2.2-3, the effects of soil liquefaction are especially large. The large impacts by soil liquefaction have also been mentioned by Japanese and Filipino experts who surveyed the damages to bridges during the 1990 North Luzon Earthquake.
3-52
Table 3.2.2-3 Bridge Seismic Vulnerability Bridge Damage due to
1990 North Luzon Earthquake Bridge seismic Vulnerability
Damages to and rupture of the foundations of the piles of the pile bent type piers and abutment foundation
・Insufficient rigidity and strength of piles (wooden and reinforced concrete piles)
・Insufficient embedment depth of piles ・Insufficient bearing capacity of the foundation ・Reduced bearing capacity by soil liquefaction ・No consideration on soil liquefaction in the design ・Settlement and runoff of embanked soil at the back of
abutments
Settlement, leaning and falling of the foundation and piers due to liquefaction
Rupture of wall type piers ・Insufficient (or no) reinforcing bars
Damages to and rupture of bearings
・Insufficient bearing support edge distance26 ・Insufficient reinforcing bars in bearing seat concrete ・Insufficient number and strength of anchor bolt ・Many bridges were simply supported (thus a large
number of bearings)
Collapse of girders
・Insufficient seating length ・No unseating prevention structure ・Many bridges were simple supported (no connection of
girders)
2) Importance of Soil Liquefaction Effect on Design of Foundation
Bridges in the Philippines have been designed based on the National Structural Code of Philippines (NSCP, Vol. II BRIDGES). In the first edition of the code, which was issued in 1987, a large part of the AASHTO Standard Specifications for Highway Bridges (1983) was incorporated, including the AASHTO design methods against soil liquefaction. According to reports prepared after the 1990 North Luzon Earthquake by the Philippine Institute for Volcanology and Seismology (PHIVOLCS)27, areas that suffered liquefaction damages during the 1990 North Luzon Earthquake were surveyed and studied immediately after the earthquake. During the study, the liquefaction potentials of soil deposits were assessed by using two assessment methods: that of AASHTO and one that is based on the 1980 specifications of the Japanese Society of Civil Engineers (JSCE); and the results of the AASHTO and JSCE assessments were compared. This suggests that the feasibility of the AASHTO anti-liquefaction methods in Philippines had not been thoroughly checked before the earthquake. It was likely that bridge design engineers in the Philippines started to recognize the effects of soil liquefaction and consider the effects in bridge designs only after the 1990 North Luzon Earthquake based on the results of the study.
3) Recommendation for Seismic Assessment of Existing Bridge
As mentioned in 3.2.2(4)1), best ways to improve the seismic performances of existing
bridges are to reinforce the weak parts of the piers and foundations. The risk of soil
liquefaction, which is the most important factor, should be assessed by surveying the ground
on which the bridges are to be built by using the AASHTO method. If the ground is assessed
to be vulnerable to soil liquefaction, measures should be implemented against soil liquefaction.
In cases that such measures are difficult to implement in terms of cost and range,
reinforcement design of the foundation must be performed by considering soil liquefaction
26 Insufficient distance between the support edge and the edge of the substructure’s crown 27 Philippine Institute of Volcanology and Seismology (PHIVOLCS) website: www.phivolcs.dost.gov.ph
3-53
effects. Reinforcement design
involves the following procedures:
preparing an analytical model of the
foundation and ground by
considering their interactions,
neglecting or reducing the horizontal
resistance of the ground section that
liquefies, loading seismic load, and
proposing seismic reinforcement of
additional piles, etc. so that the
seismic performance of the
foundation and ground satisfies the
necessary level even when
liquefaction occurs. For bridges
where the influence of liquefaction-
induced ground lateral flow is large,
the seismic performance should be
assessed by considering the
influence.
After the reinforcement of the
foundation, piers should be
reinforced, and seismic
reinforcement should be proposed so
that the piers would not receive excessive damage and/or destruction. Because it is very
difficult to restore the foundation after an earthquake, it is also effective to design piers so as
to have less horizontal strength than the foundation as in JRA and prevent the foundation from
being damaged before the piers. In such a design, the bridge resists earthquakes not by
increased strength of the piers but by increased deformation performance of the piers.
Finally, bearing supports are to be reinforced against earthquakes. Bearing supports are
desirably exchanged into those that can resist earthquake loads, but it is usually difficult to
exchange bearing supports while allowing the traffic to pass. In such a case, it is at least
necessary to install an unseating prevention system or take another measure to restrain relative
displacement between the girder and piers even after the bearing supports are damaged or
destroyed. Reports by PHIVOLCS prepared after the earthquake also mention that the
continuity of bridge decks was a most important single factor in earthquake resistant design28.
3.2.3 The 2012 Negros Earthquake
On February 6, 2012 (Monday), at 11:49am, a magnitude 6.7 earthquake struck the central Philippine island of Negros (Figure 3.2.2-1), triggering landslides that toppled houses, collapsed bridges and killed at least 41 people (NDRRMC). At least one aftershock was registered at 6.2 magnitude more than six hours after the quake.
28 Philippine Institute of Volcanology and Seismology (PHIVOLCS) website: www.phivolcs.dost.gov.ph
Date/Time : 06 Feb 2012 - 11:49:11 AM
Location : 09.97°N, 123.14°E - 5 km N 41° W of TAYASAN (NEGROS ORIENTAL)
Depth of Focus (Km) : 10
Origin : TECTONIC
Magnitude : Mb 6.9
Reported Intensities :
Intensity VII - Tayasan, Vallehermoso and Guihulngan; Negros Oriental; Dumaguete City; Intensity VI - La Carlota City and La Castellana, Negros Occidental; Tanjay and Manjuyod, Negros Oriental; Argao, Dalaguete, Barili, Cebu City, Clarin, Bohol Intensity V - Roxas City; Dao and Ivisan, Capiz; Iloilo City; Ayungon, Negros Oriental; Canlaon City; Lapu-lapu City; Guimaras; ; San Carlos City; Bacolod City; Sagay City; Tagbilaran City; Candoni, Binalbagan, Hinigaran, Negros Occidental Intensity IV - San Jose de Buenavista, Pandan, Anini-y, Patnungon, Antique; Banga, Balete, Batab, Kalibo, Numancia, Makatao and New Washington, Aklan; Dipolog City; Sipalay, Negros Occidental; Ormoc City; Santa Barbara, Iloilo Intensity III - Butuan City, Agusan del Norte; Legaspi City, Albay; Carmen, Cagayan de Oro; Tacloban City; Catbalogan; Saint Bernard, Southern Leyte; Masbate, Masbate; Cagayan de Oro City Intensity II - Nabas and Lezo, Aklan; Caticlan and Boracay, Malay Aklan; Cabid-an, Sorsogon City; Borongan, Eastern Samar; Mambajao, Camiguin; Bukidnon Intensity I - Pagadian City
Source:PHIVOLCS
Figure 3.2.2-1 The Negros Oriental Earthquake
3-54
The earthquake rendered at least 10 bridges and three road sections impassable, including one in Dumaguete (Dumaguete North Road) and two in Badian in Cebu (Dalaguete-Manlalongan-Badian Road from Km 112.300 to Km 112.400 and Dalaguete-Manlalongan-Badian Road, Km 111.300) due to cracks/cuts, rock fall, landslides and road slips. In view of the urgency of keeping the public infrastructure functional after a calamity, the DPWH conducted an emergency inspection of bridges along the national roads in Regions VI and VII from February 8-11 29 , 2012. Twenty three (23) bridges were inspected with twelve (12) bridges recommended for reconstruction, five (5) bridges recommended for major repair, five (5) bridges for minor repair and one (1) bridge for routine maintenance. The DPWH report highlighted that the bridges along the inspected road sections are considered “old” bridges with seismically vulnerable features and designed based on previous codes that do not conform to the current seismic design requirements. The report further summarizes the main issues and findings related to seismic vulnerability of the inspected bridges to include;
simply supported bridges are found to have narrow or insufficient seat width making such
bridges prone to fall-down or unseat in the event of large earthquakes,
bridges do not have any restrainer or fall-down device either, making it prone to large movement
and unseating,
shear and bending failure of pile bents causes collapse of most bridges,
bent piles lack confinement reinforcement causing shear failure at point of fixity on the ground,
bent piles lack moment capacity (lacking in longitudinal reinforcement) causing bending failure
of the piles,
tilting of piers causes misalignment and displacement of deck spans,
bearing failure and lack of shear blocks causes transverse translation of superstructure,
critical structural cracks on girders, piers and abutments are observed,
pounding and crushing of concrete are observed at expansion joints with large residual
displacements,
movements of abutment and settlement of approach road behind the abutment are common in
most bridges, and
pavement cracks, fissures and lateral spreading are observed at the approach roads. Table 3.2.3-1 summarizes the major damages on bridges affected by the Negros Oriental Earthquake.
29 DPWH Report “Inspection of Bridges Along National Roads in Region VII (Damaged by February 6, 2012 Magnitude 6.9,
Negros Oriental Earthquake) – Dumaguete North Road (Jct. Bais-Kabankalan-Negros Occidental Boundary)”, BOD
February, 2012.
3-55
Table 3.2.3-1 Damages on Some Bridges Affected by the February 6, 2012 Negros Oriental Earthquake
Bridge Name (Location)
Bridge Type/Description
Findings/Damages Pictures
1. PAGALOAN BRIDGE
(Dumaguete North Road, Negros Or. Km 96+273)
Type: 5-span RCDG with solid shaft/ wall piers
Length: 63.4m
2nd span totally collapsed Severe horizontal cracks on
solid shaft of piers Tilting of Piers 1 and 2 Inadequate support width
of girders at Span 3. Girders are already at edge of coping.
Transverse movement of decks – spans 3 and 4 are offset from centerline alignment.
Large horizontal cracks at pier base
Lack of sufficient seat width and fall-down prevention device causes span collapse
Foundation failure causing pier tilting/out-of plumb
Bearing failure and lack of shear blocks results in residual transverse deck movement
Lack of pier moment capacity/insufficient longitudinal reinforcement as evidenced by large horizontal cracks at pier base.
2. SAN JOSE BRIDGE (Dumaguete North Road, Negros Or. Km 101+620)
Type: 6-spans Half Truss on 2 circular column piers and 2 circular column abutments
Length: 150.9m
Load Posting: 15 ton
Misaligned spans 3 and 4 Settlement of approach
road behind abutment Abnormal movement at
expansion joint (large opening)
Concrete crushed at expansion joints
Severe scaling on concrete deck slab
Corrosion of steel member
Settlement of approach road behind abutment/ embankment failure
Pounding of deck slab ends at expansion joints indicates large longitudinal response
Bearing failure and lack of shear blocks results in residual transverse deck movement
2nd span fell down due to insufficient seat width and lack of fall-down/ unseating prevention device
Pier tilting due to foundation failure
Bearing failure and lack of shear blocks causes off-center transverse movement of decks.
y
Large horizontal cracks at piers indicates moment capacity failure.
Settlement of approach road behind abutment/ embankment failure
Pounding of deck slab ends at expansion joints
3-56
Bridge Name (Location)
Bridge Type/Description
Findings/Damages Pictures
3. TINAYUNAN BRIDGE (Dumaguete North Road,
Negros Or. Km 113+848)
Type: 3-spans Cantilever RCDG on Pile Bents
Length: 24.8m
Load Posting: 20 ton
Total collapse due to shear and bending failure of pile bents
Lack of pile shear confinement and moment capacity causes pile bent collapse.
4. MARTILO BRIDGE (Dumaguete North Road,
Negros Or.)
Type: 3-spans channel beam on pile bent foundation
Length: 15.0m
1-span totally collapsed Severe concrete cracking at
piers.
Lack of sufficient seat
width and fall-down prevention device causes span collapse
Lack of column shear confinement
Tilting of abutment indicates foundation or wall capacity failure.
Bearing failure and lack of shear blocks causes off-center transverse movement of decks.
y
Pile bent failure due to lack of shear confinement and capacity
Pile bent failure
Approach road failure behind abutment
Collapsed of 1st span
Buckling of longitudinal column reinforcing bars due to lack of shear confinement (Pier 1)
3-57
Bridge Name (Location)
Bridge Type/Description
Findings/Damages Pictures
5. HABAG BRIDGE (Dumaguete North Road,
Negros Or. Km 107+842)
Type: 3-span cantilever RCDG on pile bents
Length: 18m
Load Posting: 20 ton
Total collapse due to failure of pile bents
Lack of shear confinement and moment capacity of piles at pile bent caused bridge collapse.
6. LA LIBERTAD BRIDGE (Dumaguete North Road,
Negros Or. Km 104+741)
Type: 8-spans RCDG on 2 rectangular columns and solid shaft abutments
Length: 120.4m
Load Posting: 15 ton
Damage at girder ends of spans 3 & 6 resulting to slab deflection
Extensive deterioration of concrete at abutments, piers and slabs; multiple repairs done
Heavy corrosion of reinforcement resulting to delamination and spalling of concrete at girder ends
Water leakage at deck slab soffit
Damaged slope protection at both abutments.
Bearing failure causes deck settlement at end of span
7. KALAG-KALAG BRIDGE (Dumaguete North Road, Ayungon Section,
Negros Or.)
Type: 1-span RCDG on solid shaft abutment
Length: 10.0m
Cracks at shear keys and end diaphragm of abutment “A”
Cracks, delamination, spalled coping and shear keys of abutment “B”
Multiple cracks and scaling on deck slab (old defects)
Diagonal shear cracks on
Tilting of Abutment B causing end span deck settlement
Large gap at bridge approach road due to bridge collapse
Pile bent failure (at top section) leads to bridge collapse
Settlement of superstructure end due to bearing failure
Cracks, spalling and delamination of concrete at various locations
Pile bent failure
3-58
Bridge Name (Location)
Bridge Type/Description
Findings/Damages Pictures
exterior and interior girders Settlement of “A” and “B”
approaches
8. TAMPOCON BRIDGE (Dumaguete North Road,
Negros Or. Km 80+509)
Type: 3-spans Steel I-girder on solid shaft piers
Length: 47.0m
Tilting and settlement of abutment “A” towards approach “A”
settlement of approach “A” embankment
Crushed sidewalk slab and railings over P1 and P2
Cracks and widespread spalling with exposed reinforcement at P1 and P2 wall columns
Coping cracks Uplift of approach “B”
embankment Cracks and displacement of
abutment “A” slope protection
Abutment A tilting probably due to wall failure or foundation failure
9. OYANGAN BRIDGE
(Dumaguete North Road,
Negros Or. Km 86+512)
Type:
1-span RCDG
Length: 29.1m
Load Posting: 20 ton
Horizontal displacement of superstructure – 140mm to the right
Cracks at exterior girder Cracks and spalling at end
of leftmost RC girder due to horizontal movement
Displacement between abutment and slope protection
300mm pavement crack and settlement of approach “B”
Bearing failure and lack of
shear block causes transverse movement of deck by 140mm.
Ground movement and fissures caused settlement of approach road.
Settlement of approach roads
Cracks at abutment seat due to pounding of ends of deck with abutment backwall
Bearing failure
Tilting of Abutment A towards approach road
Sidewalk and railing damage due to deck pounding
Shear cracks at exterior girder
Transverse movement of exterior girder
140mm movement
3-59
Bridge Name (Location)
Bridge Type/Description
Findings/Damages Pictures
10. P. ZAMORA BRIDGE
(Dumaguete North Road,
Negros Or. Km 109+758)
Type:
1-span RCDG on pile bent
Length: 15.6m
Load Posting: 20 ton
Severe cracks of piles at both abutments
Abutment settlement at both approaches
Cracks and failure of slope protection in front of abutment
Lack of shear and moment
capacity of piles causes severe cracks at pile heads
Ground movement and
fissures caused settlement of approach road.
11. BATERIA BRIDGE
(Dumaguete North Road,
Negros Or. Km 116+654)
Type:
3-spans Steel I-girder on solid shaft piers and RC piles abutment
Length: 80.8m
Horizontal cracks (15mm wide) on all concrete piles at abutment “B”
Cracks at ends of seat extending to backwalls of both abutments
Large movement/opening at expansion joints of Pier 2
Settlement of approach road
Lack of pile capacity
caused severe cracks on piles and abutment
Ground movement and fissures caused settlement of approach road.
Settlement of Approach Road B
300mm settlement
Severe cracks at pile heads
Settlement of approach road
Severe cracks at slope protection in front of abutment
Large horizontal cracks typical to all piles at Abutment B
Leaning/tilting of Abutment A
3-60
Bridge Name (Location)
Bridge Type/Description
Findings/Damages Pictures
Cracks at Abutment A seat extending to the back wall
Settlement of approach road
4-1
CHAPTER 4 CURRENT INFORMATION ON EARTHQUAKE RELATED ISSUES
4.1 Existing Plans for Earthquakes Issues of Concerned Organizations
4.1.1 DPWH (Department of Public Works and Highways)
The current design standards and procedures for all public infrastructure projects undertaken by the DPWH is contained in a four-volume, 12-parts “Design Guideline, Criteria and Standards for Public Works and Highways” (DPWH Guidelines) published in 1982. The DPWH Guidelines incorporate the information, standards and methods for the design of highways, bridges, hydraulic structures (water supply, flood control and drainage), ports and harbors, and buildings (architectural, structural, sanitary, mechanical and electrical). The standards and guidelines are formulated to guide and set the minimum and acceptable limits in solving design problems and provide a more uniform design approach leading to a more efficient and economical design of various public infrastructure projects of the DPWH. Part 4 – Bridge Design of the DPWH Guidelines contains the specifications and provisions for bridge design, including the minimum requirement for earthquake loading. However, since the guidelines are prepared in the early 1980s, the seismic design requirements and procedures are deficient and do not represent realistic seismic forces and structural response under large-scale earthquakes. The devastating effects of the “1990 North Luzon Earthquake” noted such deficiencies in the seismic design of bridges in the Philippines which prompted the DPWH to issue the D.O. 75 requiring the seismic design of bridges to conform to the latest AASHTO Standard Specifications. In 2004, the DPWH attempted to incorporate the AASHTO seismic design procedures and guidelines for bridge retrofit with the DPWH Guidelines and issued a Draft Revision of Part 4 – Bridge Design of the DPWH Guidelines. However, this revision was not issued officially and remains a draft. (1) NRIMP-2 Institutional Capacity Development – “Enhancement of Management and
Technical Processes for Engineering Design in the DPWH”
The need to improve the DPWH’s core business process in Engineering Design and to address the issues of advancement in engineering technology led to the formulation of the Institutional Capacity Development (ICD) under the NRIMP-2 project. As part of the DPWH’s goal to improve the quality of the nation’s infrastructure in a cost-effective and environment-friendly manner using new technologies, the project “Enhancement of Management and Technical Processes for Engineering Design in the DPWH” is formulated as a component of the ICD-NRIMP-2. The objective of the project is to “enhance the engineering design process and upgrade the engineering design standards in DPWH. One key section of the project is the updating and revision of the existing DPWH Guidelines and the standard drawings for Surveys and Site Investigation (Vol. 1), Flood Control and Drainage Design (Vol. 3), Highways Design and Bridge Design (Vol. 4). The development of Volume 4 – Bridge Design will cover bridge architecture, steel and concrete bridges, long span bridges, tunnels, bridge hydraulics, retrofitting of existing bridges and performance-based design, geo-hazard management, environmental safeguard, etc. However, although Volume 4 will cover all aspects of design, the bridge seismic design specifications being developed under the JICA project will be used as the section for earthquake provisions.
4-2
(2) JICA Project – “Study on Improvement of the Bridges Through Disaster Mitigating Measures for Large Scale Earthquakes in the Republic of the Philippines”
To improve bridge performance under large earthquakes, including safety and durability, JICA is undertaking the project “Study on Improvement of the Bridges Through Disaster Mitigating Measures for Large Scale Earthquakes”. The project covers three main components namely: 1) development of the seismic design guidelines for bridges, 2) improvement of bridges inside Metro Manila to have high durability and safety against large
earthquakes, and 3) improvement of bridges outside Metro Manila to have high durability and safety against large
earthquakes. The issues, concerns and problems of the current DPWH seismic design of bridges will be analyzed under the seismic design guidelines development component of the project. Moreover, a draft bridge seismic design specifications and reference materials and examples including retrofit methods will be prepared. Reference codes for the proposed bridge seismic design specifications shall include AASHTO and JRA specifications. Since the current practice in bridge seismic design relies on the AASHTO specifications, a major concern is how to localize provisions of the specifications particularly the ground acceleration coefficients, to which ASEP prepared a 2-zone seismic map of the Philippines, and the AASHTO site response acceleration spectra for different soil types fitting the soil conditions in the Philippines. Moreover, the DPWH still applies the working stress design and the load factor design methods of the AASHTO Specifications which is already replaced by the AASHTO LRFD design procedures. The bridge seismic design specifications to be drafted under this project will include:
the Philippine seismic ground acceleration map,
the acceleration response spectra for the local soil type conditions,
applicable provisions of JRA in soil liquefaction, bridge isolation devices, and foundation design, and
utilize the AASHTO LRFD procedures. DPWH plans to utilize this draft specifications to become a section in Volume 4 – Bridge Design of the revised DPWH Design Guidelines, Criteria and Standards.
4.1.2 ASEP (Association of Structural Engineers of the Philippines)
The JICA Study Team had met with ASEP top officers on May 22, 2012 (headed by then President Engr. Vinci Nicholas R. Villaseñor) and on July 9, 2012 (headed by new president Engr. Miriam L. Tamayo) to obtain current information and data related to earthquakes. In addition, the JICA Study Team had been invited as observers in ASEP meetings for reviewing the earthquake loading provisions of the draft ASEP NSCP Bridge Code. ASEP had completed the drafting of the “National Structural Code of the Philippines 2011, Vol. 2 Bridge Code and Specifications, third edition” which is currently undergoing review internally by the ASEP Review Committee. A copy of the draft was officially provided by ASEP to the JICA Study Team on June 15, 2012 (in reciprocate, JICA Study Team had presented to ASEP for future reference a copy of the English version of the 2002 JRA Specifications for Highway Bridges, Part V Seismic Design).
4-3
The major revision proposed in the draft code is the adoption of LRFD in most part of the structural design based on the 2007 AASHTO LRFD Bridge Design Specifications. However, the provisions on seismic loading has retained much of older code provisions and one of the major concerns of the ASEP Review Committee is the proposed adoption of a set of seismic maps of PGA contours based on a 1994 Phivolcs study. The review mentioned that since the seismic maps are not suitable for design of bridges, ASEP Review Committee is proposing to revert back to the previous seismic zone map (2 zones) but with modified acceleration coefficients — proposal is to increase the acceleration coefficient from 0.4 to a higher value. However, economic considerations including the life span of bridges will also influence the values of the acceleration coefficients. During the July 9 meeting, Dr. Gose had pointed out JICA Study Team’s plan to prepare localized seismic response spectra considering the typical ground characteristics in the Philippines. Upon hearing this, ASEP had expressed very much interest in the JICA Study Team’s plan to develop the localized design specifications and is very willing to collaborate with the team. However, although ASEP is very much interested in preparing the horizontal peak ground acceleration map (especially on the use of probabilistic seismic hazard analysis methodology which is very important in localizing the seismic design code), they are lacking in both technical and financial resources to undertake the this important core task and had requested the JICA study team for consideration and assistance. The JICA Study Team had responded to convey this request to JICA. ASEP further requested if they could be included in the technical working group meetings to get updated with the progress of the study and to share information with the team. Further, ASEP Review Committee had invited JICA Study Team to be observer during ongoing review of the earthquake loading part of the draft ASEP NSCP Bridge Code. Since the draft ASEP NSCP Bridge Code and Specifications has already been planned for publications within this year 2012, they are thinking of releasing the code/specifications in 2012 with the seismic design section as a provisional section pending the output of the JICA Study which ASEP is considering for the 2013 revision of the code.
4.1.3 PHIVOLCS
(1) Useful Data for the Study
PHIVOLCS provides the researches and studies’ results on its website (http://www.phivolcs.dost.gov.ph/). That includes the data and/or information on earthquakes, active faults, volcanic activities, and so on. Hazard maps are downloadable from PHIVOLCS website (Table 4.1.3-1). Research reports are also available from the website.
4-4
Table 4.1.3-1 Available (Down loadable) Data and/or Thematic Maps on PHIVOLCS Website Thematic Maps Extent Scale Quantity
Philippine Fault Zone Map Northern Luzon 1:50,000 3 sheets Central Luzon 1:50,000 7 sheets Infanta 1:50,000 3 sheets Guinayangan 1:50,000 2 sheets Bondoc Peninsula 1:50,000 1 sheet Masbate Island 1:50,000 4 sheets Leyte Island 1:50,000 12 sheets Eastern Mindanao 1:50,000 21 sheets Active Faults and Liquefaction Susceptibility Map
14 regions Non-scale 14 sheets
Distribution of Active Faults & Trenches Nationwide Non-scale 1 sheet Valley Fault Map Marikina Valley Fault Zone 1:10,000 16 sheets Earthquake-triggered Landslide Susceptibility Map
13 Regions Non-scale 13 sheets
Liquefaction Susceptibility Map Nationwide Non-scale 1 sheet National Capital Region Non-scale 1 sheet Tsunami Prone Areas in the Philippines Region I~13、ARMM 1:50,000 46 sheets
(2) Current Cooperative Project with Japan (Enhancement of Earthquake and Volcano
Monitoring and Effective Utilization of Disaster Mitigation Information in the Philippines)
PHIVOLCS has had many experiences of cooperative project of Japanese universities, research institutes, and government organization since its establishment in 1982. Currently PHIVOLCS and JICA are jointly implementing a project named “Enhancement of Earthquake and Volcano Monitoring and Effective Utilization of Disaster Mitigation Information in the Philippines” Since February, 2010. (3) Enhancement of Earthquake and Volcano Monitoring and Effective Utilization of Disaster
Mitigation Information in the Philippines
Overview of this current project is shown below, based on the Record of Discussion between PHIVOLCS and JICA dated on December 8, 2009.
1) Project purpose
Earthquake and volcano monitoring capabilities of PHIVOLCS are enhanced and improved disaster mitigation information is utilized by the disaster management authorities and related organizations.
2) Outputs
1. Improved earthquake information is obtained in real time. 2. Accuracy of evaluation of earthquake generation potential is improved. 3. Integrated volcano monitoring information is obtained in real time. 4. Improved disaster mitigation information is provided through a portal site.
3) Activities
(Activities for Output 1) 1-1-1 To install broadband and strong-motion seismometers and to establish the network. 1-1-2 To install and operate advanced and rapid earthquake source analysis system. 1-2-1 To install real-time intensity meters and to carry out a pilot observation in Manila. 1-2-2 To conduct a nationwide pilot observation based on the result of 1-2-1.
4-5
(Activities for Output 2) 2-1-1 To carry out GPS campaign observation. 2-1-2 To carry out GPS continuous observation. 2-2-1 To conduct geomorphological and geological surveys of inland earthquakes. 2-2-2 To conduct geomorphological and geological surveys of subduction earthquakes. (Activities for Output 3) 3-1-1 To install broadband seismometers and infrasonic sensors at Taal and Mayon volcanoes. 3-1-2 To install and operate real-time transmission and analysis system of seismic and infrasonic
data. 3-2-1 To install GPS receivers at Taal and Mayon volcanoes. 3-2-2 To install and operate real-time transmission and analysis system of GPS data. 3-3-1 To install magneto-telluric meter and total intensity magnetometers at Taal volcano. 3-3-2 To install and operate real-time transmission and analysis system of magneto-telluric and
total intensity magnetic data. (Activities for Output 4) 4-1-1 To construct a portal site of earthquake and volcano disaster mitigation information. 4-1-2 To enhance RED AS to utilize the results from the activities for Output 1 and Output 2. 4-1-3 To develop a simple diagnostic tool for earthquake resistance of houses. 4-1-4 To provide earthquake and volcano information obtained by the project through the portal
site. 4-2 To conduct seminars and trainings on utilizations of the portal site.
4.2 Current Situations of Seismograph Observatories in the Philippines
4.2.1 Situations of Seismograph Observatories
(1) Metro Manila Strong Motion Network (1998)
Location: The Tokyo Institute of Technology and the Philippines Institute of Volcanology and
Seismology (PHIVOLCS) established a strong motion network consisting of 10 stations in Metro
Manila (Figure 4.2.1-1). Installation of instruments was likely to have started in March 1998 and
ended in the early months of year 2000. The stations differ from each other in ground conditions,
and the network is expected to help understand the effects of ground conditions on earthquake
motion properties at the ground surface (Table 4.2.1-1)1,2,3.
Current Condition (working or not): Earthquake motion is being steadily monitored today, and
data is steadily collected. The monitored results are described in the following section.
Contents of Maintenance:Management of the instruments and collection of strong earthquake
motion records (accelerograms) are being mainly conducted by researchers of PHIVOLCS, who
are our collaborators.
1 Yamanaka, H., Ohtawara, K., Grutas, R., Tiglao, R. B., Lasala, M., Narag, I. C., and Bautista, B. C., 2011, Estimation of site amplification and S-wave velocity profiles in metropolitan Manila, the Philippines, from earthquake ground motion records : Exploration Geophysics, 42(1), 69-79. 2 Narag, I. C., Lasala, M., 2012, (modified by Inoue, H.), Earthquake and Tsunami Monitoring in the Philippines
[PowerPoint slides]. 3 Bautista, B., 2012, The Current Status of Earthquake and Tsunami Monitoring Systems in the Philippines [PowerPoint
slides]: ISGC.
4-6
10 Metro Manila(1998)
JSPS fund
Figure 4.2.1-1 Strong Motion Network (Metro manila)
4-7
Table 4.2.1-1 Locations of and Geological Conditions around Observation Stations No. Site Location Classification Longitude, Latitude
1 PHV PHIVOLCS Seismic Vault
Quezon City Central Plateau4 121.0569, 14.6536
2 SKB Smith-Kline Becham Factory,
Cainta, Rizal Sierra Madre
Mountain Range5 121.1347, 14.5914
3 MRK Sta. Elena Elementary School,
Marikina Metro Manila Marikina Valley6 121.0967, 14.6314
7 PAT Pateros Municipal Hall, Pateros Metro Manila
Marikina Valley 121.0822, 14.5456
8 ORT PLDT Ortigas
Pasig City Central Plateau 121.0639, 14.5825
9 MKT NMDA Office, Makati Central Plateau 121.0444, 14.5561
10 SAC San Agustin Church Intramuros,
Manila Coastal Lowland
- -
As shown in Figure 4.2.1-2, strong earthquake motions were monitored in metro Manila in and after 1998 during large earthquakes that mainly occurred in areas far from Manila8. The magnitudes (in the Richter scale) of earthquake motions monitored in 1999 to 2008 and the maximum acceleration values monitored on the ground surface are shown in Figure 4.2.1-39. As shown in this figure, the maximum acceleration in the accelerograms recorded on the ground surface at the stations during this period were about 100 gal or smaller. Even the largest value was only 108 gal, which was observed on December 12, 1999. Therefore, the collected data has, so far, been insufficient for fully understanding the characteristics of acceleration response at the ground surface in the Philippines.
Figure 4.2.1-2 The Epicenters of Observed Earthquakes
(For example, Dec. 1999-2005, 36 earthquakes, M2.7-M6.8, depth: 1-153km)
4 Central Plateau consists of Guadeloupe formation in Tertiary. 5 SKB is located at east edge of Marikina plain near Sierra Madre range. 6 Marikina Valley mainly consists of Quaternary soft alluvium deposit. 7 Costal Lowland along Manila Bay mainly consists of Quaternary soft alluvium deposit 8 Yamanaka, H., Ohtawara, K., Grutas, R., Tiglao, R. B., Lasala, M., Narag, I. C., and Bautista, B. C., 2011, Estimation of
site amplification and S-wave velocity profiles in metropolitan Manila, the Philippines, from earthquake ground motion records : Exploration Geophysics, 42(1), 69-79.
9 Narag, I. C., Lasala, M., 2012, (modified by Inoue, H.), Earthquake and Tsunami Monitoring in the Philippines [PowerPoint slides].
Location : Japan International Cooperation Agency (JICA) and PHIVOLCS started the Nation Strong Motion Network project in 1998 and installed instruments at 34 stations in 2000. The project involved establishment of 29 un-manned seismic stations and 5 volcano observatories so as to cover the entire nation1011.
Current Condition (working or not) : According to Dr. H. Inoue (NIED12), who is a member of the JICA expert team in charge of constructing a new earthquake observation network 13 in the Philippines, almost no sensors are working properly today at the 34 station of the existing network.
Contents of Maintenance : According to Dr. H. Inoue, a member of the JICA expert team, causes for malfunctioning sensors are unknown, but a main possible cause is insufficient maintenance. Possible factors that cause insufficiency of maintenance generally include:
- Insufficiency in human resource for maintaining the instruments - Complicated procedures for procuring and exchanging parts - Defects in the instruments and systems (making impossible to maintain the instruments)
10 Narag, I. C., Lasala, M., 2012, (modified by Inoue, H.), Earthquake and Tsunami Monitoring in the Philippines
[PowerPoint slides]. 11 Bautista, B., 2012, The Current Status of Earthquake and Tsunami Monitoring Systems in the Philippines [PowerPoint
slides]: ISGC. 12 National Research Institute for Earth Science and Disaster Prevention 13 Research Project: Enhancement of Earthquake and Volcano Monitoring and Effective Utilization of Disaster Mitigation
Information in the Philippines
4-9
Figure 4.2.1-4 Strong Motion Network (National)
(3) Strong Motion Network Development installation in 2011-2012
Location: The Philippine Institute of Volcanology and Seismology (PHIVOLCS) will install 27
new motion sensors in provinces near the National Capital Region and in Mindanao to record high-
magnitude earthquakes and other earth movements14.
The sensors to be installed will be those of Kinemetrics, the same type used in the Metro Manila
Network described in (1)15.
Current Condition (working or not): Although the detail is not clear, a sensor was installed in San
Pablo City, Laguna, in February or March 201216,17.
14 Narag, I. C., Lasala, M., 2012, (modified by Inoue, H.), Earthquake and Tsunami Monitoring in the Philippines
[PowerPoint slides]. 15 Narag, I. C., Lasala, M., 2012, (modified by Inoue, H.), Earthquake and Tsunami Monitoring in the Philippines
[PowerPoint slides]. 16 Francis, T. W. & Mario .G. M. and Lasala, M. (2012). The Manila Bulletin Newspaper Online [Interview transcript].
Retrieved from Phivolcs To Install Earthquakes Sensors Web site: http://mb.com.ph/node/353042/phivolc 17 Barbara, M. & Mario .G. M. and Lasala, M. (2012). TJD, GMA News [Interview transcript]. Retrieved from Phivolcs to
install 27 seismic sensors in Luzon and Mindanao Website: http://www.gmanetwork.com/news/story/250775/scitech/science/phivolcs-to-install-27-seismic-sensors-in-luzon-and-mindanao
4-10
27 Near-by MM Provinces
and Davao(2011-2012?)
GOP fund
Cavite/Laguna/Batangas/Rizal/Quezon
3 for eachCity or municipal halls and
PHIVOLCS station
Bulacan/Bataan/Zambales/Pampanga/3 for each
Davao City×12Variety of locations
Figure 4.2.1-5 Strong Motion Network (Near-by MM Provinces and Davao)
(4) Strong Motion Network Development installation in 2010-2014
Location : Broadband seismographs and strong-motion seismographs are to be installed at 10
satellite telemetered earthquake observation stations out of existing 30 stations18,19,20,21.
Broadband seismographs and strong-motion seismographs are to be installed to assist predicting
the time of seismic wave arrival and improve the accuracy of earthquake early warning after an
earthquake. The telemetered network was constructed in 2001 and 2002 but is difficult to monitor
long-period earthquakes because only short-period seismographs were installed22.
18 Narag, I. C., Lasala, M., 2012, (modified by Inoue, H.), Earthquake and Tsunami Monitoring in the Philippines
[PowerPoint slides]. 19 Bautista, B., 2012, The Current Status of Earthquake and Tsunami Monitoring Systems in the Philippines [PowerPoint
slides]: ISGC. 20 Inoue, H., 2012, Enhancement of earthquake and volcano monitoring in the Philippines [PowerPoint slides]: SATREPS
Current Condition (working or not) : According to the project report of 2011, broadband
seismographs and strong-motion seismographs were installed in 5 stations (Virac, Batarasa,
Guimaras, Pagadian, and Lubang) in 2010. In the latter half of 2011, monitoring of earthquake
motion by the installed seismographs was tested. Defects were found in the monitored earthquake
data, and the causes were likely to have been investigated23.
Figure 4.2.1-6 Strong Motion Network (National)
4.2.2 Issues for Future
Studies should be shifted from those that only investigated the initial shock of earthquake motion (to estimate the magnitude and epicenter) to those that analyze the entire seismic waveform (to assess the characteristics of earthquake motion). For the shift, strong motion sensors that cover a wide frequency range and record large accelerograms need to be installed. Strong motion sensors are seismographs that can record motions without failure even during strong earthquakes that may cause structures to collapse.
Only small earthquake motions have been recorded in the Metro Manila Network in these years.
Stations that can monitor strong motions need to be installed in all parts of the Philippines to
Based on the waveform data of strong motions recorded at each station, the following points
should be assessed.
- Characteristics of earthquake motion (either short or long frequency).
- Differences in the characteristics of earthquake motion between sites (intensity and frequency).
- Based on the characteristics of the earthquake motion and regional characteristics, it is necessary
to estimate sites where the responses of structure become large and/or the ground suffers big
displacement.
All monitored data should be published to the general public and researchers via the Internet.
Knowledge can be increased by making the earthquake data in the Philippines accessible to
engineers not only in the Philippines but also in other countries and allowing them to study the
data. In concrete terms, the following datasets are to be published:
- Monitored data in a digital data form
- Positional and geological information of the monitoring point
- Information about the monitoring systems (sensor, monitoring method, etc.)
Although it requires time and labor, it is essential to visit all stations periodically and inspect and
maintain the instruments as necessary. Because this work is difficult to be accomplished by
PHIVOLCS researchers alone, continuous supports should be provided by Japan, which engaged
in the construction of the networks, and other countries.
4.3 Analysis of Recorded Earthquake Ground Motions (EGM)
4.3.1 Analysis Method/Procedure and Results
(1) Purpose of the Analysis
To obtain acceleration response spectra at the ground surface from the earthquake ground motions at the surface observed in the Philippines and identify the characteristics of the response spectra, and to compare the ASSHTO design acceleration response spectra adopted in the Philippines with the acceleration response spectra obtained from the observed earthquake ground motions and confirm the difference in characteristics
4-13
(2) Strong Earthquake Ground Motions
In the Philippines, strong earthquake ground motions have been observed at ten seismological observation stations (Table 4.3.1-1). The table shows the locations of and the geological conditions around the observation stations. Table 4.3.1-2 lists observed earthquake ground motions. The earthquake ground motions at respective observation stations have been provided through the courtesy of PHIVOLCS24.
Table 4.3.1-1 Locations of and Geological Conditions around Observation Stations
No. Site Soil Classification Longitude Latitude Soil-type JRA
Soil-typeAASHTO
1 PHV Central Pateau25 121.0569 14.6536 I I, II
2 SKB Sierra Madre Mountain Range26 121.1347 14.5914 I I, II
3 MRK Marikina Valley27 121.0967 14.6314 II III4 PSY Coastal Lowland28 120.9878 14.5469 II III5 UST Coastal Lowland 120.995 14.6061 II III6 DBM Coastal Lowland 120.9861 14.5931 III IV7 PAT Marikina Valley 121.0822 14.5456 II III8 ORT Central Plateau 121.0639 14.5825 II III9 MKT Central Plateau 121.0444 14.5561 I I,II
10 SAC Coastal Lowland - - III IV Table 4.3.1-2 Totals of data on Observed Earthquake Ground Motions Collected at Respective
24 The waveform data used in this study are produced under the Metro Manila Strong Motion Array Network (MMSTAR) of
the Philippine Institute of Volcanology and Seismology - Department of Science and Technology in collaboration with Tokyo institute of Technology, Japan.
25 Central Plateau consists of Guadeloupe formation in Tertiary 26 SKB is located at east edge of Marikina plain near Sierra Madre range 27 Marikina Valley mainly consists of Quaternary soft alluvium deposit 28 Costal Lowland along Manila Bay mainly consists of Quaternary soft alluvium deposit 29 The waveform data used in this study are produced under the Metro Manila Strong Motion Array Network (MMSTAR) of
the Philippine Institute of Volcanology and Seismology - Department of Science and Technology in collaboration with Tokyo institute of Technology, Japan.
4-14
(3) Analysis Method
The values of acceleration response spectra are aggregated at each location using numerous earthquake ground motions, and averaged to obtain mean acceleration response spectra. Calculations are made at each location and by the geological type. The effects of varying geological conditions on acceleration response spectra can therefore be identified. For aggregating acceleration response spectra, a non-dimensional value (known as the response spectrum magnification factor) is used that is obtained by dividing the value of acceleration response spectrum by the peak acceleration in the earthquake ground motion (equation 4.3.1-1). The response spectrum magnification factor is not directly affected by the difference in peak acceleration of earthquake ground motion. It is therefore possible to obtain an average of response spectra for numerous shapes of spectra. In Section 4.3.2, the value expressed by equation 4.3.1-1 is shown and a comparison is made with ASSHTO design acceleration response spectrum.
N : Number of wave SA : Acceleration response spectra
T : Period (0.05sec~3sec, ⊿t=0.01) Amax : peak Acceleration
i = 1, 2, …., N (4) Analysis Procedure
The Analysis Procedure is shown in Figure 4.3.1-1 below:
Figure 4.3.1-1 Analysis Procedure
・Shapes of Acceleration Response Spectra with ground conditions and locations
・Comparison on the Shapes of Acceleration Response Spectra between Analysis Results and AASHTO Specifications
N
A
TSA
A
TSA
N
i i
i
AVE
51
1 .max
max
51,1,.max
NNiA
TSA
i
i
(Ex. DBM)
DBM, MKT, MRK, ORT, PAT, PHV, PSY, SAC, SKB, UST
10 sites
Time(sec)
(gal)
Wave No.1
Time(sec)
(gal)
Wave No.2
Time(sec)
(gal)
Wave No.51
Amax
Amax
Amax
4-15
(5) Results
In this section, the acceleration response spectra obtained from the earthquake ground motions
with a very small amplitude observed at the ground surface as those in the seismological records
collected in the Philippines are used. The objective is to describe the knowledge that is obtained
by evaluating the characteristics of surface acceleration response spectra in the Philippines using
methods Section (3) and Section (4) discussed above, and the problems involved in evaluation.
The peak accelerations of earthquake ground motions at the ground surface observed throughout
the Philippines in 1999 through 2011 are shown in Figure 4.3.1-2 and Figure 4.3.1-3. The figures
show that the peak accelerations observed at various locations were very small, mostly 20 gals or
less. At the time of an Mw7.1 earthquake of December 11, 1999 in southwestern Luzon Island, a
peak acceleration of 129 gals was observed at MRK observation point. Insufficient data is,
however, available on strong earthquake motions while records of strong motions of 500 gals or
more are available in Japan. This may be because small-scale earthquakes occurred near
observation points in the Philippines and because the earthquake source was far from the
observation point even when the earthquake was of a slightly large scale.
As described above, the peak accelerations of earthquake ground motions at the ground surface
were extremely small, so small earthquake ground motions were transmitted from the earthquake
source to the engineering seismic base layer. The ground response while the earthquake ground
motions were transmitted from the engineering seismic base layer to the ground surface stayed in a
nonlinear area with a small shear strain. It is assumed that the initial stiffness of the ground
remained almost unchanged.
In the case where a large-scale earthquake occurs near the observation point, large earthquake
ground motions are transmitted from the earthquake source to the engineering seismic base layer.
The ground response while the earthquake ground motions are transmitted from the engineering
seismic base layer to the ground surface reaches a nonlinear area with a large shear strain. The
initial stiffness of the ground is expected to decrease.
Ground has a natural period according to the thickness and hardness of surface layer. Seismic
waves closer to the natural period tend to travel farther. In the case where soft ground has greater
thickness, waves of longer period generally travel. Waves of shorter period become weak in the
case where thick accumulation layers exist because of energy absorption and become predominant
in hard ground.
As the scale of earthquake increases, the natural period increases further in moderately hard
ground or in soft ground because the ground becomes plastic (Figure 6.3.1-4). Then, the long-
period elements increase in earthquake ground motions at the ground surface. As multiple layers
are plasticized in the ground, response increases not only for some long-period elements but also
for short-period elements near long-period elements rather than only some elements of natural
period increasing. In the case where the earthquake is of a small scale, the peak acceleration of the
earthquake ground motions observed at the ground surface Amax and the acceleration response
spectrum obtained from the earthquake ground motion at the surface SA are both small. The
SA/Amax ratio is therefore likely to entail errors. In the case where the ratio is calculated using the
records of small earthquake ground motions observed, errors generally induce over-evaluation.
4-16
The records of small earthquake ground motions observed in Metro Manila enable the
confirmation of period ranges with large acceleration response spectra for earthquake ground
motions that propagate through the slightly plasticized ground and are observed at the ground
surface. No characteristics are well known of the acceleration response spectra for earthquake
ground motions that propagate through the highly plasticized ground and are observed at the
ground surface during a large-scale earthquake.
In moderately hard ground soft ground that become considerably plastic during a large-scale
earthquake, no effects of plasticization of the ground due to the increase of period can be
considered in the case where the amplification characteristics of the ground are evaluated based on
small earthquake ground motions. The amplification characteristics of the ground on the long-
period side therefore are likely to be under-estimated.
4-17
1999 2005 20110
20
40
60
80
100
1999 2005 20110
20
40
60
80
100
1999 2005 20110
20
40
60
80
100
1999 2005 20110
20
40
60
80
100
1999 2005 20110
20
40
60
80
100
1999 2005 20110
20
40
60
80
100
120
140
year (1999-2011) year (1999-2011)
year (1999-2011) year (1999-2011)
year (1999-2011) year (1999-2011)
Peak Horizontal Acceleration(gal)
Peak Horizontal Acceleration(gal)
Peak Horizontal Acceleration(gal)
Peak Horizontal Acceleration(gal)
Peak Horizontal Acceleration(gal)
Peak Horizontal Acceleration(gal)
MKT PHV
SKB UST
PAT MRK
Dec.11.1999
Source: The waveform data used in this study are produced under the Metro Manila Strong Motion Array Network
(MMSTAR) of the Philippine Institute of Volcanology and Seismology - Department of Science and Technology in collaboration with Tokyo institute of Technology, Japan.
Figure 4.3.1-2 Peak Horizontal Acceleration
4-18
1999 2005 20110
20
40
60
80
100
1999 2005 20110
20
40
60
80
100
1999 2005 20110
20
40
60
80
100
1999 2005 20110
20
40
60
80
100
year (1999-2011) year (1999-2011)
year (1999-2011) year (1999-2011)
Peak Horizontal Acceleration(gal)
Peak Horizontal Acceleration(gal)
Peak Horizontal Acceleration(gal)
Peak Horizontal Acceleration(gal)
ORT PSY
SAC DBM
Source: The waveform data used in this study are produced under the Metro Manila Strong Motion Array Network
(MMSTAR) of the Philippine Institute of Volcanology and Seismology - Department of Science and Technology in collaboration with Tokyo institute of Technology, Japan.
Figure 4.3.1-3 Peak Horizontal Acceleration
4-19
Period(sec)
Spe
ctr
a A
ccele
ration
Period(sec)
0.5 1.0 1.5 2.0 2.5 3.00 0.5 1.0 1.5 2.0 2.5 3.00
1
2
3
4P
eak
Accele
ration
Spe
ctr
a A
ccele
ration
Peak
Accele
ration
1
2
3
4
Period(sec)
0.5 1.0 1.5 2.0 2.5 3.00
Spe
ctr
a A
ccele
ration
Peak
Accele
ration
1
2
3
4
Large-ScaleEarthquakeSmall-ScaleEarthquake
Large-ScaleEarthquakeSmall-ScaleEarthquake
Firm ModerateFirm
SoftLarge-ScaleEarthquakeSmall-ScaleEarthquake
Figure 4.3.1-4 Changes in Acceleration Response Spectrum Due to the Difference in Nonlinear
Behavior of the Ground under Large and Small Earthquake Ground Motions
4-20
4.3.2 Records of Earthquake Ground Motions30
The acceleration response spectra obtained at various observation points in the Philippines using the methods describe in Sections (3) and (4) are shown in Figure 4.3.2-1 through Figure 4.3.2-4. The figures also present the AASHTO design acceleration response spectra. In this section, the characteristics of the observed acceleration response spectrum are considered. The difference between the observed acceleration response spectra and the AASHTO design acceleration response spectra are also examined considering the problems with the results of analysis in the case where the records of observed small earthquake ground motions explained in Section 4.3.1.
In the acceleration response spectra in hard ground at MKT and PHV, a peak exists in a period
range of 0.5 second or less and the value starts declining nearly at a period of 0.5 second. This is in
good agreement with the AASHTO design acceleration response spectra for hard ground. Ground
is much harder at SKB in rock mass than at MKT and PHV on a plateau. At SKB, therefore,
response is great only around a period of 0.1 second and the value declines considerably beyond a
period of 0.1 second.
In moderately hard ground at PAT, ORT and PSY, acceleration response spectrum increases until
a period of 0.85 second. If it is taken into consideration that the results are based on ground
motions observed during a small-scale earthquake, response is expected to increase beyond a
period of 0.85 second during a large-scale earthquake because of the prolongation of period due to
the plasticization of ground. The present AASHTO design acceleration response spectra have been
defined so that response may increase nearly to a period of 0.85 second. If a large-scale earthquake
occurs in the Philippines, therefore, acceleration response is likely to exceed the value designated
in the AASHTO design acceleration response spectra beyond a period of 0.85 second.
In the soft ground at DBM, acceleration response spectrum tends to increase nearly to a period of
1.1 seconds. If it is taken into consideration that the results are based on ground motions observed
during a small-scale earthquake, response is expected to increase beyond a period of 1.1 seconds
during a large-scale earthquake because of the prolongation of period due to the plasticization of
ground. Specifically, response is likely to increase even beyond a period of 1.3 seconds until which
the AASHTO design acceleration response is bigger.
30 Ground Motion Records are referred to Yamanaka, H., Ohtawara, K., Grutas, R., Tiglao, R. B., Lasala, M., Narag, I. C., and Bautista, B. C., 2011, Estimation of site amplification and S-wave velocity profiles in metropolitan Manila, the Philippines, from earthquake ground motion records : Exploration Geophysics, 42(1), 69-79.
4-21
0.0 0.5 1.0 1.5 2.0 2.5 3.00
1
2
3
4
0.24 0.45(sec)
: Ground Motion at MKT station (Firm ground) Spectral Acceleration
Peak Acceleration
Period (sec)
h=0.05
Soil Type-Ⅰ(AASHTO 2007)
Soil Type-Ⅱ(AASHTO 2007)
0.0 0.5 1.0 1.5 2.0 2.5 3.00
1
2
3
4: Ground Motion at PHV station (Firm ground)
Spectral Acceleration
Peak Acceleration
Period (sec)
h=0.05
Soil Type-Ⅰ(AASHTO 2007)
0.33(sec)
Soil Type-Ⅱ(AASHTO 2007)
0.0 0.5 1.0 1.5 2.0 2.5 3.00
1
2
3
4: Ground Motion at SKB station (Firm ground)
Spectral Acceleration
Peak Acceleration
Period (sec)
h=0.05
Soil Type-Ⅰ(AASHTO 2007)
0.11(sec)
Soil Type-Ⅱ(AASHTO 2007)
Figure 4.3.2-1 Comparison of Acceleration Spectra for Different Site Conditions and Design
Spectra (Firm gGound)
4-22
0.0 0.5 1.0 1.5 2.0 2.5 3.00
1
2
3
4: Ground Motion at PAT station (Moderate firm ground)
Spectral Acceleration
Peak Acceleration
Period (sec)
h=0.05
Soil Type-Ⅲ(AASHTO 2007)
0.43(sec) 0.85(sec)
0.0 0.5 1.0 1.5 2.0 2.5 3.00
1
2
3
4: Ground Motion at MRK station (Moderate Firm ground)
Spectral Acceleration
Peak Acceleration
Period (sec)
Soil Type-Ⅲ(AASHTO 2007)
0.47(sec)
h=0.05
0.0 0.5 1.0 1.5 2.0 2.5 3.00
1
2
3
4: Ground Motion at PSY station (Moderate firm ground)
Spectral Acceleration
Peak Acceleration
Period (sec)
h=0.05
Soil Type-Ⅲ(AASHTO 2007)
0.48(sec) 0.85(sec)
Figure 4.3.2-2 Comparison of Acceleration Spectra for Different Site Conditions and Design
Spectra (Moderate Firm Ground)
4-23
0.0 0.5 1.0 1.5 2.0 2.5 3.00
1
2
3
4: Ground Motion at ORT station (Moderate firm ground)
Spectral Acceleration
Peak Acceleration
Period (sec)
h=0.05
Soil Type-Ⅲ(AASHTO 2007)
0.31(sec) 0.85(sec)
0.0 0.5 1.0 1.5 2.0 2.5 3.00
1
2
3
4
0.0 0.5 1.0 1.5 2.0 2.5 3.00
1
2
3
4: Ground Motion at UST station (moderate firm ground)
Spectral Acceleration
Peak Acceleration
Period (sec)
h=0.05
Soil Type-Ⅲ(AASHTO 2007)
: Ground Motion at UST station (Moderate firm ground)
Spectral Acceleration
Peak Acceleration
Period (sec)
h=0.05
Soil Type-Ⅲ(AASHTO 2007)
0.24(sec)
Figure 4.3.2-3 Comparison of Acceleration Spectra for Different Site Conditions and Design Spectra (Moderate Firm Ground)
4-24
0.0 0.5 1.0 1.5 2.0 2.5 3.00
1
2
3
4: Ground Motion at SAC station (Soft ground)
Spectral Acceleration
Peak Acceleration
Period (sec)
Soil Type-Ⅳ(AASHTO 2007)
1.05 1.31(sec)
0.0 0.5 1.0 1.5 2.0 2.5 3.00
1
2
3
4
h=0.05
Spectral Acceleration
Peak Acceleration
Period (sec)
:: Ground Motion at DBM station (Soft ground)
Soil Type-Ⅳ(AASHTO 2007)
0.95 1.12 1.31(sec)
Figure 4.3.2-4 Comparison of Acceleration Spectra for Different Site Conditions and Design Spectra (Soft Ground)