187
The provision of neonatal services Data for international comparisons Michael Hallsworth, Alice Farrands, Wija J. Oortwijn, Evi Hatziandreu
| Date post: | 17-Nov-2018 |
| Category: |
Documents |
| Upload: | truongtram |
| View: | 212 times |
| Download: | 0 times |

The provision of neonatal services
Data for international comparisons
Michael Hallsworth, Alice Farrands, Wija J. Oortwijn,
Evi Hatziandreu


The provision of neonatal services
Data for international comparisons
Michael Hallsworth, Alice Farrands,
Wija J. Oortwijn, Evi Hatziandreu
Prepared for the National Audit Office

The RAND Corporation is a nonprofit research organization providing objective analysis and effective solutions that address the challenges facing the public and private sectors around the world. RAND’s publications do not necessarily ref lect the opinions of its research clients and sponsors.
R® is a registered trademark.
© Copyright 2007 RAND Corporation
All rights reserved. No part of this book may be reproduced in any form by any electronic or mechanical means (including photocopying, recording, or information storage and retrieval) without permission in writing from RAND.
Published 2007 by the RAND Corporation1776 Main Street, P.O. Box 2138, Santa Monica, CA 90407-2138
1200 South Hayes Street, Arlington, VA 22202-50504570 Fifth Avenue, Suite 600, Pittsburgh, PA 15213-2665
Westbrook Centre, Milton Road, Cambridge CB4 1YG, United KingdomRAND URL: http://www.rand.org/
RAND Europe URL: http://www.rand.org/randeuropeTo order RAND documents or to obtain additional information, contact
Distribution Services: Telephone: (310) 451-7002; Fax: (310) 451-6915; Email: [email protected]
The research described in this report was prepared for the National Audit Office.

i
Dedication
This report is dedicated to the memory of Alice Farrands.


iii
Preface
The National Audit Office (NAO) is undertaking a Value for Money study of neonatal services in England. As part of this study, RAND Europe was commissioned to gather information on neonatal services in countries other than England. This information will supplement the evidence the NAO gathers on England and will allow for international comparisons and benchmarking.
As requested by the NAO, the report presents data gathered from a thorough search of the literature on the status and provision of neonatal services in the UK nations of Scotland, Wales, Northern Ireland and the United States of America, Canada, Sweden, and Australia. The report also compares relevant neonatal statistics for England against those for the nations named above, although England is not the report’s main focus.
The report presents a comparative analysis of neonatal services, followed by chapters on specific countries. The information is presented along five dimensions defined by the NAO: 1) trends in high-risk births and associated outcomes, including mortality and co-morbidities; 2) organisation and scale of neonatal services; 3) neonatal transport services; 4) costs of neonatal services and 5) best practices for infants and their families.
RAND Europe is an independent not-for-profit policy-research organisation whose mission is to help improve policy and decision-making through research and analysis. This report has been peer reviewed in accordance with RAND’s quality assurance standards.
For more information about RAND Europe or this document, please contact:
Dr Evi Hatziandreu
RAND Europe Westbrook Centre Milton Road Cambridge CB4 1YG United Kingdom Tel: +44-1223-353329 [email protected]


v
Contents
Dedication.................................................................................................................... i Preface........................................................................................................................ iii Glossary of selected terms used in this report ...............................................................ix
Table of Figures...........................................................................................................xi Table of Tables ......................................................................................................... xiii Summary ....................................................................................................................xv
Acknowledgments......................................................................................................xxi
CHAPTER 1 Introduction ....................................................................................1
1.1 The context of the study.................................................................................... 1
1.2 Improvements in neonatal services..................................................................... 1
1.3 The Neonatal Intensive Care Services Review Group......................................... 2
1.4 Regionalised neonatal care................................................................................. 3
1.5 Best practices and recent studies ........................................................................ 3
1.6 The structure of this report................................................................................ 4
CHAPTER 2 Comparative Analysis.......................................................................5
2.1 Statistics on births and outcomes....................................................................... 5
2.1.1 Trends in preterm births....................................................................... 5
2.1.2 Trends in low birth weight births ......................................................... 8
2.1.3 Trends in mortality rates..................................................................... 10
2.1.4 Trends in morbidity – cerebral palsy cases .......................................... 17
2.1.5 “Snapshot” summary of statistics ........................................................ 18
2.2 Organisation and scale of provision of neonatal services................................... 20
2.2.1 Scotland, Wales and Northern Ireland................................................ 20
2.2.2 Australia, Canada, Sweden, U.S.......................................................... 21
2.3 Transport services............................................................................................ 26
2.3.1 Scotland, Wales and Northern Ireland................................................ 26
2.3.2 Australia, Canada, Sweden, U.S.......................................................... 28
2.4 Costs of neonatal services ................................................................................ 30
2.5 Best practices................................................................................................... 30
2.5.1 Scotland, Wales and Northern Ireland................................................ 30
2.5.2 Australia, Canada, Sweden, U.S.......................................................... 31
2.5.3 The Cochrane Collaboration .............................................................. 34

The provision of neonatal services: international comparisons RAND Europe
vi
CHAPTER 3 Scotland......................................................................................... 35
3.1 Summary......................................................................................................... 35
3.1.1 Key features ........................................................................................ 35
3.1.2 Key learning points ............................................................................. 35
3.2 Statistics and trends ......................................................................................... 35
3.2.1 Preterm and low birth weight babies ................................................... 35
3.2.2 Mortality rates .................................................................................... 37
3.2.3 Neonatal morbidity ............................................................................ 38
3.3 Organisation and scale of provision of neonatal services................................... 38
3.4 Transport services ............................................................................................ 40
3.5 Costs of neonatal services................................................................................. 41
3.6 Best practices and guidelines ............................................................................ 41
CHAPTER 4 Wales ............................................................................................. 44
4.1 Summary......................................................................................................... 44
4.1.1 Key features ........................................................................................ 44
4.1.2 Key Learning Points............................................................................ 44
4.2 Statistics and trends ......................................................................................... 44
4.2.1 Preterm and low birth weight births.................................................... 44
4.2.2 Mortality Rates ................................................................................... 46
4.2.3 Neonatal morbidity ............................................................................ 47
4.3 Organisation and scale of provision of neonatal services................................... 48
4.4 Transport services ............................................................................................ 49
4.5 Costs of neonatal services................................................................................. 50
4.6 Best practices and guidelines ............................................................................ 51
4.7 Evaluation processes ........................................................................................ 52
CHAPTER 5 Northern Ireland ........................................................................... 53
5.1 Summary......................................................................................................... 53
5.1.1 Key features ........................................................................................ 53
5.1.2 Key learning points ............................................................................. 53
5.2 Statistics and trends ......................................................................................... 54
5.2.1 Preterm and low birth weight births.................................................... 54
5.2.2 Mortality rates .................................................................................... 54
5.2.3 Neonatal morbidity ............................................................................ 55
5.3 Organisation and scale of provision of neonatal services................................... 56
5.4 Transport services ............................................................................................ 60
5.5 Costs of neonatal services................................................................................. 61
5.6 Best practices and guidelines ............................................................................ 61
CHAPTER 6 United States of America................................................................ 63
6.1 Summary......................................................................................................... 63
6.1.1 Key features ........................................................................................ 63
6.1.2 Key learning points ............................................................................. 63

RAND Europe Summary
vii
6.2 Statistics and trends......................................................................................... 64
6.2.1 Preterm births..................................................................................... 64
6.2.2 Low birth weight births ...................................................................... 65
6.2.3 Mortality rates .................................................................................... 66
6.2.4 Neonatal morbidity ............................................................................ 67
6.3 Organisation and scale of provision of neonatal services................................... 68
6.4 Transport services............................................................................................ 73
6.5 Costs of neonatal services ................................................................................ 78
6.6 Best practices and guidelines............................................................................ 79
CHAPTER 7 Canada...........................................................................................83
7.1 Summary......................................................................................................... 83
7.1.1 Key features ........................................................................................ 83
7.1.2 Key Learning Points ........................................................................... 83
7.2 Statistics and trends......................................................................................... 84
7.2.1 Preterm births..................................................................................... 84
7.2.2 Low birth weight births ...................................................................... 85
7.2.3 Mortality rates .................................................................................... 86
7.2.4 Neonatal morbidity ............................................................................ 87
7.3 Organisation and scale of provision of neonatal services................................... 88
7.4 Transport services............................................................................................ 95
7.5 Costs of neonatal services ................................................................................ 97
7.6 Best practices and guidelines............................................................................ 99
CHAPTER 8 Australia.......................................................................................103
8.1 Summary....................................................................................................... 103
8.1.1 Key features ...................................................................................... 103
8.1.2 Key learning points........................................................................... 103
8.2 Statistics and trends....................................................................................... 104
8.2.1 Preterm births................................................................................... 105
8.2.2 Low birth weight births .................................................................... 105
8.2.3 Mortality rates .................................................................................. 106
8.2.4 Neonatal morbidity .......................................................................... 107
8.3 Organisation and scale of provision of neonatal services................................. 108
8.4 Transport services.......................................................................................... 113
8.5 Costs of neonatal services .............................................................................. 118
8.6 Best practices and guidelines.......................................................................... 119
CHAPTER 9 Sweden.........................................................................................123
9.1 Summary....................................................................................................... 123
9.1.1 Key features ...................................................................................... 123
9.1.2 Key learning points........................................................................... 124
9.2 Statistics and trends....................................................................................... 124
9.2.1 Preterm births................................................................................... 124

The provision of neonatal services: international comparisons RAND Europe
viii
9.2.2 Low birthweight births ..................................................................... 125
9.2.3 Mortality rates .................................................................................. 126
9.2.4 Neonatal morbidity .......................................................................... 128
9.3 Organisation and scale of provision of neonatal services................................. 129
9.4 Transport services .......................................................................................... 132
9.5 Costs of neonatal services............................................................................... 133
9.6 Best practices and guidelines .......................................................................... 134
REFERENCES........................................................................................................ 137
Reference List .......................................................................................................... 139
APPENDICES ........................................................................................................ 151
Appendix A: Methodology....................................................................................... 152
Obtaining data and information .............................................................................. 152
Published Literature Search Strategy .............................................................. 152
Expert consultations ...................................................................................... 153
Locating “grey” literature and country-specific reports ................................... 154
United States of America ............................................................................... 154
Canada ......................................................................................................... 155
Australia ........................................................................................................ 155
Sweden ......................................................................................................... 156
List of search terms used for literature review ........................................................... 156
Statistics on trends in preterm and low weight babies..................................... 156
Organisation and scale of provision of neonatal services................................. 157
Transport services .......................................................................................... 158
Costs of neonatal services............................................................................... 158
Trends in outcomes including mortality and co-morbidities .......................... 158
Best practices in care for babies and their parents ........................................... 159

ix
Glossary of selected terms used in this report
Term Definition
Infant mortality Death occurring within one year of birth, excluding stillbirths.
Level I care As the report makes clear, definitions of what constitutes Level I care vary from country to country. The British Association of Perinatal Medicine gives a basic definition of Level I neonatal units as ‘units providing special care but not aiming to provide any continuing high dependency or intensive care’.1
Level II care Similarly, definitions of what constitutes Level II care vary from country to country. The British Association of Perinatal Medicine gives a basic definition of Level II neonatal units as ‘units providing high dependency care and some short-term intensive care as agreed within the network’.2
Level III (or “tertiary”) neonatal care
Definitions of what constitutes Level III care vary from country to country. The British Association of Perinatal Medicine gives a basic definition of Level III neonatal units as ‘units providing the whole range of medical neonatal care but not necessarily all specialist services such as neonatal surgery’.3
Neonatal mortality Death occurring between birth and 28 days of life, excluding stillbirths.
Perinatal mortality Death occurring between birth and 7 days of life, excluding stillbirths.
A more detailed table of information on the British Association of Perinatal Medicine’s level of care model is provided overleaf.
1 British Association of Perinatal Medicine (2001), 'Standards for Hospitals Providing Neonatal Intensive and High Dependency Care (2nd edition)', London: British Association of Perinatal Medicine.
2 Ibid.
3 Ibid.

The provision of neonatal services: international comparisons RAND Europe
x
Table 1.1 BAPM neonatal levels of care model4
Level of care
BAPM category Location Lead carer Support carer Care
I Normal Care Home, GP/Midwife Unit, Maternity Unit I-III
Mother + wider family
Midwife, Neonatal Nurse, Paediatrician
Advice and supervision, birth examination, vitamin K administration, discharge examination, screening programme, parental support and education
II Special Care Maternity Unit I-III, Postnatal Ward, Transitional Ward, Special Care Baby Unit
Midwife, Specialist neonatal nurse, Mother
Paediatrician, Midwife, Specialist Neonatal Nurse
Care and treatment exceeding normal care includes Level I care
III Level 2 High Dependency Intensive Care
Maternity Unit II-III, Special Care Baby Unit, Neonatal Intensive Care
Paediatrician/ Neonatalogist
Specialist Neonatal Nurse
Continuous skilled supervision but not as intensive as Level IV, parenteral nutrition, respiratory support, intra arterial monitoring, includes Level I care
IV Level 1 Maximal Intensive Care
Maternity Unit II-III, Neonatal Intensive Care
Neonatologist Specialist Neonatal Nurse, Other consultant specialities
Continuous highly skilled supervision, assisted ventilation, circulatory support, peritoneal dialysis, post-op care, intensive parental support, Includes Level 1 Care
4 Scottish Executive Health Department, (2001) A Framework for Maternity Services in Scotland, Table 21, p.56.

xi
Table of Figures
Figure 2.1 Trends in preterm births, UK, 1995-2004 ................................................................6
Figure 2.2 Trends in preterm births, non-UK, 1995-2004.........................................................7
Figure 2.3 Trends in low birth weight births, UK, 1995-2004...................................................8
Figure 2.4 Trends in low birth weight births, non-UK, 1995-2004............................................9
Figure 2.5 Trends in perinatal mortality, UK, 1995-2004........................................................11
Figure 2.6 Trends in perinatal mortality, non-UK, 1995-2004 ................................................13
Figure 2.7 Trends in neonatal mortality, UK, 1995-2004........................................................14
Figure 2.8 Trends in neonatal mortality, non-UK, 1995-2004.................................................15
Figure 2.9 Trends in infant mortality, UK, 1995-2004............................................................16
Figure 2.10 Trends in infant mortality, non-UK, 1995-2004 ..................................................17
Figure 3.1 Trends in all preterm (<37 weeks’ gestation) births, Scotland, 1995-2005...............36
Figure 3.2 Trends in low birth weight births, Scotland, 1995-2005 .........................................37
Figure 3.3 Trends in perinatal, neonatal and infant mortality, Scotland, 1995-2005................38
Figure 4.1 Trends in all preterm (<37 weeks’ gestation) births, Wales, 2000-2005...................45
Figure 4.2 Trends in low birth weight births, Wales, 1995-2004 .............................................46
Figure 4.3 Trends in perinatal, neonatal and infant mortality, Wales, 1995-2005....................47
Figure 5.1 Trends in low birth weight births, Northern Ireland, 1997-2005............................54
Figure 5.2 Trends in neonatal and infant mortality, Northern Ireland, 1995-2005 ..................55
Figure 6.1: Trends in preterm births in the USA, 1994-2005 ..................................................65
Figure 6.2: Trends in low birth weight births in the USA, 1994-2005 .....................................66
Figure 6.3: Trends in perinatal, neonatal and infant mortality, USA, 1994-2005.....................67
Figure 6.4: Percentage of low birth weight deliveries by state and level of hospital, USA, 1989 and 1998..........................................................................................................71
Figure 6.5: Frequency of usage of road transport by institutions providing neonatal transport, self-reported, USA, 2007 ....................................................................................75

The provision of neonatal services: international comparisons RAND Europe
xii
Figure 6.6: Frequency of usage of helicopter transport by institutions providing neonatal transport, self-reported, USA, 2007 ......................................................................75
Figure 6.7: Frequency of usage of fixed wing aircraft transport by institutions providing neonatal transport, self-reported, USA, 2007 ......................................................76
Figure 6.8: Distribution of self-reported number of annual neonatal transports, USA, 2007..........................................................................................................................77
Figure 7.1: Trends in preterm (less than 37 weeks’ gestation) births in Canada 1991-2004, using two datasets ............................................................................................85
Figure 7.2: Trends in low birth weight (less than 2,500g) births, Canada, 1993-2004 ...................................................................................................................................86
Figure 7.3: Trends in perinatal, neonatal and infant mortality, 1994-2004 ..............................87
Figure 7.4: Incidence of cerebral palsy amongst a sample of Canadian live births with 24-30 weeks’ gestation, 1993-2002 .............................................................................88
Figure 8.1: Perinatal and infant death period definitions used by NPDC and NPSU, Australia ...............................................................................................................104
Figure 8.2: Trends in all births under 37 weeks’ gestation, Australia,1995-2004 ....................105
Figure 8.3: Trends in low birth weight births, Australia, 1995-2004 ......................................106
Figure 8.4:Trends in perinatal, neonatal and infant mortality, Australia, 1995-2004..............107
Figure 9.1: Trends in all preterm (under 37 weeks’ gestation) births, Sweden, 1995-2003 .................................................................................................................................125
Figure 9.2: Trends in low birth weight births, Sweden, 1995-2005........................................126
Figure 9.3: Trends in perinatal mortality, Sweden, 1995-2003...............................................127
Figure 9.4: Trends in neonatal mortality, Sweden, 1995-2003 ...............................................127
Figure 9.5: Trends in infant mortality, Sweden, 1995-2003...................................................128
xiii
Table of Tables
Table 1.1 BAPM neonatal levels of care model .......................................................................... x
Table 2.1 Summary of statistics for England & Wales, Wales, Northern Ireland, Scotland, Sweden, Canada, Australia and the U.S., 2004 (except where stated) ..................19
Table 2.2 Service organisation: comparison table for non-UK countries...................................23
Table 2.3 Neonatal transport: comparison table for non-UK countries ....................................29
Table 2.4 Best practices: comparison table for non-UK countries.............................................32
Table 3.1 Annual costs of running a cot in a neonatal unit, Scotland .......................................41
Table 3.2 Neonatal Levels of Care Model ................................................................................43
Table 5.1 Morbidity Outcomes for Very Low Birth weight Infants, Northern Ireland, 2005......................................................................................................................56
Table 5.2 Number of cots by care level by hospital, Northern Ireland, 2007............................57
Table 5.3 Medical Staff and Enhanced Neonatal Nurse Practitioners (ENNPs) contributing to the rota in post on 1st January 2006............................................................59
Table 7.1: Rates of neonatal beds per 1,000 births, by Province, Canada .................................91
Table 7.2: Organisation of acute transport in British Columbia: Priority Categories ................97
Table 7.3: Average and total hospital costs for newborns, 2002-3 ............................................98
Table 7.4 Public Health Agency of Canada’s guideline ratios of neonatologists to babies (2000)....................................................................................................................100
Table 8.1: Live births by admission to special care nursery or neonatal intensive care unit and state and territory, 2004......................................................................................109
Table 8.2: Victoria NETS transfers by type and mode of transport, Australia, 2002-6.......................................................................................................................................116
Table 8.3: Composition of personnel present on transport missions for the Victoria Neonatal Emergency Transport Service, Australia, 2002-5................................................118


xv
Summary
1. The National Audit Office (NAO) is undertaking a Value for Money study of neonatal services in England. As part of this study, RAND Europe was commissioned to generate relevant data to supplement the evidence that the NAO gathers on England.
2. This report describes the provision of neonatal services in the UK nations of Scotland, Wales, Northern Ireland, and the United States of America, Canada, Sweden, and Australia. Its main purpose is to provide a compendium of relevant data to facilitate comparisons and benchmarking of neonatal services (organisation, statistics, and so on) in England with the above nations. The report does not consider the provision of neonatal services in England itself, although it does compare relevant statistics for England against the countries named above. Since the report is concerned with international comparisons, it does not analyse differences within countries.
3. The RAND Europe study collected data in a structured and systematic way that reflected five research dimensions, which were identified by the NAO. These dimensions were: 1) statistics on trends in high-risk births and associated outcomes, including mortality and co-morbidities; 2) the organisation and scale of neonatal services; 3) neonatal transport services; 4) costs of neonatal services and 5) best practices for infants and their families.
4. This summary chapter provides the main findings of the study. Chapter Two provides wider inter- and intra-country analysis and comparisons. Chapters Three to Nine provide more specific and detailed information on the various countries studied.
Neonatal intensive care improves the prognoses of its patients
5. Neonatal intensive care increases the survival rates of newborns, particularly those with low birth weight or gestational age. Effective neonatal care also improves morbidity rates, improving the long-term health prospects and quality of life for premature or low birth weight babies. In doing so the long-term burden on state sponsored health and social care systems is reduced.
6. The improvement in the prognosis of very preterm infants during the last decades has been attributed primarily to improvements of neonatal intensive care, including the introduction of surfactant and antenatal steroid therapy. For example, a U.S. study found that two-thirds of the decline in mortality among Very Low Birth Weight (VLBW) infants observed during the early 1990s could be attributed to increases in the effectiveness of

The provision of neonatal services: international comparisons RAND Europe
xvi
newborn intensive care.5 However, there has been a much slower improvement in mortality or morbidity rates in recent years.
Comparing neonatal care across countries is problematic, yet can generate useful information
7. It is difficult to compare neonatal care across countries and regions. Substantial disparities in populations, geographies and access to services must be taken into account. In addition, comparisons of neonatal morbidity and mortality require effective measures for adjusting for varying population health characteristics. Each country structures its health services differently, according to variations in history and underlying political philosophies. Contrasting amounts and types of information are available for each country because of their distinct information infrastructures and reporting mechanisms. There is no co-ordinated data set that countries are required to gather, nor are the parameters of particular data always the same. For example, babies may be considered premature if born before 32 or 37 weeks’ gestation.
8. Nevertheless, the comparisons that are possible can provide illuminating results. Comparisons can offer a wider context for assessing performance and highlight possible benchmarks for evaluation practices. They can suggest innovative practices for improving performance, both at the level of patient care and at the level of service organisation.
Perinatal, neonatal and infant mortality rates in England appear to be within a similar range to the other countries compared
9. Our analysis of statistics and trends related to neonatal care suggests that England has rates of perinatal, neonatal and infant mortality that are similar to those found in Scotland, Wales, Northern Ireland, Australia and Canada. Mortality rates are consistently higher than this group in the U.S., and consistently lower in Sweden.
10. Broadly speaking, there has been an overall downward trend in mortality rates for the countries studied, including England.
11. Demand for neonatal services in England (measured by the proxy of low birth weight births) is similar to Scotland, Wales and the U.S., and significantly higher than Australia, Canada and Northern Ireland. The rate of low birth weight births is much lower in Sweden than in all other countries studied.
All the countries use some neonatal networks in the provision of neonatal services, although these networks are formalised to varying degrees
12. In England, Northern Ireland, Scotland and Wales, neonatal services are provided by the branch of the National Health Service (NHS) dedicated to that region, and therefore are funded and overseen by the regional government. In the UK, only England has a formal neonatal clinical network, although some units, particularly in Scotland and Northern 5 Richardson, D., et al. (1998), ‘Declining Severity Adjusted Mortality: Evidence of Improving Neonatal Intensive Care’, Pediatrics 102:4, 893-99.

RAND Europe Summary
xvii
Ireland, do utilise an informal networked approach due in part to the geographical distribution of the units.
13. As might be expected from their large geographical area, the U.S., Australia and Canada have highly regionalised neonatal services, provided at the state or sub-state level. The organisation of neonatal networks is based on the demand for care and the ability to supply such care, both of which are affected by geographical factors. In these three countries, regional networks have developed their own practices of neonatal service provision that reflect the region’s population size and distribution, its geography, history and culture, and its current political, legal and financial situation.
14. Of the countries considered in this report, only Sweden is moving towards a more centralised system of neonatal care. Although the Swedish health care system is mainly region-based, neonatal intensive care is increasingly centralised due to the relatively few children that require neonatal intensive care.
Low staffing is a pervasive problem for UK neonatal services
15. Low staffing levels is a pervasive problem in UK neonatal services: all three regions of the UK fall short of the recommended staffing levels laid down by the British Association of Perinatal Medicine (BAPM). Scotland is well-staffed at consultant level, but lacking in neonatal nurses. Northern Ireland has a particular deficit of nurses, and staffing levels in Wales are critical at both the consultant and specialised nursing levels. In particular, there is evidence that the absence of dedicated neonatal transport teams produces staffing problems on neonatal wards. Across the UK as a whole in 2006, 78 per cent of neonatal units had to turn babies away because of lack of capacity. This figure is eight per cent higher than in 2005.
16. There was little evidence of shortages in staffing or cots in the non-UK neonatal networks considered in this report. However, in Canada, the demand for neonatal intensive care unit (NICU) beds sometimes exceeds the number officially available, and this may be aggravated by nursing shortages; there is also some concern that the number of nurses nationwide in the U.S. is low.
Neonatal transport teams may be co-ordinated centrally for a regional network or may be affiliated to a tertiary care institution
17. Broadly speaking, neonatal transport teams are provided either in a centrally co-ordinated, formal structure, servicing all the hospitals in a specified region, or they are maintained by regional tertiary care institutions and retrieve neonates for transport to that institution. This is rather a crude distinction, since there are many varying degrees of network organisation between these two variants.
18. It appears that the centrally co-ordinated transport teams generally exist in regions that have developed networks that are more sophisticated in other respects, and they are often supported by effective information-gathering and communications structures. This is true for the networks in California, British Columbia, Victoria and New South Wales, for example. Of the three UK regions, only Scotland has designated neonatal transport teams, and a centralised transport network.

The provision of neonatal services: international comparisons RAND Europe
xviii
19. There are three basic models of transport team dealing with neonatal transfers: specialist neonatal teams; paediatric teams; and unified paediatric/neonatal teams. The existence of one or more of these team types varies greatly according to networks. Sweden has no specialised neonatal transport teams, but its ambulance services are locally based and organised in close contact with local health centres, ensuring they are responsive to changing needs.
Only a few countries report systematically on the cost of neonatal service provision
20. Obtaining aggregated cost data for countries is problematic, since reporting structures vary greatly between countries. The countries that provided the best nationwide data were generally those with some form of universal health care system, but this was not always true. The financial structure of the U.S. health system means that administrative records are geared towards measuring charges rather than costs.
21. Most of the cost data available was provided at a regional level, or referred to a particular institution that had been the subject of an academic study. The studies were conducted across varying time periods and used different currencies, and therefore it is not possible to make meaningful quantitative comparisons. However, the major debates regarding neonatal costs concern expenditure on babies at the limit of survival viability, and how much of neonatal spending should be directed towards technologies, rather than other elements of care.
Evidence suggests that British Columbia, Victoria, New South Wales and California lead the way in the development of high-quality neonatal service provision
22. As noted above, regional neonatal networks vary within and between countries because of geographic, demographic, financial and historical factors. The evidence gathered for this study suggested that there were four regions that had evolved particularly sophisticated neonatal networks: British Columbia, Victoria, New South Wales and California. The elements that constitute this quality and sophistication include: communications and administration systems; transport techniques; centralised decision-making and oversight bodies; data sharing infrastructures; best practice guidelines; reporting mechanisms (both inside and outside the network); the use of consultative committees; procedures to boost family involvement; quality improvement provisions; and evaluation exercises (in particular, those allowing benchmarking).
23. The highlighting of these three regional networks does not mean that other networks are poor. Some networks that serve smaller, or more dispersed, populations, and which contain a limited number of institutions, may rely on more informal networking practices because economies of scale do not justify the costs of formalising these practices.
24. Furthermore, it is more difficult to highlight the practices of particular networks when they are subsumed within a global structure such as the UK’s National Health Service. However, the evidence suggested that the infrastructure supporting neonatal services in Wales is less developed than in Scotland or Northern Ireland, with an absence of

RAND Europe Summary
xix
systematic data collection, and no dedicated neonatal transport system. However, the causal impact of this less developed infrastructure on neonatal mortality rates is not clear, and may require further analysis.
25. Best practice guidelines were issued by a combination of medical associations, government agencies, or individual hospitals. The source and existence of government guidelines varied across countries: when they existed, they were either issued by national or regional bodies, and contained varying levels of detail. All the non-UK countries studied adhered to a basic Level I/II/III care structure, but equally these countries reported that the interpretation and implementation of this structure varied greatly between regional networks.


xxi
Acknowledgments
We would like to acknowledge several people who helped with our inquiries into the country studies: Professor Alison Macfarlane, Prof Neil Marlow, Dr Gopi Menon, Wendy Scott-Williams, Dr Ben Stenson, Dr Andrew Lyon, Dr Phil Booth, Dr Jim Chalmers, Dr Maggie Redshaw, Dr Liz Draper, Dr Liz Reaney, Dr Richard Tubman, Dr Janet Tucker, Dr Andy Leslie, Dr James Moorcraft, and Polly Ferguson. Tom Ling and Eddy Nason reviewed the draft report and provided many helpful suggestions.


1
CHAPTER 1 Introduction
1.1 The context of the study
The National Audit Office (NAO) is undertaking a Value for Money study of neonatal services and an examination of the implementation of neonatal networks in England. As part of this study, the NAO commissioned RAND Europe to generate relevant data to supplement the evidence the NAO will gather from England and to allow for comparisons and benchmarking. This report describes the provision of neonatal services in the UK nations of Scotland, Wales, Northern Ireland, and the United States of America, Canada, Sweden, and Australia. The UK countries were selected because they may indicate methods of organising neonatal services that differ from those in England, while still existing within the common framework of the National Health Service. The non-UK countries were selected for the following reasons: they are all OECD member states with a similar level of economic development; they have contrasting health systems (from the private-sector based structure of the U.S. to the universal health coverage of Canada); and many of them adopt a ‘federal’ type structure, with differing regions co-ordinating neonatal networks within a single country, which can be seen as analogous to the differing regions that exist within the UK. Sweden was included because it offers an example of how another European country organises neonatal services within a centralised health system.
The main purpose of the report is to provide a compendium of relevant data to facilitate comparisons and benchmarking of neonatal services (organisation, statistics, and so on) in England with the above nations. Since the report is concerned with international comparisons, it does not analyse differences within countries.
1.2 Improvements in neonatal services
Maternal and newborn care services are a cornerstone of public health services. In the past 20 years, significant advances in knowledge and technologies in the fields of perinatal and neonatal medicine have resulted in substantial declines in infant mortality rates. A major factor contributing to the reduction of mortality and long-term outcomes for premature
The provision of neonatal services: international comparisons RAND Europe
2
and ill newborns has been the development of the intensive care units.6 7 The main risk factors for neonatal illness are low gestational age and LBW.
In 1975 almost one out of two babies born prematurely with birth-weight of 1,500g or less died in the perinatal and neonatal period (28 days after birth); by 1995 this ratio has fallen to one in six.8 Evidence provided in the BLISS Baby Report9 shows that premature babies of even 27/28 weeks’ gestation age had an 88 per cent survival rate. The increase in effectiveness parallels an increase in demand for these services. Currently, around 10-12 per cent of all babies born in the UK, (approximately 80,000 babies), require some form of special care at birth and one to three per cent require the services of the neonatal intensive care units (NICUs).10 11
1.3 The Neonatal Intensive Care Services Review Group
In 2003 the Department of Health convened an Expert Working Group to provide advice on the “most effective ways of caring for the very sick or very premature newborn babies”.12 The resulting Report of the “Neonatal Intensive Care Services Review Group” explicitly recommended that hospitals work more closely together in the forms of structured, managed clinical networks as a means to improve the delivery of safe and effective services to mothers and babies. Within each network different hospitals provide a mix and range of the appropriate level of care. Moreover, it was suggested that the recommendations made had the potential to contribute to the national target of reducing the inequality gap in infant mortality rates by 10 per cent, and that overall 200-300 lives every year could be saved by the restructuring of neonatal care services. Currently, there are 24 neonatal networks across England;13 their structure and effectiveness varies widely over
6 Department of Health Expert Working Group on Neonatal Intensive Care Services (2003), Report of the Neonatal Intensive Care Services Review Group. Available at: http://www.dh.gov.uk/prod_consum_dh/groups/dh_digitalassets/@dh/@en/documents/digitalasset/dh_4018744.pdf
7 American Academy of Pediatrics (2004), 'Policy Statement: Levels of Neonatal Care', Pediatrics, 114:5, 1341-47.
8 Gilbert, W.M., Nesbitt, T.S., and Danielsen, B. (2003), 'The cost of prematurity: quantification by gestational age and birth weight', Obstetrics and Gynecology, 102:3, 488-92.
9 BLISS (2005), Special Care for Sick Babies: Choice or Chance? London.
10 Ibid.
11 Department of Health Expert Working Group on Neonatal Intensive Care Services (2003), 'Report of the Neonatal Intensive Care Services Review Group'. Available at: http://www.dh.gov.uk/prod_consum_dh/groups/dh_digitalassets/@dh/@en/documents/digitalasset/dh_4018744.pdf
12 Ibid.
13 www.neonatal.org.uk

RAND Europe Introduction
3
the country. Marlow and Gill provide a thoughtful discussion of issues related to neonatal networks.14
1.4 Regionalised neonatal care
The concept of regionalised neonatal care was first introduced and articulated in the 1970s in the U.S. and its importance was further reaffirmed in the 1990s.15 Its rationale is that within the regionalised system, networks consisting of hospitals and facilities with differing types of neonatal units, personnel and technology, are available at each level of care (normal, special, high dependency and intensive care) as deemed appropriate for specific patient needs. This is intended to facilitate optimal outcomes and the provision of seamless pathways of care.16
1.5 Best practices and recent studies
Recommendations for best practices have been developed in other countries and specific sub-national regions. Indicative examples of the latter include the 2005 Neonatal Services Guidelines of the State of Victoria in Australia, and the 2002 Specialised Perinatal Services Provincial Plan of British Columbia17 18
Studies have examined the costs of prematurity, LBW and neonatal care, especially in the U.S.19 20 21 22 23 24 25 26 In the UK, a recent study looked at the potential impact of
14 Marlow, N., Bryan Gill, A. (2007), 'Establishing neonatal networks: the reality', Archives of Disease in Childhood. Fetal and Neonatal Edition, 92:2, 137-42.
15 Stark, A. (2004), ‘Policy Statement: Committee on Fetus and Newborn: Levels of Neonatal Care’, Paediatrics, 114:5, 1341-47.
16 Turrill, S. (2000), 'Is access to a standardized neonatal intensive care possible?', Journal of Nursing Management, 8, 49-56.
17 Victoria Government Department of Human Resources (2005), Neonatal Services Guidelines: Defining Levels of Care in Victorian Hospitals.
18 British Columbia Women's Hospital and Health Centre & PHSA (2002), Specialised Perinatal Services Provincial Plan. 19 Cuevas, K.D., et al. (2005), 'The cost of prematurity: hospital charges at birth and frequency of rehospitalizations and acute care visits over the first year of life: a comparison by gestational age and birth weight', American Journal of Nursing, 105: 7, 56-64.
20 Draper, E.S., et al. (2004), 'The potential impact on costs and staffing of introducing clinical networks and British Association of Perinatal Medicine standards to the delivery of neonatal care', Archives of Disease in Childhood: Fetal and Neonatal Edition, 89, 236-40.
21 Gilbert, W.M., Nesbitt, T.S., and Danielsen, B. (2003), 'The cost of prematurity: quantification by gestational age and birth weight', Obstetrics and Gynaecology, 102:3, 488-92.
22 Khoshnood, B., et al. (1996), 'Models for determining cost of care and length of stay in neonatal intensive care units', International Journal of Technology Assessment in Health Care, 12:1, 62-71.
23 Petrou, S., et al. (2003), 'The impact of preterm birth on hospital inpatient admissions and costs during the first five years of life', Pediatrics, 112:6, 1290-97.

The provision of neonatal services: international comparisons RAND Europe
4
introducing clinical networks and the British Association Standards to the delivery of neonatal care in terms of costs and staffing.27
1.6 The structure of this report
The next chapter provides an overview of main findings and a summary comparison of the countries examined along the dimensions of:
1) Statistics and trends;
2) Organisation and scale of neonatal services;
3) Transport Services;
4) Costs; and
5) Best practices.
24 Richardson, D.K, et al. (2001), 'A critical review of cost reduction in neonatal intensive care. I. The structure of costs', Journal of Perinatology, 21:2, 107-15.
25 Rogowski, J. (1999), ‘Measuring the cost of neonatal and perinatal care’, Paediatrics, 103:1, 329-35.
26 Tudehope, D.I., et al. (1989), 'Cost analysis of neonatal intensive and special care', Australian Paediatric Journal, 25:2, 61-5.
27 Clements, K.M., et al. (2007), 'Preterm birth associated cost of early intervention services: an analysis by gestational age', Pediatrics, 119:4, 866-74.
5
CHAPTER 2 Comparative Analysis
This Chapter gives an overview and a summary of the findings. These are presented according to the five research question dimensions. In each section, first the results among the UK nations are presented, followed by the comparative data from the U.S, Canada, Australia and Sweden.
2.1 Statistics on births and outcomes
This section compares the statistics relating to births and outcomes for England (where available) to those for Scotland, Wales, Northern Ireland, the U.S., Canada, Australia and Sweden. The aim is to facilitate comparisons between the various data sets, and so the time period from 1995 to 2004 has been selected, during which data were available for nearly all years in that period for every country. In order to make the comparisons more manageable (and the supporting graphs more intelligible), the chapter deals with UK and non-UK countries separately. This section covers the following statistical indexes: 1) trends in preterm births; 2) trends in low birth weight births; 3) trends in perinatal, neonatal and infant mortality rates and 4) trends in neonatal morbidities.
2.1.1 Trends in preterm births Statistics on preterm births are presented in this report as indicators of the demand for neonatal services, rather than as indicators of the efficacy of such services. The Office for National Statistics did not collect data on preterm births in England prior to 2005, because gestational age is not recorded at registration for live births.28 Since a search for alternative sources proved fruitless, figures for preterm births for England cannot be provided as a point of comparison. Similarly, data was unavailable for Northern Ireland.29 The figures for Wales show that, in the time series available, the rate of preterm births was relatively stable at just under 8.0 per cent of total live births.30 In contrast, Scotland has seen its rates
28 Information accompanying the release of Office of National Statistics, Preterm births for 2005. Available at: http://www.statistics.gov.uk/StatBase/Product.asp?vlnk=14882&More=Y
29 http://www.dhsspsni.gov.uk/births2005.pdf
30 National Community Child Health Database (NCCHD): Births in Wales 2005. Available at: http://new.wales.gov.uk/topics/statistics/headlines/health-2007/hdw20070614/?lang=en

The provision of neonatal services: international comparisons RAND Europe
6
of preterm births rise from 7.3 of total live births in 1995 to 8.2 in 2004, a 13.6 per cent increase.31 Figure 2.1 illustrates these trends.
Figure 2.1 Trends in preterm births, UK, 1995-2004
0
2
4
6
8
10
12
14
1995 1996 1997 1998 1999 2000 2001 2002 2003 2004
Year
% o
f to
tal liv
e b
irth
s w
ith
<3
7 w
ee
ks
' g
es
tati
on
Scotland
Wales
31 ISD Scotland National Statistics (2006), 'All births by term and birthweight'. Available at: http://www.isdscotland.org/isd/files/mat_bb_table7.xls (ed.), Excel.

RAND Europe Comparative Analysis
7
The rate of babies born with less than 37 weeks’ gestation has increased in the U.S.,32 Canada33 and Australia34 over the decade 1994-2004. Broadly speaking, Canada and Australia started with similar rates of preterm births (7.0 per cent of total live births in 1995 for Canada, 7.1 per cent in the same year for Australia) and experienced roughly equivalent increases in those rates between 1995 and 2004 (a 12.9 per cent rise for Canada, and a 15.5 per cent rise for Australia). However, it should be noted that data availability means that the Australian figures on gestation age at birth refer to all births using the WHO criteria, rather than just live births; this contrasts with the data given for Canada and the U.S. Rates in the U.S. started from a much higher point (11.0 per cent of total live births in 1995), although they increased at a similar rate to Canada and Australia (15.5 per cent between 1995 and 2004). Sweden’s rates were considerably lower than Australia, Canada, and the U.S., and have remained stable. 35 Figure 2.2 illustrates these trends; note that the Australian data are measured against the denominator of all live births, despite the fact that they incorporate stillbirths.
Figure 2.2 Trends in preterm births, non-UK, 1995-2004
0
2
4
6
8
10
12
14
1995 1996 1997 1998 1999 2000 2001 2002 2003 2004Year
% o
f to
tal liv
e b
irth
s w
ith
<3
7 w
ee
ks
' g
es
tati
on
U.S.
Canada
Australia
Sweden
32 National Center for Health Statistics (2006), National Vital Statistics Report, 55, No. 1, p.78.
33 Statistics Canada, Canadian Vital Statistics, Birth Database. Available at: http://www.statcan.ca
34 Australian Institute of Health and Welfare National Perinatal Statistics Unit (1997-2006), Australia’s mothers and babies, 1995-2004.
35 STAKES National Research and Development Centre for Welfare and Health, Perinatal statistics in the Nordic countries: Statistical Summary 28/2005, 1 November 2005. Available at: http://www.stakes.fi/NR/rdonlyres/BDE35D36-E9BF-4CF6-9363-197B758BC512/0/0528taulut.pdf
The provision of neonatal services: international comparisons RAND Europe
8
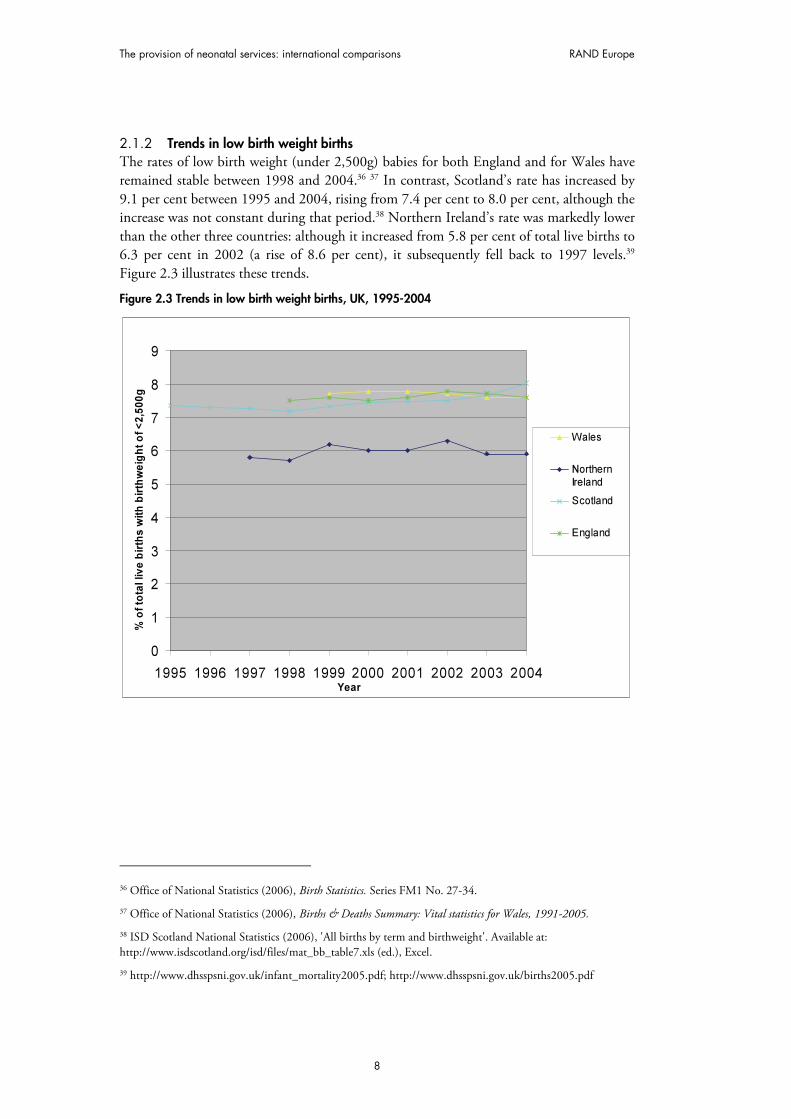
2.1.2 Trends in low birth weight births The rates of low birth weight (under 2,500g) babies for both England and for Wales have remained stable between 1998 and 2004.36 37 In contrast, Scotland’s rate has increased by 9.1 per cent between 1995 and 2004, rising from 7.4 per cent to 8.0 per cent, although the increase was not constant during that period.38 Northern Ireland’s rate was markedly lower than the other three countries: although it increased from 5.8 per cent of total live births to 6.3 per cent in 2002 (a rise of 8.6 per cent), it subsequently fell back to 1997 levels.39 Figure 2.3 illustrates these trends.
Figure 2.3 Trends in low birth weight births, UK, 1995-2004
0
1
2
3
4
5
6
7
8
9
1995 1996 1997 1998 1999 2000 2001 2002 2003 2004Year
% o
f to
tal liv
e b
irth
s w
ith
bir
thw
eig
ht
of
<2
,50
0g
Wales
NorthernIreland
Scotland
England
36 Office of National Statistics (2006), Birth Statistics. Series FM1 No. 27-34.
37 Office of National Statistics (2006), Births & Deaths Summary: Vital statistics for Wales, 1991-2005.
38 ISD Scotland National Statistics (2006), 'All births by term and birthweight'. Available at: http://www.isdscotland.org/isd/files/mat_bb_table7.xls (ed.), Excel.
39 http://www.dhsspsni.gov.uk/infant_mortality2005.pdf; http://www.dhsspsni.gov.uk/births2005.pdf
RAND Europe Comparative Analysis
9
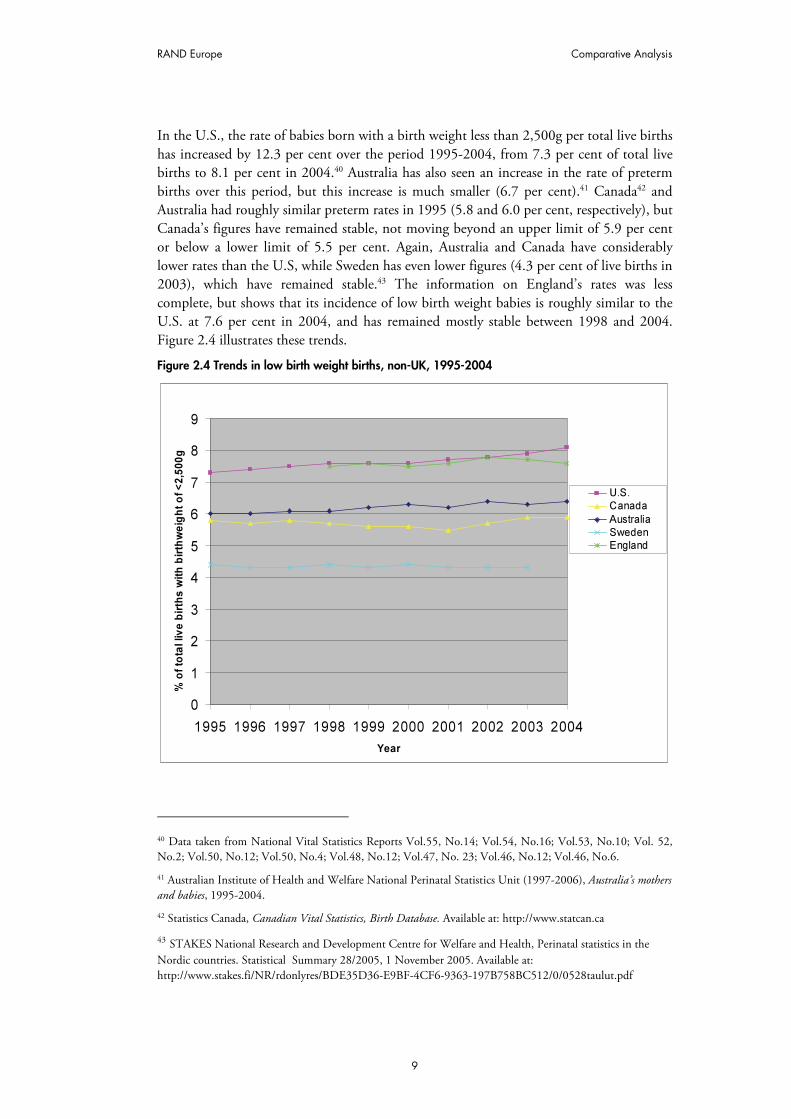
In the U.S., the rate of babies born with a birth weight less than 2,500g per total live births has increased by 12.3 per cent over the period 1995-2004, from 7.3 per cent of total live births to 8.1 per cent in 2004.40 Australia has also seen an increase in the rate of preterm births over this period, but this increase is much smaller (6.7 per cent).41 Canada42 and Australia had roughly similar preterm rates in 1995 (5.8 and 6.0 per cent, respectively), but Canada’s figures have remained stable, not moving beyond an upper limit of 5.9 per cent or below a lower limit of 5.5 per cent. Again, Australia and Canada have considerably lower rates than the U.S, while Sweden has even lower figures (4.3 per cent of live births in 2003), which have remained stable.43 The information on England’s rates was less complete, but shows that its incidence of low birth weight babies is roughly similar to the U.S. at 7.6 per cent in 2004, and has remained mostly stable between 1998 and 2004. Figure 2.4 illustrates these trends.
Figure 2.4 Trends in low birth weight births, non-UK, 1995-2004
0
1
2
3
4
5
6
7
8
9
1995 1996 1997 1998 1999 2000 2001 2002 2003 2004
Year
% o
f to
tal liv
e b
irth
s w
ith
bir
thw
eig
ht
of
<2
,50
0g
U.S.
Canada
Australia
SwedenEngland
40 Data taken from National Vital Statistics Reports Vol.55, No.14; Vol.54, No.16; Vol.53, No.10; Vol. 52, No.2; Vol.50, No.12; Vol.50, No.4; Vol.48, No.12; Vol.47, No. 23; Vol.46, No.12; Vol.46, No.6.
41 Australian Institute of Health and Welfare National Perinatal Statistics Unit (1997-2006), Australia’s mothers and babies, 1995-2004.
42 Statistics Canada, Canadian Vital Statistics, Birth Database. Available at: http://www.statcan.ca
43 STAKES National Research and Development Centre for Welfare and Health, Perinatal statistics in the Nordic countries. Statistical Summary 28/2005, 1 November 2005. Available at: http://www.stakes.fi/NR/rdonlyres/BDE35D36-E9BF-4CF6-9363-197B758BC512/0/0528taulut.pdf

The provision of neonatal services: international comparisons RAND Europe
10
2.1.3 Trends in mortality rates This section considers mortality rates for the following categories: a) perinatal mortality (death within seven days of birth); b) neonatal mortality (death within 28 days of birth); and c) infant mortality (death within one year of birth). The section considers the figures for each of these categories, and then discusses what overall conclusions can be drawn from the interaction of these rates.
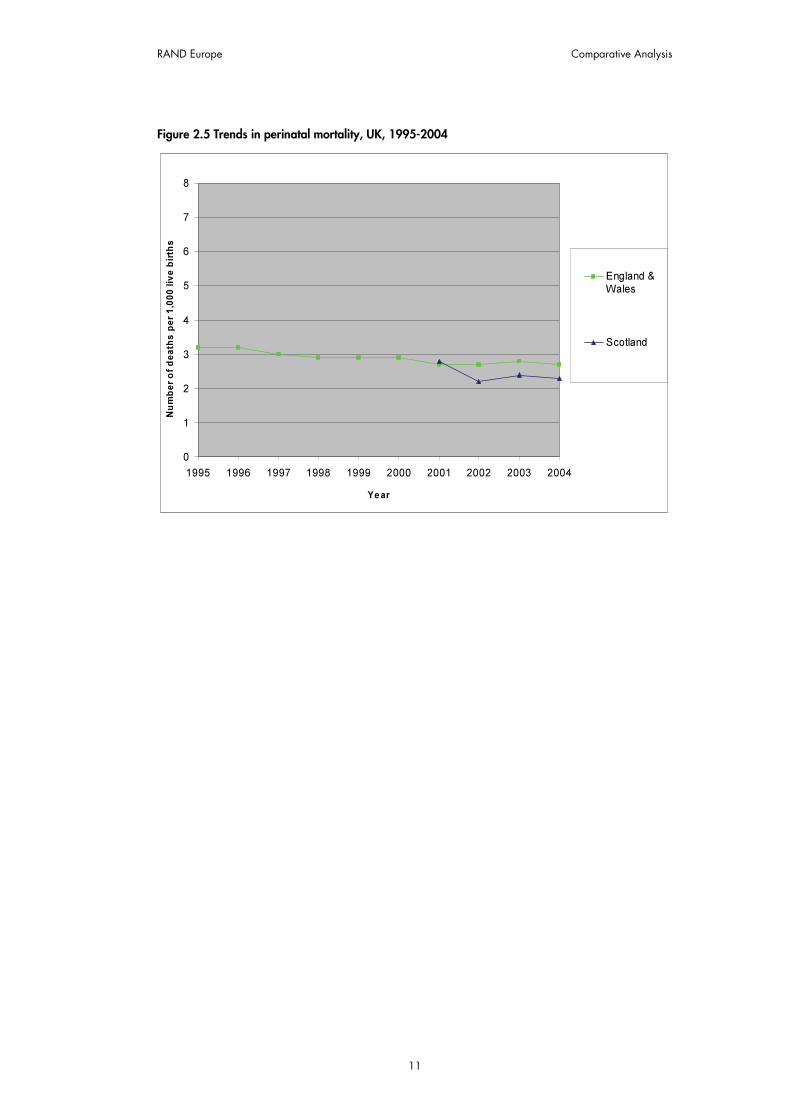
Perinatal Mortality: Gathering data on perinatal mortality was problematic because Northern Ireland includes stillbirths in its figures for perinatal mortality, whereas this study was concerned only with deaths after birth.44 This is also true of the data contained in the Office of National Statistics’ Health Statistics Quarterly.45 To ensure valid comparisons, these data have not been included. Scotland only offered suitable figures for the period 2001-2004.46 In addition, it was not possible to obtain appropriate disaggregated data for England and Wales, and therefore a combined figure for the two countries has been presented.47 It was possible to obtain figures for Wales alone, but they did not correlate with the data for England and Wales, and therefore have not been used.48
Despite these problems, the data indicates that perinatal mortality rates have declined in both datasets. The rate for England and Wales declined by 15.6 per cent between 1995 and 2004 (from 3.2 deaths per 1,000 live births to 2.7 deaths), and in Scotland it declined by 17.9 per cent between 2001 and 2004 (from 2.8 deaths per 1,000 live births to 2.3 births). Of course, caution should be taken in drawing conclusions from such a small number of data points). Figure 2.5 illustrates these trends.
44 http://www.dhsspsni.gov.uk/infant_mortality2005.pdf
45 National Statistics (2006), Health Statistics Quarterly 32: Winter 2006. Available at: http://www.statistics.gov.uk/downloads/theme_health/HSQ32.pdf.
46 National Health Services Scotland (2005), Scottish Perinatal and Infant Mortality and Morbidity Report, (Edinburgh), Table 1.
47 Office of National Statistics. Available at: http://www.statistics.gov.uk/STATBASE/Expodata/Spreadsheets/D9405.xls
48 Office of National Statistics (2006), Births & Deaths Summary: Vital statistics for Wales, 1991–2005.
RAND Europe Comparative Analysis
11
Figure 2.5 Trends in perinatal mortality, UK, 1995-2004
0
1
2
3
4
5
6
7
8
1995 1996 1997 1998 1999 2000 2001 2002 2003 2004
Year
Nu
mb
er
of
de
ath
s p
er
1,0
00
liv
e b
irth
s
England &Wales
Scotland

The provision of neonatal services: international comparisons RAND Europe
12
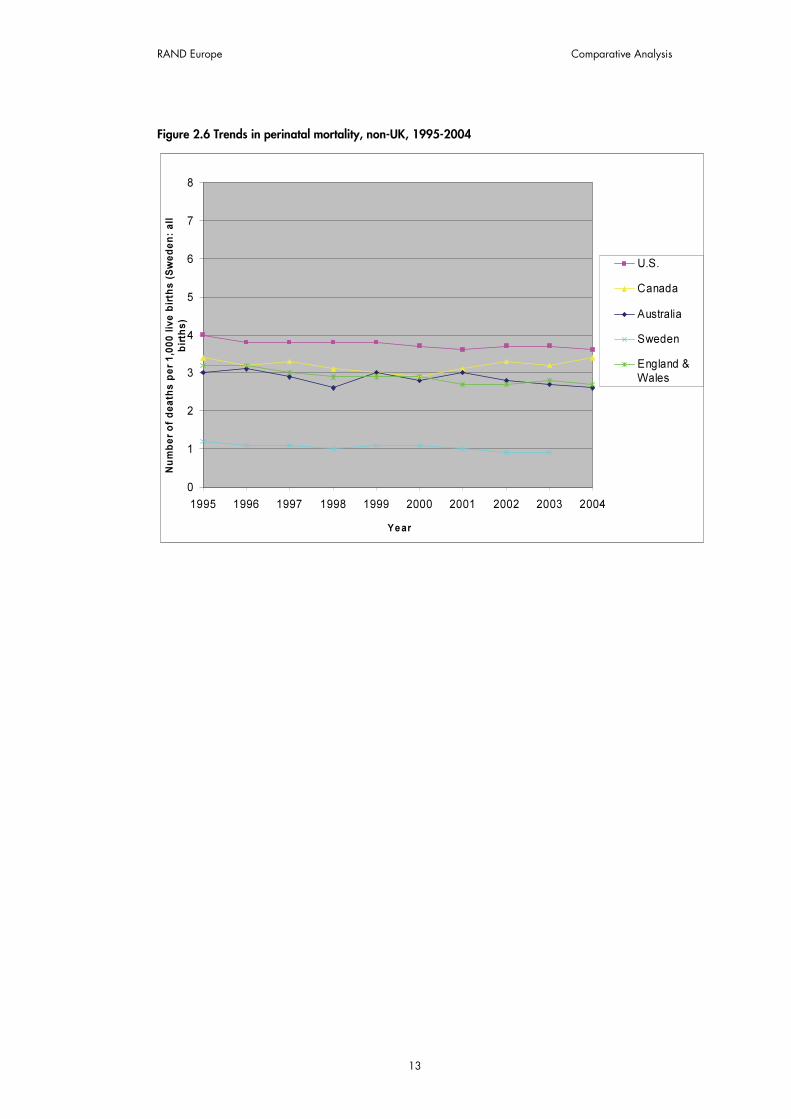
The U.S. and Sweden have both seen a steady decline in their rates of perinatal mortality, albeit from very different starting points. In the U.S., the rate has fallen 9.8 per cent, from 4.0 deaths per 1,000 live births to 3.6 deaths; in Sweden, the decline has been 25 per cent, from 1.2 deaths per 1,000 live births to 0.9 deaths. However, one reason for the Swedish rates being so low is that these data exclude births of less than 1,000g in birth weight, and thus are not directly comparable; the rates are also based on all births, rather than just live births. 49 50
The rates of Canada, Australia and England and Wales all lie between those of the U.S. and Sweden. In Australia, and England and Wales the situation has been rather similar: the rates started at approximately the same point (3.2 per 1,000 live births in England and Wales, 3.0 in Australia) and have fallen by approximately the same amount (13.3 per cent in Australia, 15.6 per cent in England and Wales); however, while England and Wales has seen a fairly constant decline, the movement of the rates in Australia has been much more volatile. Finally, Canada’s rates have remained fairly stable over the period in question; generally, they have been slightly higher than those of Australia and England and Wales, although they dipped to meet them in the period 1999-2001, before rising again.51 52 Figure 2.6 illustrates these trends.
49 Data for U.S. perinatal, neonatal and infant mortality rates taken from National Vital Statistics Reports Vol.55. No.14; Vol.54. No.16; Vol.53, No.10; Vol.52, No.2; Vol.50, No.12; Vol.50, No.4; Vol.48, No.12; Vol.47, No.23; Vol.46, No.12; Vol.46, No.6.
50 Data for Sweden’s perinatal, neonatal and infant mortality rates taken from STAKES National Research and Development Centre for Welfare and Health, Perinatal statistics in the Nordic countries. Statistical Summary 28/2005, 1 November 2005. Available at: http://www.stakes.fi/NR/rdonlyres/BDE35D36-E9BF-4CF6-9363-197B758BC512/0/0528taulut.pdf 51 All Canadian perinatal, neonatal and infant mortality rates are taken from Statistics Canada, Canadian Vital Statistics, Birth Database. Available at: http://www.statcan.ca.
52 All Australian perinatal, neonatal and infant mortality rates are taken from Australian Bureau of Statistics (2006), Deaths, Australia 2005, p.51.
RAND Europe Comparative Analysis
13
Figure 2.6 Trends in perinatal mortality, non-UK, 1995-2004
0
1
2
3
4
5
6
7
8
1995 1996 1997 1998 1999 2000 2001 2002 2003 2004
Year
Nu
mb
er
of
de
ath
s p
er
1,0
00
liv
e b
irth
s (
Sw
ed
en
: a
ll
bir
ths
)
U.S.
Canada
Australia
Sweden
England &
Wales
The provision of neonatal services: international comparisons RAND Europe
14
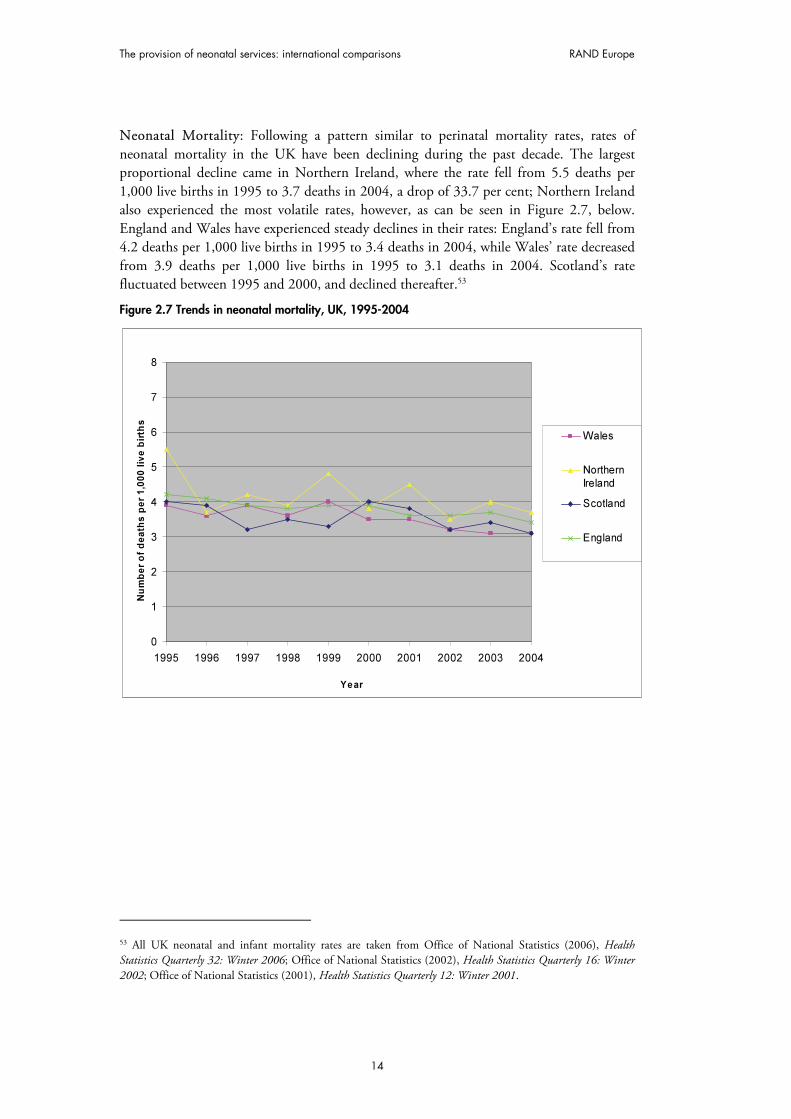
Neonatal Mortality: Following a pattern similar to perinatal mortality rates, rates of neonatal mortality in the UK have been declining during the past decade. The largest proportional decline came in Northern Ireland, where the rate fell from 5.5 deaths per 1,000 live births in 1995 to 3.7 deaths in 2004, a drop of 33.7 per cent; Northern Ireland also experienced the most volatile rates, however, as can be seen in Figure 2.7, below. England and Wales have experienced steady declines in their rates: England’s rate fell from 4.2 deaths per 1,000 live births in 1995 to 3.4 deaths in 2004, while Wales’ rate decreased from 3.9 deaths per 1,000 live births in 1995 to 3.1 deaths in 2004. Scotland’s rate fluctuated between 1995 and 2000, and declined thereafter.53
Figure 2.7 Trends in neonatal mortality, UK, 1995-2004
0
1
2
3
4
5
6
7
8
1995 1996 1997 1998 1999 2000 2001 2002 2003 2004
Year
Nu
mb
er
of
de
ath
s p
er
1,0
00
liv
e b
irth
s
Wales
Northern
Ireland
Scotland
England
53 All UK neonatal and infant mortality rates are taken from Office of National Statistics (2006), Health Statistics Quarterly 32: Winter 2006; Office of National Statistics (2002), Health Statistics Quarterly 16: Winter 2002; Office of National Statistics (2001), Health Statistics Quarterly 12: Winter 2001.

15
Given that neonatal mortality rates incorporate perinatal mortality rates, it is unsurprising that the descriptions given above for the latter mostly hold true for the former. The U.S.’s rates are once again markedly higher than those of Canada, Australia and England, while Sweden’s rates are much lower than that grouping. The patterns in decline in neonatal mortality rates are similar to the decline in perinatal mortality rates noted above. Figure 2.8 illustrates the trends in neonatal mortality.
Figure 2.8 Trends in neonatal mortality, non-UK, 1995-2004
0
1
2
3
4
5
6
7
8
1995 1996 1997 1998 1999 2000 2001 2002 2003 2004
Year
Nu
mb
er
of
de
ath
s p
er
1,0
00
liv
e b
irth
s
USA
Canada
Australia
Sweden
England

The provision of neonatal services: international comparisons RAND Europe
16
Infant Mortality: The trends in infant mortality rates for the UK countries are mostly similar to those for neonatal and perinatal rates. One interesting point, however, is that Northern Ireland’s infant mortality rate has declined to a lesser extent than its neonatal rate (25.5 per cent compared to 33.7 per cent). Indeed, figures for 2002-4 suggest that infant mortality could be increasing in Northern Ireland; the rate has increased from 4.7 deaths per 1,000 live births to 5.5 deaths during that period. Figure 2.9 illustrates the trends for infant mortality in the UK countries.
Figure 2.9 Trends in infant mortality, UK, 1995-2004
0
1
2
3
4
5
6
7
8
1995 1996 1997 1998 1999 2000 2001 2002 2003 2004
Year
Nu
mb
er
of
de
ath
s p
er
1,0
00
liv
e b
irth
s
Wales
NorthernIreland
Scotland
England
The patterns and relative placing of the non-UK countries’ infant mortality rates are similar to their perinatal and neonatal mortality rates. There are, however, some interesting differences to be discerned. For example, it is clear that the rate of all deaths under one year fell in Canada by 13.1 per cent between 1995 and 2004, from 6.1 deaths per 1,000 live births in 1995 to 5.3 deaths in 2004. However, as noted above, the country’s perinatal and neonatal mortality rates showed little improvement (perinatal mortality fell slightly between 1995 and 2000, but had returned to 1995 levels by 2004; neonatal mortality was 4.8 per cent lower than 1995 levels in 2004). Indeed, the majority of the decline in infant mortality was owing to the fall in deaths in the period one month to one year after birth: deaths in this period alone dropped by 31.6 per cent between 1995 and 2004. In Australia, the majority of the improvement in rates also occurred in the period between one month and one year, albeit to a lesser extent than in Canada. As noted above, Australia’s rates were volatile until 2001, after which point they have shown a constant decline. Canada and England have shown a similar drop in rates from a similar starting point, but this occurred more slowly in England: in 1999, the rate for England was 11.5 per cent higher than in Canada (5.7 and 5.2 deaths per 1,000 births, respectively), despite the fact both countries had identical rates four years previously. In this figure, the data for Sweden were

RAND Europe Comparative Analysis
17
taken from a different source than the preceding two figures (the OECD),54 but show a similar decline in mortality rates. Figure 2.10 illustrates the trends in infant mortality.
Figure 2.10 Trends in infant mortality, non-UK, 1995-2004
0
1
2
3
4
5
6
7
8
1995 1996 1997 1998 1999 2000 2001 2002 2003 2004
Year
Nu
mb
er
of
de
ath
s p
er
1,0
00
liv
e b
irth
s
U.S.
Canada
Australia
Sweden
England
2.1.4 Trends in morbidity – cerebral palsy cases This section focuses on the incidence of cerebral palsy, since it is the most common physical disability of children in Western Europe, and has therefore attracted a significant number of studies.55 A selection of studies into cerebral palsy from some of the countries compared above reveals differing conclusions regarding patterns of change in the incidence of this morbidity. For example, a 2006 study in Canada examined cerebral palsy in a population-based cohort of infants with 24/30 weeks’ gestation, and found that the cerebral palsy rates for these infants increased from 44.4 per 1,000 live births in 1993 to 100.0 per 1,000 live births in 2002.56 In contrast, a study of cerebral palsy amongst extremely low birth weight infants in Victoria, Australia over four eras between 1979 and 1997 found that the rate of cerebral palsy in survivors remained approximately 10 per cent in each era.57
54 Organisation for Economic Cooperation and Development (2007), World Health Statistics 2005.
55 Platt, M.J. et al. (2007), Trends in cerebral palsy among infants of very low birthweight (<1500g) or born prematurely (<32 weeks) in 16 European centres: a database study’, Lancet, 369:9555, 43-50.
56 Vincer, M. et al. (2006), ‘Increasing Prevalence of Cerebral Palsy Among Very Preterm Infants: A Population-Based Study’, Pediatrics, 118, 1621-1626, 1621.
57 Doyle, L. (2006) ‘Evaluation of neonatal intensive care for extremely-low-birth-weight infants’, Seminars in Fetal & Neonatal Medicine, 11, 139-145, 140.

The provision of neonatal services: international comparisons RAND Europe
18
Different again is the study at a tertiary referral neonatal care centre in the U.S. that found that there were improved neurodevelopmental outcomes for babies with birth weights 500g-999g in the period 2000-2002 compared with 1990-1999. Measured at 20 months’ corrected age, the incidence of cerebral palsy decreased from 13 per cent in 1990-1999 to 5 per cent in 2000-2. The rate had previously increased between the period 1980-1989 (8 per cent) and 1990-1999 (13 per cent). It was claimed that this increase was owing to increased survival rates leading to increased survival with impairment; these impairments were then addressed by changes in clinical practice in the 1990s, which led to a fall in morbidities once again.58 This suggestion has been echoed elsewhere, on the basis that ‘the frequency of cerebral palsy, especially in infants of less than 28 weeks' gestation, mainly reflects the aggressiveness and quality of perinatal care, and thus in the 1990s there was concern that the frequency of cerebral palsy would continue to increase.’59
Despite these fears, a 2007 study of cerebral palsy in 16 European centres found that prevalence of the morbidity in infants with very low birth weight (1,000g–1,499g) and less than 32 weeks’ gestation decreased significantly from 6 per cent of live births in 1980 to 4 per cent of live births in 1996. However, the prevalence of cerebral palsy did not change for infants weighing less than 1,000g, or for infants with less than 28 weeks’ gestation.60
2.1.5 “Snapshot” summary of statistics The above descriptions focus mainly on the diachronic statistical trends identifiable in the period 1995-2004. To facilitate a synchronic understanding of the relative statistics at a single point in time, Table 2.1, overleaf, gives the data for all countries in 2004 (the latest point at which data for all countries is available).
58 Wilson-Costello, D., Friedman, H., Nori Minich, M., et al. (2007), ‘Improved Neurodevelopmental Outcomes for Extremely Low Birth Weight Infants in 2000–2002’, Pediatrics, 119:1, 37-45, 37.
59 Hack, M., Costello, D. W. (2007), ‘Decrease in frequency of cerebral palsy in preterm infants’, Lancet, 369:9555, 7-9.
60 Platt, M.J. et al. (2007), Trends in cerebral palsy among infants of very low birthweight (<1500g) or born prematurely (<32 weeks) in 16 European centres: a database study’, Lancet, 369:9555, 43-50.

C
ompa
rativ
e A
naly
sis
19
Tabl
e 2.
1 Su
mm
ary
of s
tatis
tics
for
Engl
and
& W
ales
, Wal
es, N
orth
ern
Irela
nd, S
cotla
nd, S
wed
en, C
anad
a, A
ustr
alia
and
the
U.S
., 20
04 (e
xcep
t whe
re s
tate
d)
E
ng
lan
d
Wale
s
N. Ir
ela
nd
S
co
tlan
d
Sw
ed
en
61
Can
ad
a
Au
str
alia
62
Un
ited
S
tate
s
Rate
of
pre
term
bir
ths
(bab
ies b
orn
befo
re 3
7 w
eeks’ g
esta
tio
n, p
er
cen
t o
f all
live b
irth
s)
7.7
63
7.8
N
/A
8.2
5.5
7.9
8.2
12.5
Lo
w b
irth
weig
ht
bir
th r
ate
(b
irth
s w
ith
a b
irth
weig
ht
of
un
der
2500g
, p
er
cen
t o
f all liv
e b
irth
s)
7.6
7.6
5.9
8.0
4.3
5.9
6.4
8.1
Peri
nata
l M
ort
ality
rate
(n
um
ber
of
death
s, exclu
din
g s
tillb
irth
s, in
0-7
days
per
1,0
00 liv
e b
irth
s)
2.7
N
/A
N/A
2.3
0.9
64
3.4
2.6
3.6
Neo
nata
l m
ort
ality
rate
(n
um
ber
of
death
s, exclu
din
g s
tillb
irth
s, in
0-2
8 d
ays
per
1,0
00 liv
e b
irth
s)
3.4
3.1
3.7
3.1
1.3
65
4.0
3.2
66
4.5
Infa
nt
mo
rtality
rate
(n
um
ber
of
death
s o
ccu
rrin
g in
le
ss t
han
on
e y
ear
fro
m b
irth
per
1,0
00 liv
e b
irth
s)
5.0
4.9
5.5
4.9
3.1
5.3
4.7
6.8
61 D
ata
for 2
003.
62 U
nlik
e ot
her c
ount
ries,
offic
ial A
ustr
alia
stat
istic
s inc
lude
dat
a fo
r all
birt
hs o
f at l
east
400g
birt
h w
eigh
t or a
t lea
st 20
wee
ks’ g
esta
tion.
63 2
005
data
for E
ngla
nd a
nd W
ales
.
64 D
eath
s per
1,0
00 n
ewbo
rns (
incl
udin
g st
illbi
rths
). Ex
clud
es b
irths
of l
ess t
han
1,00
0g in
birt
h w
eigh
t.
65 E
xclu
des b
irths
of l
ess t
han
1,00
0g in
birt
h w
eigh
t.
66 A
ustr
alia
n Bu
reau
of S
tatis
tics
data
. The
Aus
tral
ian
Insti
tute
for
Hea
lth a
nd W
elfa
re a
nd th
e N
atio
nal P
erin
atal
Dat
a C
olle
ctio
n of
fer
diffe
ring
figur
es o
win
g to
diff
erin
g cr
iteria
and
da
ta c
olle
ctio
n m
etho
ds.
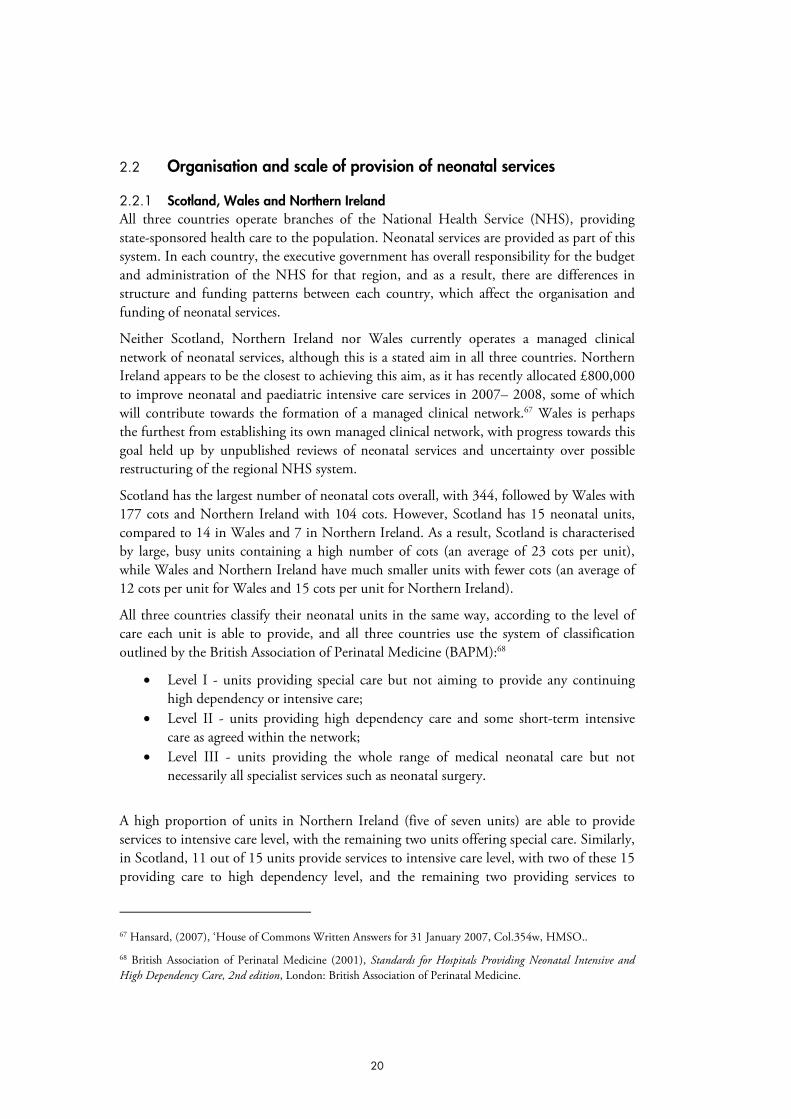
20
2.2 Organisation and scale of provision of neonatal services
2.2.1 Scotland, Wales and Northern Ireland All three countries operate branches of the National Health Service (NHS), providing state-sponsored health care to the population. Neonatal services are provided as part of this system. In each country, the executive government has overall responsibility for the budget and administration of the NHS for that region, and as a result, there are differences in structure and funding patterns between each country, which affect the organisation and funding of neonatal services.
Neither Scotland, Northern Ireland nor Wales currently operates a managed clinical network of neonatal services, although this is a stated aim in all three countries. Northern Ireland appears to be the closest to achieving this aim, as it has recently allocated £800,000 to improve neonatal and paediatric intensive care services in 2007– 2008, some of which will contribute towards the formation of a managed clinical network.67 Wales is perhaps the furthest from establishing its own managed clinical network, with progress towards this goal held up by unpublished reviews of neonatal services and uncertainty over possible restructuring of the regional NHS system.
Scotland has the largest number of neonatal cots overall, with 344, followed by Wales with 177 cots and Northern Ireland with 104 cots. However, Scotland has 15 neonatal units, compared to 14 in Wales and 7 in Northern Ireland. As a result, Scotland is characterised by large, busy units containing a high number of cots (an average of 23 cots per unit), while Wales and Northern Ireland have much smaller units with fewer cots (an average of 12 cots per unit for Wales and 15 cots per unit for Northern Ireland).
All three countries classify their neonatal units in the same way, according to the level of care each unit is able to provide, and all three countries use the system of classification outlined by the British Association of Perinatal Medicine (BAPM):68
• Level I - units providing special care but not aiming to provide any continuing high dependency or intensive care;
• Level II - units providing high dependency care and some short-term intensive care as agreed within the network;
• Level III - units providing the whole range of medical neonatal care but not necessarily all specialist services such as neonatal surgery.
A high proportion of units in Northern Ireland (five of seven units) are able to provide services to intensive care level, with the remaining two units offering special care. Similarly, in Scotland, 11 out of 15 units provide services to intensive care level, with two of these 15 providing care to high dependency level, and the remaining two providing services to
67 Hansard, (2007), ‘House of Commons Written Answers for 31 January 2007, Col.354w, HMSO..
68 British Association of Perinatal Medicine (2001), Standards for Hospitals Providing Neonatal Intensive and High Dependency Care, 2nd edition, London: British Association of Perinatal Medicine.

RAND Europe Comparative Analysis
21
special care level only. In Wales, however, a far lower proportion of units offer neonatal services to intensive care level (five of the 14), with the remaining nine units providing services to either high dependency or special care levels (disaggregated data for these two care levels were unavailable).
However, the BAPM guidelines stipulate the number of cots per care level per size of population, rather than the number of units offering a particular care level. It is therefore helpful to compare the number of individual cots per care level of each country. However, it was not possible to find disaggregated data specifying the number of cots at each care level in Wales or Scotland.
Exceeding unit capacity, in which demand for cots outstrips availability, is a concern in all countries. A 2005 study69 found that all respondent units in Northern Ireland and 91.7 per cent of Scottish units reported demand exceeding their available cot supply. Wales reported the lowest incidence of excessive cot demand, at 87.5 per cent. A more recent review (2007) found that Scottish units have to close to new admissions more frequently than the rest of the UK: in a six-month period, 97 per cent had been temporarily closed to admissions at least once.70 In both Scotland and Northern Ireland, the highest occupancy rates are in high dependency cots, and in all three countries, it is the high dependency units where cot demands exceed unit capacity most often.71
Neonatal units in all three countries are based within larger hospital establishments, and are staffed by a hierarchical structure of clinicians: consultant neonatologists run a specialised team of medics and nurses. All three countries use the specialised grade of Advanced Neonatal Nurse Practitioner (ANNP), which can be used to replace the medical grade of Senior House Officer in some situations. None of the countries meet the guidelines on staffing ratios laid down by the BAPM, and under-staffing is generally seen as a problem in all countries. However, each country experiences shortages at different grades of staff. Scottish units are understaffed by an average of 23 WTE (Whole Time Equivalent) posts per unit, double that of non-Scottish units. However, consultant provision is greater in Scotland than in the rest of the UK, and Scotland has the highest proportion of nurses trained in neonatal specialities than in the rest of the UK. In contrast, there is a severe lack of consultants in neonatology in Wales, where not all units are staffed by neonatal consultants but by general paediatricians instead. Northern Ireland reports a critical shortage of neonatal nurses.
2.2.2 Australia, Canada, Sweden, U.S. Unsurprisingly, comparing Australia, Canada, Sweden and the U.S. is much more difficult than doing so for the UK countries. Substantial disparities in populations, geographies and access to services must be taken into account. Each country structures its health services and its financing differently, according to variations in history and underlying political
69 Redshaw, M., and Hamilton, K. (2005), A Survey of Current Neonatal Unit Organisation and Policy, Oxford: National Perinatal Epidemiology Unit.
70 BLISS (2007), Handle with Care: A Review of Scottish Neonatal Services, London.
71 Redshaw, M., and Hamilton, K. (2005), A Survey of Current Neonatal Unit Organisation and Policy, Oxford: National Perinatal Epidemiology Unit.

The provision of neonatal services: international comparisons RAND Europe
22
philosophies. Contrasting amounts and types of information are available for each country because of their distinct information infrastructures and reporting mechanisms. While Canada and Australia have national neonatal networks for data gathering and quality improvement,72 the nearest equivalent in the U.S. is the Vermont Oxford Network, which incorporates many international members.73
As well as differences between these countries, there are also significant variations within them. Naturally, much of this variation is attributable to contrasting geographic and population characteristics. However, it is also important that in Canada, Australia and the U.S., the main organising units for neonatal services are regional, states or provinces. This opens up the possibility of experimentation by these authorities and adaptation of services to best reflect local characteristics and needs. For example, in our opinion there are one or two neonatal networks in each of the non-European countries that stand out as particularly advanced in their practices, whether because of their communications and administration structures, transport techniques, use of consultative committees, internal cohesion or quality improvement: British Columbia in Canada, California in the U.S., and Victoria and New South Wales in Australia. In Sweden, the central government exerts a higher degree of control over the medical care regions that organise neonatal care and thus distinctive regional characteristics of networks have not emerged in our study.
Given these differences, it is advantageous to treat the countries together in a common format. Therefore, the non-UK countries are summarised in a table that facilitates inter-country comparisons (Table 2.2, overleaf). This table details the structure of the healthcare system in each country; whether neonatal networks exist and how are used; the main organising body for these networks; the relationship between the main organising bodies for the networks and national government; variations between the networks within the country; the way in which levels of care are standardised; the number of cots in relation to births; the management networks used by the country’s networks; if and how consultative measures are used; staffing; funding mechanisms; and whether the country has a national network for data gathering.
72 Abeywardana, S. (2006), Report of the Australian and New Zealand Neonatal Network 2004. Sydney: Australian and New Zealand Neonatal Network. Available at: http://www.canadianneonatalnetwork.org
73 Available at: http://www.vtoxford.org/about/memberlist.aspx

C
ompa
rativ
e A
naly
sis
23
Tabl
e 2.
2 Se
rvic
e or
gani
satio
n: c
ompa
rison
tabl
e fo
r no
n-U
K co
untr
ies
Ref
eren
ces f
or in
form
atio
n co
ntai
ned
in th
is ta
ble
can
be fo
und
in th
e co
untr
y sp
ecifi
c ch
apte
rs (C
hapt
ers 3
to 9
).
Cate
go
ry
U.S
. C
an
ad
a
Au
str
alia
Sw
ed
en
Healt
hcare
syste
m
Majo
rity
of care
funded b
y p
rivate
health insura
nce. N
o u
niv
ers
al
healthcare
, som
e s
upport
for
those w
ith low
incom
es o
ffere
d b
y
“Medic
aid
”.
Canada H
ealth A
ct giv
es
univ
ers
al healthcare
pro
vis
ion
funded b
y taxes, adm
inis
tere
d b
y
pro
vin
ces.
Pro
vid
es ‘adequate
health
serv
ices to a
ll citiz
ens a
t an
afford
able
cost or
at no c
ost’
thro
ugh “
Medic
are
” syste
m.
Univ
ers
al healthcare
pro
vis
ion,
funded b
y incom
e taxes.
Use o
f n
eo
nata
l n
etw
ork
s (
or
“re
gio
nalisati
on
”)?
M
ajo
r advances in r
egio
nalis
ation
in 1
970s, but in
troduction o
f com
petition h
as m
eant “c
lassic
al”
model of re
gio
nalis
ation n
ever
realis
ed. S
om
e e
vid
ence o
f “d
ere
gio
nalis
ation”
in n
etw
ork
s,
with incre
ased h
igh-r
isk b
irth
s a
t com
munity N
ICU
s.
Canada h
as a
“hig
hly
re
gio
nalis
ed”
syste
m, w
ith
netw
ork
s e
xis
ting w
ithin
the
pro
vin
cia
l sphere
.
Netw
ork
s a
re m
ore
form
alis
ed
and d
evelo
ped in a
reas w
ith
hig
her
popula
tion d
ensity (
New
S
outh
Wale
s, V
icto
ria).
In less
densely
popula
ted r
egio
ns,
netw
ork
s a
re o
rganis
ed a
round
the h
ospitals
capable
of offering
tert
iary
care
.
Neonata
l care
is incre
asin
gly
centr
alis
ed d
ue to the r
ela
tively
sm
all
num
ber
of child
ren r
equirin
g
neonata
l care
.
Main
org
an
isin
g b
od
y f
or
neo
nata
l n
etw
ork
s
Sta
tes h
ave r
esponsib
ility
for
definin
g the c
hara
cte
ristics o
f netw
ork
s a
nd r
equired s
tandard
s.
Serv
ices o
ften d
ivid
ed into
sub-
sta
te r
egio
nal netw
ork
s. N
etw
ork
s
may e
xis
t at a s
upra
-sta
te level.
Pro
vin
ces h
ave r
esponsib
ility
for
org
anis
ation. N
etw
ork
s m
ay e
xis
t at supra
-pro
vin
cia
l le
vel.
Pro
vin
cia
l M
inis
try o
f H
ealth
sele
cts
agency/n
etw
ork
of bodie
s
(often a
repro
ductive c
are
pro
gra
mm
e)
to c
o-o
rdin
ate
.
Sta
tes’ health d
epart
ments
are
re
sponsib
le for
neonata
l serv
ices,
whic
h m
ay b
e p
rovid
ed b
y p
ublic
or
private
opera
tors
. M
ain
tert
iary
hospitals
pla
y im
port
ant ro
le in
netw
ork
s.
County
councils
pro
vid
e a
nd
finance n
eonata
l serv
ices. T
he 2
1
counties a
re g
rouped into
six
m
edic
al care
regio
ns to facili
tate
coopera
tion.
Rela
tio
nsh
ip b
etw
een
main
o
rgan
isin
g b
od
y f
or
netw
ork
s
an
d n
ati
on
al g
overn
men
t
Federa
l govern
ment has
neglig
ible
involv
em
ent in
neonata
l netw
ork
org
anis
ation.
Str
uctu
res that support
neonata
l netw
ork
s o
ften the r
esult o
f ad
hoc c
olla
bora
tion b
y inte
reste
d
part
ies.
Canada P
ublic
Health A
gency
has m
ore
contr
ol over
neonata
l netw
ork
org
anis
ation than
equiv
ale
nts
in A
ustr
alia
/U.S
.; it
sets
deta
iled r
equired s
tandard
s
of pra
ctice.
National govern
ment pro
vid
es
fundin
g, but org
anis
ation is m
ostly
devolv
ed to s
tate
govern
ments
.
Min
istr
y o
f H
ealth a
nd S
ocia
l A
ffairs is r
esponsib
le for
main
tain
ing the h
ealth s
yste
m.
National B
oard
of H
ealth a
nd
Welfare
makes r
ecom
mendations
on s
tructu
re o
f neonata
l serv
ices.
Vari
ati
on
s b
etw
een
netw
ork
s
wit
hin
th
e c
ou
ntr
y
The tra
ditio
n o
f sta
tes’ rights
and
the v
ariety
of th
eir s
izes a
nd
popula
tions m
eans o
rganis
ation
varies g
reatly.
Som
e p
rovin
ces (
e.g
. B
ritish
Colu
mbia
and O
nta
rio)
appear
to
have d
evelo
ped their n
etw
ork
org
anis
ations to a
much h
igher
level of sophis
tication than o
thers
.
The v
ast variety
and d
ista
nces
betw
een the n
etw
ork
s m
ean that
they h
ave e
volv
ed their o
wn
pra
ctices, w
hic
h r
eflect th
e
diffe
rent geogra
phic
al siz
es a
nd
popula
tion d
ensitie
s.
Imple
menta
tion o
f care
may v
ary
fr
om
regio
n to r
egio
n.

The
prov
isio
n of
neo
nata
l ser
vice
s: in
tern
atio
nal c
ompa
rison
s
RA
ND
Eur
ope
24
Cate
go
ry
U.S
. C
an
ad
a
Au
str
alia
Sw
ed
en
Sta
nd
ard
isati
on
of
levels
of
care
B
asic
fra
mew
ork
is the 1
976/1
993
Tow
ard
Im
pro
vin
g the O
utc
om
e o
f P
regnancy levels
of care
. B
ut not
all
sta
tes d
efine levels
of care
and
there
are
variations in the
meanin
g o
f “L
evel III care
”.
Basic
Level I-
III le
vel of care
syste
m is e
mplo
yed a
nd P
ublic
H
ealth A
gency s
ets
deta
iled c
are
guid
elin
es. B
ut pro
vin
cia
l im
ple
menta
tion m
eans that
sig
nific
ant variations in
cla
ssific
ation o
f care
exis
t.
Som
e s
tate
s (
e.g
. V
icto
ria)
issue
their o
wn d
eta
iled g
uid
elin
es for
levels
of care
.
Basic
Level I-
III syste
m o
f care
is
em
plo
yed.
Nu
mb
er
of
co
ts a
nd
bir
ths
1998-9
: 13,1
05 n
eonata
l in
tensiv
e
care
beds (
33.7
per
10,0
00 b
irth
s)
and 6
,905 inte
rmedia
te c
are
beds
(17.7
per
10,0
00 b
irth
s)
2001: 1.2
1 L
evel II u
nits p
er
10,0
00 liv
e b
irth
s.
2002: 444 n
eonata
l in
tensiv
e c
are
beds (
16 p
er
10,0
00 b
irth
s),
874
inte
rmedia
te c
are
beds (
31 b
eds
per
10,0
00 b
irth
s).
2002: 0.7
2 L
evel III units p
er
10,0
00 liv
e b
irth
s
In 2
004, 15.9
per
cent of
new
born
s (
39,7
01)
were
adm
itte
d
to a
specia
l care
nurs
ery
or
NIC
U.
New
South
Wale
s h
as 2
11
neonata
l beds, in
clu
din
g 6
1
ventila
tor
beds.
1996-7
: 0.9
0 L
evel III units p
er
10,0
00 liv
e b
irth
s
1997: 45 n
eonata
l units n
ationally
Man
ag
em
en
t m
ech
an
ism
s u
sed
b
y n
etw
ork
s
Many s
tate
s r
equire h
ospitals
to
have w
ritten c
o-o
pera
tion
agre
em
ents
with s
pecifie
d
hospitals
offering d
iffe
rent le
vels
of care
. In
Calif
orn
ia, th
ere
is a
sophis
ticate
d s
yste
m for
accre
ditin
g the level of care
pro
vid
ing b
y u
nits, all
of w
hom
m
ust pro
vid
e m
onitoring d
ata
. Illin
ois
utilis
es R
egio
nal P
erinata
l M
anagem
ent G
roups –
gro
up o
f sta
kehold
ers
responsib
le for
pla
nnin
g, opera
ting a
nd
evalu
ating the p
erinata
l netw
ork
.
In B
ritish C
olu
mbia
, th
e P
rovin
cia
l H
ealth S
erv
ices A
uth
ority
pro
vid
es a
str
ate
gic
and
org
anis
ational fr
am
ew
ork
for
specia
lised p
rovin
cia
l healthcare
. H
as d
evelo
ped a
nd im
ple
mente
d
a P
rovin
cia
l S
pecia
lised P
erinata
l P
rogra
m.
The B
ritish C
olu
mbia
R
epro
ductive C
are
Pro
gra
m
(BC
RC
P)
support
s the
develo
pm
ent of re
gio
nalis
ed
perinata
l care
in B
C.
New
South
Wale
s n
etw
ork
im
pro
ves its
inte
rnal cohesio
n b
y
opera
ting a
“bed s
tate
” data
base
and a
Perinata
l A
dvic
e L
ine.
Vic
toria m
ain
tain
s a
centr
al
Vic
torian P
erinata
l In
form
ation
Centr
e d
ata
base a
nd c
olle
cts
sta
ndard
ised p
erf
orm
ance
indic
ato
rs.
Co
nsu
ltati
ve m
easu
res (
e.g
. co
mm
itte
es)?
N
ew
York
Sta
te h
as e
sta
blis
hed
regio
nal perinata
l fo
rum
s for
hospital and c
om
munity p
erinata
l pro
fessio
nals
in o
rder
to im
pro
ve
the o
utc
om
es o
f care
.
The B
CR
CP
pro
vid
es
repre
senta
tion for
a r
ange o
f sta
kehold
ers
.
South
east O
nta
rio h
as a
Council
of P
art
ners
, support
ed b
y a
P
lannin
g C
oord
inating C
om
mitte
e
and four
ad h
oc w
ork
ing g
roups
on s
pecific
issues.
Vic
toria s
upport
s a
Neonata
l S
erv
ices A
dvis
ory
Com
mitte
e,
whic
h h
as n
o d
ecis
ion-m
akin
g
pow
ers
.

RAN
D E
urop
e C
ompa
rativ
e A
naly
sis
Com
para
tive
Ana
lysi
s
25
Cate
go
ry
U.S
. C
an
ad
a
Au
str
alia
Sw
ed
en
Sta
ffin
g
The s
upply
of neonato
logis
ts is
healthy: 6.1
neonato
logis
ts p
er
1,0
00 liv
e b
irth
s. B
ut th
ere
are
concern
s o
ver
the s
upply
of
nurs
es.
3.3
neonato
logis
ts p
er
1,0
00 liv
e
birth
s
The P
ublic
Health A
gency
specifie
s d
eta
iled s
taffin
g levels
fo
r C
anadia
n N
ICU
s.
The d
em
and for
NIC
U b
eds
som
etim
es e
xceeds the n
um
ber
offic
ially
availa
ble
, and this
may
be a
ggra
vate
d b
y n
urs
ing
short
ages.
3.7
neonato
logis
ts p
er
1,0
00 liv
e
birth
s.
68 p
er
cent of surv
eyed n
eonata
l nurs
es h
ad b
een e
mplo
yed in
nurs
ing for
gre
ate
r th
an o
r equal
to 2
1 y
ears
.
Fu
nd
ing
mech
an
ism
s
With the e
xception o
f M
edic
aid
, healthcare
funded b
y p
rivate
in
sura
nce. 159 m
illio
n A
mericans
are
in m
anaged c
are
org
anis
ations, w
hic
h c
an r
estr
ict
patients
’ options for
care
and
cre
ate
de facto
netw
ork
s.
Pro
vin
cia
l govern
ment secto
r is
th
e m
ain
funder
of neonata
l serv
ices a
nd c
om
prises the
pro
vin
ce’s
ow
n funds a
nd federa
l health tra
nsfe
rs.
Care
is a
lso funded b
y p
rivate
health insura
nce a
nd d
onations
and investm
ents
.
The A
ustr
alia
n g
overn
ment and
sta
te/terr
itory
govern
ments
join
tly
fund p
ublic
hospital serv
ices.
At th
e s
tate
level, V
icto
ria
opera
tes c
asem
ix fundin
g
com
prisin
g p
atient-
serv
ice b
ased
fundin
g a
nd s
epara
te fundin
g for
train
ing o
r specific
fundin
g.
The 2
1 c
ouncils
fund n
eonata
l and o
ther
healthcare
serv
ices.
Nati
on
al n
eo
nata
l n
etw
ork
fo
r d
ata
gath
eri
ng
?
The m
ajo
rity
of V
erm
ont O
xfo
rd
Netw
ork
mem
bers
are
based in
the U
.S.
Canada N
eonata
l N
etw
ork
conducts
publis
hes r
eport
s a
nd
researc
h s
tudie
s.
The C
anada Institu
te for
Health
Info
rmation p
roduces n
ational
report
s o
n m
ate
rnity a
nd n
eonata
l care
.
Perinata
l S
tatistics U
nit a
t th
e
Austr
alia
Institu
te for
Health a
nd
Welfare
publis
hes a
nnual
sta
tistical re
port
s o
n m
ate
rnity
and n
eonata
l is
sues.
Perinata
l N
ational M
inim
um
D
ata
set.
The C
entr
e for
Epid
em
iolo
gy o
f th
e N
ational B
oard
of H
ealth a
nd
Welfare
main
tain
s the M
edic
al
Birth
Regis
ter.
26
2.3 Transport services
2.3.1 Scotland, Wales and Northern Ireland There is a wide variation in the quality of neonatal transport services provided across the three countries. There are certain statutory provisions that govern all three countries designed to safeguard babies in transit. These particularly concern the security of ambulance fittings designed to accommodate infant incubators, and affect the numbers of ambulances available for neonatal transfers, even if the overall provision of ambulances within the country is very good. Scotland provides the best organised, best funded and only networked neonatal transport system of the three countries considered here.
Scotland’s integrated national neonatal transport network was established in 2003 and is supported by approximately £2 million per year in dedicated funding. The network uses standardised training and equipment across its three regions, ensuring maximum coverage and efficiency of service. The service also supports dedicated transfer teams, who are used solely to accompany neonatal transfers and do not form part of the nursing or medical staff quota within neonatal units. The network also co-ordinates transfers centrally, meaning that the clinical team responsible for the infant’s care can focus on medical care, not time consuming telephone calls to find an appropriate cot and mode of transport. The service has a total of four dedicated ambulances for neonatal transfer, and the network can also provide air transfer as required, using the Air Wing of the Scottish Ambulance Service, the only publicly funded air ambulance service in the UK. The Scottish network has developed and certified specialised incubator units suitable for use in both rotary and fixed wing aircraft.
Northern Ireland has no such transport network, although like the rest of its neonatal service, this is under review, and a neonatal and paediatric critical care transport service is being developed.74 There is currently an informal network between five neonatal units, one in Belfast and the other four units across the province offering intensive-level care. At present, unlike Scotland, there are no dedicated transport teams, but the need to accompany neonates in transfer means that highly qualified staff are taken away from busy units for the duration of the transfer. In addition, the lack of centralised network means that individual care teams have to arrange each transfer themselves, spending valuable time chasing available cots and modes of transport. Northern Ireland currently has one specialised ambulance dedicated to neonatal transport. Other transfers rely upon use of a standard ambulance with the correct fittings to secure a transport incubator. Since not all standard ambulances are adapted in this way, transfers can be delayed until an appropriate ambulance becomes available. There are no dedicated aircraft, and, according to interviewed stakeholders, there is no real need for aircraft due to the small size of the province and the high quality of the road network. Occasional use may be made of the Scottish or English specialist air transfer service, for which Northern Irish health boards are charged by the Scottish network or English Trust.75
74 Hansard, (2007), 'House of Commons Written Answers for 31 January 2007, Col.354w', HMSO.
75 National Health Services Scotland (2006), Neonatal Transport Service Annual Report 2004-2005.

RAND Europe Comparative Analysis
27
Wales has very poor provision for neonatal transfers. There is no integrated transport network, no dedicated transport staff, and no dedicated neonatal transport vehicles. Babies are transferred in standard ambulances but, as in Northern Ireland, not every ambulance has the specialised locking mechanism required by law to secure a transport incubator. As a result, there can be a delay before the appropriate vehicle becomes available. The lack of integrated network means that clinical staff have to co-ordinate transfers and, as in Northern Ireland, this is time consuming and takes staff away from their clinical duties on the unit. In addition, the absence of dedicated transport teams means that, as in Northern Ireland, highly trained staff are taken from units to accompany babies in transfer, leaving units understaffed. Welsh neonatal transfers are undertaken almost entirely by road. Some transfers may be made by air in particularly acute cases, if the baby cannot be treated within Wales. In these cases babies will often be transferred by helicopter to Glasgow or Birmingham and the cost of the transfer billed back to the Trust of origin. There is no Welsh air service for neonatal transfer.
As might be expected from this variation in service provision, there is also some variation in the quality of transport data kept by each country. Scotland holds the most comprehensive data regarding its neonatal transfers: between April 2004 and March 2005, 1,273 neonatal transfers were undertaken by the Scottish Transport network. Of these, 39 per cent were classed as emergencies, and 7 per cent required an air transport component. 2 per cent of the transfers involved babies being transferred to or collected from other hospitals in England, Wales, Northern Ireland or Ireland.76
In contrast, the figures available for Northern Ireland and Wales are less precise. The key informant that was consulted describes a high demand for transfers within the province, estimating that there are approximately two requests for transfers each day.77 Transfers for treatment outside the province are uncommon: between January and June 2007, all neonatal care needs were met within the province, and so no transport of babies outside Northern Ireland was required. Between 2002 and 2006, only 15 infants were transferred outside the province for services not provided within Northern Ireland.78
There are no data for Welsh neonatal transfers, a problem experienced throughout the Welsh neonatal service more broadly, as it suffers from an acute lack of centralised and systematic data with which to track performance, assess service need and monitor spending. A study from 2000 carried out a three-month investigation examining in-utero and neonatal transfers. The study measured transfers against existing national guidelines for good practice and used these criteria to deem transfers as ‘appropriate’ (required for clinical reasons) or ‘inappropriate’ (required due to lack of unit capacity). The study found that 45 of such transfers in Wales during this period were inappropriate, the equivalent of 5.2 per 1,000 live births.79 In contrast, estimates for Northern Ireland suggest that 25 per 76 National Health Services Scotland (2006), Neonatal Transport Service Annual Report 2004–2005.
77 Key informant interview. See also, Tubman, R. (2006), 'Position Paper on Specialist Neonatal Services in Northern Ireland', p.14.
78 Hansard (2007), 'House of Commons Written Answers for 31 January 2007, Col.354w', HMSO.
79Parmanum, J., et al.(2000), 'National Census of Availability of Neonatal Intensive Care', BMJ, 321:7263 (2000), 727-29.

The provision of neonatal services: international comparisons
28
cent of all transfers are due to lack of unit capacity.80 Scotland employs a widespread practice of admitting babies, even though a unit may not have the most appropriate care-level cot available, in order to avoid complicated and hazardous transfers.81
2.3.2 Australia, Canada, Sweden, U.S. As for the scale and organisation of services, the non-UK countries are summarised in a table that facilitates inter-country comparisons (Table 2.3, overleaf).
80 Key informant interview. See also, Tubman, R. (2006), 'Position Paper on Specialist Neonatal Services in Northern Ireland', p.14.
81 BLISS (2007), Handle with Care: A Review of Scottish Neonatal Services, London.

C
ompa
rativ
e A
naly
sis
29
Tabl
e 2.
3 N
eona
tal t
rans
port
: com
paris
on ta
ble
for
non-
UK
coun
trie
s
Ref
eren
ces f
or in
form
atio
n co
ntai
ned
in th
is ta
ble
can
be fo
und
in th
e co
untr
y sp
ecifi
c ch
apte
rs (C
hapt
ers 3
to 9
).
Cate
go
ry
U.S
. C
an
ad
a
Au
str
alia
Sw
ed
en
Co
ord
inati
ng
mech
an
ism
s
Som
e s
tate
s h
ave o
ne o
r m
ore
tr
ansport
serv
ices: N
ort
hern
and
South
ern
Calif
orn
ia b
oth
have
Tra
nsport
Syste
ms, underp
inned b
y
Perinata
l T
ransport
Coord
inating
Dis
patc
h C
entr
es.
In s
om
e s
tate
s, th
e tra
nsport
ation is
org
anis
ed a
round the m
ain
Level III
hospitals
in the s
tate
. O
f 75 institu
tions s
urv
eyed, a third h
ad
a s
pecia
list neonata
l tr
ansport
team
, w
hile
half h
ad a
unifie
d n
eonata
l /
paedia
tric
team
.
The task o
f pro
vid
ing
centr
alis
ed n
eonata
l tr
ansport
syste
ms is c
o-o
rdin
ate
d
either
by r
egio
nal Level III
institu
tions o
r th
rough a
sin
gle
pro
vin
cia
l tr
ansport
coord
inating s
erv
ice.
New
South
Wale
s h
as h
ad a
centr
alis
ed, auto
nom
ous
transport
serv
ice s
ince 1
995.
Vic
toria h
as a
New
born
E
merg
ency T
ransport
Syste
m
(NE
TS
) and a
Perinata
l E
merg
ency R
efe
rral S
erv
ice.
Specia
lised n
eonata
l tr
ansport
syste
ms a
re n
ot used. M
obile
tr
ansport
team
s a
re d
evelo
ped o
n
a r
egio
nal, n
ot national basis
. A
ll am
bula
nce s
erv
ices a
re locally
based a
nd o
rganis
ed c
losely
with
local health c
are
centr
es.
Fig
ure
s o
n e
xte
nt
of
tran
sp
ort
ati
on
N
o info
rmation a
vaila
ble
. N
o info
rmation a
vaila
ble
. V
icto
ria’s
NE
TS
made 1
,018
em
erg
ency r
etr
ievals
during
2006, and tra
nsport
ed 4
,669
infa
nts
betw
een 2
002 a
nd 2
006.
An a
vera
ge o
f 1,4
00 p
atients
are
tr
ansport
ed fro
m the n
ort
hern
counties for
the U
niv
ers
ity
hospital at U
mea.
Typ
es o
f tr
an
sp
ort
A
recent surv
ey o
f 75 institu
tions b
y the
Am
erican A
cadem
y o
f P
edia
tric
s found
that th
e a
vera
ge u
sage for
diffe
rent
types o
f tr
ansport
was 8
0.2
per
cent fo
r ro
ad tra
nsport
, 13.4
per
cent fo
r helic
opte
r tr
ansport
and 6
.2 p
er
cent fo
r fixed w
ing a
ircra
ft.
A 2
002 s
tudy found that th
ere
w
as n
o s
ignific
ant change in
outc
om
es b
etw
een thre
e
diffe
rent ty
pes o
f neonata
l tr
ansport
sta
ffin
g s
yste
ms,
although tota
l costs
did
vary
.
Of th
e 1
,018 e
merg
ency
transport
s in V
icto
ria in 2
005/6
, 80.0
per
cent w
ere
by r
oad, 14.6
per
cent w
ere
by fix
ed-w
ing
aircra
ft a
nd 5
.3 p
er
cent w
ere
by
helic
opte
r.
The four
nort
hern
counties o
f S
weden s
hare
tw
o fix
ed-w
ing
aircra
ft a
mbula
nces, equip
ped to
inte
nsiv
e c
are
level. A
n a
ir
am
bula
nce is a
lso p
rovid
ed in the
600km
radiu
s a
round U
ppsala
in
south
ern
and m
id S
weden.
30
2.4 Costs of neonatal services
Various cost studies have been conducted in the countries examined. These studies have usually been conducted at the level of regions or individual hospitals, and have used different methodologies. They examine the overall cost of neonatal care looking at the utilisation of hospital resources, the cost of treating babies by gestation age or birth weight, the cost effectiveness of treatment, personnel training costs, and transportation costs. The discrepancy in the methods used and the span of time these studies were conducted do not allow for meaningful comparisons. They do, however, provide valuable contextual information. The individual studies are described and referenced in the respective country chapters.
2.5 Best practices
2.5.1 Scotland, Wales and Northern Ireland All three countries employ the BAPM guidelines as standards, including the recommended staffing ratios for units offering different care levels, and the designation of different care levels. Not every country currently has its own regional best practice guidelines. NHS Scotland issued its own regional best practice guidelines in 2001.82 NHS Wales is in the process of drawing up its own standards for neonatal care: the Children and Young Peoples’ Specialist Services (CYPSS) issued a consultation document in 2005, All Wales Standards for Neonatal Services.83 At the time of writing (July 2007), the standards had not yet been published,84 but the CYPSS website states that the All Wales standards will be based on the written standards of the BAPM.85 Similarly, in Northern Ireland, there is currently a position paper outlining changes to be made to neonatal services,86 which may develop into more detailed best practice recommendations. Individual hospitals in all three countries may draw up their own, specific best practice guidelines for neonatal services, such as those issued by the Queen Mother’s Hospital, Glasgow.87
Finally, best practice guidelines, often in the form of best practice audit, are also produced by BLISS. BLISS is a UK-wide charity dedicated to the care of newborn babies, and its recommendations and analysis therefore cover all three of the countries under consideration here. In 2005, they published an influential report Special care for sick babies
82 Scottish Executive Health Department (2001), A Framework for Maternity Services in Scotland.
83 Welsh Assembly (2005), All Wales Standards for Neonatal Services, Children and Young People's Specialised Services Project (CYPSS).
84 Key informant interview, 12 July 2007
85 http://www.wales.nhs.uk/sites3/page.cfm?orgid=355&pid=4258.
86 Tubman, R. (2006), 'Position Paper on Specialist Neonatal Services in Northern Ireland'. Available at: http://dhsspsni.gov.uk/print/neonatalservicesinni.pdf
87 Available for reference online at http://www.clinicalguidelines.scot.nhs.uk/PD per cent20Guidelines.htm

RAND Europe Comparative Analysis
31
– choice or chance?88 that put forward a charter for neonatal intensive care. In 2007, BLISS produced a review of Scottish neonatal services entitled Handle With Care.89
2.5.2 Australia, Canada, Sweden, U.S. As for service provision, the non-UK countries are summarised in a table that facilitates inter-country comparisons (Table 2.4, overleaf).
88 BLISS (2005), Special Care for Sick Babies: Choice or Chance?, London.
89 BLISS (2007), Handle with Care: A Review of Scottish Neonatal Services, London.

C
ompa
rativ
e A
naly
sis
32
Tabl
e 2.
4 Be
st p
ract
ices
: com
paris
on ta
ble
for
non-
UK
coun
trie
s
Cate
go
ry
U.S
. C
an
ad
a
Au
str
alia
Sw
ed
en
Nati
on
al g
overn
men
t g
uid
elin
es
No e
vid
ence o
f national
govern
ment guid
elin
es.
In 2
000, th
e P
ublic
Health A
gency
of C
anada p
ublis
hed ‘T
he F
am
ily-
Centr
ed M
ate
rnity a
nd N
ew
born
C
are
National G
uid
elin
es’, the
main
docum
ent th
at codifie
d
federa
l re
com
mendations for
co-
ord
inating s
erv
ices a
t a
pro
vin
cia
l/te
rritorial le
vel.
No e
vid
ence o
f national
govern
ment guid
elin
es.
In 1
995, th
e S
wedis
h B
oard
of
Health a
nd W
elfare
issued the
clin
ical G
uid
elin
e for
Pre
gnancy
Care
. N
ational polic
ies r
egard
ing
resuscitation o
f extr
em
ely
pre
term
in
fants
are
pro
posed b
y the
National B
oard
of H
ealth a
nd
Welfare
and the S
wedis
h
Paedia
tric
Socie
ty.
Reg
ion
al g
overn
men
t g
uid
elin
es
Many s
tate
s, such a
s G
eorg
ia
and T
ennessee, have p
roduced
com
pre
hensiv
e g
uid
elin
es for
the
specific
neonata
l serv
ices
pro
vid
ed in their r
egio
ns, w
hic
h
are
revis
ed to r
eflect ongoin
g
govern
menta
l and c
linic
al
develo
pm
ents
.
In 2
005, B
ritish C
olu
mbia
’s
Pro
vin
cia
l S
pecia
lised P
erinata
l S
teering C
om
mitte
e, w
ith the
British C
olu
mbia
Health
Auth
orities, appro
ved a
docum
ent
giv
ing g
uid
elin
es for
Levels
of
Perinata
l C
are
. T
he B
C
Repro
ductive C
are
Pro
gra
m h
as
als
o p
roduced g
enera
l G
uid
elin
es
for
Perinata
l C
are
.
Vic
toria D
epart
ment of H
um
an
Serv
ices d
evelo
ped a
Neonata
l H
andbook in c
olla
bora
tion w
ith
four
neonata
l units in M
elb
ourn
e.
The d
epart
ment als
o p
roduced
deta
iled g
uid
elin
es o
n
recom
mended levels
of care
in
neonata
l units.
No info
rmation a
vaila
ble
.
Med
ical asso
cia
tio
n g
uid
elin
es
Regio
nalis
ed d
eliv
ery
of neonata
l care
is the o
ffic
ial positio
n o
f th
e
Am
erican A
cadem
y o
f P
edia
tric
s
(AA
P)
and the A
merican C
olle
ge
of O
bste
tric
s a
nd G
ynecolo
gis
ts
(AC
OG
). A
AP
and A
CO
G
publis
hed the 5
th e
ditio
n o
f G
uid
elines for
Perinata
l C
are
in
2002.
The A
AP
issued n
ew
guid
elin
es
on levels
of care
in 2
004.
The N
ational A
ssocia
tion o
f N
eonata
l N
urs
es p
ublis
hed its
G
uid
elin
es for
Neonata
l N
urs
ing
Polic
ies in 2
006.
The C
anadia
n P
aedia
tric
Socie
ty
revis
ed its
NIC
U level of care
definitio
ns in 2
006, m
akin
g
explic
it r
efe
rence to the
str
eam
linin
g o
f re
sourc
e p
lannin
g
and a
llocation.
The R
oyal A
ustr
ala
sia
n C
olle
ge o
f P
hysic
ians a
nd the A
ustr
alia
n
Colle
ge o
f N
eonata
l N
urs
es
publis
h g
uid
elin
es a
nd p
ositio
n
sta
tem
ents
on s
om
e topic
s.
How
ever,
many o
f th
e g
uid
elin
es
origin
ate
wholly
or
in p
art
fro
m
majo
r Level III centr
es w
ithin
sta
te
neonata
l netw
ork
s.
Guid
elin
es for
the p
revention a
nd
treatm
ent of pain
in the n
eonate
. 13 n
eonata
l guid
elin
es d
evelo
ped
by U
ppsala
Univ
ers
ity a
nd the
Karo
linska Institu
te.

RAN
D E
urop
e C
ompa
rativ
e A
naly
sis
Com
para
tive
Ana
lysi
s
33
Ref
eren
ces f
or in
form
atio
n co
ntai
ned
in th
is ta
ble
can
be fo
und
in th
e co
untr
y sp
ecifi
c ch
apte
rs (C
hapt
ers 3
to 9
)
Cate
go
ry
U.S
. C
an
ad
a
Au
str
alia
Sw
ed
en
Best
pra
cti
ce
reco
mm
en
dati
on
s f
rom
jo
urn
als
A 2
004 a
rtic
le c
onsid
ers
options
for
impro
vin
g c
are
of very
low
birth
weig
ht in
fants
. O
ne is
‘colla
bora
tive q
ualit
y
impro
vem
ent’, th
e o
ther
‘evid
ence-b
ased s
ele
ctive
refe
rral’.
No info
rmation a
vaila
ble
. A
Vic
toria s
tudy r
ecom
mended
incre
asin
g the p
roport
ion o
f extr
em
ely
low
birth
weig
ht in
fants
born
in L
evel III perinata
l centr
es
in o
rder
to im
pro
ve o
utc
om
es.
A 2
002 s
tudy found that curr
ent
sta
ffin
g levels
had n
o s
ignific
ant
impact on e
arly n
eonata
l m
ort
alit
y
and m
orb
idity.
No info
rmation a
vaila
ble
.
Evalu
ati
on
pra
cti
ces
Calif
orn
ia h
as s
et up tw
o m
ajo
r qualit
y im
pro
vem
ent ente
rprises:
the C
alif
orn
ia Q
ualit
y C
are
C
olla
bora
tive a
nd the N
eonata
l Q
ualit
y Im
pro
vem
ent In
itia
tive.
The form
er
colle
cts
info
rmation o
n
neonata
l outc
om
es a
nd r
esourc
e
utilis
ation to a
llow
benchm
ark
ing.
The latter
is a
colla
bora
tive
attem
pt to
elim
inate
blo
od
infe
ctions c
ontr
acte
d in N
ICU
s.
The N
ort
h C
entr
al P
erinata
l N
etw
ork
of Illin
ois
hold
annual
Perinata
l C
ase R
evie
w M
eetings
to im
pro
ve p
atient outc
om
es.
Onta
rio h
as the N
iday P
erinata
l D
ata
base, a p
rovin
ce-w
ide d
ata
re
port
ing m
echanis
m. T
his
pro
vid
es r
eal-tim
e d
ata
for
birth
s
in the p
rovin
ce, th
e inte
rventions
used in the labour
pro
cess a
nd
infa
nt outc
om
es. S
uch info
rmation
is inte
nded to a
id the p
lannin
g
and e
valu
ation o
f pro
gra
mm
es
and s
erv
ices. H
ospitals
are
accessin
g the d
ata
to b
enchm
ark
perf
orm
ance, id
entify
tre
nds, and
info
rm q
ualit
y im
pro
vem
ent
activitie
s.
The P
ublic
Health A
gency r
equire
hospitals
in n
eonata
l netw
ork
s to
undert
ake q
ualit
y im
pro
vem
ent
activitie
s.
The C
anadia
n P
erinata
l S
urv
eill
ance s
yste
m r
eport
s o
n 2
7
perinata
l in
dic
ato
rs.
The P
erinata
l M
inim
um
Data
set
colle
cts
data
on a
ll birth
s in
Austr
alia
.
The V
icto
ria D
epart
ment of
Hum
an S
erv
ices inclu
des q
ualit
y
impro
vem
ent in
its
guid
elin
es for
neonata
l le
vels
of care
. W
este
rn
Austr
alia
’s N
eonato
logy C
linic
al
Care
Audit C
om
mitte
e g
ives a
n
annual re
port
on its
qualit
y
impro
vem
ent activitie
s.
No info
rmation a
vaila
ble
.

34
2.5.3 The Cochrane Collaboration The Cochrane Collaboration is an international, non-profit network of volunteers (supported by a small staff) who prepare, maintain and disseminate systematic reviews of healthcare interventions.90 The Cochrane Neonatal Review Group produces systematic reviews of randomised controlled trials relating to neonatal care, and is funded by the U.S. National Institute of Child Health and Human Development (NICHD).91 The NICHD provides online full-text access to these neonatal systematic reviews.92 Some of the most relevant reviews in relation to neonatal service organisation are:
• Clinical decision support systems for neonatal care
• Developmental care for promoting development and preventing morbidity in preterm infants
• Early light reduction for preventing retinopathy of prematurity in very low birthweight infants
• Kangaroo mother care to reduce morbidity and mortality in low birth weight infants
• Pre-discharge "car seat challenge" for preventing morbidity and mortality in preterm infants
• Radiant warmers versus incubators for regulating body temperature in newborn infants
• Synchronised mechanical ventilation for respiratory support in newborn infants93
90 http://www.cochrane.org/docs/newcomersguide.htm
91 http://neonatal.cochrane.org/en/about.html
92 http://www.nichd.nih.gov/cochrane/
93 Ibid.
35
CHAPTER 3 Scotland
3.1 Summary
3.1.1 Key features The Scottish neonatal service can be characterised by large, busy units with a high number of cots per unit compared to the rest of the UK (e.g. Scotland has 344 cots spread over 15 units while Wales has 177 cots in 14 units). Compared to the rest of the UK, the service is well staffed at consultant level, and has a large proportion of nurses trained to specialty level.
Nevertheless, like most other regions in the UK, Scottish neonatal services fail to meet the optimum staffing ratios laid out by the BAPM. Although all units in Scotland are treating more patients than their clinically-agreed capacity, demand is highest for high dependency (Level II) care. More babies are admitted on average per unit in Scotland than elsewhere in the UK. There is no managed clinical neonatal network at present, but the service has a particularly strong neonatal transport network, the only one of its kind in the UK.
3.1.2 Key learning points The establishment of an effective neonatal transport network can help to function as a treatment network. It might therefore be seen as a useful method of initialising a clinical neonatal network where funds for such a project seem otherwise unavailable, and patients can begin to benefit from the improved efficiency and care that becomes available.
3.2 Statistics and trends
3.2.1 Preterm and low birth weight babies There were 4,174 premature births in Scotland in 2005, or 7.9 per cent of all births.94 Although this is lower than the 8.2 per cent recorded in 2004, the overall trend since 1999 is that the percentage of premature births is rising year on year. There have been no very low birth weight babies (under 1,500g) born at full term since 1999. However, in 2005, 16.4 per cent of premature babies were considered very low birth weight (VLBW). In the
94 ISD Scotland National Statistics (2006), 'All Births by Term and Birthweight'. Available in http://www.isdscotland.org/Iid/files/mat_bb_table7.xls (ed.), Excel..
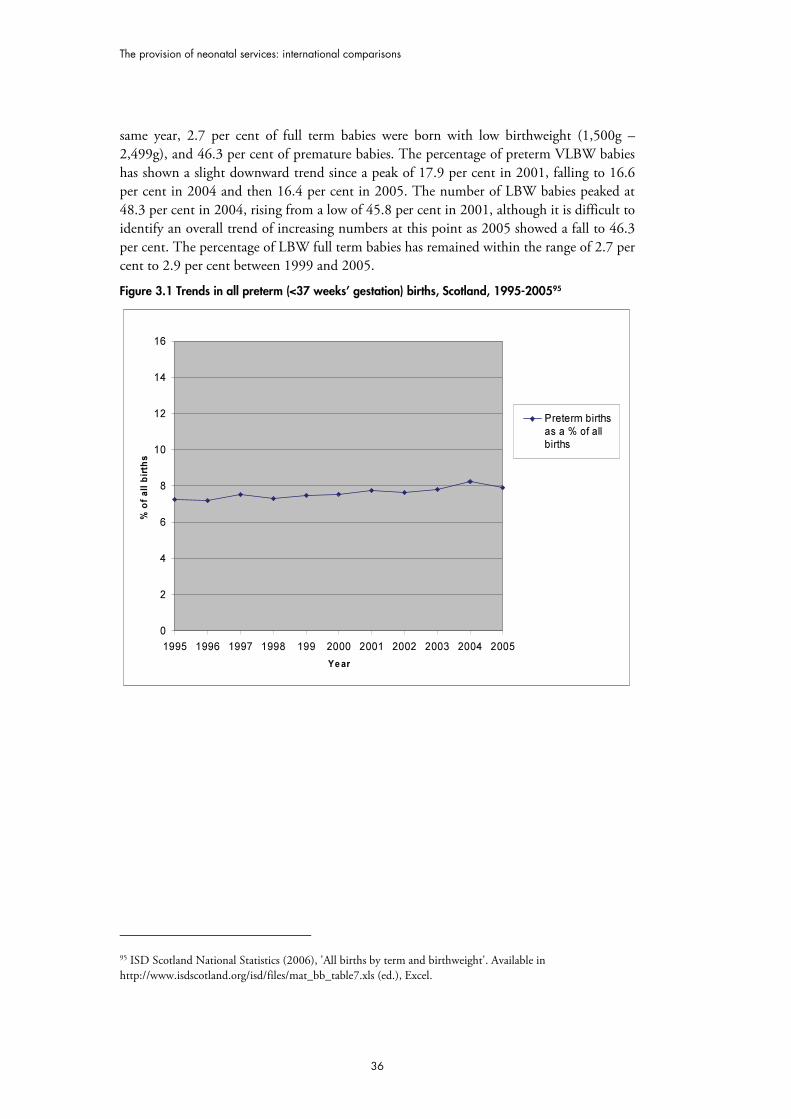
The provision of neonatal services: international comparisons
36
same year, 2.7 per cent of full term babies were born with low birthweight (1,500g – 2,499g), and 46.3 per cent of premature babies. The percentage of preterm VLBW babies has shown a slight downward trend since a peak of 17.9 per cent in 2001, falling to 16.6 per cent in 2004 and then 16.4 per cent in 2005. The number of LBW babies peaked at 48.3 per cent in 2004, rising from a low of 45.8 per cent in 2001, although it is difficult to identify an overall trend of increasing numbers at this point as 2005 showed a fall to 46.3 per cent. The percentage of LBW full term babies has remained within the range of 2.7 per cent to 2.9 per cent between 1999 and 2005.
Figure 3.1 Trends in all preterm (<37 weeks’ gestation) births, Scotland, 1995-200595
0
2
4
6
8
10
12
14
16
1995 1996 1997 1998 199 2000 2001 2002 2003 2004 2005
Year
% o
f a
ll b
irth
s
Preterm births
as a % of all
births
95 ISD Scotland National Statistics (2006), 'All births by term and birthweight'. Available in http://www.isdscotland.org/isd/files/mat_bb_table7.xls (ed.), Excel.
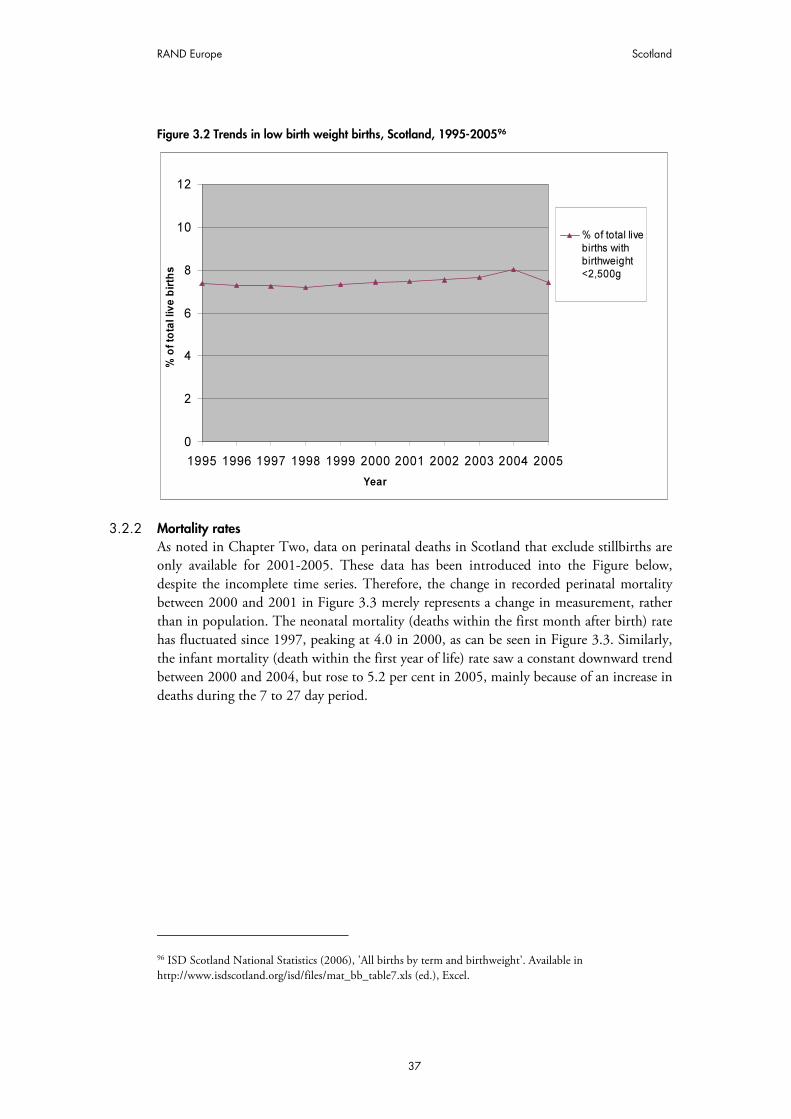
RAND Europe Scotland
37
Figure 3.2 Trends in low birth weight births, Scotland, 1995-200596
0
2
4
6
8
10
12
1995 1996 1997 1998 1999 2000 2001 2002 2003 2004 2005
Year
% o
f to
tal liv
e b
irth
s
% of total live
births withbirthweight<2,500g
3.2.2 Mortality rates As noted in Chapter Two, data on perinatal deaths in Scotland that exclude stillbirths are only available for 2001-2005. These data has been introduced into the Figure below, despite the incomplete time series. Therefore, the change in recorded perinatal mortality between 2000 and 2001 in Figure 3.3 merely represents a change in measurement, rather than in population. The neonatal mortality (deaths within the first month after birth) rate has fluctuated since 1997, peaking at 4.0 in 2000, as can be seen in Figure 3.3. Similarly, the infant mortality (death within the first year of life) rate saw a constant downward trend between 2000 and 2004, but rose to 5.2 per cent in 2005, mainly because of an increase in deaths during the 7 to 27 day period.
96 ISD Scotland National Statistics (2006), 'All births by term and birthweight'. Available in http://www.isdscotland.org/isd/files/mat_bb_table7.xls (ed.), Excel.
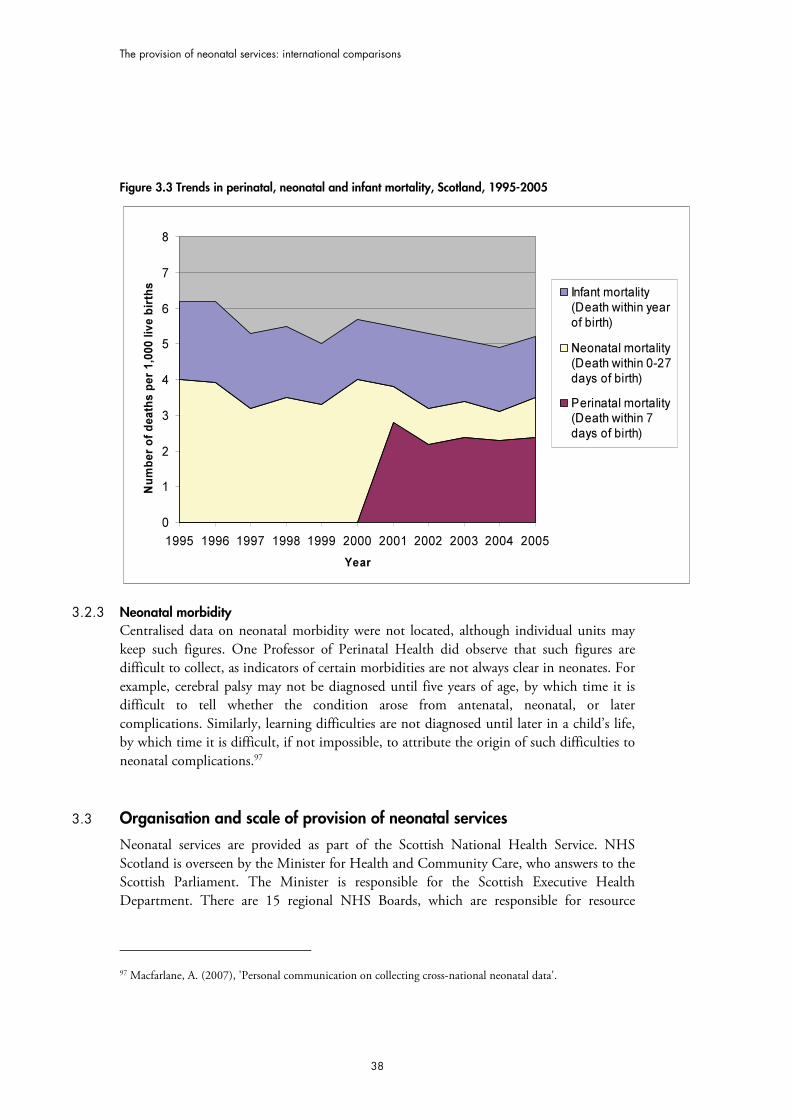
The provision of neonatal services: international comparisons
38
Figure 3.3 Trends in perinatal, neonatal and infant mortality, Scotland, 1995-2005
0
1
2
3
4
5
6
7
8
1995 1996 1997 1998 1999 2000 2001 2002 2003 2004 2005
Year
Nu
mb
er
of
death
s p
er
1,0
00 liv
e b
irth
s
Infant mortality
(Death within year
of birth)
Neonatal mortality
(Death within 0-27
days of birth)
Perinatal mortality(Death within 7
days of birth)
3.2.3 Neonatal morbidity Centralised data on neonatal morbidity were not located, although individual units may keep such figures. One Professor of Perinatal Health did observe that such figures are difficult to collect, as indicators of certain morbidities are not always clear in neonates. For example, cerebral palsy may not be diagnosed until five years of age, by which time it is difficult to tell whether the condition arose from antenatal, neonatal, or later complications. Similarly, learning difficulties are not diagnosed until later in a child’s life, by which time it is difficult, if not impossible, to attribute the origin of such difficulties to neonatal complications.97
3.3 Organisation and scale of provision of neonatal services
Neonatal services are provided as part of the Scottish National Health Service. NHS Scotland is overseen by the Minister for Health and Community Care, who answers to the Scottish Parliament. The Minister is responsible for the Scottish Executive Health Department. There are 15 regional NHS Boards, which are responsible for resource
97 Macfarlane, A. (2007), 'Personal communication on collecting cross-national neonatal data'.
RAND Europe Scotland
39
allocation and utilisation, and implementation of local health plans, among other roles. Funding from the Scottish Executive is distributed by NHS Boards to hospitals.
There is currently no managed clinical neonatal network, although there is a sophisticated neonatal transport network (see section 3.4 for details). There are 1598 neonatal units in the region with a total of 344 cots.99 As in England, neonatal units are classified according to the level of neonatal care they are able to provide, using the system of classification outlined by the British Association of Perinatal Medicine (BAPM):100
• Level I – units providing special care but not aiming to provide any continuing high dependency or intensive care;
• Level II – units providing high dependency care and some short-term intensive care as agreed within the network.
• Level III – units providing the whole range of medical neonatal care but not necessarily all specialist services such as neonatal surgery.101
There are two units providing services to special care level, two units providing services to high dependency care level and 11 units providing services to intensive care level in the region. Two thirds of neonatal care is for special care (Level I units), with 23 per cent for intensive care (Level III units).
• Special care (Level I) units: 13.3 per cent of units, average of 11 cots per unit • High dependency (Level II) units: 13.3 per cent, average of 16 cots per unit • Intensive care (Level III) units: 73.3 per cent, average of 26.5 cots per unit.102
The 2007 BLISS review of Scottish neonatal services, Handle With Care, reported that admissions to Scottish units have increased by 402 babies in the last year, and cot provision has not increased accordingly. There were 4,151 admissions to Scottish units in 2005. Although all units in Scotland are treating more patients than their clinically-agreed capacity, demand is highest for high dependency (Level II) care. Scottish units have a higher unit closure rate than the rest of the UK. In a six-month period, 97 per cent had been temporarily closed to admissions at least once.103
Neonatal units exist within larger hospitals, and staff generally work within one specific unit. As in England, some nursing staff are trained to the level of ANNP (Advanced Neonatal Nurse Practitioners), who can take the place of some Senior House Office (SHO) grade doctors in certain units. No Scottish unit meets the BAPM guidelines on staffing ratios, and on average, Scottish units are understaffed by 23 WTE (whole time
98 BLISS (2007), Handle with Care: A Review of Scottish Neonatal Services, Table 1, p.5, London..
99 Redshaw, M., and Hamilton, K. (2005), A Survey of Current Neonatal Unit Organisation and Policy, Oxford: National Perinatal Epidemiology Unit.
100 British Association of Perinatal Medicine (2001), Standards for Hospitals Providing Neonatal Intensive and High Dependency Care, London: British Association of Perinatal Medicine.
101 BLISS (2007), Handle with Care: A Review of Scottish Neonatal Services, London.
102 BLISS (2007), Handle with Care: A Review of Scottish Neonatal Services, Table 1, p.5 ,London..
103 Ibid.
The provision of neonatal services: international comparisons
40
equivalent) posts per unit, which is double that of non-Scottish units. However, consultant provision is greater in Scotland than in the rest of the UK: half of Scottish consultants have 50 per cent or more of their clinical sessions dedicated to neonatal care, compared to 40 per cent elsewhere in the UK. Scotland also has the highest proportion of nurses trained in neonatal specialities than the rest of the UK.104
3.4 Transport services
Scotland has had an integrated national neonatal transport service (NeTS) since January 2003, which is funded by the Scottish Executive.105 NeTS receives approximately £2 million per year in dedicated funds, so transport networks are not forced to compete with each other or with Trusts for funding.
The service is composed of three regional teams, which cover the 15 different Health Boards: South East, West, and North.106 There are a total of four dedicated ambulances for neonatal transfer, two in the northern regional transfer team and one in each of the South Eastern and Western teams. Each team also has the capacity to provide air transport, using the Air Wing of the Scottish Ambulance Service (SAS), the only publicly funded Air Ambulance Service in the UK.107 By 2005, NeTS had certified an infant incubator unit suitable for use in both rotary (helicopters) and fixed wing aircraft.108 All equipment and training is standardised, allowing crossover between the regions to ensure maximum coverage and efficiency of service.
In 2005, there were approximately 1,300 neonatal transfers, of which 75 required an air transport component.109 High demand for cots can result in babies being transferred to find space, rather than appropriate care. In Scotland, there is widespread practice of admitting babies, even though a unit may not have the most appropriate cot available, in order to avoid complicated and hazardous transfers.110
There are clear conditions under which a baby is considered for transfer.111 They are:
• The baby is born in a hospital unable to offer the appropriate level of care required.
• The baby’s condition deteriorates and so needs an increased level of care unavailable at its admitting hospital.
104 BLISS (2007), Handle with Care: A Review of Scottish Neonatal Services, Table 1, page 5,London...
105 Ibid., p.4.
106 Neonatal Transport Service (2005), Annual Report 2004 2005, NHS Scotland.
107 Skeoch, C.H., et al. (2007), 'Fit to fly: practical challenges in neonatal transfers by air', Archives of Disease in Childhood: Fetal and Neonatal Edition, 90 , 456-60.
108 Ibid.
109 Ibid.
110 BLISS (2007), Handle with Care: A Review of Scottish Neonatal Services, Table 1, page 6, London.
111 Key informant interview, 21st June 2007.

RAND Europe Scotland
41
• The baby needs investigations not available at its admitting hospital (e.g. MRI). • Occasionally, babies are transferred due to lack of capacity at their most local
hospital. This is less common in Scotland than in England. Medical teams generally try to move mothers antenatally if it is anticipated that there will be a problem with capacity locally.112 The COTS study is currently investigating this practice.113
The accompanying team may be one of or a combination of the following:
• Specially trained transport nurse • Medical Transport Fellow (a doctor, usually SpR or equivalent grade) • Nurse Practitioner (ANNP). There are currently five in Scotland, trained to the
level of a medical Transport Fellow. • Consultant
The accompanying team depends partly on the acuity of the baby. There are no formal guidelines. The three transport networks chose to spend their funds on different combinations of staff. The Northern network elected to have more consultants, and fewer nurses, so although more transfers in the northern region are accompanied by a consultant, this is not indicative of more acutely ill babies, but rather of a greater availability of consultants to accompany transfer.
3.5 Costs of neonatal services
There are very few data available on costs of neonatal services. Table 3.1 illustrates the costs of running a cot in a neonatal unit per year, although it does not distinguish between care levels.114
Table 3.1 Annual costs of running a cot in a neonatal unit, Scotland
Year Cost
1996-97 £80,468
1997-98 £85,061
1998-99 £85,581
1999-2000 £91,208
2000-01 £96,450
2001-02 £104,476
2002-03 £113,773
3.6 Best practices and guidelines
The British Association of Perinatal Medicine (BAPM) is the UK’s largest professional body focusing on the field of perinatal medicine. The BAPM publishes standards and 112 Key informant interview, 21st June 2007.
113 At the time of writing, there was a report pending publication that has been undertaken for the Scottish Executive. Known as the COTS study, this investigates the practice of moving mothers antenatally and babies postpartum if there is not enough capacity at their nearest hospital.
114 Figures taken from Written Answers in the Scottish Parliament, 01/12/03, available online at http://www.scottish.parliament.uk/business/pqa/wa-03/wa1201.htm, accessed 22/06/07

The provision of neonatal services: international comparisons
42
guidelines which are used as a benchmark throughout the UK. These are available on the BAPM website.115 Guidelines include Designing a neonatal unit (2004)116 and Standards for hospitals providing neonatal intensive and high dependency care (2001).117 Standards included in the latter are:
• Designation of neonatal units as Level 1 (units providing special care but not aiming to provide any continuing high dependency or intensive care); Level 2 (units providing high dependency care and some short-term intensive care as agreed within the network); Level 3 (units providing the whole range of medical neonatal care but not necessarily all specialist services such as neonatal surgery).
• Staffing levels (Intensive care = 1:1; high dependency care = 1 nurse: 2 babies; special care = 1 nurse: 4 babies).
• Specification of staff qualifications
In addition to the BAPM’s general standards, there are also regional standards and best practice guidelines issued by more local authorities. In 2001, the Scottish Executive Health Department released a report A Framework for Maternity Services in Scotland. Although concerned with provision of maternity services both ante and postnatally, this report also included specific best practice recommendations for neonatal care. Amongst these were recommendations for levels of neonatal care, reproduced below as Table 3.2.118
Individual health authorities or hospitals also issue their own best practice guidelines, adding further detail to those set out by BAPM. For example, Queen Mother’s Hospital, Glasgow has a comprehensive set of guidelines regarding aspects of neonatal care.119
Best practice guidelines, often in the form of best practice audit, are also produced by BLISS. BLISS is a UK charity dedicated to the care of premature babies. In 2005, they published an influential report (Special care for sick babies – choice or chance?)120 that put forward a charter for neonatal intensive care. In 2007, BLISS produced a review of Scottish neonatal services entitled Handle With Care.121 The report noted that none of the Scottish neonatal units meet BAPM recommended guidelines in relation to nurse/infant ratios.122
Neither the National Institute for Clinical Excellence (NICE) nor the Commission for Healthcare Audit and Inspection (CHAI) have a remit to operate within Scotland. Instead,
115 http://www.bapm.org/publications/
116 Laing, L., et al. (2004), Designing a Neonatal Unit: Report for the British Association of Perinatal Medicine, British Association of Perinatal Medicine.
117 British Association of Perinatal Medicine (2001), Standards for Hospitals Providing Neonatal Intensive and High Dependency Care, (2nd edition, London: British Association of Perinatal Medicine.
118 Scottish Executive Health Department (2001), A Framework for Maternity Services in Scotland, Table 21, p.56.
119 Available for reference online at: http://www.clinicalguidelines.scot.nhs.uk/PD per cent20Guidelines.htm
120 BLISS (2005), Special Care for Sick Babies: choice or Change, London.
121 BLISS (2007), Handle with Care: A Review of Scottish Neonatal Services, London.
122 Ibid.

RAND Europe Scotland
43
issues of clinical governance and audit are dealt with by NHS Quality Improvement, Scotland, supported by Audit Scotland.
Table 3.2 Neonatal Levels of Care Model123
Level of care
BAPM category Location Lead carer Support carer Care
I Normal Care Home, GP/Midwife Unit, Maternity Unit I-III
Mother + wider family
Midwife, Neonatal Nurse, Paediatrician
Advice and supervision, birth examination, vitamin K administration, discharge examination, screening programme, parental support and education
II Special Care Maternity Unit I-III, Postnatal Ward, Transitional Ward, Special Care Baby Unit
Midwife, Specialist neonatal nurse, Mother
Paediatrician, Midwife, Specialist Neonatal Nurse
Care and treatment exceeding normal care includes Level I care
III Level 2 High Dependency Intensive Care
Maternity Unit II-III, Special Care Baby Unit, Neonatal Intensive Care
Paediatrician/ Neonatalogist
Specialist Neonatal Nurse
Continuous skilled supervision but not as intensive as Level IV, parenteral nutrition, respiratory support, intra arterial monitoring, includes Level I care
IV Level 1 Maximal Intensive Care
Maternity Unit II-III, Neonatal Intensive Care
Neonatologist Specialist Neonatal Nurse, Other consultant specialities
Continuous highly skilled supervision, assisted ventilation, circulatory support, peritoneal dialysis, post-op care, intensive parental support, Includes Level 1 Care
123 Scottish Executive Health Department (2001), A Framework for Maternity Services in Scotland., Table 21, p.56.

44
CHAPTER 4 Wales
4.1 Summary
4.1.1 Key features Neonatal, perinatal and infant mortality rates in Wales all demonstrate a consistent reduction during the last six years. However, despite this success, it is arguable that the provision of neonatal care in Wales remains under-resourced and fragmented when compared to England.
There is no managed neonatal network in place for Wales, although there are 14 neonatal units, with a total of 177 cots. Trusts seem to remain reluctant to invest in improvements in neonatal care, perhaps because of the potential for broader restructuring of the NHS system in Wales. Recommendations from recent reviews of neonatal services appear not to have been implemented for the same reason. The Health Commission Wales has recently undertaken an Options Appraisal of neonatal services in the region, although the results have not yet been published.
Wales has no dedicated neonatal transport teams or vehicles. Data collection is limited to crude indicators of mortality, but there is no networked collection of more sophisticated indicators, such as morbidity, with which to track the success of service provision.
4.1.2 Key Learning Points In the absence of managed neonatal networks, there is the opportunity for investment in transport systems and centralised data collection protocols. As Scotland’s transport network suggests, these services can themselves contribute towards creating an informal neonatal network, and improving the efficiency and effectiveness of care.
4.2 Statistics and trends
4.2.1 Preterm and low birth weight births In 2005, 7.1 per cent of all births were premature (born at less than 37 weeks’ gestation). This is the lowest rate of premature births recorded in Wales since 2000, a fall of 0.7 per cent from 2000. The rate of premature births has fluctuated by less than one per cent

RAND Europe Wales
45
between 2000 and 2005, peaking at 8.0 per cent in 2003.124 The rate of low birth weight babies (births live and still under 2.5kg) has remained nearly constant between 1999 and 2005. 2005 has seen a slight fall in the rate of low birthweight babies, to 7.2 per cent per 1,000 total births,125 but it is not clear yet whether this represents a longer term downturn in low birth weights.
Figure 4.1 Trends in all preterm (<37 weeks’ gestation) births, Wales, 2000-2005
0
2
4
6
8
10
12
14
16
2000 2001 2002 2003 2004 2005
Year
% o
f a
ll b
irth
s
Preterm births
as a % of all
births
124 National Community Child Health Database (NCCHD). Available at:http://new.wales.gov.uk/legacy_cy/keypubstatisticsforwales/content/publications/health/2005/sdr63-2005/sdr63-2005.htm
125 Office for National Statistics.
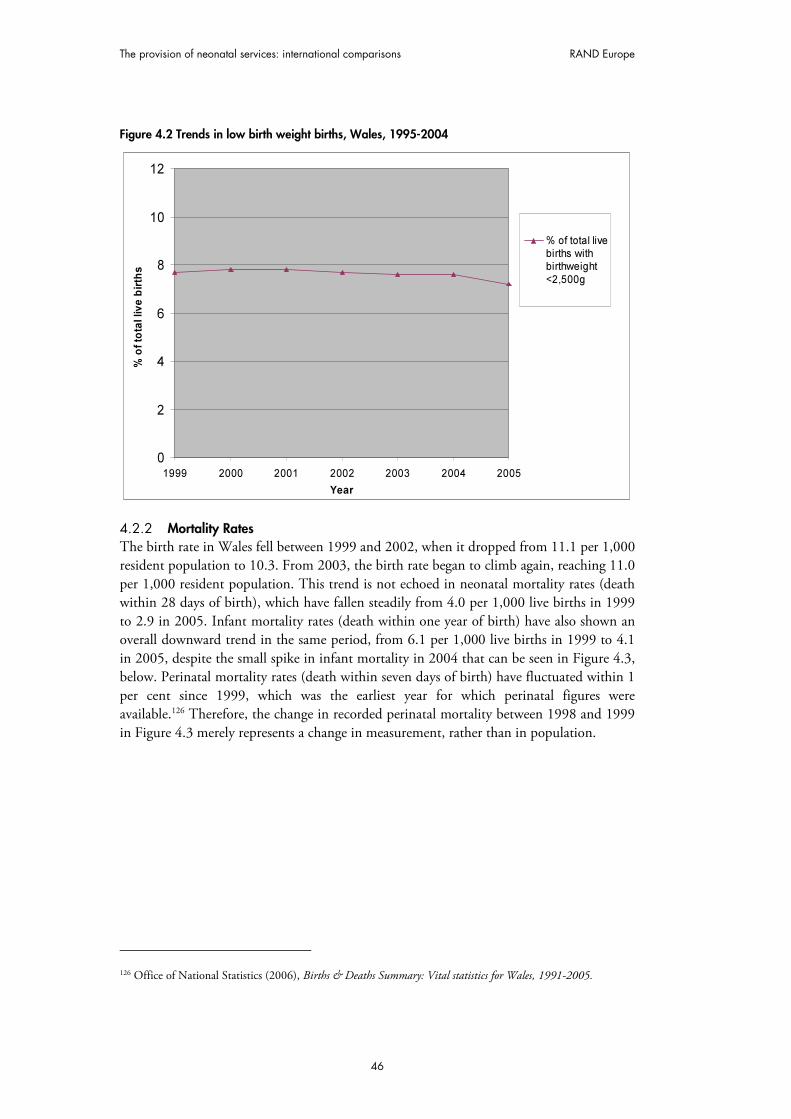
The provision of neonatal services: international comparisons RAND Europe
46
Figure 4.2 Trends in low birth weight births, Wales, 1995-2004
0
2
4
6
8
10
12
1999 2000 2001 2002 2003 2004 2005
Year
% o
f to
tal liv
e b
irth
s
% of total livebirths withbirthweight
<2,500g
4.2.2 Mortality Rates The birth rate in Wales fell between 1999 and 2002, when it dropped from 11.1 per 1,000 resident population to 10.3. From 2003, the birth rate began to climb again, reaching 11.0 per 1,000 resident population. This trend is not echoed in neonatal mortality rates (death within 28 days of birth), which have fallen steadily from 4.0 per 1,000 live births in 1999 to 2.9 in 2005. Infant mortality rates (death within one year of birth) have also shown an overall downward trend in the same period, from 6.1 per 1,000 live births in 1999 to 4.1 in 2005, despite the small spike in infant mortality in 2004 that can be seen in Figure 4.3, below. Perinatal mortality rates (death within seven days of birth) have fluctuated within 1 per cent since 1999, which was the earliest year for which perinatal figures were available.126 Therefore, the change in recorded perinatal mortality between 1998 and 1999 in Figure 4.3 merely represents a change in measurement, rather than in population.
126 Office of National Statistics (2006), Births & Deaths Summary: Vital statistics for Wales, 1991-2005.

RAND Europe Wales
47
Figure 4.3 Trends in perinatal, neonatal and infant mortality, Wales, 1995-2005127
0
1
2
3
4
5
6
7
8
1995 1996 1997 1998 1999 2000 2001 2002 2003 2004 2005
Year
Nu
mb
er
of
death
s p
er
1,0
00 liv
e b
irth
s
Infant mortality
(Death within yearof birth)
Neonatal mortality(Death within 0-27days of birth)
Perinatal mortality(Death within 7days of birth)
4.2.3 Neonatal morbidity Wales does not collect any centralised data regarding neonatal morbidity. Individual units may collect these data, but there is no formal network for sharing such input. Wales is not included in the National Neonatal Audit. Data on mortality are gathered, but more detailed data on morbidity and outcomes are not centrally collected (although they may be kept by individual units). Such data allows a more in depth understanding of treatment outcomes than the crude measure of mortality alone. For example, compared to other regions in the UK, Wales has a favourable infant mortality rate of 4.1 per 1,000 live births. However, accompanying statistics on infant morbidity would build a picture regarding the quality of life that surviving infants have, and whether care practices are simply aiding survival, or also serving to reduce instances of infant morbidity, including conditions such as retinopathy and cerebral palsy.
As a result of this lack of data, it is impossible for Welsh neonatologists to track improvements or failings in levels of care, and to identify areas for investment and training.128 Some Welsh units have joined the Vermont Oxford Network, an international network that allows sharing of a range of data between units. Membership costs approximately £2,000 per unit per year, and units are required to fund this themselves; most use endowment charity money. Membership provides a functional data network for 127 Data taken from Office of National Statistics (2006), Births & Deaths Summary: Vital statistics for Wales, 1991-2005; Office of National Statistics (2006), Health Statistics Quarterly 32: Winter 2006; Office of National Statistics (2002), Health Statistics Quarterly 16: Winter 2002; Office of National Statistics (2001), Health Statistics Quarterly 12: Winter 2001. As noted, perinatal statistics are not available for years prior to 1999.
128 Key informant interview, 12 July 2007.

The provision of neonatal services: international comparisons RAND Europe
48
individual neonatal units,129 within which they can compare performance indicators such as morbidity outcomes with a large number of other units on an international scale.
4.3 Organisation and scale of provision of neonatal services
Neonatal services are provided by NHS Wales, which is managed by the NHS Wales Department of the Welsh Assembly Government. Within NHS Wales, there are three regional offices, covering North Wales, South East Wales, and Mid and West Wales. Wales is also divided into 22 local health boards, which are the main budget holders for health care in the country, responsible for evaluating, commissioning and providing local services for the 14 NHS Trusts in Wales. There is also an additional agency, the Health Commission Wales (HCW), which is responsible for commissioning specialist services on a national level. The HCW is an executive agency of the Welsh Assembly Government, and bypasses the regional offices and the local health boards, commissioning services directly for the 14 NHS Trusts.
There are 14 neonatal units in Wales,130 providing a total of 177 cots. As in England, neonatal units are classified according to the level of neonatal care they are able to provide, using the system of classification outlined by the British Association of Perinatal Medicine.131
Neonatal units exist within larger hospital trusts. There are 13 Maternity Trusts in Wales, and 14 neonatal units. Services are generally concentrated along the ‘M4 corridor’ in south Wales, and in a band running horizontally across the northern coast of the country. Each Trust provides neonatal care at some level, but there is variation between Trusts in the level of care provided. There is no managed clinical network of neonatal units. Instead, the system consists of large regional centres, supported by sub-regional units, but this structure is purely geographical in organisation, not clinical – the units are not formally networked. As a result, units close to each other may offer competing levels of care.
Both the regional centres and sub-regional units offer Level III, or intensive care, services to babies. At present, Cardiff is the only regional centre located in Wales and serves the south of the country. In North Wales, the nearest regional centre is Liverpool, across the border in England. Babies requiring specialist cardiac care are usually sent to Bristol.
There are four sub-regional units, three serving South Wales (The Royal Gwent Hospital, Newport; Singleton Hospital, Swansea; and the Royal Glamorgan Hospital, Llantrisant and the Rhondda Valleys), and one serving North Wales (Ysbyty Glan Clwyd, at Rhyl). The remaining nine neonatal units across the country provide neonatal care at Level II (High dependency) or Level I (special care).
129 Key informant interview, 12 July 2007.
130 Redshaw, M., Hamilton, K. (2005), A Survey of Current Neonatal Unit Organisation and Policy, p.7 , Oxford: National Perinatal Epidemiology Unit,.
131 British Association of Perinatal Medicine (2001), Standards for Hospitals Providing Neonatal Intensive and High Dependency Care, 2nd edition, London: British Association of Perinatal Medicine.
RAND Europe Wales
49
Each unit has a dedicated staffing quota of specialist neonatal nursing and medical staff. Units are based around a hierarchical structure of clinicians, with consultant neonatologists or paediatricians running a team of specialised staff, including specialised registrars (SpR), and Senior House Officers (SHOs), as well as specialised nurse practitioners specifically trained for neonatology – Advanced Neonatal Nurse Practitioners (ANNPs). Neonatal services are widely understaffed in Wales, and do not meet the staffing quotas laid down by the BAPM.132 There is a lack of Consultants in neonatology, and although the numbers of consultants in Wales has improved recently, units still fall below the quotas recommended by the BAPM. As a result, not all units are staffed by consultants in neonatology. Instead, a number of units rely on general paediatricians to cover some or all of the shifts, who may have little specific training in neonatology. Furthermore, some may be community paediatricians, who are based outside hospitals, and therefore do not have specific expertise in either hospital medicine or neonatology.133
Although there has been a shortage of specialised neonatal nursing staff, particularly ANNPs (Advanced Neonatal Nurse Practitioners),134 some key informant interviews indicated that this shortage is no longer as acute as it once was: it is now junior neonatal nurses who are most urgently needed. This trend might be expected: previously junior nurses have been promoted into more senior specialised roles, while perceptions of neonatal medicine as high-tech, stressful and under-resourced in Wales may have had a negative impact on recruitment of more junior nurses to fill the posts left by promotion.135
The Health Commission Wales (HCW) is an executive agency of the Welsh Assembly Government. The HCW is responsible for commissioning specialist, acute or regional care services that are not already commissioned by Local Health Boards and therefore is responsible for commissioning and funding neonatal services in Wales. Funding is distributed by hospital trust, and there are currently no ring-fenced funds for neonatal care or transport. English neonatal services recently received a large injection of funding to help establish clinical networks, improve staffing levels and improve transport provision but there has not been a similar distribution of funds in Wales.
4.4 Transport services
There is no formal neonatal transport network in Wales. There are no dedicated neonatal transport vehicles, and no dedicated neonatal transfer teams. Babies are transported in ambulances provided by the Ambulance Service. However, not all ambulances have the specialised locking mechanism required to secure a transport incubator and required by law for neonatal transfers. As a result, there may be a delay before the appropriate vehicle becomes available. There are no centralised or systematic data documenting the number of
132 Key informant interview, 12 July 2007.
133 Key informant interview, 12 July 2007.
134 Smith, S.L., Hall, M.A. (2003), ‘Developing a neonatal workforce: role evaluation and retention of advanced neonatal nurse practitioners’, Archives of Disease in Childhood, 88, 426-429.
135 Key informant interview, 20 July 2007.
The provision of neonatal services: international comparisons RAND Europe
50
transfers in Wales at present. A consultant neonatologist suggested that the figure was approximately one transfer every other day.136
Units must co-ordinate their own transfer, including requesting an ambulance using the 999 emergency protocol if necessary, which is time consuming and takes staff away from their medical duties on the unit. Furthermore, the lack of dedicated transport staff means that at least one member of the neonatal unit staff must accompany the baby. The level of training required to accompany a baby on transfer means that this is often a senior member of the neonatal unit, who is then unavailable to work on the unit itself for the duration of the transfer.
Welsh neonatal transfers are undertaken almost entirely by road. Some transfers may be made by air in particularly acute cases, if the baby cannot be treated within Wales. In these cases babies will often be transferred by helicopter to Glasgow or Birmingham and the cost of the transfer billed back to the Trust of origin. There is no Welsh air service for neonatal transfer.
There is an acute lack of centralised and systematic data covering Welsh neonatal transfers. As a result, there is no data held for the numbers of transfers undertaken across Wales each year, or the total distances travelled per patient. This absence of data also makes it difficult to provide evidence of the impact of neonatal unit structure on the distances infants are transported. However, a recent study carried out a three- month investigation examining in utero and neonatal transfers. The study measured transfers against existing national guidelines for good practice and used these criteria to deem transfers as ‘appropriate’ (required for clinical reasons) or ‘inappropriate’ (required due to lack of unit capacity). The study found that 45 transfers in Wales during the three-month period were inappropriate, the equivalent of 5.2 per 1,000 live births.137
4.5 Costs of neonatal services
There is little data available on the costs of Welsh neonatal services. This is due, in part, to the fact that there are no ring-fenced funds for neonatal services in Wales, and as a result no audit trail with which to track expenditure. Welsh neonatal services are still funded by a system of ‘block funding’ per hospital, rather than the payments by results approach used in England. Again, this means that there is no incentive to tightly monitor specific expenditure within neonatal services.
The Health Commission Wales recently conducted an Options Appraisal looking at neonatal services throughout the region. This report is not publicly available, but it may well contain more comprehensive detail of costs, expenditure and staffing levels within Welsh neonatal services than have been provided here.
136 Key informant interview, 12 July 2007.
137 Parmanum, J., et al. (2000), ‘National Census of Availability of Neonatal Intensive Care’, BMJ, 321:7263, 727-29.
RAND Europe Wales
51
4.6 Best practices and guidelines
Although there is not currently a managed neonatal network in Wales, the consensus among those interviewed for this report was that, given the opportunity, Wales would adopt a similar network model to that used in England. Therefore an outline of the English guidelines for neonatal networks is included below, as made in the Report on DH expert group on Neonatal Intensive Care Services (2003).138 The report made a number of recommendations for improvements to existing neonatal care services. These include:
• All neonatal care should be provided within agreed managed clinical care networks. This system is currently being implemented across the UK.
• Within these networks, there would be agreed differing levels of care provided. Networks enable the concentration of skills required for complex care, whilst facilitating early return to local hospitals for babies no longer needing specialised care.
• Networks should have agreed standards, including unified protocols, standards and pathways of care, and a joint approach to clinical audit, including clinical audit, incident reporting and clinical training.
• Categories of care should be adopted, using the BAPM typology of normal care, special care, high dependency care and intensive care.
• Constituent units within a network should be designated by the activity they are resourced for into three types of neonatal unit. Each network should have one or more Level III units located both in acute general hospitals and in regional centres (one of which acts as a network lead centre), and also a number of Level I and II units.
NHS Wales is in the process of drawing up its own standards for neonatal care. The Welsh Assembly’s Framework document, National Service Framework for Children, Young People and Maternity Services in Wales, published in September 2005, stated that “Babies requiring neonatal intensive care receive services in line with standards that are being developed by the Welsh Assembly Government and Health Commission Wales”.139
As part of this process of standards development, the Children and Young Peoples’ Specialist Services (CYPSS) issued a consultation document in 2005, All Wales Standards for Neonatal Services.140 At the time of writing (July 2007), the standards had not yet been
138 Department of Health Expert Working Group on Neonatal Intensive Care Services (2003), Report of the Neonatal Intensive Care Services Review Group. Available at: http://www.dh.gov.uk/prod_consum_dh/groups/dh_digitalassets/@dh/@en/documents/digitalasset/dh_4018744.pdf
139 Welsh Assembly (2005), All Wales Standards for Neonatal Services, Children and Young People's Specialised Services Project (CYPSS)., p.31, 3.32
140 Welsh Assembly (2005), All Wales Standards for Neonatal Services, Children and Young People's Specialised Services Project (CYPSS).

The provision of neonatal services: international comparisons RAND Europe
52
published,141 but the CYPSS website states that the All Wales Standards will be based on the written standards of the BAPM.142
4.7 Evaluation processes
There are no formal evaluation processes of neonatal services in place at the time of writing. Wales does not operate a ‘payment by results’ system in its neonatal care service, as can be found in England, so there is not a sophisticated evaluation process in place.
141 Conversation with Dr James Moorcraft, Consultant Neonatologist at the Royal Glamorgan Hospital. 12 July 2007
142 CYPSS website, http://www.wales.nhs.uk/sites3/page.cfm?orgid=355&pid=4258, accessed 20/07/07.

53
CHAPTER 5 Northern Ireland
5.1 Summary
5.1.1 Key features Neonatal services are funded through the National Health Service for Northern Ireland. Neonatal services in Northern Ireland are under review at present: an additional £800,000 has been allocated for neonatal and paediatric intensive care services in 2007-2008, and this will contribute towards the establishment of a managed clinical network.143 There are 104 neonatal cots, spread among seven neonatal units across Northern Ireland.
Although there is currently no managed neonatal network in Northern Ireland, the province already has an informal network structure, in which comprehensive neonatal services are provided at one large regional unit, and additional services delivered at four sub-regional units and two peripheral ones. Infant, perinatal and neonatal rates fluctuate to a greater extent than those for the other countries studied, although the causes of this variation are unclear.
The province has no dedicated neonatal transport network, but it does operate one dedicated neonatal ambulance. There is no air transport system due to the small size of the province and high quality of the road infrastructure.
5.1.2 Key learning points A holistic approach is required when considering key areas for improvement to one aspect of a neonatal network service. For example, there is a critical shortage of nursing staff throughout the province, which is exacerbated by the absence of a centralised transport network and dedicated transport teams: every neonatal transfer takes staff from the unit of origin for the duration of the transfer, further reducing the number of available ward staff.
143 Hansard (2007), ‘House of Commons Written Answers for 31 January 2007, Col.354w’, HMSO.

The provision of neonatal services: international comparisons RAND Europe
54
5.2 Statistics and trends
5.2.1 Preterm and low birth weight births As noted in Chapter 3, data on preterm births is not available for Northern Ireland.144 The rate of low birth weight births (live births of less than 2.5kg) has fluctuated between 5.7 per cent and 6.3 per cent over the period 1997 to 2005.145
Figure 5.1 Trends in low birth weight births, Northern Ireland, 1997-2005
0
2
4
6
8
10
12
1997 1998 1999 2000 2001 2002 2003 2004 2005
Year
% o
f to
tal liv
e b
irth
s
% of total livebirths with
birthweight<2,500g
5.2.2 Mortality rates The birth rate (of live births) in Northern Ireland has shown a slight downward trend between 1997 and 2005, falling from a peak of 14.4 per 1,000 population in 1997 to a low of 12.6 in 2002. The birth rate then rose slightly to 13.0 in 2004, before falling to 12.9 in 2005.146 Provisional data from Hospital Statistics from the first two quarters of 2005-2006 indicate that there will be “a steady 2.5 per cent increase year on year from 2002-2003, which represents approximately an additional 500–600 births per year”.147 Such an increase will clearly impact upon the future demand for neonatal services.
144 http://www.dhsspsni.gov.uk/births2005.pdf;
145 Data taken from www.dhsspsni.gov.uk/cmo2003-infantmort.pdf, Table 6A, accessed 28 June 2007, and http://www.dhsspsni.gov.uk/births2005.pdf
146 http://www.nisra.gov.uk/archive/demography/publications/annual_reports/2005/Tab1.2_2005.xls, accessed 28t June 2007.
147 Ibid., p.16.

RAND Europe Northern Ireland
55
As noted in Chapter 3, Northern Ireland includes stillbirths in its figures for perinatal mortality, whereas this study is concerned only with deaths after birth.148 Figures for neonatal and infant mortality were available, however. 2005 saw a neonatal mortality rate (death within 28 days of birth) in Northern Ireland of for 4.9 per 1,000 live and still births, a jump of 1.3 per cent from the 2004 rate of 3.6 per 1,000 live and still births, and the highest since a peak of 5.5 per cent in 1995. Neonatal mortality rates do not echo the trend in birth rates seen between 1997 and 2005, but have fluctuated within the same period without demonstrating an overall fall. Infant mortality rates (death within one year of birth) have also fluctuated, between a low of 4.6 deaths per 1,000 live births in 2002 and a high of 7.1 deaths per 1,000 live births in 1995. The infant mortality rate began to climb again from 2002, reaching 6.1 in 2005.149
Figure 5.2 Trends in neonatal and infant mortality, Northern Ireland, 1995-2005
0
1
2
3
4
5
6
7
8
1995 1996 1997 1998 1999 2000 2001 2002 2003 2004 2005
Year
Nu
mb
er
of
de
ath
s p
er
1,0
00
liv
e b
irth
s
Infant mortality(Death within yearof birth)
Neonatal mortality(Death within 0-27days of birth)
5.2.3 Neonatal morbidity The Neonatal Intensive Care Outcomes Research and Evaluation (NICORE) group collects information on very low birth weight (VLBW) babies (infants with a birth weight between 401g and 1,500g). In 2005, there were 240 VLBW births recorded. Of these, 5.4 per cent suffered from congenital malformations. 81.6 per cent suffered from respiratory distress syndrome, 2.1 per cent suffered from a pneumothorax, and 18.3 per cent suffered from retinopathy of prematurity.
148 http://www.dhsspsni.gov.uk/infant_mortality2005.pdf
149 http://www.nisra.gov.uk/archive/demography/publications/annual_reports/2005/Tab1.2_2005.xls

The provision of neonatal services: international comparisons RAND Europe
56
Table 5.1 Morbidity Outcomes for Very Low Birth weight Infants, Northern Ireland, 2005150
Morbidity Number of Infants
Congenital malformations 13/ 240 (5.4 per cent)
Early Sepsis 15/ 239 (6.3 per cent) Not known = 1
Late sepsis (any pathogen) 69/ 219 (31.5 per cent) Not applicable = 21 (died before day 3)
Bacterial pathogen other than coagulase negative staphylococcus ONLY
14/ 219 (6.4 per cent) Not applicable = 21 (died before day 3)
Coagulase negative staphylococcus ONLY 33/ 219 (15.1 per cent) Not applicable = 21 (died before day 3)
Other bacterial pathogen AND Coagulase negative staphylococcus
22/ 219 (10.0 per cent) Not applicable = 21 (died before day 3)
Supplemental oxygen at 36 weeks adjusted gestational age
38/ 142 (26.8 per cent) Not applicable - 98
Respiratory Distress Syndrome (RDS) 196/ 240 (81.6 per cent)
Pneumothorax 5/ 240 (2.1 per cent)
Patent Ductus Arteriosus (PDA) 67/ 240 (27.9 per cent)
PDA surgery 3/ 240 (1.3 per cent)
Necrotizing enterocolitis 18/ 240 (7.5 per cent
Focal gastrointestinal perforation (Focal GI) 5/ 240 (2.1 per cent)
Periventricular – intraventricular haemorrhage US = 213/ 240 (88.7 per cent), IVH = 53 + 1 ungraded
Cystic periventricular leukomalacia (CPVL) For those infants US< cystic PVL, 3/209 (1.4 per cent), 1 unknown
Retinopathy of prematurity 44 infants (Grade 1 = 19, Grade 2 = 12, Grade 3 = 12, Grade 4 = 1) 12 infants underwent ROP surgery
5.3 Organisation and scale of provision of neonatal services
Neonatal services are funded through the National Health Service for Northern Ireland. There is no current formal neonatal network for Northern Ireland, and therefore funds are distributed by hospitals. The NHS in Northern Ireland falls under the control of the Northern Ireland Executive, and is managed by the Department of Health, Social Services and Public Safety (DHSSPS). Northern Ireland is divided into four Health and Social Service Boards who work on behalf of the DHSSPS in planning and commissioning services for their regions. Primary care services are provided by 15 Local Health and Social Care groups, while all other health and social care is provided by one of 19 Health and Social Service Trusts.
There are 104 neonatal cots divided between seven neonatal units across Northern Ireland.151 There is currently no managed clinical neonatal network, although this is under review. An additional £800,000 has been allocated for neonatal and paediatric intensive care services in 2007/2008, and this will contribute towards the establishment of a managed clinical network.152
150 McCall, E., et al. (2007), Eighth Annual Report on Very Low Birth Weight Infants born in Northern Ireland in 2005, (Neonatal Intensive Care Outcomes, Research and Evaluations Group), Table 7. (Total number of VLBW infants = 240).
151 Redshaw, M., Hamilton, K. (2005), A Survey of Current Neonatal Unit Organisation and Policy, Oxford: National Perinatal Epidemiology Unit.
152 Hansard (2007), ‘House of Commons Written Answers for 31st January 2007, Col.354w, HMSO.
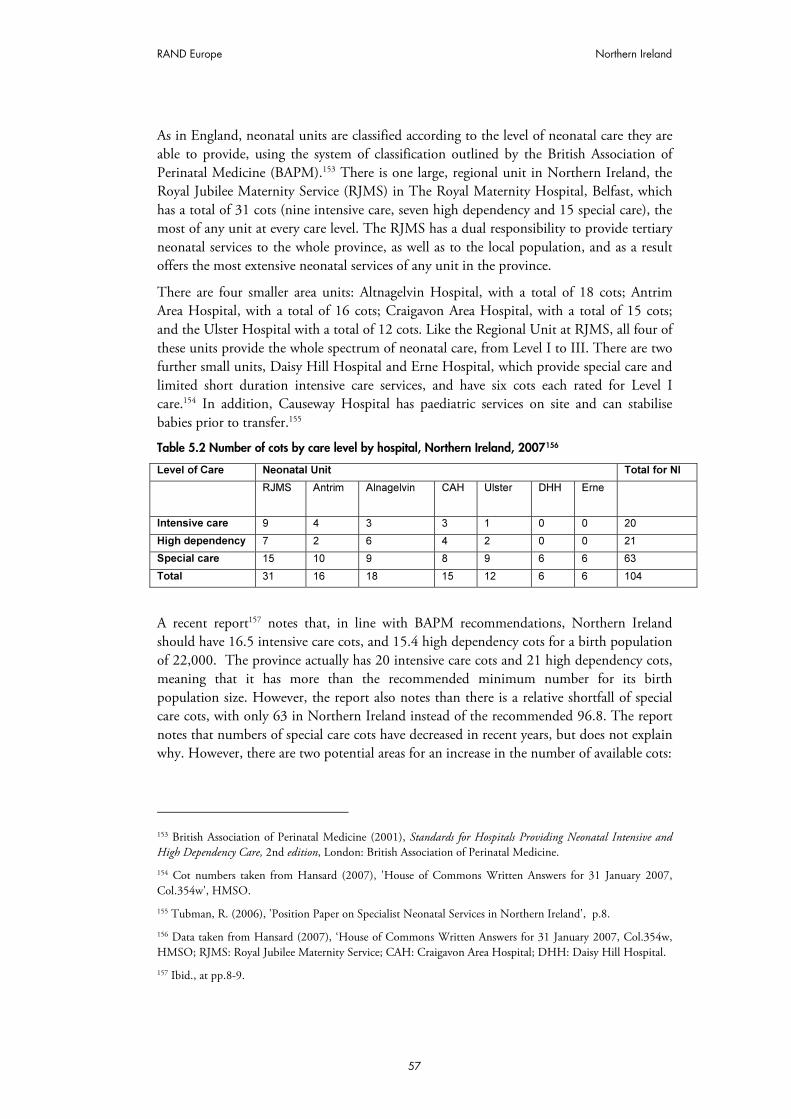
RAND Europe Northern Ireland
57
As in England, neonatal units are classified according to the level of neonatal care they are able to provide, using the system of classification outlined by the British Association of Perinatal Medicine (BAPM).153 There is one large, regional unit in Northern Ireland, the Royal Jubilee Maternity Service (RJMS) in The Royal Maternity Hospital, Belfast, which has a total of 31 cots (nine intensive care, seven high dependency and 15 special care), the most of any unit at every care level. The RJMS has a dual responsibility to provide tertiary neonatal services to the whole province, as well as to the local population, and as a result offers the most extensive neonatal services of any unit in the province.
There are four smaller area units: Altnagelvin Hospital, with a total of 18 cots; Antrim Area Hospital, with a total of 16 cots; Craigavon Area Hospital, with a total of 15 cots; and the Ulster Hospital with a total of 12 cots. Like the Regional Unit at RJMS, all four of these units provide the whole spectrum of neonatal care, from Level I to III. There are two further small units, Daisy Hill Hospital and Erne Hospital, which provide special care and limited short duration intensive care services, and have six cots each rated for Level I care.154 In addition, Causeway Hospital has paediatric services on site and can stabilise babies prior to transfer.155
Table 5.2 Number of cots by care level by hospital, Northern Ireland, 2007156
Level of Care Neonatal Unit Total for NI
RJMS Antrim Alnagelvin CAH Ulster DHH Erne
Intensive care 9 4 3 3 1 0 0 20
High dependency 7 2 6 4 2 0 0 21
Special care 15 10 9 8 9 6 6 63
Total 31 16 18 15 12 6 6 104
A recent report157 notes that, in line with BAPM recommendations, Northern Ireland should have 16.5 intensive care cots, and 15.4 high dependency cots for a birth population of 22,000. The province actually has 20 intensive care cots and 21 high dependency cots, meaning that it has more than the recommended minimum number for its birth population size. However, the report also notes than there is a relative shortfall of special care cots, with only 63 in Northern Ireland instead of the recommended 96.8. The report notes that numbers of special care cots have decreased in recent years, but does not explain why. However, there are two potential areas for an increase in the number of available cots:
153 British Association of Perinatal Medicine (2001), Standards for Hospitals Providing Neonatal Intensive and High Dependency Care, 2nd edition, London: British Association of Perinatal Medicine.
154 Cot numbers taken from Hansard (2007), 'House of Commons Written Answers for 31 January 2007, Col.354w', HMSO.
155 Tubman, R. (2006), 'Position Paper on Specialist Neonatal Services in Northern Ireland', p.8.
156 Data taken from Hansard (2007), ‘House of Commons Written Answers for 31 January 2007, Col.354w, HMSO; RJMS: Royal Jubilee Maternity Service; CAH: Craigavon Area Hospital; DHH: Daisy Hill Hospital.
157 Ibid., at pp.8-9.

The provision of neonatal services: international comparisons RAND Europe
58
• In RJMS there is an area of the neonatal unit with 15 additional Level III cots, which have never been staffed.
• The neonatal unit at Ulster Hospital is moving to larger premises in mid-August 2007. The new unit will have a total of 16 cots: two high dependency, two intensive care and 12 special care. This provides one additional intensive care to those currently available in the unit, and three further special care cots.158
The highest occupancy rates are in high dependency cots: analysis of unit activity shows that all occupancy rates exceeding 100 per cent are for high dependency care. Results of a four month real-time study (1st April to 31st July 2004) found an increasing trend in total number of babies in four specialist neonatal units (data not available for Altnagelvin). From May 2004, the units were always more than 70 per cent occupied. However, at no time did overall occupancy reach 100 per cent.159 Around 27,000 cot days are used per year in Northern Ireland for all levels of care, giving an occupancy rate of 71.8 per cent.
Most units are based around a hierarchical structure of clinicians, with consultant neonatologists or paediatricians running a team of specialised staff, including specialised registrars (SpR), and Senior House Officers (SHOs), as well as specialised nurse practitioners specifically trained for neonatology In RJMS, the neonatal unit is staffed by a 24 hour rota of Consultant Neonatologists, while area hospital units have one Consultant Neonatologist providing neonatal cover for officially 7.5 PAs (Programmed Activities) per week between 9am to 5pm. In area units, the majority of consultant and junior medical staff contributing to neonatal services work primarily in acute paediatrics and community paediatrics. When on call, medical staff provide cover for not only the neonatal service, but also general paediatrics, A&E and child protection. For example, in Antrim hospital the neonatal service is covered by the fully certified neonatologist on a one in eight rota, with community paediatricians providing 25 per cent of all consultant on-call cover. In all hospitals, a three-tier rota is recommended, with Enhanced Neonatal Nurse Practitioners (ENNPs) replacing the SHO tier in Antrim Hospital. These staff are included in Table 5.3, below.160
158 Telephone conversation with staff at Ulster Hospital Neonatal Unit, 31 July 2007. Ibid. at p.23.
159 Ibid., p.11.
160 Ibid., p. 27.
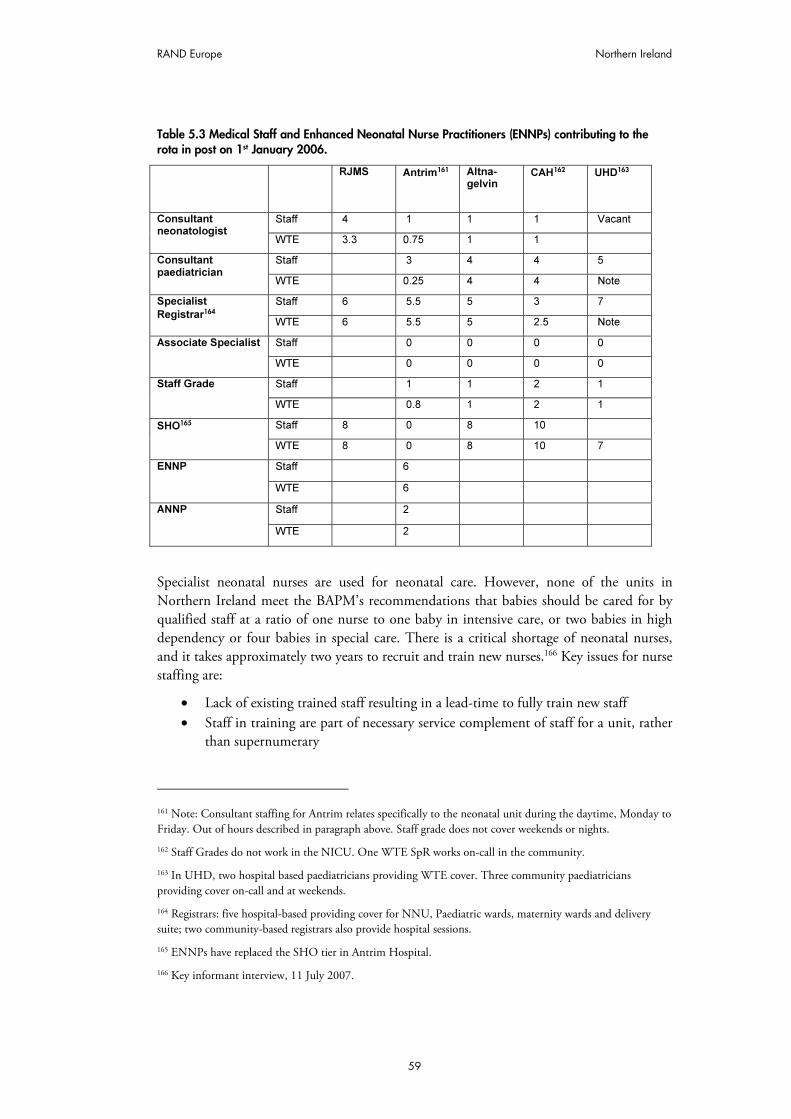
RAND Europe Northern Ireland
59
Table 5.3 Medical Staff and Enhanced Neonatal Nurse Practitioners (ENNPs) contributing to the rota in post on 1st January 2006.
RJMS Antrim161
Altna- gelvin
CAH162
UHD163
Staff 4 1 1 1 Vacant Consultant neonatologist
WTE 3.3 0.75 1 1
Staff 3 4 4 5 Consultant paediatrician
WTE 0.25 4 4 Note
Staff 6 5.5 5 3 7 Specialist
Registrar164 WTE 6 5.5 5 2.5 Note
Staff 0 0 0 0 Associate Specialist
WTE 0 0 0 0
Staff 1 1 2 1 Staff Grade
WTE 0.8 1 2 1
Staff 8 0 8 10 SHO165
WTE 8 0 8 10 7
Staff 6 ENNP
WTE 6
Staff 2 ANNP
WTE 2
Specialist neonatal nurses are used for neonatal care. However, none of the units in Northern Ireland meet the BAPM’s recommendations that babies should be cared for by qualified staff at a ratio of one nurse to one baby in intensive care, or two babies in high dependency or four babies in special care. There is a critical shortage of neonatal nurses, and it takes approximately two years to recruit and train new nurses.166 Key issues for nurse staffing are:
• Lack of existing trained staff resulting in a lead-time to fully train new staff • Staff in training are part of necessary service complement of staff for a unit, rather
than supernumerary
161 Note: Consultant staffing for Antrim relates specifically to the neonatal unit during the daytime, Monday to Friday. Out of hours described in paragraph above. Staff grade does not cover weekends or nights.
162 Staff Grades do not work in the NICU. One WTE SpR works on-call in the community.
163 In UHD, two hospital based paediatricians providing WTE cover. Three community paediatricians providing cover on-call and at weekends.
164 Registrars: five hospital-based providing cover for NNU, Paediatric wards, maternity wards and delivery suite; two community-based registrars also provide hospital sessions.
165 ENNPs have replaced the SHO tier in Antrim Hospital.
166 Key informant interview, 11 July 2007.
The provision of neonatal services: international comparisons RAND Europe
60
• Loss of Whole Time Equivalents, as many staff who trained full time opt to work part-time
• Age profile of existing neonatal staff suggests that there will be a staff crisis in the next 5-10 years. (This is a particular problem for RJMS and Altnagelvin Hospital.).
The planned development of the regional neonatal transport system has the potential to impact adversely on the availability of regional/tertiary cots in RJMS by utilising staff for transfers, thus reducing the number of staffed cots.167
5.4 Transport services
There are no dedicated transport teams, but transport of neonates does require staff with specialised training. The number of staff required depends on the condition of the baby, but an intensive care transfer will require a neonatal nurse and a mid-grade doctor or consultant specialising in neonatology. Enhanced Neonatal Nurse Practitioners (ENNPs; the equivalent of ANNPs in the rest of the UK) may also be used. However, there is no designated allocation of neonatal transport staff, so every transfer removes staff from operational duty on neonatal wards.
There exists an informal network between five neonatal units, one in Belfast and the other four across the Province. The system is currently under review168 and a neonatal and paediatric critical care transport service is being developed. A lead consultant, Dr Richard Tubman, has already been appointed for this service, and other staff are being recruited.169
Northern Ireland has one specialised ambulance dedicated to neonatal transfers. Other transfers depend upon a standard ambulance, which has the correct fittings to secure a transport incubator. Not all ambulances are adapted in this way, and this can further delay transfers until an adapted ambulance becomes available.170 Almost all transfers happen by road. There is no dedicated aircraft, and, in the opinion of those contacted, no real need for one due to the small size of the province and the high quality of the road network. Occasional use may be made of the Scottish or English specialist air transfer service, for which Northern Irish health boards are charged by the Scottish network or English Trust.171 Transfer arrangements exist with Glasgow and Birmingham if a baby requires a supra-regional service for clinical reasons.172
Such inter-regional transfers are uncommon: from January to June 2007, all neonatal care needs were met within the province, and therefore no transport of babies outside Northern
167 Tubman, R. (2006), 'Position Paper on Specialist Neonatal Services in Northern Ireland', p.9.
168 Key informant interview, July 2007.
169 Hansard (2007), ‘House of Commons Written Answers for 31 January 2007, Col.354w’, HMSO.
170 Key informant interview, 11 July 2007.
171 National Health Services Scotland (2006), Neonatal Transport Service Annual Report 2004–2005.
172 Tubman, R. (2006),'Position Paper on Specialist Neonatal Services in Northern Ireland', p.8.

RAND Europe Northern Ireland
61
Ireland was required.173 Between 2002 and 2006, only 15 infants were transferred outside the province for services not provided within Northern Ireland.174 However, there is a high demand within the province for acute neonatal transfers: one estimate is that there are approximately two requests for neonatal transfers each day, 25 per cent of which are due to lack of unit capacity.175
5.5 Costs of neonatal services
Funding of £250,000 has been allocated in 2005/2006 for provision of an additional staffed and equipped intensive care cot in Craigavon Area Hospital. This cot should become operational in April 2006 and will increase capacity in the region. The impact of this additional cot should be closely evaluated.176
The average costs associated with transferring a baby outside Northern Ireland for treatment are in the region of £5,000 to £8,000 per transport. This is with the exception of ECMO cases (Extra Corporeal Membrane Oxygenation), which is a service not currently provided in NI. Babies requiring this treatment are collected by a specially equipped and staffed helicopter at a cost of approximately £20,000.
5.6 Best practices and guidelines
In addition to the general guidelines produced for the whole of the UK, Northern Ireland health services have also produced guidelines specific to the region.
• One of the most recent is a 2006 publication, Position Paper on Specialist Neonatal Services in Northern Ireland177, produced for the Chief Medical Officer of Northern Ireland and advised by the Neonatal Services Working Group. As for Wales and Scotland, the British Association of Perinatal Medicine has published standards and guidelines that are used as a benchmark throughout the UK.178 179
173 Key informant interview, July 2007.
174 Hansard (2007), ‘House of Commons Written Answers for 31 January 2007, Col.354w’, HMSO.
175 Information taken from key informant interview, 11 July 2007. See also Tubman, R. (2006), 'Position Paper on Specialist Neonatal Services in Northern Ireland', p.14.
176 Ibid., p.23.
177 Ibid.
178 Laing, I., et al. (2004), Designing a Neonatal Unit: Report for the British Association of Perinatal Medicine, British Association of Perinatal Medicine, London.
179 British Association of Perinatal Medicine (2001), Standards for Hospitals Providing Neonatal Intensive and High Dependency Care, 2nd edition, London.

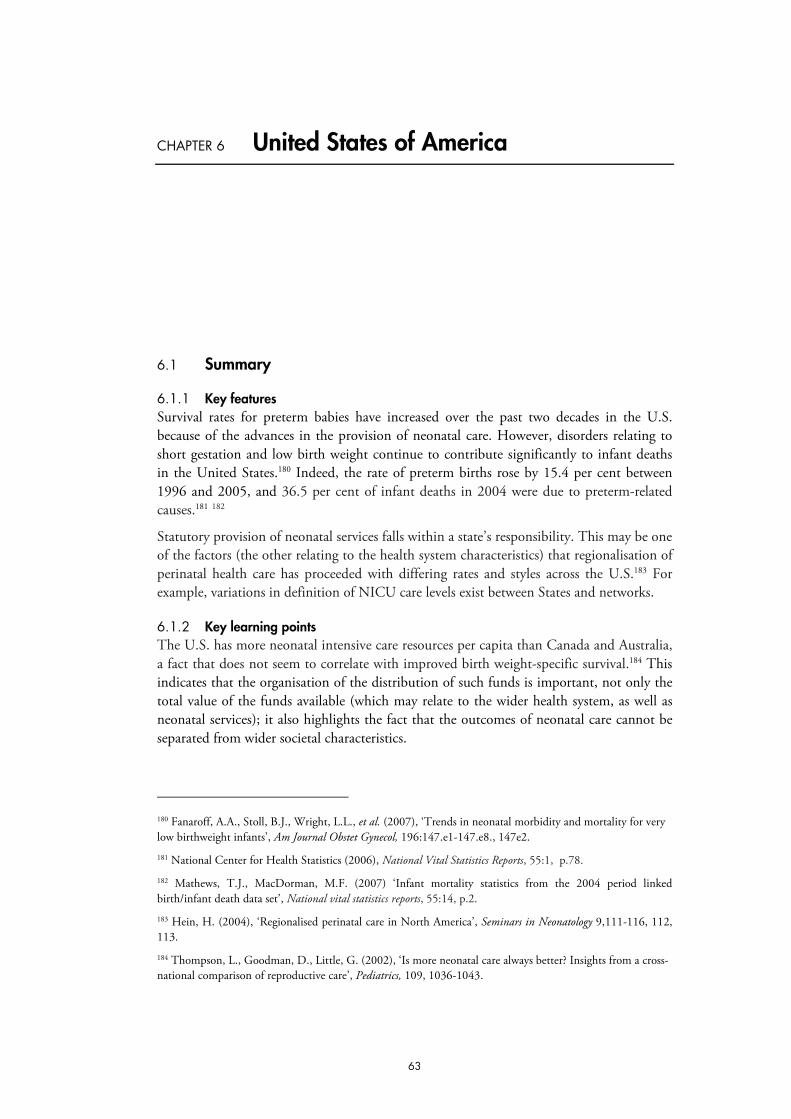
63
CHAPTER 6 United States of America
6.1 Summary
6.1.1 Key features Survival rates for preterm babies have increased over the past two decades in the U.S. because of the advances in the provision of neonatal care. However, disorders relating to short gestation and low birth weight continue to contribute significantly to infant deaths in the United States.180 Indeed, the rate of preterm births rose by 15.4 per cent between 1996 and 2005, and 36.5 per cent of infant deaths in 2004 were due to preterm-related causes.181 182
Statutory provision of neonatal services falls within a state’s responsibility. This may be one of the factors (the other relating to the health system characteristics) that regionalisation of perinatal health care has proceeded with differing rates and styles across the U.S.183 For example, variations in definition of NICU care levels exist between States and networks.
6.1.2 Key learning points The U.S. has more neonatal intensive care resources per capita than Canada and Australia, a fact that does not seem to correlate with improved birth weight-specific survival.184 This indicates that the organisation of the distribution of such funds is important, not only the total value of the funds available (which may relate to the wider health system, as well as neonatal services); it also highlights the fact that the outcomes of neonatal care cannot be separated from wider societal characteristics.
180 Fanaroff, A.A., Stoll, B.J., Wright, L.L., et al. (2007), ‘Trends in neonatal morbidity and mortality for very low birthweight infants’, Am Journal Obstet Gynecol, 196:147.e1-147.e8., 147e2.
181 National Center for Health Statistics (2006), National Vital Statistics Reports, 55:1, p.78.
182 Mathews, T.J., MacDorman, M.F. (2007) ‘Infant mortality statistics from the 2004 period linked birth/infant death data set’, National vital statistics reports, 55:14, p.2.
183 Hein, H. (2004), ‘Regionalised perinatal care in North America’, Seminars in Neonatology 9,111-116, 112, 113.
184 Thompson, L., Goodman, D., Little, G. (2002), ‘Is more neonatal care always better? Insights from a cross-national comparison of reproductive care’, Pediatrics, 109, 1036-1043.

The provision of neonatal services: international comparisons RAND Europe
64
Evidence from the U.S. also indicates that the federal government’s role in neonatal care in very small, which means that states take the lead in organising services. The U.S. thus provides a wealth of differing models for neonatal service organisation, which have evolved in varying ways according to the level of action taken by state governments, professional associations, individual hospitals, private healthcare organisations, and specific bodies that have grown up in order to support neonatal services in a region. Despite this limited federal involvement, central government agencies were able to provide ample and detailed nationwide neonatal statistics.
In addition, a recent article has identified three problem areas for regionalised perinatal care in the U.S.:
• Professional egos and vested interests in all sectors (hospital, agency, public and private sector) hinder mutual understanding and impede co-operative ventures
• There is a danger of “impersonal care”, which downgrades individuals’ emotional needs in favour of inflexible systems
• Sub-optimal utilisation of perinatal services when compared to other developed Western countries185
The state of California illustrates how the organisation of neonatal services can be facilitated by initiatives in certain areas. For example, the state has been operating Perinatal Transport Systems since 1976, which collects and analyses neonatal transport data for analysis and planning. The California Children’s Services (CCS) Program sets detailed specifications for designated NICU levels of care. In addition, California has set up two major quality improvement enterprises related to neonatal care: the California Perinatal Quality Care Collaborative (CPQCC)186 and the Neonatal Quality Improvement Initiative (NQI).187
6.2 Statistics and trends
6.2.1 Preterm births In 2005, 12.7 per cent of total live births had less than 37 weeks’ gestation (preterm), including 2.03 per cent of births with less than 32 weeks’ gestation (very preterm).188 This represents a rise of 15.4 per cent in the rate of preterm births between 1996 and 2005.
185 Yu, V., Dunn, P. (2004), ‘Development of regionalised perinatal care’, Seminars in Neonatology 9:2, 89-97, 92-3.
186 http://www.cpqcc.org/
187 http://www.dhs.ca.gov/pcfh/cms/nqi/default.htm
188 Preliminary data. http://www.cdc.gov/nchs/data/hestat/prelimbirths05_tables.pdf#5
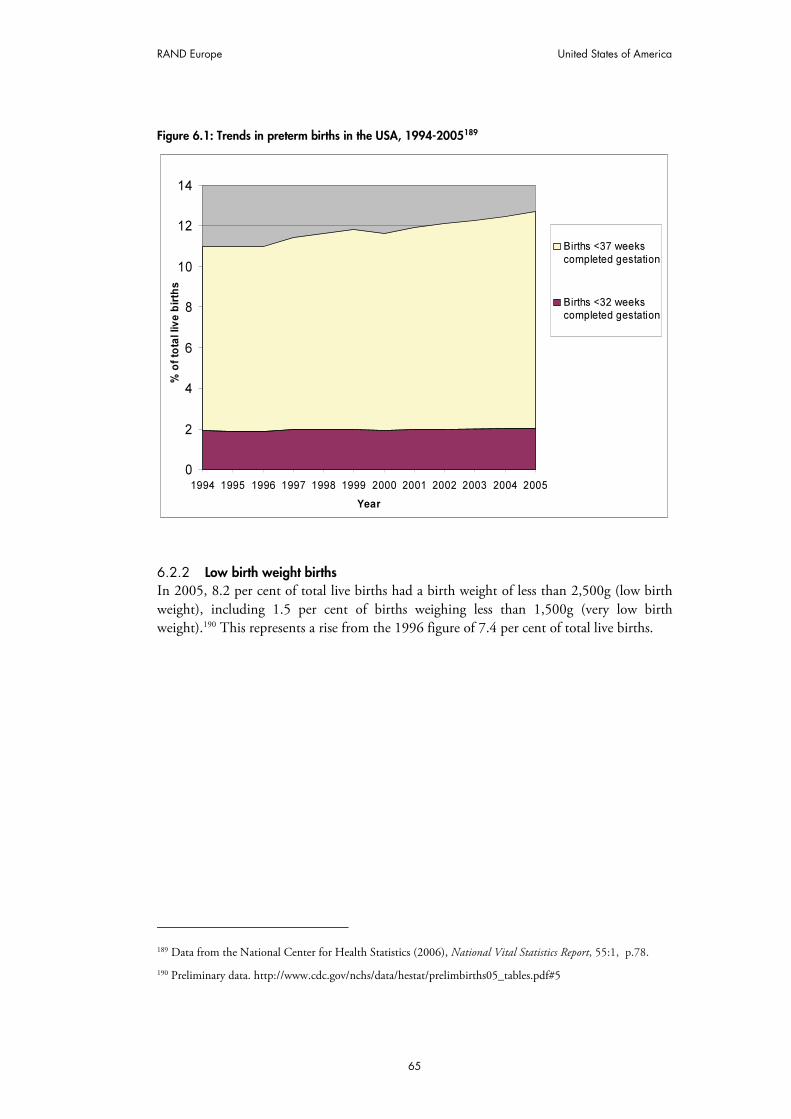
RAND Europe United States of America
65
Figure 6.1: Trends in preterm births in the USA, 1994-2005189
0
2
4
6
8
10
12
14
1994 1995 1996 1997 1998 1999 2000 2001 2002 2003 2004 2005
Year
% o
f to
tal liv
e b
irth
s
Births <37 weeks
completed gestation
Births <32 weekscompleted gestation
6.2.2 Low birth weight births In 2005, 8.2 per cent of total live births had a birth weight of less than 2,500g (low birth weight), including 1.5 per cent of births weighing less than 1,500g (very low birth weight).190 This represents a rise from the 1996 figure of 7.4 per cent of total live births.
189 Data from the National Center for Health Statistics (2006), National Vital Statistics Report, 55:1, p.78.
190 Preliminary data. http://www.cdc.gov/nchs/data/hestat/prelimbirths05_tables.pdf#5
The provision of neonatal services: international comparisons RAND Europe
66
Figure 6.2: Trends in low birth weight births in the USA, 1994-2005191
0
1
2
3
4
5
6
7
8
9
1994 1995 1996 1997 1998 1999 2000 2001 2002 2003 2004 2005
Year
% o
f to
tal liv
e b
irth
s
% of total live births
with birthweight<2,500g
% of total live births
with birthweight<1,500g
6.2.3 Mortality rates In 2004, perinatal mortality (death within 7 days of birth) stood at 3.6 births per 1,000 live births. Neonatal mortality (death within 28 days of birth) was 4.5 by the same measure, while the infant mortality rate (death within one year of birth) was 6.78. Mortality rates varied significantly by birth weight: in 2004, infant mortality rates per 1,000 live births stood at 244.5 for birth weights of less than 1,500g, 15.0 for 1,500g-2,499g, and 2.3 for 2,500g and over. A study of three cohorts of very low birth weight infants (1990/1991, 1995/1996, 1997/2002) at 16 US neonatal centres found that mortality for the whole cohort declined from 20 per cent in 1990/1991 to 15 per cent in 1997/2002.192
191 Data taken from National Vital Statistics Reports Vol.55. No.14; Vol.54. No.16.; Vol.53, No.10; Vol.52, No.2; Vol.50, No.12; Vol.50, No.4; Vol.48, No.12; Vol.47, No.23; Vol.46, No.12; Vol.46, No.6.
192 Fanaroff, A.A., Stoll, B.J., Wright, L.L., et al.(2007), ‘Trends in neonatal morbidity and mortality for very low birthweight infants’. American Journal Obstet Gynecol 196:147.e1-147.e8., 147e2.

RAND Europe United States of America
67
However, survival rates did not change greatly between the 1995/1996 and 1997/2002 cohorts, and did not improve significantly during the latter period. This supports the view that there was a plateau in neonatal mortality and morbidity rates in the late 1990s.193
Figure 6.3: Trends in perinatal, neonatal and infant mortality, USA, 1994-2005194
0
1
2
3
4
5
6
7
8
1995 1996 1997 1998 1999 2000 2001 2002 2003 2004
Year
Nu
mb
er
of
de
ath
s p
er
1,0
00
liv
e b
irth
s
Infant mortality
(Death within year ofbirth)Neonatal mortality(Death within 0-27
days of birth)Perinatal mortality(Death within 7 days
of birth)
6.2.4 Neonatal morbidity A study at a tertiary referral neonatal care centre in the U.S. found that there were improved neurodevelopmental outcomes for babies with birth weights 500g-999g in the period 2000/2002 compared with 1990/1999. Measured at 20 months’ corrected age, the incidence of cerebral palsy decreased from 13 per cent in 1990/1999 to 5 per cent in 2000/2002. The rate had previously increased between the period 1980/1989 (8 per cent) and 1990/1999 (13 per cent). It was claimed that this increase was owing to increased survival rates leading to increased survival with impairment; these impairments were then addressed by changes in clinical practice in the 1990s, which led to a fall in morbidities once again.195
In the same study, the incidence of blindness amongst very low birth weight babies declined between 1980/1989 and 2000/2002.196 However, it should be noted that these 193 Horbar, J., Badger, G., Carpenter, J. (2002), ‘Trends in Mortality and Morbidity for Very Low Birth Weight Infants, 1991-1999’, Pediatrics 110, 143-151.
194 Data taken from National Vital Statistics Reports Vol.55. No.14; Vol.54. No.16; Vol.53, No.10; Vol.52, No.2; Vol.50, No.12; Vol.50, No.4; Vol.48, No.12; Vol.47, No.23; Vol.46, No.12; Vol.46, No.6.
195 Wilson-Costello, D., Friedman, H., Nori Minich, M., et al. (2007), ‘Improved Neurodevelopmental Outcomes for Extremely Low Birth Weight Infants in 2000-2002’, Pediatrics 119:1, 37-45, 37.
196 Ibid., p.41.

The provision of neonatal services: international comparisons RAND Europe
68
figures are low in absolute terms. The study also states that the rate of neurodevelopmental impairment amongst very low birth weight babies fell from 35 per cent to 23 per cent between 1990/1999 and 2000/2002.197
6.3 Organisation and scale of provision of neonatal services
Statutory provision of neonatal services is organised at a state level. For example, the California Code of Regulations specifies the services that NICUs existing within the state should provide, including standards for policies and procedures, basic staff numbers and qualifications, and provisions for transfers between NICUs offering different levels of care.198 The Illinois Code of Regulations gives an explicit definition of regional neonatal networks.199 In 2005, New York State introduced regulatory changes that gave comprehensive specifications for neonatal care and neonatal networks in the state, and described the resources available for different levels of NICUs. The amendments define the regional neonatal network, give requirements for staffing, quality improvement activities and transfers between NICUs.200
In 1976, the Committee on Perinatal Health201 and the March of Dimes Foundation published the influential report Toward Improving the Outcome of Pregnancy (TIOP).202 This report suggested that to aid understanding neonatal care should be split into three levels according to its complexity. It also recommended a regionalised system where very sick patients were referred to better-equipped centres. These guidelines were subsequently adopted by the Federal Government and half its State legislatures.203 These recommendations were reaffirmed by the March of Dimes’ 1993 report Toward Improving the Outcome of Pregnancy: The 90s and Beyond.204
197 Ibid.,
198 California Code of Regulations (1995), Title 22: Social Security, Volume 28, Revised November 1995. Perinatal Unit General Requirements §70547- 79723. Available at http://www.calregs.com/linkedslice/default.asp?SP=CCR-1000&Action=Welcome 199 Illinois Code of Regulations, Title 77: Public Health, Chapter I: Department Of Public Health, Subchapter L: Maternal And Childcare, Part 640 Regionalised Perinatal Health Care Code, Section 640.80 Regional Perinatal Networks – Composition And Funding.
200 http://w3.health.state.ny.us/dbspace/propregs.nsf/4ac9558781006774852569bd00512fda/d98f244dc1901f9285256e900050ace0?OpenDocument; http://w3.health.state.ny.us/dbspace/NYCRR10.nsf/11fb5c7998a73bcc852565a1004e9f87/8525652c00680c3e8525652c00630816?OpenDocument
201 Organised by the American Medical Association, the American College of Obstetricians and Gynecologists, American Academy of Pediatrics and the American Academy of Family Physicians.
202 March of Dimes National Foundation (1976), Toward Improving the Outcome of Pregnancy: Recommendations for the Regional Development of Maternal and Perinatal Services.
203 Yu, V., Dunn, P. (2004), ‘Development of regionalised perinatal care’, Seminars in Neonatology 9:2, 89-97, 91.
204 March of Dimes Birth Defects Foundation (1993), Toward Improving the Outcome of Pregnancy: The 90s and Beyond.
RAND Europe United States of America
69
However, the regionalisation of perinatal health care has proceeded ‘with very individualistic rates and styles’ across the U.S., and has been hampered by competition and professional jealousies, which means that ‘a uniform system that followed the ideal model set forth in Toward improving the outcome of pregnancy never developed’.205 A 2001 survey of states’ perinatal health policies found ‘substantial variation among states in the definition of NICU levels’, and that disagreements among physicians and hospitals at different levels made it more difficult to enforce uniform definitions.206 In 2004, the American Academy of Pediatrics stated that ‘no national definition’ of levels of neonatal care existed, making intra-country comparisons difficult; the AAP subsequently proposed new definitions.207 A 2001 survey by the Section on Perinatal Pediatrics of the American Academy of Pediatrics found that 32 of the 50 states had published definitions of levels of care, and that great diversity existed between states. Only 15 states had definitions of care that used specific language regarding birthweight and/or preterm status as criteria for a particular level of care.208
Variation also occurs for aspects other than standardising levels of care. For example, in a less populous state such as Iowa, the Statewide Perinatal Care Program was able to take an overview of the state situation so that patterns of referral and regional referral centres could be established in a coherent, planned manner. In contrast, the vested interests created by competition in more populous areas meant that introducing such plans was more difficult. Instead, there were a variety of systems, mostly centred on metropolitan hospitals or teaching hospitals. According to the area in question, ‘some systems evolved that had clear-cut referral patterns and responsibilities… but in other cases, the relationship was simply one of receiving referrals at a central hospital’.209
Indeed, there is evidence of increasing deregionalisation in neonatal networks since the late 1980s.210 In deregionalisation, referrals are not necessarily directed to centres capable of providing the highest quality of care, but rather to hospitals that are willing to provide the care in question. These lower-quality hospitals may nevertheless have the same care level designation (i.e. Level III) as the main referral centre, since variations exist within the recommended TIOP levels. Hence, the public may be unaware that patients are not being referred to hospitals that could provide the highest level of care in the region.211 This is
205 Hein, H. (2004), ‘Regionalised perinatal care in North America’, Seminars in Neonatology 9, 111-116, 112, 113.
206 Shaffer E. (2001), State Policies and Regional Neonatal Care: Progress and Challenges 25 Years After TIOP, March of Dimes Foundation.
207 Stark, A. (2004), ‘Policy Statement: Committee on Fetus and Newborn: Levels of Neonatal Care’, Pediatrics 114:5, 1341-1347, 1342. 208 Ibid., p.1342.
209 Hein, H. (2004), ‚Regionalised perinatal care in North America’, Seminars in Neonatalogy, 9, 111-116, 113.
210 Dobrez, D., Gerber, S., Budetti, P. (2006), ‘Trends in Perinatal Regionalisation and the Role of Managed Care’, Obstetrics and Gynecology, 108, 839-845, 839; Gould, J., Marks, A., Chavez, G. (2002), ‘Expansion of Community-Based Perinatal Care in California’, Journal of Perinatology, 22, 630-640; Mehta, S., et al. (2000), ‘Differential Markers for Regionalisation’, Journal of Perinatology, 20, 366-372.
211 Hein, H. (2004), ‘Regionalised perinatal care in North America’, Seminars in Neonatalogy, 9, 111-116.

The provision of neonatal services: international comparisons RAND Europe
70
particularly significant given that goal number 16-8 of the U.S. government’s Healthy People 2010 Initiative is to ‘increase the proportion of very low birthweight infants born at Level III hospitals or perinatal centers’ to 90 per cent.212
The trend to deregionalisation has been explained by the widespread availability of effective technology and highly trained perinatal specialists, as well as financial incentives brought about by managed care. These developments led to a dramatic proliferation of community-based NICUs, particularly in suburban areas, and decreased high-risk births at regional centres. This was also driven by the desire of healthcare providers and hospitals to compete for families with health insurance.213 It has also been suggested that there has been a proliferation of NICUs that can offer neonatologists but lack outreach education and the ability to co-ordinate services regionally, and that these NICUs exacerbate the competitive situation that contributes to deregionalisation.214
It has been argued that the rise of the “managed care” movement in the USA may have contributed to the trend of deregionalisation.215 Managed care is a system driven by third-party healthcare funders, and was intended to reduce healthcare costs by improving the health of patients served. As of 2006, 159 million Americans were enrolled in managed care organisations (representing 74.9 per cent of commercial healthcare participants).216 However, it is argued that ‘managed care became a system of managed costs’, and healthcare providers were obliged to become part of organisations geared towards providing healthcare at the lowest possible cost. Therefore, concerns have been raised that powerful third-party funders may dictate that neonatal networks adopt practices (for example, procedures that reduce referrals to more expensive care sites) that may be detrimental to the health of its patients.217 Health maintenance organisations (HMOs), a type of managed care organisation, can restrict patients’ options for care, limiting health coverage to certain providers and thereby creating de facto networks.218 A 2001 study found that ‘Hospital networks and managed care organisations were mentioned frequently as
212 U.S. Department of Health and Human Services (2000), Healthy People 2010: Conference edition. Washington (DC).
213 Gould, J., Marks, A., Chavez, G.. (2002), ‘Expansion of Community-based Perinatal Care in California’, Journal of Perinatology, 22, 630-640, p.630 ; Mehta, S., et al. (2000), ‘Differential Markers for Regionalisation’, Journal of Perinatology, 20, 366-372.
214 Hein, H. (1999), ‘Regionalisation of Perinatal Health Care: A lesson learned but lost’, Journal of Perinatology, 19:8, 584-588.
215 Dobrez, D., Gerber, S., Budetti, P. (2006), ‘Trends in Perinatal Regionalisation and the Role of Managed Care’, Obstetrics and Gynecology, 108, 839-845, 839.
216 MCOL (2006), Managed Care National Statistics. Available at: http://www.mcareol.com/factshts/factnati.htm
217 Hein, H.(2004), ‘Regionalised perinatal care in North America’, Seminars in Neonatology, 9, 111-116, .113.
218 Dobrez, D., Gerber, S., Budetti, P. (2006), ‘Trends in Perinatal Regionalisation and the Role of Managed Care’, Obstetrics and Gynecology, 108, 839-845.

RAND Europe United States of America
71
sources of conflict with state rules regarding which hospitals can admit and transfer, and where.’219
However, two recent (linked) studies of perinatal care in the states of Washington, Illinois, California and North Carolina between 1989 and 1998 have found that an association cannot be made between prevalence of managed care and perinatal regionalisation.220 There was evidence that Illinois and North Carolina show ‘strong signs of increasing regionalisation’, because the percentage of low birth weight births in Level III facilities increased between 1989 and 1998. Washington, which had the highest level of regionalisation in 1989, showed little change. By contrast, California appeared to have a far more deregionalised system, with a much lower proportion of low birth weight births taking place in Level III facilities. Indeed, California exhibited a pattern suggestive of deregionalisation from Level III to Level II hospitals.221
Figure 6.4: Percentage of low birth weight deliveries by state and level of hospital, USA, 1989 and 1998222
0
10
20
30
40
50
60
Level
I
Level
II
Level
III
Level
I
Level
II
Level
III
Level
I
Level
II
Level
III
Level
I
Level
II
Level
III
California Illinois North Carolina Washington
State and hospital level
Pe
rce
nta
ge
of
low
bir
thw
eig
ht
de
liv
eri
es
1989
1998
219 Shaffer E. (2001), State Policies and Regional Neonatal Care: Progress and Challenges 25 Years After TIOP. March of Dimes Foundation, p.2.
220 Dobrez, et al. (2006); Gerber, S., Dobrez, D., Budetti, P. (2001) ‘Managed care and perinatal regionalisation in Washington State’, Obstetrics and Gynecology 98, 139-43.
221 Dobrez, D., Gerber, S., Budetti, P. (2006), ‘Trends in Perinatal Regionalisation and the Role of Managed Care’, Obstetrics and Gynecology, 108, 839-845., 842-3. This study has some limitations: the four states do not represent a generalisable sample and hospital level data were not consistently available for the whole study period.
222 Ibid.
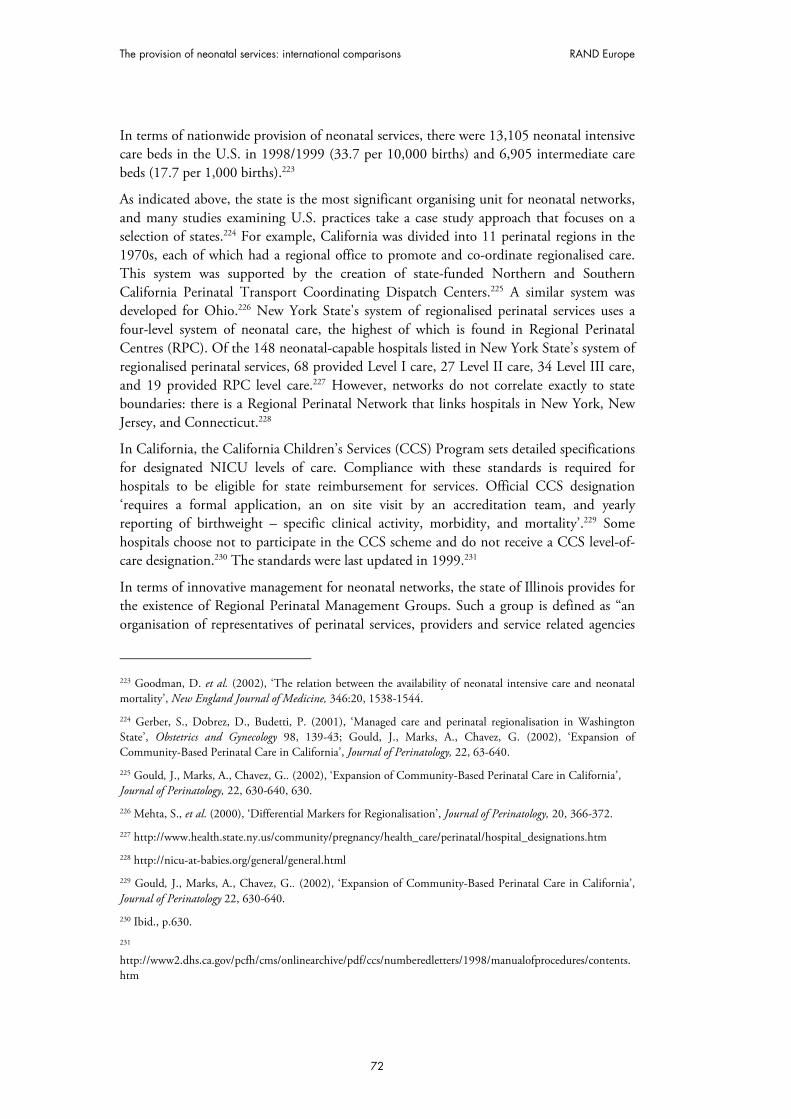
The provision of neonatal services: international comparisons RAND Europe
72
In terms of nationwide provision of neonatal services, there were 13,105 neonatal intensive care beds in the U.S. in 1998/1999 (33.7 per 10,000 births) and 6,905 intermediate care beds (17.7 per 1,000 births).223
As indicated above, the state is the most significant organising unit for neonatal networks, and many studies examining U.S. practices take a case study approach that focuses on a selection of states.224 For example, California was divided into 11 perinatal regions in the 1970s, each of which had a regional office to promote and co-ordinate regionalised care. This system was supported by the creation of state-funded Northern and Southern California Perinatal Transport Coordinating Dispatch Centers.225 A similar system was developed for Ohio.226 New York State's system of regionalised perinatal services uses a four-level system of neonatal care, the highest of which is found in Regional Perinatal Centres (RPC). Of the 148 neonatal-capable hospitals listed in New York State’s system of regionalised perinatal services, 68 provided Level I care, 27 Level II care, 34 Level III care, and 19 provided RPC level care.227 However, networks do not correlate exactly to state boundaries: there is a Regional Perinatal Network that links hospitals in New York, New Jersey, and Connecticut.228
In California, the California Children’s Services (CCS) Program sets detailed specifications for designated NICU levels of care. Compliance with these standards is required for hospitals to be eligible for state reimbursement for services. Official CCS designation ‘requires a formal application, an on site visit by an accreditation team, and yearly reporting of birthweight – specific clinical activity, morbidity, and mortality’.229 Some hospitals choose not to participate in the CCS scheme and do not receive a CCS level-of-care designation.230 The standards were last updated in 1999.231
In terms of innovative management for neonatal networks, the state of Illinois provides for the existence of Regional Perinatal Management Groups. Such a group is defined as “an organisation of representatives of perinatal services, providers and service related agencies
223 Goodman, D. et al. (2002), ‘The relation between the availability of neonatal intensive care and neonatal mortality’, New England Journal of Medicine, 346:20, 1538-1544.
224 Gerber, S., Dobrez, D., Budetti, P. (2001), ‘Managed care and perinatal regionalisation in Washington State’, Obstetrics and Gynecology 98, 139-43; Gould, J., Marks, A., Chavez, G. (2002), ‘Expansion of Community-Based Perinatal Care in California’, Journal of Perinatology, 22, 63-640.
225 Gould, J., Marks, A., Chavez, G.. (2002), ‘Expansion of Community-Based Perinatal Care in California’, Journal of Perinatology, 22, 630-640, 630.
226 Mehta, S., et al. (2000), ‘Differential Markers for Regionalisation’, Journal of Perinatology, 20, 366-372.
227 http://www.health.state.ny.us/community/pregnancy/health_care/perinatal/hospital_designations.htm
228 http://nicu-at-babies.org/general/general.html
229 Gould, J., Marks, A., Chavez, G.. (2002), ‘Expansion of Community-Based Perinatal Care in California’, Journal of Perinatology 22, 630-640.
230 Ibid., p.630.
231 http://www2.dhs.ca.gov/pcfh/cms/onlinearchive/pdf/ccs/numberedletters/1998/manualofprocedures/contents.htm
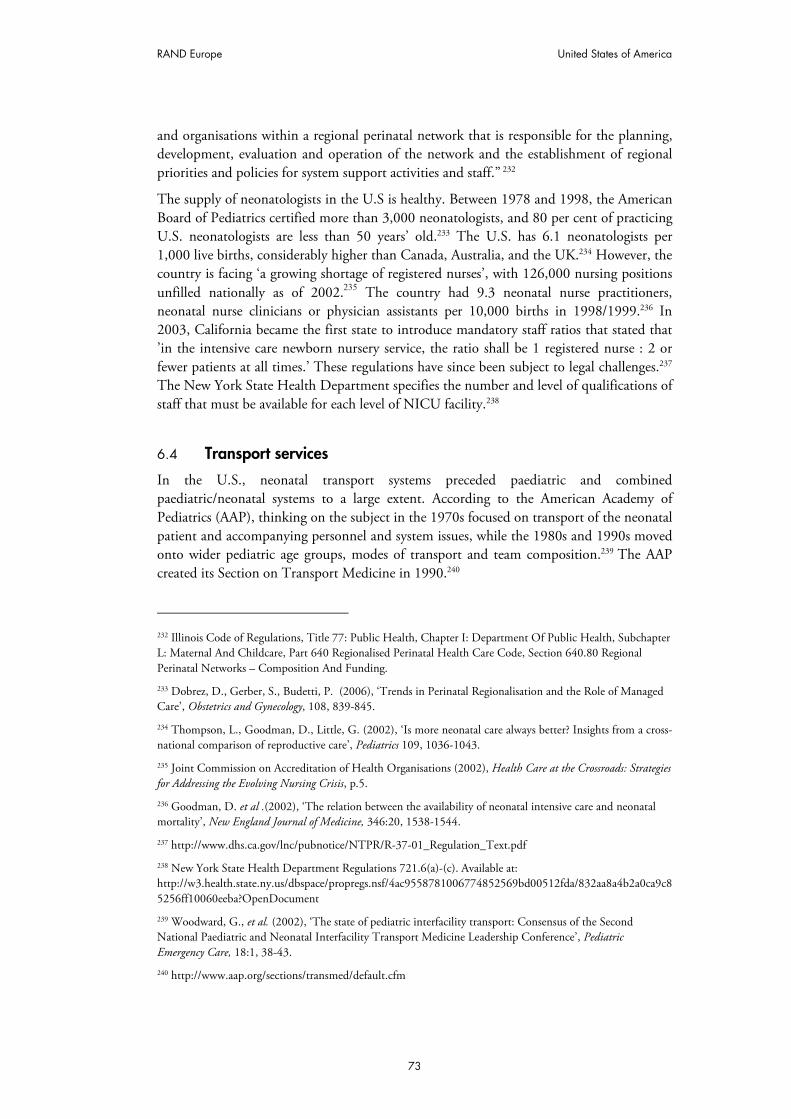
RAND Europe United States of America
73
and organisations within a regional perinatal network that is responsible for the planning, development, evaluation and operation of the network and the establishment of regional priorities and policies for system support activities and staff.” 232
The supply of neonatologists in the U.S is healthy. Between 1978 and 1998, the American Board of Pediatrics certified more than 3,000 neonatologists, and 80 per cent of practicing U.S. neonatologists are less than 50 years’ old.233 The U.S. has 6.1 neonatologists per 1,000 live births, considerably higher than Canada, Australia, and the UK.234 However, the country is facing ‘a growing shortage of registered nurses’, with 126,000 nursing positions unfilled nationally as of 2002.235 The country had 9.3 neonatal nurse practitioners, neonatal nurse clinicians or physician assistants per 10,000 births in 1998/1999.236 In 2003, California became the first state to introduce mandatory staff ratios that stated that ’in the intensive care newborn nursery service, the ratio shall be 1 registered nurse : 2 or fewer patients at all times.’ These regulations have since been subject to legal challenges.237 The New York State Health Department specifies the number and level of qualifications of staff that must be available for each level of NICU facility.238
6.4 Transport services
In the U.S., neonatal transport systems preceded paediatric and combined paediatric/neonatal systems to a large extent. According to the American Academy of Pediatrics (AAP), thinking on the subject in the 1970s focused on transport of the neonatal patient and accompanying personnel and system issues, while the 1980s and 1990s moved onto wider pediatric age groups, modes of transport and team composition.239 The AAP created its Section on Transport Medicine in 1990.240
232 Illinois Code of Regulations, Title 77: Public Health, Chapter I: Department Of Public Health, Subchapter L: Maternal And Childcare, Part 640 Regionalised Perinatal Health Care Code, Section 640.80 Regional Perinatal Networks – Composition And Funding.
233 Dobrez, D., Gerber, S., Budetti, P. (2006), ‘Trends in Perinatal Regionalisation and the Role of Managed Care’, Obstetrics and Gynecology, 108, 839-845.
234 Thompson, L., Goodman, D., Little, G. (2002), ‘Is more neonatal care always better? Insights from a cross-national comparison of reproductive care’, Pediatrics 109, 1036-1043.
235 Joint Commission on Accreditation of Health Organisations (2002), Health Care at the Crossroads: Strategies for Addressing the Evolving Nursing Crisis, p.5.
236 Goodman, D. et al .(2002), ‘The relation between the availability of neonatal intensive care and neonatal mortality’, New England Journal of Medicine, 346:20, 1538-1544.
237 http://www.dhs.ca.gov/lnc/pubnotice/NTPR/R-37-01_Regulation_Text.pdf
238 New York State Health Department Regulations 721.6(a)-(c). Available at: http://w3.health.state.ny.us/dbspace/propregs.nsf/4ac9558781006774852569bd00512fda/832aa8a4b2a0ca9c85256ff10060eeba?OpenDocument
239 Woodward, G., et al. (2002), ‘The state of pediatric interfacility transport: Consensus of the Second National Paediatric and Neonatal Interfacility Transport Medicine Leadership Conference’, Pediatric Emergency Care, 18:1, 38-43.
240 http://www.aap.org/sections/transmed/default.cfm

The provision of neonatal services: international comparisons RAND Europe
74
In 2000, the AAP held the Second National Paediatric and Neonatal Interfacility Transport Medicine Leadership Conference, which debated eight different topics related to neonatal transport in the U.S.241 In 2006, the AAP’s Section on Transport Medicine published the 3rd edition of its Guidelines for Air and Ground Transport of Neonatal and Pediatric Patients.
The American Academy of Pediatrics has established a paediatric/neonatal transport team database that contains self-reported information on transport systems from across the US.242 As of July 2007, the database reported on 75 institutions providing paediatric or neonatal transport from 34 states. The following statistics derived from the database should be treated with caution – the database is a self-selecting, unrepresentative sample, which means that these figures may only be suitable for drawing conclusions about the institutions in the database, rather than the nationwide neonatal transport situation.
Of the 75 participating institutions, 50.7 per cent had a unified team that dealt with both paediatric and neonatal needs, while 49.3 per cent had some form of specialist paediatric or neonatal team. Of these institutions with specialised teams, 67.6 per cent provided a specialist neonatal team. Each institution was asked to state the percentage of each type of transport they provide, in three categories: ground transport; helicopter; and fixed wing aircraft. Of the institutions that provided data, 36.7 per cent use ground transport over 95 per cent of the time. The crude averages (means) for usage of each type of transport are: 80.2 per cent for road transport; 13.4 per cent for helicopter transport; and 6.2 per cent for fixed wing aircraft.243
241 Woodward, G., et al. (2002), ‘The state of pediatric interfacility transport: Consensus of the Second National Paediatric and Neonatal Interfacility Transport Medicine Leadership Conference’, Pediatric Emergency Care, 18:1, 38-43.
242 http://www.aap.org/sections/transmed/DatabaseTM.pdf. Since these data are self-reported, their accuracy cannot be confirmed.
243 Percentages do not total 100 because of rounding.
RAND Europe United States of America
75
Figure 6.5: Frequency of usage of road transport by institutions providing neonatal transport, self-reported, USA, 2007
0
10
20
30
40
50
60
0-20 <20-30 <30-40 <40-50 <50-60 <60-70 <70-80 <80-90 <90
Percentage of road transport usage
Frequency
Figure 6.6: Frequency of usage of helicopter transport by institutions providing neonatal transport, self-reported, USA, 2007
0
10
20
30
40
50
60
0-10 <10-20 <20-30 <30-40 <40-50 <50-60 <60-70 <70-80 <80
Percentage of helicopter transport usage
Fre
quency

The provision of neonatal services: international comparisons RAND Europe
76
Figure 6.7: Frequency of usage of fixed wing aircraft transport by institutions providing neonatal transport, self-reported, USA, 2007
0
10
20
30
40
50
60
0-10 <10-20 <20-30 <30-40 <40-50 <50-60 <60-70 <70-80 <80
Percentage of aircraft usage
Frequency
Institutions also provided figures on the average number of neonatal transports they performed yearly. It should be noted that this only measures the incidence of trips, rather than their length.244
244 http://www.aap.org/sections/transmed/DatabaseTM.pdf.

RAND Europe United States of America
77
Figure 6.8: Distribution of self-reported number of annual neonatal transports, USA, 2007
0
5
10
15
20
25
30
35
<500 >500-1000 >1000-1500 >1500-2000 >2000-2500 >2500
Average num ber of transports yearly
Fre
quency
Finally, 56.5 per cent of institutions stated that they used physicians on the transport team, the majority of which were full-time or resident.
As with other aspects of neonatal care, the provisions for transportation vary greatly from state to state. For example, the California Perinatal Transport Systems have been operating since 1976. They collect and analyse neonatal transport data for ‘regional planning, outreach program development, and outcome analysis’, which means that a bed availability status report is obtained from NICUs daily and made available online.245 New York State specifies that transfer agreements between institutions must obey the requirement that ‘the maximum allowable surface travel time to reach a Level III or RPC hospital shall be two hours under usual weather and road conditions’, that there should be alternative provisions should the receiving hospital be unable to receive the patient because of capacity limitations, and that an emergency transport must depart within 30 minutes of a transfer request.246
245 http://www.perinatal.org/
246 New York State Department Regulations 721.2 (f). Available at: http://w3.health.state.ny.us/dbspace/propregs.nsf/4ac9558781006774852569bd00512fda/832aa8a4b2a0ca9c85256ff10060eeba?OpenDocument
The provision of neonatal services: international comparisons RAND Europe
78
6.5 Costs of neonatal services
It is complex to assess the costs of neonatal care in U.S. hospitals. As one journal article explains:
‘The ability to track costs requires sophisticated accounting methods that are rarely available to health organisations. Instead, the accounting systems at most US hospitals have developed to capture charges rather than costs. Charges might be likened to “list price” where pricing reflects a complex strategy of loading costs into prices paid by certain third-party payers, although deeply discounting to others. Thus, there may be large distortions between costs and charges, and the direction of these distortions may differ among hospitals.’247
This situation means that the relationship between costs and charges may be severely distorted. Such distortion makes cross-hospital comparisons difficult, since their pricing policies can vary widely.248
Despite these complications, it is clear that extremely premature babies require the attention of highly skilled personnel and sophisticated technology, often over long periods of time. It has been suggested that costs are expected to continue rising because of the availability of new diagnostic and therapeutic technologies, at the same time as those involved in neonatal care are under ‘enormous pressure to find strategies for cost reduction for neonatal services’.249
A limited number of studies have attempted to quantify neonatal costs.250 Direct costs of care for low birth weight infants through the first year of life were estimated at over $4 billion annually in the mid-1990s, which represented 35 per cent of the total health costs for all infants.251 A 2000 study analysed premature and term infants born between 1989 and 1992 at the University of Alabama’s University Hospital and the Children’s Hospital of Alabama. The study extrapolated total population costs from its data and concluded that the total initial cost of neonatal care for the entire U.S. population to be $10.2 billion. Of this $10.2 billion, $9.4 billion was spent on survivors. The cost per surviving infant ranged from $145,892 for those of 24 weeks’ gestation, to $441 for those of 38 weeks’ gestation. Infants born between 24 and 26 weeks’ gestation accounted for 11.4 per cent of
247 Richardson, D., et al.(2001), ‘A critical review of cost reduction in neonatal intensive care. I. The structure of costs’, Journal of Perinatology, 21:107-115, 109.
248 Rogowski, J. (1999) ‘Measuring the Cost of Neonatal and Perinatal Care’, Pediatrics, 103:1, 329-335, 329.
249 Richardson, D., et al.(2001), ‘A critical review of cost reduction in neonatal intensive care. I. The structure of costs’, Journal of Perinatology, 21:107-115.
250 Throughout this chapter, the “$” sign refers to U.S. dollars. The average conversion rate for July 2007 was 2.03 dollars to one pound sterling.
251 Lewitt, E., et al. (1995), ‘The direct cost of low birth eight’, Future Child, 5:1, 35-36. Cited in Richardson, D., et al.(2001), ‘A critical review of cost reduction in neonatal intensive care. I. The structure of costs’, Journal of Perinatology, 21:107-115.

RAND Europe United States of America
79
expenditure, 30.8 per cent was spent on infants born between 27 and 32 weeks’ gestation, and 57.8 per cent was spent on infants greater than 32 weeks’ gestation.252
A 1999 study found that the median total cost for 3,288 infants weighing 501g-1500g treated in 25 U.S.-based NICUs in the Vermont Oxford Network between 1993 and 1994 was $49,457, or $1,115 per day.253 The results from the study indicate that treatment costs are inversely proportional to both birth weight and gestation age: median total costs per infant ranged from $95,560 for 24/26 weeks’ gestation, to $19,295 for over 32 weeks’ gestation.254
6.6 Best practices and guidelines
Many states, such as Georgia and Tennessee, have produced comprehensive guidelines for the specific neonatal services provided in their regions, which are revised to reflect ongoing governmental and clinical developments.255
Regionalised delivery of neonatal care has been the official position of the AAP and the American College of Obstetrics and Gynecologists (ACOG) since the concept was first developed.256 The AAP and ACOG and published the 5th edition of the Guidelines for Perinatal Care (2002).257 These guidelines suggest a minimum staffing of one registered nurse for every two to three patients in intermediate care and one nurse for every one to two patients in intensive neonatal care.
The American Academy of Pediatrics has outlined the basic characteristics of three guideline levels of care as follows:
‘Level I, or basic neonatal care, is the minimum requirement for any facility that provides inpatient maternity care. The institution must have the personnel and equipment to perform neonatal resuscitation, evaluate healthy newborn infants and provide postnatal care, and stabilise ill newborn infants until transfer to a facility that provides intensive care. Level II, or specialty care nurseries, in addition to providing basic care, can provide care to
252 St. John, E. (2000), ‘Cost of neonatal care according to gestation age at birth and survival status’, American Journal of Obstetrics and Gynecology, 182:1, 170-175, 173. St. John notes: ‘Caution must be used in extrapolating these figures to current dollars. The cost of medical care may not increase at the same pace as general inflation… Changes in relative contributions of consumers and third-party payors for care reimbursement make the task of extrapolating to current dollars more difficult.’
253 Rogowski, J. (1999), ‘Measuring the Cost of Neonatal and Perinatal Care’, Pediatrics, 103:1, 329-335, 333-4.
254 Ibid., p. 333.
255 Tennessee Department of Health (2004), Tennessee Perinatal Care System: Guidelines for Regionalisation, Hospital Care Levels, Staffing and Facilities, 5th edition; Council on Maternal and Infant Health in the State of Georgia (1999), Recommended Guidelines for Perinatal Care in Georgia, 2nd edition.
256 Yu, V., Dunn, P. (2004), ‘Development of regionalised perinatal care’, Seminars in Neonatology, 9:2, 89-97, 92..
257 Oh. W., Gilstrap. L., eds. (2002), Guidelines for Perinatal Care, 5th edition. Elk Grove Village, IL: American Academy of Pediatrics, American College of Obstetricians and Gynecologists
The provision of neonatal services: international comparisons RAND Europe
80
infants who are moderately ill with problems that are expected to resolve rapidly or who are recovering from serious illness treated in a level III (subspecialty) NICU. Level III, or subspecialty NICUs, can care for newborn infants with extreme prematurity or who are critically ill or require surgical intervention.’258
However, the Academy noted that such guideline levels provide only a very general framework for classifying NICUs, and do not reflect the complexity of current neonatal care. Therefore, in 2004 the Academy recommended new definitions for capabilities associated with the highest level of neonatal care within an institution.259
The National Association of Neonatal Nurses (NANN) offers guidance independently of the American Academy of Pediatrics. NANN published the 4th edition of its Guidelines for Neonatal Nursing Policies, Procedures, Competencies, and Clinical Pathways in 2006. This provides examples of guidelines, policies, and standard procedures for Level II or Level III nurseries, and can also be used for benchmarking purposes.260
The National Association of Neonatal Nurses’ current position statement on absolute minimum qualified nurse staffing in specialty care or subspecialty NICUs states that a minimum staffing level of two nurses should be maintained even when there is reduced patient acuity or fewer than six intermediate patients or four intensive neonatal care patients in the NICU. The NANN recognizes that minimum staffing ratios are sometimes set forth by the state, and where such guidelines are present they should be followed. 261
Rogowski, Staiger and Horbar point out that data from the Vermont Oxford Network shows there is ‘large variation’ between hospitals in mortality rates for infants weighing 501g-1,500g: 10 per cent of the hospitals in their sample had mortality rates 50 per cent higher than the mean. Therefore, they recommend focusing policy responses on improving care for infants in hospitals that currently have poor outcomes.262
The authors then consider two policy options for improving the care of very low birth weight infants. The first is “collaborative quality improvement”, which systematically identifies "best practices" being used in hospitals and then encourages the adoption of these practices in all hospitals. The authors conclude that there are selected examples of this approach being successful, but there is little evidence of its impact in peer-reviewed literature. They suggest that hospitals currently do not have strong incentives to improve quality.
258 Stark, A. (2004), Policy Statement: Committee on Fetus and Newborn; Levels of Neonatal Care’, Pediatrics, 114:5, 1341-2.
259 Stark, A. (2004), Policy Statement: Committee on Fetus and Newborn; Levels of Neonatal Care’, Pediatrics, 114:5, 1341-2.
260 Altimer, L., Brown, B., Tedeschi, L. (2006), NANN Guidelines for Neonatal Nursing Policies, Procedures, Competencies, and Clinical Pathways, 4th edition. 261 National Association of Neonatal Nurses (1999), Position Statement No.3009, Minimum Staffing Levels in NICUs. Available at: http://www.nann.org/files/public/3009.doc
262 Rogowski, J., Staiger, D., and Horbar, J. (2004), ‘Variations In The Quality Of Care For Very-Low-Birthweight Infants: Implications For Policy’, Health Affairs, 23:5, 88-97, 88, 91.
RAND Europe United States of America
81
The second policy option for lowering infant mortality rates is “evidence-based selective referral”, which involves moving infants to higher-quality hospitals or providing public reporting of hospital quality information that allows consumers to choose hospitals that can provide better care for their infants. Naturally, the former action is dependent on the reliable identification of higher-quality hospitals. This is, however, problematic. For example, patient volume and other hospital characteristics do not fully explain the variation in hospital mortality rates. Basing referral on hospitals’ historical mortality rates appears to be a more accurate method of identifying the best quality hospitals: the authors estimate that “a referral strategy that moved all infants out of the lowest-ranked 20 per cent and into the middle 60 per cent of VON [Vermont Oxford Network] hospitals in 1999–2000 would have reduced the number of deaths among very low-birth weight infants by 0.5 per cent based on a historical volume standard, compared with 4.6 percent based on historical mortality experience”. Moving all infants in the top 20 per cent of VON hospitals would result in even larger total reductions in mortality (4.2 per cent using volume, 34.2 per cent using historical mortality), although clearly this would raise capacity issues.263 Similarly, a 2007 study has estimated that increased regionalisation of neonatal care could prevent 21 per cent of deaths among very low birth weight infants in the U.S.264
Allowing consumers to choose hospitals themselves could improve hospital performance through competitive pressure, but it could also distort hospitals’ behaviour by encouraging selective intake of patients and the avoidance of risky procedures. Furthermore, there is frequently a dearth of good data on which to base assessments, and a lack of consensus on how to present these data to prevent misunderstandings amongst the public.265
California has set up two major quality improvement enterprises related to neonatal care: the California Perinatal Quality Care Collaborative (CPQCC)266 and the Neonatal Quality Improvement Initiative (NQI).267 The CPQCC was proposed by the California Association of Neonatologists and was set up in 1998. Its stakeholders include public and private neonatal providers, the Children’s Medical Services, Maternal, Child and Adolescent Health (MCAH), regional perinatal programmes, the Center for Health Statistics, the Office of Statewide Health Planning and Development, the Vermont Oxford Network, public health professionals and business groups.268 It aims to develop the infrastructure for perinatal and neonatal quality improvement at state, regional and hospital levels.
263 Rogowski, J., Staiger, D., and Horbar, J. (2004), ‘Variations In The Quality Of Care For Very-Low-Birthweight Infants: Implications For Policy’, Health Affairs, 23:5, 88-97.
264 Phibbs, C., et al. (2007), ‘Level and Volume of Neonatal Intensive Care and Mortality in Very-Low-Birth-Weight Infants’, New England Journal of Medicine, 256:21, 2165-75.
265 Rogowski, J., Staiger, D., and Horbar, J. (2004), ‘Variations In The Quality Of Care For Very-Low-Birthweight Infants: Implications For Policy’, Health Affairs, 23:5, 88-97.
266 http://www.cpqcc.org/
267 http://www.dhs.ca.gov/pcfh/cms/nqi/default.htm
268 California School Nurses Organisation (2007), CACSHCNEWS, 1:3. Available at: http://www.csno.org/docs/CaCSHCNews_January%202007%20(v%5B1%5D.1,%20i.3).pdf

The provision of neonatal services: international comparisons RAND Europe
82
The CPQCC’s work is based largely on the collection of information on neonatal outcomes and resource utilisation to allow benchmarking and performance improvement across the state. The Children’s Medical Services (CMS) requires all hospitals accredited by the California Children’s Services to join the CPQCC network, which by 2007 stood at over 120 hospitals. The CPQCC can now offer real time data management and three-year comparative data, and supplies participating hospitals with an annual online report that gives comparative neonatal data to allow NICUs to select areas where their practices could be improved.269
The Neonatal Quality Improvement Initiative (NQI) is sponsored by the CMS and the California Children’s Hospital Agency. The NQI employs a multidisciplinary project team to identify ways of eliminating blood infections from catheters in NICUs. Outcomes and observational process data will be tracked throughout the nine-month project. The most efficient and effective practices will be shared with the participating sites, and data on outcomes will be provided to a wider range of stakeholders, such as the state legislature, healthcare funders and the public.270
Other networks have incorporated some attempts at quality improvement into their processes. New York State has established regional perinatal forums to bring together hospital and community perinatal professionals, in order to improve outcomes by increasing access to care, raising the quality of care, and addressing other related state and region-wide public health issues.271 In the North Central Perinatal Network of Illinois, an annual Perinatal Case Review Meeting is held in each of the 27 regional hospitals in the Network. These meetings aim to identify factors that could improve patient outcomes throughout the Network.272
269 Ibid.
270 http://www.dhs.ca.gov/pcfh/cms/nqi/default.htm
271 http://www.amc.edu/patient/services/perinatal_outreach/RegionalForum.html
272 http://www.childrenshospitalofil.org/programs/medical/perinatal_network.htm
83
CHAPTER 7 Canada
7.1 Summary
7.1.1 Key features Canada has regionalised neonatal networks in both national and provincial or territorial systems. Canadian neonatal services mostly use provincial boundaries to define catchment areas for co-ordination and organisation of care, although the smaller provinces may be part of a larger network.
Canada’s rates of neonatal, perinatal and infant mortality generally compare well with both the U.S. and Australia. Canadians generally have good access to highly organised and sophisticated perinatal health care.273 In contrast to the U.S., a national framework of universal healthcare provision exists.274 Standards of health care and health insurance must conform to federal criteria to be eligible for federal reimbursement; these standards may be grouped under the principles of ‘universality, comprehensiveness, accessibility, portability, and nonprofit administration.’275 Nevertheless, there is evidence that variations in the quality of NICU care between provinces can be as wide as those witnessed in the USA.276
7.1.2 Key Learning Points The province of British Columbia has adopted a useful example of management practices for neonatal systems. In British Columbia, five regional health authorities have responsibility for planning and delivering local health services (including neonatal services), while the Provincial Health Services Authority (PHSA) oversees a co-ordinated provincial network of highly-specialised health services.277 For example, the PHSA is responsible for the British Columbia Women’s Hospital and Health Centre, the largest maternity hospital 273 Lee, S. et al. (2000), ‘Variations in Practice and Outcomes in the Canadian NICU Network: 1996-1997’, Pediatrics, 106, 1070-1079, 1071.
274 Ibid.
275 Richardson, D., et al. (2001), ‘A critical review of cost reduction in neonatal intensive care. I. The structure of costs’, Journal of Perinatology, 21:107-115, 112.
276 Lee, S. et al. (2000), ‘Variations in Practice and Outcomes in the Canadian NICU Network: 1996-1997’, Pediatrics, 106, 1070-1079.
277 British Columbia Ministry of Health & PHSA (2005), Provincial Health Services, p.2. Available at: http://www.phsa.ca/default.htm

The provision of neonatal services: international comparisons RAND Europe
84
in Canada.278 The province also uses the British Columbia Reproductive Care Program to support the regionalisation of perinatal care throughout British Columbia. A study has found that the province has a particularly efficient utilisation of Level III neonatal beds compared with the rest of Canada, partly due to its centralised system of patient referral and transfer.279
Canada also provides an example of a system whereby both provincial and central government interact in order to provide neonatal care. Although the main organisational responsibilities for neonatal care reside at the provincial level, the federal government sets standards that must be met in order to earn reimbursement; nationwide universal health care is guaranteed, and the Canadian Institute for Health Information reports on aggregated data for the country as a whole. Therefore, neonatal care in Canada must be seen as the product of ongoing interactions between varying levels of government.
This chapter focuses mainly on two provincial systems: Ontario, being the most populous state, and British Columbia, being the state with the most advanced provincial neonatal network structures.
7.2 Statistics and trends
7.2.1 Preterm births According to Statistics Canada, 7.9 per cent of total live births in 2004 had less than 37 weeks’ completed gestation, including 1.1 per cent of births with less than 32 weeks’ completed gestation.280 Trends are problematic to compute, since Statistics Canada online only provides figures for the period 2001/2004 inclusive. Canada’s 2003 Perinatal Health Report contains data on preterm births between 1991 and 2000, but (unlike Statistics Canada) excludes data from Ontario because of data quality concerns.281 Therefore, the two sets of trend data are not directly comparable; they are presented together below merely for illustration. On that basis, there appears to have been an upward trend in the rates of preterm births in Canada.
278 British Columbia Women’s Hospital and Health Centre & PHSA (2006), BC Women’s Strategic Plan, p.2.
279 Centre for Healthcare Innovation and Improvement (2002), Report on Tertiary Care in British Columbia, p.14. Available at: http://www.chii.ubc.ca/publications/tertiaryReport.pdf
280 Statistics Canada, Canadian Vital Statistics, Birth Database
281 Canadian Perinatal Surveillance System (2003), Canadian Perinatal Health Report 2003, p.188.
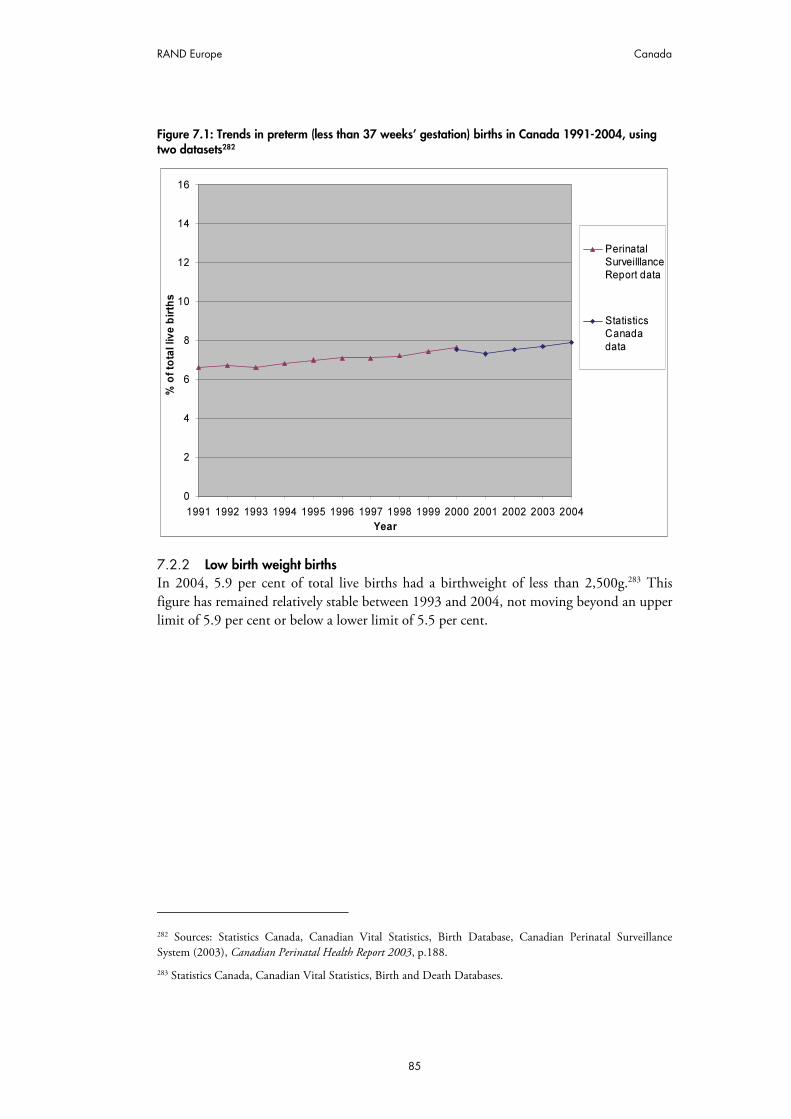
RAND Europe Canada
85
Figure 7.1: Trends in preterm (less than 37 weeks’ gestation) births in Canada 1991-2004, using two datasets282
0
2
4
6
8
10
12
14
16
1991 1992 1993 1994 1995 1996 1997 1998 1999 2000 2001 2002 2003 2004
Year
% o
f to
tal liv
e b
irth
s
Perinatal
Surveilllance
Report data
Statistics
Canada
data
7.2.2 Low birth weight births In 2004, 5.9 per cent of total live births had a birthweight of less than 2,500g.283 This figure has remained relatively stable between 1993 and 2004, not moving beyond an upper limit of 5.9 per cent or below a lower limit of 5.5 per cent.
282 Sources: Statistics Canada, Canadian Vital Statistics, Birth Database, Canadian Perinatal Surveillance System (2003), Canadian Perinatal Health Report 2003, p.188.
283 Statistics Canada, Canadian Vital Statistics, Birth and Death Databases.
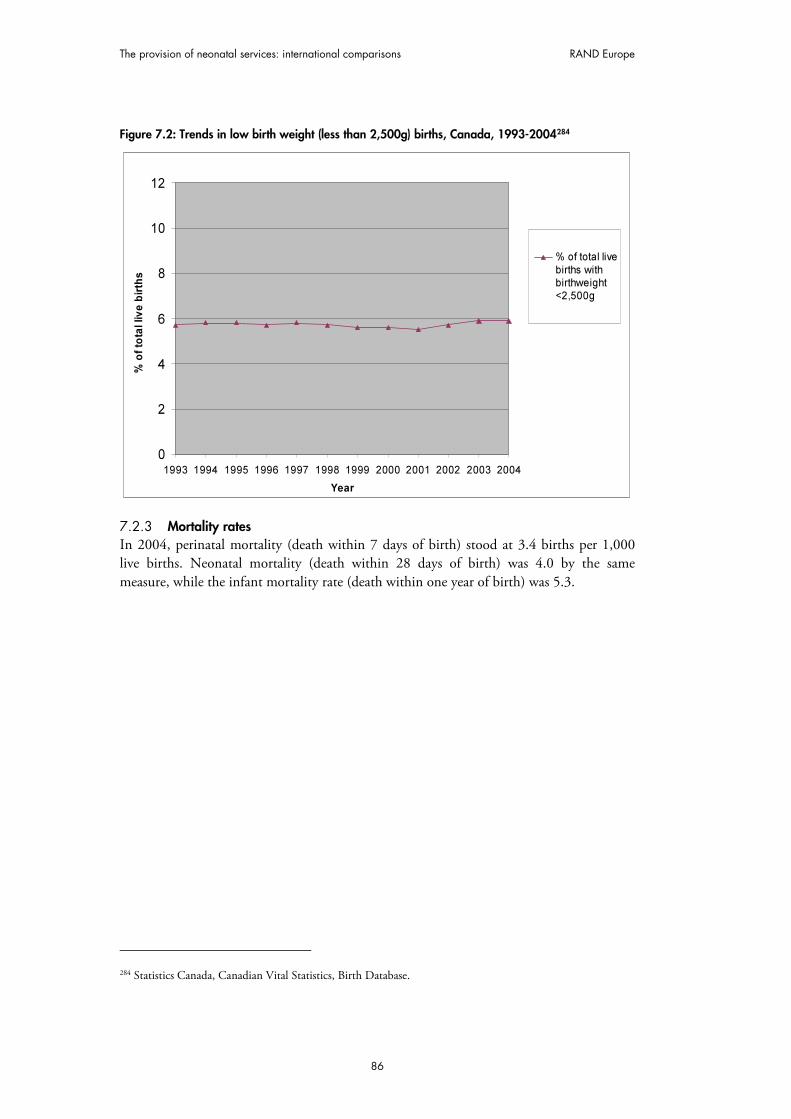
The provision of neonatal services: international comparisons RAND Europe
86
Figure 7.2: Trends in low birth weight (less than 2,500g) births, Canada, 1993-2004284
0
2
4
6
8
10
12
1993 1994 1995 1996 1997 1998 1999 2000 2001 2002 2003 2004
Year
% o
f to
tal liv
e b
irth
s
% of total live
births withbirthweight<2,500g
7.2.3 Mortality rates In 2004, perinatal mortality (death within 7 days of birth) stood at 3.4 births per 1,000 live births. Neonatal mortality (death within 28 days of birth) was 4.0 by the same measure, while the infant mortality rate (death within one year of birth) was 5.3.
284 Statistics Canada, Canadian Vital Statistics, Birth Database.

RAND Europe Canada
87
Figure 7.3: Trends in perinatal, neonatal and infant mortality, 1994-2004
0
1
2
3
4
5
6
7
8
1994 1995 1996 1997 1998 1999 2000 2001 2002 2003 2004
Year
Nu
mb
er
of
de
ath
s p
er
1,0
00
liv
e b
irth
s
Infant mortality(Death within year of
birth)
Neonatal mortality(Death within 0-27days of birth)
Perinatal mortality(Death within 7 days
of birth)
Rates of survival to NICU discharge varied greatly with birth weight, according to the Canadian Neonatal Network. Survival rates rose from 44 per cent for babies under 500g, to 70.1 per cent for the 500g-749g group, and 95 per cent for all babies over 1,000g in weight.285 Since these figures only relate to infants admitted to NICUs in the Canadian Neonatal Network, they do not reflect the population as a whole.
7.2.4 Neonatal morbidity As noted in Section 3.2.3, the diagnosis of cerebral palsy in infants is problematic. Nevertheless, there have been some peer-reviewed studies that investigate cerebral palsy as a manifestation of infant morbidity. A 2006 study examined trends in the prevalence of cerebral palsy in a population-based cohort of 672 very preterm infants who had 24/30 weeks’ gestation age and were born in Canada between January 1993 and December 2002.
The infants were assessed up to the age of two years to ascertain the presence of cerebral palsy and for survival. Infant survival and cerebral palsy rates were compared by year and
also in two 5-year periods, 1993/1997 and 1998/2002. The study found that infant mortality among very preterm infants decreased from 256 per 1,000 live births in 1993 to 114 per 1,000 live births in 2002, whereas the cerebral palsy rates for these infants increased from 44.4 per 1,000 live births in 1993 to 100.0 per 1,000 live births in 2002.286
285 The Canadian Neonatal Network (2005), Annual Report 2005, p.12.
286 Vincer, M. et al. (2006), ‘Increasing Prevalence of Cerebral Palsy Among Very Preterm Infants: A Population-Based Study’, Pediatrics, 118, 1621-1626, 1621.
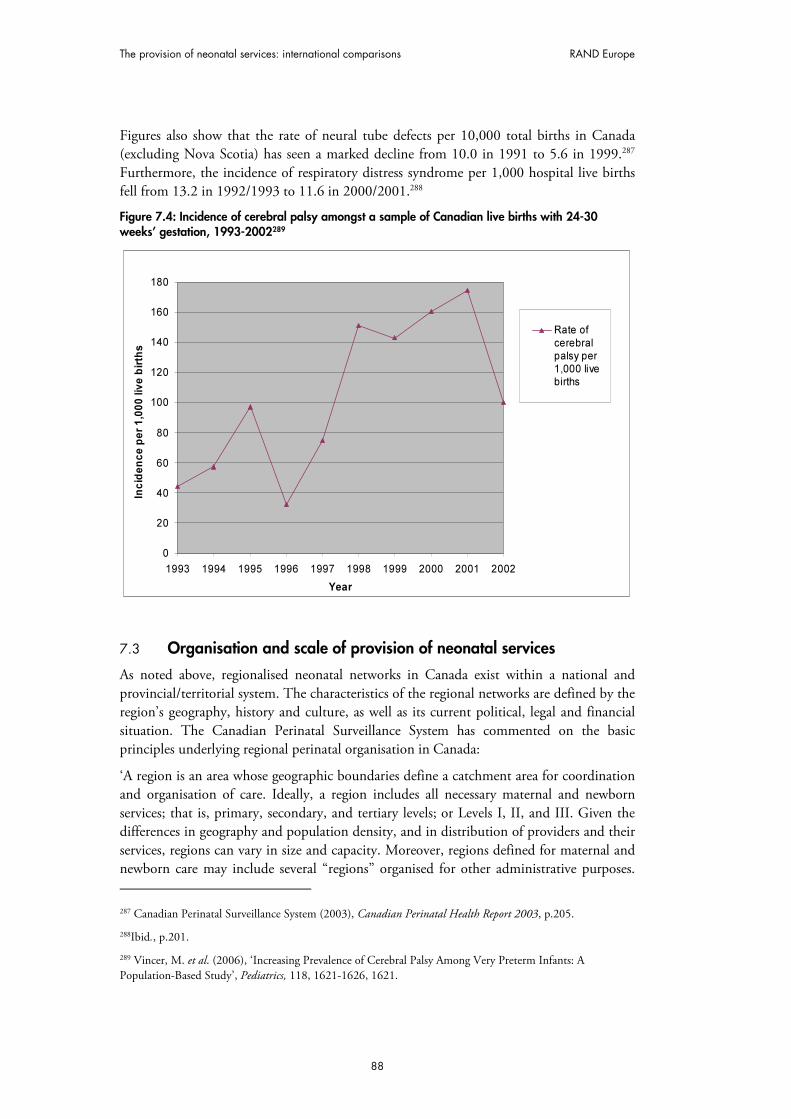
The provision of neonatal services: international comparisons RAND Europe
88
Figures also show that the rate of neural tube defects per 10,000 total births in Canada (excluding Nova Scotia) has seen a marked decline from 10.0 in 1991 to 5.6 in 1999.287 Furthermore, the incidence of respiratory distress syndrome per 1,000 hospital live births fell from 13.2 in 1992/1993 to 11.6 in 2000/2001.288
Figure 7.4: Incidence of cerebral palsy amongst a sample of Canadian live births with 24-30 weeks’ gestation, 1993-2002289
0
20
40
60
80
100
120
140
160
180
1993 1994 1995 1996 1997 1998 1999 2000 2001 2002
Year
Inc
ide
nc
e p
er
1,0
00
liv
e b
irth
s
Rate of
cerebralpalsy per1,000 livebirths
7.3 Organisation and scale of provision of neonatal services
As noted above, regionalised neonatal networks in Canada exist within a national and provincial/territorial system. The characteristics of the regional networks are defined by the region’s geography, history and culture, as well as its current political, legal and financial situation. The Canadian Perinatal Surveillance System has commented on the basic principles underlying regional perinatal organisation in Canada:
‘A region is an area whose geographic boundaries define a catchment area for coordination and organisation of care. Ideally, a region includes all necessary maternal and newborn services; that is, primary, secondary, and tertiary levels; or Levels I, II, and III. Given the differences in geography and population density, and in distribution of providers and their services, regions can vary in size and capacity. Moreover, regions defined for maternal and newborn care may include several “regions” organised for other administrative purposes. 287 Canadian Perinatal Surveillance System (2003), Canadian Perinatal Health Report 2003, p.205.
288Ibid., p.201.
289 Vincer, M. et al. (2006), ‘Increasing Prevalence of Cerebral Palsy Among Very Preterm Infants: A Population-Based Study’, Pediatrics, 118, 1621-1626, 1621.

RAND Europe Canada
89
Certainly, duplication and fragmentation are best avoided when the boundaries for maternal and newborn care are clear.’290
Therefore, although the province/territory provides the main organising unit for neonatal networks, this is dependent on the size of the province. Networks may exist on a supra-provincial scale. For example, the Maritime provinces (Prince Edward Island, New Brunswick, Nova Scotia and Newfoundland) possess just two tertiary neonatal facilities. Although there are some advanced Level II facilities in New Brunswick and Prince Edward Island, neonates from both provinces travel to Nova Scotia for tertiary care.291
This suggests that the organisation of neonatal networks is based on the demand for care and the ability to supply such care, both of which are affected by geographical factors.292 The location of tertiary care facilities is clearly important in this regard, since Level III NICUs co-ordinate care within neonatal networks; they are mostly located at university-affiliated teaching hospitals in major cities and serve distinct geographic regions.293 The location of such Level III NICUs is often based on factors such as the ability of patient volumes to maintain competencies, costs, safety, co-location of Level II facilities, availability of skilled personnel, and ease of patient access to facilities, rather than provincial boundaries.294 To give an example of a Canadian neonatal network, the Perinatal Partnership Program of Eastern and Southeastern Ontario covers 32,927 square kilometres, dealt with 17,519 births in 2005/2006, involved over 1,700 people in some form of perinatal care (including, for example, midwives), and contains three teaching hospitals, five large community hospitals, eight small community hospitals (dealing with fewer than 500 births annually), and two universities.295 296
Canada’s highly regionalised neonatal care system employs the widely-utilised Level I-III division of care system, where Level I refers to normal newborn care, Level II high dependency care, and Level III intensive care.297 The Public Health Agency of Canada sets detailed specifications for the level of care to be provided at Level I, II and III facilities.298 290 Public Health Agency of Canada (2000), The Family-Centred Maternity and Newborn Care: National Guidelines, 4th edition, p.2.7. Available at: http://www.phac-aspc.gc.ca/dca-dea/prenatal/fcmc1_e.html
291 Centre for Healthcare Innovation and Improvement (2002), Report on Tertiary Care in British Columbia, p.12. Available at: http://www.chii.ubc.ca/publications/tertiaryReport.pdf
292 Public Health Agency of Canada (2000), The Family-Centred Maternity and Newborn Care: National Guidelines, 4th edition, p.2.16. Available at: http://www.phac-aspc.gc.ca/dca-dea/prenatal/fcmc1_e.html
293 Lee, S. et al. (2000), ‘Variations in Practice and Outcomes in the Canadian NICU Network: 1966-1997’, Pediatrics, 106, 1070-1079.p.1077.
294 Centre for Healthcare Innovation and Improvement (2002), Report on Tertiary Care in British Columbia, p.31. Available at: http://www.chii.ubc.ca/publications/tertiaryReport.pdf
295 http://www.pppeso.on.ca/english/aboutus.html
296 Perinatal Partnership Program of Eastern and Southeastern Ontario (2006), Annual Perinatal
Statistical Report 2005-06.
297 Canadian Pediatric Society (2006), ‘Levels of Neonatal Care: Position Statement’, Paediatric Child Health, 11:5, 303-306, 306.
298 Public Health Agency of Canada (2000), The Family-Centred Maternity and Newborn Care: National Guidelines, 4th edition p.2.14. Available at: http://www.phac-aspc.gc.ca/dca-dea/prenate/fcmc1_e.html

The provision of neonatal services: international comparisons RAND Europe
90
However, the central role played by provincial/territorial administrations means that definitions of levels of care vary across jurisdictions. For example, the Canadian Paediatric Society has suggested that NICUs offering comparable services are classified as Level II in some provinces and Level III in others, while some provinces (for example, British Columbia) have developed sub-classifications within levels of care that complicate the picture further.299 300 A 2002 study into Canadian neonatal care found significant variations in the classification of NICU levels of care.301 It concluded that ‘the three levels exist more as a spectrum of capabilities than as clearly defined categories’ and suggested that some of the definitions may not even be accepted by neonatal practitioners.302
These variations in levels of care have led to confusion about capabilities, uncertainty regarding access to different types of services, complications for planning and patient transfers, and difficulties in interpreting resource usages.303 With regard to the last factor, there have been recommendations to develop a classification system matched to actual resource usage that can be applied to funding allocations.304 In 2006, the Canadian Paediatric Society revised its NICU level of care definitions, making explicit reference to the streamlining of resource planning and allocation.305
In 2002, there were an average of 1.6 Level III neonatal beds in Canada per 1,000 births, with an average of 4.7 combined Level II and III beds per 1,000 births and roughly twice as many Level II as Level III beds.306 It has been estimated that the minimum number of Level III beds needed to provide care during peak periods is 0.8 beds per 1,000 births.307
299 Canadian Pediatric Society (2006), ‘Levels of Neonatal Care: Position Statement’, Paediatric Child Health, 11:5, 303-306, . 306.
300 British Columbia Reproductive Care Program (2005), Levels of Perinatal Care. Available at: http://www.rcp.gov.bc.ca/whatsnew_pdfs/levels per cent20of per cent20perinatal per cent20care per cent20may per cent206 per cent202005.pdf
301 Centre for Healthcare Innovation and Improvement (2002), Report on Tertiary Care in British Columbia p.58. Available at: http://www.chii.ubc.ca/publications/tertiaryReport.pdf.
302Ibid.
303 Canadian Pediatric Society (2006), ‘Levels of Neonatal Care: Position Statement’, Paediatric Child Health, 11:5, 303-306, 306.
304 Centre for Healthcare Innovation and Improvement (2002), Report on Tertiary Care in British Columbia, p.58. Available at: http://www.chii.ubc.ca/publications/tertiaryReport.pdf.
305 Canadian Pediatric Society (2006), ‘Levels of Neonatal Care: Position Statement’, Paediatric Child Health, 11:5, 303-306, 303.
306 Centre for Healthcare Innovation and Improvement (2002), Report on Tertiary Care in British Columbia, p.8. Available at: http://www.chii.ubc.ca/publications/tertiaryReport.pdf
307 Ibid., p.28.

RAND Europe Canada
91
Table 7.1: Rates of neonatal beds per 1,000 births, by Province, Canada308
Province Births Total
Beds Level 2
Beds Level 2
Beds/
1000
Births
Level 3
Beds Level 3 Beds/
1000 Births Level 2 & 3
Beds/1000
Births
n n n n
British Columbia
309
40,467 147 101 2.5 46 1.1 3.6
Alberta 36,632 202 141 3.8 61 1.7 5.5
Saskatchewan 12,613 52 29 2.3 23 1.8 4.1
Manitoba 14,243 88 60 4.2 28 2.0 6.2
Ontario 131,248 624 399 3.0 225 1.7 4.7
Quebec310
71,899 244 3.4
New Brunswick 7,704 68 55 7.1 13 1.7 8.8
Nova Scotia311
9,352 75 37 4.0 38 2.1 not calculated (see note 311)
Prince Edward Island
1,498 16 16 10.7 0 0.0 10.7
Newfoundland and Labrador
4,735 46 36 7.6 10 2.1 9.7
Canada (total)
312
330,391 1,562 874 3.1 444 1.6 4.7
Figures from the Canadian Institute for Health Information show that 13.6 per cent of newborns (excluding those from Quebec and rural Manitoba) were admitted to a NICU in 2002/2003, up from 12.6 per cent in 1994/1995, and the number of admissions per year
308 Centre for Healthcare Innovation and Improvement (2002), Report on Tertiary Care in British Columbia, p.12.. Available at: http://www.chii.ubc.ca/publications/tertiaryReport.pdf. Data on births obtained from Statistics Canada; data on number of neonatal beds obtained from a cross-Canada telephone survey of hospitals that are funded to operate with a Level II and/or Level III nursery, conducted in March 2002. The footnotes to this table are taken directly from the source.
309 In British Columbia there are ten facilities that provide Level II care, but are not officially designated, or funded, to provide this care. The Level II bed numbers from these facilities are not included in this table.
310 A breakdown of the 'Level' of beds available at one of the facilities in Greater Montreal was not available; therefore, results for Quebec are reported as a 'total bed' number and the rates for specific Levels are not reported here. For calculation of average Canadian bed ratios, beds in Quebec were allocated in the same ratio as the national average.
311 Level III beds in Nova Scotia serve New Brunswick and Prince Edward Island residents, as well as Nova Scotians; therefore, the rate per 1,000 births for Level III beds was calculated based on the number of births in Nova Scotia, Prince Edward Island and New Brunswick. The rate per 1,000 births for Level II beds was calculated using birth numbers from Nova Scotia.
312 Although acute-care facilities throughout Canada provide Level II and III care to neonates residing in the Yukon, Northwest Territories and Nunavut, the calculation of both national and provincial bed rates reported here did not include birth numbers from these territories.
The provision of neonatal services: international comparisons RAND Europe
92
increased by approximately 1,500 between 1994/1995 and 2001/2002.313 314 Admission rates were higher for low birth weight babies: 62 per cent of babies weighing 1,500g to 2,499 g at birth were admitted to a NICU in 2001/2002, while the figure was 82 per cent for the sub-1,500g category.315 These babies also stayed for longer in the NICU: in 2001/2002, the median length of NICU stay was two days, rising to seven days for the 1,500g-2,499g birth weight and 23 days for babies with a birth weight below 1,500g.316
A population-based study of data from 75 per cent of the tertiary level NICU beds in Canada concluded that:
‘Canadians generally have good access to a highly organised perinatal health care (including
preventive prenatal care) system, referral NICU facilities seem to be appropriately used primarily for preterm or very sick infants requiring tertiary level care, and community and tertiary level neonatal-perinatal facilities seem to be well-co-ordinated in their referral and retrotransfer functions to provide as much care as possible closer to home.’317
However, the same study has noted that variations in NICU usage and patient outcomes amongst Canadian units appear to be as wide as those reported by U.S. sources: survival rates ranged from 89 per cent to 99 per cent. It was suggested that this might be owing to area variations in the practices of groups of physicians that exist in spite of uniform health financing.318 The similarity in variations is perhaps surprising given Canada’s universal health coverage, more generous welfare system and smaller income disparity, although ‘it is unclear how differences in health care and social systems interact to affect NICU outcomes.’319
British Columbia provides a useful example of the management practices used for a specific neonatal system. In British Columbia, five regional health authorities now have responsibility for planning and delivering local health services, such as public health, mental health, residential, home and hospital care. As well as these five regional authorities, the Provincial Health Services Authority (PHSA) of British Columbia oversees provincial and highly-specialised health services ensure that British Columbia residents have access to a co-ordinated network of high-quality specialised health care services.320 The PHSA is the first organisation of its kind in Canada. The PHSA provides a strategic and organisational
313 Canadian Institute for Health Institute Information (2004), Giving Birth in Canada: A Regional Profile, p.24.
314 Canadian Institute for Health Institute Information (2004), Giving Birth in Canada: The Costs, p.31.
315 Ibid.
316 Canadian Institute for Health Institute Information (2004) Giving Birth in Canada: A Regional Profile, p.24.
317 Lee, S. et al. (2000), ‘Variations in Practice and Outcomes in the Canadian NICU Network: 1996-1997, Pediatrics, 106, 1070-1079, 1077.
318 Ibid., p.1078.
319 Sankaran, K., et al. (2002), ‘Variations in mortality rates among Canadian neonatal intensive care units’, Canadian Medical Association Journal, 166:2, 173-178, 176.
320 British Columbia Ministry of Health & PHSA (2005), Provincial Health Services, p.2. Available at: http://www.phsa.ca/default.htm
RAND Europe Canada
93
framework to ensure effective and high quality delivery of specialised services and selected province-wide programs.321
The PHSA is responsible for the BC Women’s Hospital and Health Centre, which is the largest maternity hospital in Canada, supporting more than 7,000 women a year in giving birth, and caring for several hundred very high-risk newborns every year in its intensive care nurseries. It is the lead tertiary perinatal provider in the province and therefore receives neonatal patients from all over the province.322 Together, the PHSA and the BC Women’s Hospital have developed and implemented a Provincial Specialised Perinatal Program.323
In 1988, the British Columbia Reproductive Care Program (BCRCP) was initiated jointly by the Ministry of Health and the British Columbia Medical Association through the Continuing Advisory Subcommittee on Perinatal Care (CASC), to support the development of the regionalisation of perinatal care within the Province. The BCRCP is overseen by a Provincial Perinatal Steering Committee and has representation from the Ministry of Health and Ministry of Children and Family Development, the Provincial Health Services Authority, the Children’s and Women’s Health Centre, amongst others.324 The mandate of the BCRCP includes: consultation to and liaison with perinatal care providers and institutions; promotion and facilitation of inter-professional outreach education; development of guidelines for patient care and services planning; assisting in the identification of appropriate perinatal care provider roles and skill levels; and collection and analysis of data to evaluate provincial perinatal outcomes and to improve health care initiatives.325 The BRCRCP worked with the province’s Specialised Perinatal Services Committee to create A Plan for Specialised Perinatal Services in BC in 2005.326
There is some evidence that these structures have led to improved neonatal care management. A 2002 study found that ‘British Columbia utilises Level III neonatal beds very efficiently compared to the rest of Canada, partly because of a centralised system for patient referral and transfer.’327 The same study found that British Columbia had lower mortality and morbidity rates and better overall neonatal outcomes than Canada as a
321 Ibid.
322 British Columbia Women’s Hospital and Health Centre & PHSA (2006), BC Women’s Strategic Plan., p.2.
323 British Columbia Women’s Hospital and Health Centre & PHSA (2002), Specialised Perinatal Services Provincial Plan. Available at: http://www.interiorhealth.ca/NR/rdonlyres/9819A53D-0EE3-42D4-9F8E-BA99C82F67DE/1129/ProvincialPerinatalPlan.PDF
324 British Columbia Reproductive Care Program (2003), British Columbia Perinatal Database Registry Annual Report 2003, p.2.
325 http://www.rcp.gov.bc.ca/index.htm
326 http://www.rcp.gov.bc.ca/whatsnew_pdfs/perinatal per cent20plan per cent20for per cent20special per cent20services per cent20June per cent2013 per cent202005.pdf
327 Centre for Healthcare Innovation and Improvement (2002), Report on Tertiary Care in British Columbia, p.14. Available at: http://www.chii.ubc.ca/publications/tertiaryReport.pdf

The provision of neonatal services: international comparisons RAND Europe
94
whole, but clearly this may be owing to many factors other than the province’s neonatal organisation.328
Ontario is the most populous province in Canada, with an estimated population of 12.7 million in 2007,329 and has taken recent steps to further develop its organisation of neonatal services. In December 2005, 23 perinatal care partners agreed to create a Council of Partners in order to provide leadership for perinatal planning in Southeastern Ontario. The Council created a Southeast Perinatal Services Planning Coordinating Committee, the terms of reference of which were finalised in 2006. The Council reviews reports received from the Coordinating Committee and provides feedback and suggestions. The Council also set up four ad hoc working groups on: staffing units with low volume births; women leaving rural communities to give birth in urban centres; midwifery integration; and primary maternity health care.330 In Ontario, 62 per cent of babies with less than 32 weeks’ gestation were born in a Level III centre (the designated level of care for these births), while 34 per cent were born in Level II hospitals and only 5 per cent in a Level I hospital (probably because the mother was too advanced in labour to be transferred). 66 per cent of babies with 32/36 weeks’ gestation were born in Level II centres (the designated level of care for their births).331
Health care funding in Canada can be separated broadly into public and private sectors. Public sector funding is divided into four levels: the provincial government sector; the federal direct sector; the municipal government sector; and social security funds. The provincial government sector is the main funder of neonatal services and comprises health spending from provincial/territorial funds, federal health transfers to the provinces/territories, and provincial government health transfers to municipal governments. The federal direct sector mainly provides for special groups and funds health research, promotion and protection. The municipal government sector funds institutional services, public health, and capital construction and equipment. Social security funds are social insurance programmes controlled by a government authority. Private sector spending includes contributions made by individuals for health goods and services, health insurance claims from commercial and not-for-profit insurance firms, non-patient revenues received by health care institutions (such as donations and investments), and private spending on health-related construction and equipment.332
One notable feature of the funding of NICUs is that there is often a discrepancy between the number of NICU beds that are funded and the number of beds the facility provides. Sometimes, the demand for NICU beds exceeds the number officially available.333 This
328 Ibid., pp.43-45.
329 http://www.statcan.ca/Daily/English/070628/d070628c.htm
330 Perinatal Partnership Program of Eastern & Southeastern Ontario (2007), Perinatal Newsletter 24:1.
331 Provincial Perinatal Surveillance System Committee (2007), Ontario Provincial Perinatal Report 2006, p.13.
332 Canadian Institute of Health Information (2004), National Health Expenditure Database Definitions. Available at: http://www.cihi.ca/cihiweb/dispPage.jsp?cw_page=statistics_nhex_definitions_e
333 Centre for Healthcare Innovation and Improvement (2002), Report on Tertiary Care in British Columbia, p.10. Available at: http://www.chii.ubc.ca/publications/tertiaryReport.pdf
RAND Europe Canada
95
situation is usually owing to issues concerning the appropriate levels of staffing for patient care, and may be aggravated by nursing shortages. Furthermore, the method by which the provinces provide funding to hospitals means that for some NICUs ‘the allocated funding for designated number of beds and the actual dollars available to the NICU are not necessarily the same’.334 A 2002 study identified ten acute care facilities that deliver Level II care, despite not receiving specific funding from the provincial Ministry of Health to do so.335
A recent study investigating variations in severe intraventricular haemorrhage amongst Canadian NICUs found that larger NICU size and a higher neonatologist to staff ratio were factors in explaining the NICU variation, a conclusion which supports the regionalisation of neonatal care.336 With regards to the relation between Canadian NICU size and staffing, it has been claimed that ‘it is more difficult to attract highly skilled personnel and to maintain reasonable physician call schedules at smaller centers’.337 The Public Health Agency for Canada specifies the core requirements for neonatal care personnel, the specialist skills required for care at Levels I-III, and the recommended staff numbers for care at each level.338 For Level I, The Agency recommends one registered nurse to four healthy mother/baby dyads, 24 hours per day. Level II requires one registered nurse to two infants for more acute or unstable babies, and one nurse to three infants for those babies requiring convalescent care. For Level III, minimal staffing requirements may exceed the ratio of one registered nurse to one baby for those infants requiring extensive physiological support. The requirements may be one nurse to one to two babies for more stable babies requiring acute care. However, the Agency states that a nurse should not be responsible for more than one baby on a ventilator plus one other non-ventilated baby, dependent upon the condition of both babies.339 In addition, ‘all babies requiring acute care [Level III] on a 24-hour basis should be cared for by a qualified neonatologist. For purposes of communication and to obtain urgent care when required, it is highly desirable that at any one time a single neonatologist direct the care of babies requiring acute care.’340
7.4 Transport services
Transportation is a major issue in a country that covers almost ten million square kilometres. Since the 1960s, women living in the far north of the country often fly to
334 Ibid.
335 Ibid., p.11.
336 Synnes, A., et al. (2006), ‘Neonatal Intensive Care Unit Characteristics Affect the Incidence of Severe Intraventricular Hemorrhage’, Medical Care, 44:8, 754-759, 758.
337 Centre for Healthcare Innovation and Improvement (2002), Report on Tertiary Care in British Columbia, p.31. Available at: http://www.chii.ubc.ca/publications/tertiaryReport.pdf
338 Public Health Agency of Canada (2000), The Family-Centred Maternity and Newborn Care: National Guidelines, 4th edition., p.2.18-27. Available at: http://www.phac.aspc.gc.ca/dca-dea/prenatal/fcmc1_e.html
339 Ibid. p.2.21, 2.23, 2.25.
340 Ibid.

The provision of neonatal services: international comparisons RAND Europe
96
tertiary or secondary facilities approximately four weeks before their child is due, particularly if they have complications, which means that only unplanned births occur in northern communities. Such transportation has major logistical and emotional consequences.341
The task of providing centralised neonatal transport systems is co-ordinated either by regional tertiary level institutions or through a single provincial transport co-ordinating service.342 The Public Health Agency of Canada has specified the components that should be present in any regional referral and transport programme. These include: interagency collaboration and communication; reliable communication systems between referring hospitals and the transport team; ongoing performance evaluations; appropriate equipment and personnel; and a continuum of care for family members as they move between the referring and receiving NICUs.343
A 2002 study compared the outcomes and cost-effectiveness of three perinatal transport systems: Emergency Medical Technicians (EMT); Registered Nurses (RN); and Combined Teams of Registered Nurses and Respiratory Therapists (CT). 344 The study population comprised 1,931 outborn infants transported by the transport teams of participating hospitals across Canada between January 1996 and October 1997. British Columbia utilises a single provincially co-ordinated EMT transport team and this was used as the base case in a cost simulation that was run to determine the change in total costs if a RN or CT team were used in British Columbia instead. The study used data costs from British Columbia in 1994/1995 and found that there was no significant (p<0.05) difference in transport outcome of Registered Nurses and Combined Teams transport teams compared to the base case Emergency Medical Technicians model.345 The total cost of the Registered Nurses team (CAN $1,053,225)346 was lower than both the Emergency Medical Technicians team (CAN $1,138,397) and the Combined Teams team (CAN $1,088,679).347
British Columbia uses trained paramedics as the bedrock of their transport teams. This has proved valuable because of their ‘close links to the dispatchers, pilots and drivers, and
341 Canadian Institute of Health Information (2004), Giving Birth in Canada: Providers of Infant and Maternity Care, p.20.
342 Lee, S., et al. (2000), ‘Variations in Practice and Outcomes in the Canadian NICU Network: 1996-1997’, Pediatrics, 106, 1070-1079. 1077.
343 Public Health Agency of Canada (2000), The Family-Centred Maternity and Newborn Care: National Guidelines, 4th edition, p.9.7. Available at: http://www.phac.aspc.gc.ca/dca-dea/prenatal/fcmc1_e.html
344 Centre for Healthcare Innovation and Improvement (2002) Report on Tertiary Care in British Columbia, p.53. Available at: http://www.chii.ubc.ca/publications/tertiaryReport.pdf
345 Throughout this chapter, the “$” sign refers to Canadian. dollars. The average conversion rate for July 2007 was 2.14 dollars to one pound sterling.
346 1995 Canadian dollars.
347 Centre for Healthcare Innovation and Improvement (2002) Report on Tertiary Care in British Columbia, p.54. Available at: http://www.chii.ubc.ca/publications/tertiaryReport.pdf

RAND Europe Canada
97
intimate knowledge of how to facilitate the transport itself have been invaluable.’348 Training paramedics in this way prevents other transport team members from being distracted by the mechanics of the transport and reduces the number of hospital staff needed to accompany a transport.349
Table 7.2: Organisation of acute transport in British Columbia: Priority Categories350
Type of transport
Ambulance service priority
Patient care Response time Staff required
1 (red) Very unstable patient; likely to deteriorate rapidly
Land: leave hospital in 15 minutes; air: leave airport in 1 hour
One physician trained and experienced in intensive care (neonatal, paediatric or obstetric) plus (in order of preference) two infant transport team paramedics (ITT) or one ITT and one trainee or one ITT
1 (green) Sick patient unlikely to deteriorate quickly
2-3 hours As above
Acute
2a Stable patient requiring investigation or treatment
>12 hours One ITT and one trainee
Reverse 2b Neonatal reverse transport when bed availability is a problem
<12 hours
3 Reverse transport <5 days As above
7.5 Costs of neonatal services
Based on Canadian Institute of Health Institute data, in 2002/2003, hospitals in Canada (excluding those in Quebec and rural Manitoba) spent roughly CAN $295 million on newborns.351 As well as these hospital costs, more than CAN $12 million was billed by fee-for-service physicians in Canada for care provided for neonatal intensive care services in 2002/2003. An interesting fact is that per capita NICU billings for male babies less than one year of age were almost 18 per cent higher than for their female counterparts.352
In terms of per capita costs, the average NICU cost per admission in 2002/2003 was just over CAN $9,700, which represented approximately 4 per cent of total costs among the 27 hospitals submitting NICU cost information. NICUs in hospitals with 400 or more beds on average spent more per admission (CAN $10,942) than smaller hospitals (CAN $7,553 per admission).353 Obviously, these increased costs may be related to the type of babies
348 Lupton, B., Pendray, M. (2004), ‘Regionalised neonatal emergency transport’, Seminars in Neonatology, 9, 125-133, 127.
349 Ibid., p.127.
350 Lupton, B., Pendray, M. (2004), ‘Regionalised neonatal emergency transport’, Seminars in Neonatology, 9, 125-133.
351Ibid., p.25.
352 Ibid p.33.
353 Ibid., p.32.

The provision of neonatal services: international comparisons RAND Europe
98
being admitted, since Canadian babies born with low birthweight tend to use more hospital resources.354 Average hospital costs per newborn in 2002/2003 ranged from CAN $1,084 for babies who weighed between 2,000g and 2,499g to over CAN $117,000 for babies who weighed less than 750g. In general, average hospital costs decreased as birth weight increased and/or the level of severity of a health problem improved.355
Table 7.3: Average and total hospital costs for newborns, 2002-3356
Birth Weight (g)
Health Problem or Type of Delivery
Number of
Newborns
Average Length of
Hospital Stay (Days)
Average Cost per Newborn
(CA$)
Total Cost ($
Millions)
< 750 All 69 113 117, 806 8.1
750-999 All 134 90 89, 751 12.0
1000-1499 Catastrophic Diagnosis
9 59 42, 143 0.4
No Catastrophic Diagnosis
590 43 42, 133 24.9
1500-1999 Catastrophic Diagnosis
7 29 44, 885 0.3
Major Problem 358 31 29, 151 10.4
Moderate, Minimum or No Problem
1,512 18 12, 693 19.1
2000-2499 Catastrophic Diagnosis
6 19 15, 709 0.09
Major Problem 437 16 16, 766 7.3
Moderate Problem 1,078 11 8, 160 8.8
Minor Problem 5,224 6 3, 592 18.8
No Problem 1,088 2 1, 084 1.2
> 2500 Caesarean Delivery
47,497 3 1, 432 68.0
(Normal Birth Weight)
Normal Newborn (vaginal delivery)
145,279 2 795 115.5
Total Cost $ 295.0
Another factor (apart from birth weight) that accounts for varying neonatal costs is method of delivery. According to the Canadian Institute of Health Information, the average hospital cost for the care of a baby delivered vaginally with a normal birth weight and no clinical problems was approximately CAN $800, whereas the average hospital cost for a 354 Ibid.,p.30.
355 Canadian Institute for Health Institute Information (2004), Giving Birth in Canada: The Costs, p.30.
356 Ibid., p.30. The notes to this table state: ‘Data do not include Quebec and rural Manitoba. Only typical patients in acute care facilities were included (i.e. patients who received a course of treatment in a single institution and were discharged; excludes stillbirths, transfers, deaths, signouts and patients who stayed longer than the expected length of stay). Patient categories are based on CIHI’s Case Mix Group [CMG] methodology. Total costs (as reported in this table) are underestimated since not all CMGs belonging to the normal birth weight category (>2,500g) are included. Total costs per CMG were calculated by multiplying the number of babies per CMG by the average cost per baby in that CMG.

RAND Europe Canada
99
baby born with a normal birthweight but by caesarean delivery was just over CAN $1,400.357
Finally, with regards to transport costs, a Canadian study found that ‘where volumes were high and transports long, the paramedic model was the least costly. Otherwise, a non-dedicated Registered Nurse model where Registered Nurses were productively employed when not on transport was generally the least costly… A dedicated Registered Nurse team was the most expensive option under most circumstances.’358
7.6 Best practices and guidelines
In 2005, British Columbia’s Provincial Specialised Perinatal Steering Committee, with the British Columbia Health Authorities, approved a document giving guidelines for Levels of Perinatal Care.359 This divides NICUs into Levels IA, IB, IIA, IIB, IIIA, IIIB, IIC. For definitions, see the reference.360 The BC Reproductive Care Program has also produced general Guidelines for Perinatal Care.361
Ontario has supported the identification of best practices by creating a province-wide data reporting mechanism through the Niday Perinatal Database and the Southwest Perinatal Program Database. This provides real-time data for births in the province, the interventions used in the labour process and infant outcomes. Such information is intended to aid the planning and evaluation of programmes and services. Hospitals are accessing the data to benchmark performance, identify trends, and inform quality improvement activities.
In 2000, the Public Health Agency of Canada (PHA) published The Family-Centred Maternity and Newborn Care: National Guidelines, 4th edition.362 This is the main document that codifies the federal recommendations for maternity and perinatal practices in Canada. The guidelines emphasise the importance of co-ordinating neonatal services at a provincial/territorial level. They note that different agencies may be selected to provide this co-ordinating function by the provincial Ministry of Health, but recommend that reproductive care programs are most effective because they are multidisciplinary and offer opportunities for the participation of parents. The guidelines also note that a database and information infrastructure to support evaluation and future planning of perinatal services is
357 Ibid., p.25.
358 Lupton, B., Pendray, M. (2004), ‘Regionalised neonatal emergency transport’, Seminars in Neonatology 9, 125-133, 128.
359 British Columbia Reproductive Care Program (2005), Levels of Perinatal Care. Available at: http://www.rcp.gov.bc.ca/whatsnew_pdfs/levels per cent20of per cent20perinatal per cent20care per cent20 may per cent206 per cent202005.pdf
360 Ibid., p.8.
361 http://www.rcp.gov.bc.ca/guidelines.htm
362 Public Health Agency of Canada (2000), The Family-Centred Maternity and Newborn Care: National Guidelines, 4th edition. Available at:. http://www.phac-aspc.gc.ca/dca-dea/prenatal/fcmc1_e.html

The provision of neonatal services: international comparisons RAND Europe
100
an essential component of the regional perinatal system.363 The Public Health Agency also gives specific guidelines on the facilities, built environment and other characteristics of neonatal care facilities at different levels.364
Table 7.4 Public Health Agency of Canada’s guideline ratios of neonatologists to babies (2000)365
Days (until care plans are determined and implemented)
Ratio of neonatologists to patients
• Unstable babies requiring cardiorespiratory support 1:4
• Stable babies requiring acute care 1:8 to 1:10
• Babies requiring Level II care 1:12 to 1:16
Nights
• Unstable babies requiring cardiorespiratory support 1:4
• Stable babies requiring acute care 1:12 to 1:16
• Other babies Emergency care as required
The guidelines are noticeable for their emphasis on a consultative, family-based approach to neonatal care. For example, they recommend that regional perinatal programmes should incorporate ‘a community-based, multidisciplinary advisory group, whose role it is to provide leadership for successful care and programs.’366 Such a group would comprise of health care providers, hospitals, local support groups, public health representative, and the guidelines stress that ‘parents must be involved in this group in a meaningful way.’367 In addition, the guidelines state that all hospitals and health agencies and their staff must ‘demonstrate their commitment to the implementation of family-centred care’, which requires a ‘mission statement and summary of philosophy and values’, and an organisational structure that aids interdisciplinary co-operation and collaboration with families.368 For example, all healthcare facilities must also have a multidisciplinary maternal and newborn committee that involves parents and sets policies, monitors their implementation, and evaluates the quality of care they produce.369
The evaluative role of this maternal and newborn committee is interesting because such functions could be considered as the responsibility of provincial or national actors. For example, the Canadian Perinatal Surveillance system (part of the Public Health Agency) provides ‘data collection, expert analysis and interpretation, and response (communication
363 Ibid., p.2.8.
364 Ibid., Chapter 10.
365 Public Health Agency of Canada (2000), The Family-Centred Maternity and Newborn Care: National Guidelines, 4th edition, p.2.26. Available at:. http://www.phac-aspc.gc.ca/dca-dea/prenatal/fcmc1_e.html
366 Ibid., p.2.8.
367 Ibid.
368 Ibid., p.2.11.
369 Ibid., p.2.13.

RAND Europe Canada
101
of information for action)’ and reports on 27 national perinatal indicators.370 In addition to such national systems, the PHA guidelines make it clear that managers and senior staff of neonatal care facilities must create policies and objectives for quality improvement, evaluation methods and research activities relating to different aspects of NICU services, and review these accordingly. Particularly noteworthy is the recommendation to provide appropriate statistical documentation and background data for analytic studies.371
370 http://www.phac-aspc.gc.ca/rhs-ssg/overview-apercu_e.html
371 Public Health Agency of Canada (2000), The Family-Centred Maternity and Newborn Care: National Guidelines, 4th edition. Available at: http://www.phac-aspc.gc.ca/dca-dea/prenatal/fcmc1_e.html


103
CHAPTER 8 Australia
8.1 Summary
8.1.1 Key features Almost 70 per cent of total health expenditure in Australia is funded by government, with the Australian Government and state contributing two-thirds, while territory and local governments contribute the other third. The aim of the health system is to provide adequate health services to all citizens at an affordable cost or at no cost.372 Similarly to Canada, the provision of neonatal and transport services lies within the responsibility of the sub-national state or territory.
In general, adjusted mortalities in Australian neonatal and paediatric intensive care populations are lower than those in the United Kingdom; it has been speculated that this is because of the larger size of Australian units, a higher degree of specialisation of medical and nursing staff and a greater degree of centralisation.373 However, any conclusions regarding Australia as a whole must be reflect the fact that its geography is both vast and varied, and its population is greatly dispersed. The various networks have distinct characteristics and different levels of sophistication for neonatal services, which may be attributed to the differing characteristics of each region and the distances separating them.
8.1.2 Key learning points Australia appears to have managed the issue of neonatal transport services successfully, particularly given that the distribution of the country’s population means that some rural communities may be more than 1,000 kilometres from the nearest perinatal centre. The states of Victoria and New South Wales offer good examples of highly organised transportation systems. New South Wales’ Neonatal Transport Service has developed clinical guidelines, modified transport equipment and obtained purpose-built vehicles.374 There is evidence that this centralised neonatal transport has contributed to a significant improvement in the overall outcomes of extremely premature infants in New South
372 Australia Institute of Health and Welfare (2006), Australia’s Health 2006, p.8.
373 Abdel-Latif, M. (2006), ‘Mortality and Morbidities Among Very Premature Infants Admitted After Hours in an Australian Neonatal Intensive Care Unit Network’, Pediatrics, 117:1632-1639.
374 Rashid, A., Bhuta, T., Berry, A. (1999), ‘A regionalised transport service, the way ahead?’, Arch Dis Child, 80:488-492.
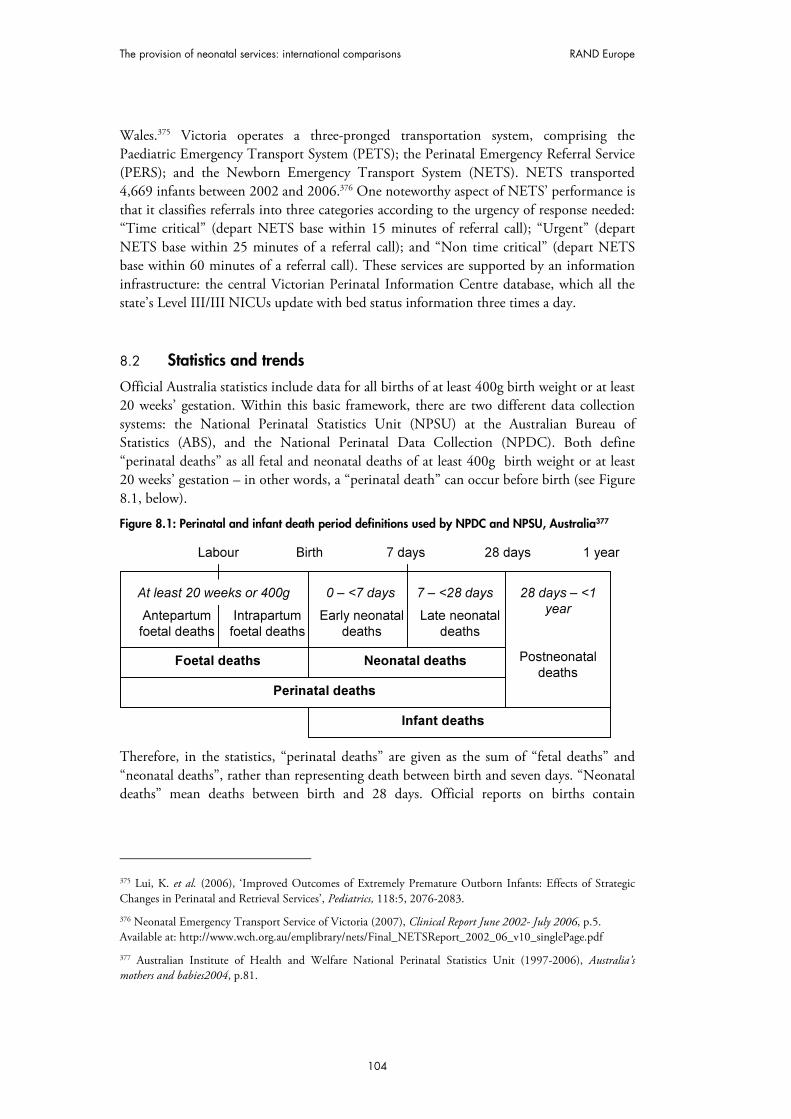
The provision of neonatal services: international comparisons RAND Europe
104
Wales.375 Victoria operates a three-pronged transportation system, comprising the Paediatric Emergency Transport System (PETS); the Perinatal Emergency Referral Service (PERS); and the Newborn Emergency Transport System (NETS). NETS transported 4,669 infants between 2002 and 2006.376 One noteworthy aspect of NETS’ performance is that it classifies referrals into three categories according to the urgency of response needed: “Time critical” (depart NETS base within 15 minutes of referral call); “Urgent” (depart NETS base within 25 minutes of a referral call); and “Non time critical” (depart NETS base within 60 minutes of a referral call). These services are supported by an information infrastructure: the central Victorian Perinatal Information Centre database, which all the state’s Level III/III NICUs update with bed status information three times a day.
8.2 Statistics and trends
Official Australia statistics include data for all births of at least 400g birth weight or at least 20 weeks’ gestation. Within this basic framework, there are two different data collection systems: the National Perinatal Statistics Unit (NPSU) at the Australian Bureau of Statistics (ABS), and the National Perinatal Data Collection (NPDC). Both define “perinatal deaths” as all fetal and neonatal deaths of at least 400g birth weight or at least 20 weeks’ gestation – in other words, a “perinatal death” can occur before birth (see Figure 8.1, below).
Figure 8.1: Perinatal and infant death period definitions used by NPDC and NPSU, Australia377
Foetal deaths Neonatal deaths
Perinatal deaths
Infant deaths
Labour Birth 7 days 28 days 1 year
At least 20 weeks or 400g
Antepartum
foetal deaths
Intrapartum
foetal deaths
0 – <7 days
Early neonatal
deaths
Late neonatal
deaths
7 – <28 days 28 days – <1
year
Postneonatal
deaths
Therefore, in the statistics, “perinatal deaths” are given as the sum of “fetal deaths” and “neonatal deaths”, rather than representing death between birth and seven days. “Neonatal deaths” mean deaths between birth and 28 days. Official reports on births contain
375 Lui, K. et al. (2006), ‘Improved Outcomes of Extremely Premature Outborn Infants: Effects of Strategic Changes in Perinatal and Retrieval Services’, Pediatrics, 118:5, 2076-2083.
376 Neonatal Emergency Transport Service of Victoria (2007), Clinical Report June 2002- July 2006, p.5. Available at: http://www.wch.org.au/emplibrary/nets/Final_NETSReport_2002_06_v10_singlePage.pdf
377 Australian Institute of Health and Welfare National Perinatal Statistics Unit (1997-2006), Australia’s mothers and babies2004, p.81.

RAND Europe Australia
105
significantly less information after 2000, which means that trend data has not been calculated for some variables.378
8.2.1 Preterm births In 2004, 20,999 (8.2 per cent) of the 257,205 births in Australia were under 37 weeks’ gestation.379 It should be noted that data availability means that these figures refer to all births using the WHO criteria, rather than just liveborn births; this contrasts with the data given for Canada and the U.S.
Figure 8.2: Trends in all births under 37 weeks’ gestation, Australia,1995-2004380
0
2
4
6
8
10
12
14
16
1995 1996 1997 1998 1999 2000 2001 2002 2003 2004
Year
% o
f a
ll b
irth
s
Preterm births
as a % of all
births
8.2.2 Low birth weight births In 2004, 6.4 per cent of total live births had a birth weight of less than 2,500g. This represents a slight rise from the 1996 figure of 6.0 per cent of total live births. Notably, the proportion of liveborn babies of Aboriginal or Torres Strait Islander mothers that were low
378 For differences in available information, contrast Australian Institute of Health and Welfare National Perinatal Statistics Unit (2001), Australia’s mothers and babies 1999 with Australian Institute of Health and Welfare National Perinatal Statistics Unit (2006), Australia’s mothers and babies 2004.
379 Australian Institute of Health and Welfare National Perinatal Statistics Unit (1997-2006), Australia’s mothers and babies 2004, p.xi.
380 Less than 37 weeks’ gestation. Source: Australian Institute of Health and Welfare National Perinatal Statistics Unit (1997-2006), Australia’s mothers and babies, 1995-2004.

The provision of neonatal services: international comparisons RAND Europe
106
birth weight in 2004 was 13.2 per cent compared with 6.1 per cent of babies of non-Indigenous mothers.381
Figure 8.3: Trends in low birth weight births, Australia, 1995-2004382
0
2
4
6
8
10
12
1995 1996 1997 1998 1999 2000 2001 2002 2003 2004
Year
% o
f to
tal liv
e b
irth
s
% of total livebirths with
birthweight<2,500g
8.2.3 Mortality rates As noted above, there are a variety of different measures of Australian infant mortality rates. In 2004, the neonatal mortality rate (0-28 days) was 3.1 per 1,000 live births by the NPDC measure,383 3.2 per 1,000 live births by the ABS measure,384 and 3.6 per 1,000 live births according to the Australia Institute for Health and Welfare.385 In calculating trends, this report uses data from the Australian Bureau of Statistics. These show that in 2005, perinatal mortality (death within seven days of birth) stood at 2.9 births per 1,000 live births. Neonatal mortality (death within 28 days of birth) was 3.6 by the same measure, while the infant mortality rate (death within one year of birth) was 5.0.386
381 Australian Institute of Health and Welfare National Perinatal Statistics Unit (1997-2006), Australia’s mothers and babies 2004, p.xi.
382 Australian Institute of Health and Welfare National Perinatal Statistics Unit (1997-2006), Australia’s mothers and babies, 1995-2004.
383 Australian Institute of Health and Welfare National Perinatal Statistics Unit (2006) Australia’s mothers and babies 2004, p.86.
384 Australian Bureau of Statistics (2006), Deaths, Australia 2005, p.51.
385 Australian Institute of Health and Welfare (2006), Australia’s Health 2006, p.405.
386 Australian Bureau of Statistics (2006), Deaths, Australia 2005, p.51.

RAND Europe Australia
107
Figure 8.4:Trends in perinatal, neonatal and infant mortality, Australia, 1995-2004387
0
1
2
3
4
5
6
7
8
1995 1996 1997 1998 1999 2000 2001 2002 2003 2004
Year
Nu
mb
er
of
de
ath
s p
er
1,0
00
liv
e b
irth
s
Infant mortality(Death within year ofbirth)
Neonatal mortality
(Death within 0-27days of birth)
Perinatal mortality(Death within 0-7
days of birth)
8.2.4 Neonatal morbidity A study of cerebral palsy amongst extremely low birth weight infants in Victoria, Australia over four time periods between 1979 and 1997 found that the rate of cerebral palsy in survivors remained approximately 10 per cent in each era.388 The same study shows that the rate of blindness in infants of birth weight 500g-999g fell significantly from 6.7 per cent in 1979/1980 to 2.7 per cent in 1997.389
Western Australia’s Neonatology Clinical Care Audit Committee is undertaking a neonatal follow-up programme for all infants born in 2000 and 2001, looking at rates of cerebral palsy and intellectual disability. Results show that cerebral palsy rates for infants less than 32 weeks’ gestation are low (3-5 per cent), but 16-20 per cent of the infants have at least mild disability (1-2 standard deviations below the mean IQ).390 A 2003 study compared neurobehavioural outcomes of children born at extremely low birth weight or very preterm with term children born with normal birth weight. Both groups were born in Victoria, Australia, between 1991/1992. When these children were assessed in 2000/2002, the low 387 Australian Bureau of Statistics (2006), Deaths, Australia 2005, p.51; Australian Bureau of Statistics (2001), Deaths, Australia 2000, p.51.
388 Doyle, L. (2006), ‘Evaluation of neonatal intensive care for extremely-low-birth-weight infants’, Seminars in Fetal & Neonatal Medicine, 11:139-145, 140.
389 Ibid.
390 Neonatology Clinical Care Audit Committee (2005), Annual Report to the Public on Activities undertaken or overseen by the Neonatology Clinical Care Audit Committee. Available at: http://www.pmh.health.wa.gov.au/general/about_us/documents/6057.pdf

The provision of neonatal services: international comparisons RAND Europe
108
birth weight children performed significantly worse than the control group for reading, spelling, arithmetic, verbal thinking, writing and other dimensions of education. These results were in accordance with studies performed on children born in the 1980s.391 Finally, in 2001, the estimated birth prevalence of neural tube defects was 0.5 per 1,000 births and for Down syndrome it was 1.2 per 1,000 births.392
8.3 Organisation and scale of provision of neonatal services
As in Canada, the states are the main organising unit for neonatal networks: New South Wales, Victoria, Queensland, Western Australia, South Australia, Tasmania, and the Australia Capital Territory. The immense scale and geographic variety of the country, and the dispersion of its population, means that the various networks have distinct characteristics and different levels of sophistication for neonatal services. For example, 15.6 per cent of newborns were admitted to a Special Care Nursery or Neonatal Intensive Care Unit in 2004.393 However, as Table 8.1 indicates, the volume of admissions to NICUs varies greatly from state to state. Given such diversity, this chapter mainly focuses on New South Wales, Victoria and Western Australia, which have both more advanced neonatal systems and also contain a significant proportion of the national population.
391 Anderson, P., Doyle, L. (2003), ‘Neurobehavioral Outcomes of School-age Children Born Extremely Low Birth-Weight or Very Preterm in the 1990s’, Journal of the American Medical Association, 289:24, 3264-3272.
392 Australian Institute of Health and Welfare (2004), Bulletin Issue 21, p.1.
393 Australian Institute of Health and Welfare National Perinatal Statistics Unit (1997-2006), Australia’s mothers and babies 2004, p.66.

RAN
D E
urop
e
Aus
tralia
109
Tabl
e 8.
1: L
ive
birt
hs b
y ad
mis
sion
to s
peci
al c
are
nurs
ery
or n
eona
tal i
nten
sive
car
e un
it an
d st
ate
and
terr
itory
, 200
4394
Ad
mis
sio
n
to S
CN
or
NIC
U
N
ew
S
ou
th
Wale
s
Vic
tori
a
Qu
een
sla
nd
W
este
rn
Au
str
alia
(a)
So
uth
ern
A
ustr
alia
Tasm
an
ia
Au
str
alia
Cap
ital
Terr
ito
ry
No
rth
ern
T
err
ito
ry
Au
str
alia
Nu
mb
er
Adm
itte
d
14,1
53
9,8
18
8,8
06
1,9
56
2,9
16
652
768
632
39,7
01
Not adm
itte
d
70,9
12
53,2
64
41,7
57
23,3
84
14,4
92
4,8
31
4,1
16
2,8
20
215,5
76
Not sta
ted
—
—
—
—
—
—
9
—
9
To
tal
85,0
65
63,0
82
50,5
63
25,3
40
17,4
08
5,4
83
4,8
93
3,4
52
255,2
86
Per
cen
t
Adm
itte
d
16.6
15.6
17.4
7.7
16.8
11.9
15.7
18.3
15.6
Not adm
itte
d
83.4
84.4
82.6
92.3
83.2
88.1
84.1
81.7
84.4
Not sta
ted
—
—
—
—
—
—
0.2
—
0.0
To
tal
100.0
100.0
100.0
100.0
100.0
100.0
100.0
100.0
100.0
394 A
ustr
alia
n In
stitu
te o
f Hea
lth a
nd W
elfa
re N
atio
nal P
erin
atal
Sta
tistic
s Uni
t (19
97-2
006)
, Aus
tral
ia’s
mot
hers
and
babi
es 20
04, p
.67.
Not
e (a
): Fo
r Wes
tern
Aus
tral
ia, b
abie
s wer
e re
cord
ed a
s bei
ng a
dmitt
ed to
an
SCN
or N
ICU
onl
y if
the
leng
th o
f sta
y w
as o
ne d
ay o
r mor
e.

The provision of neonatal services: international comparisons RAND Europe
110
New South Wales (NSW) has a total land area of 809,443 kilometres, and a population of approximately 6.7 million. Its annual birth rate is around 87,000, with 79 per cent of these infants being delivered in non-tertiary hospitals, and 24 per cent occurring in remote facilities or rural centres.395 To cope with these demands, New South Wales has ten tertiary NICUs with a total capacity of 211 neonatal beds, including non-ventilator intensive care and step-down (or intermediate level) beds. This includes 61 ventilator beds (ranging from 4–11 beds per hospital).396
Since 1991, the New South Wales Pregnancy and Newborn Services Network (PSN) has overseen the planning, co-ordination, and regionalisation of perinatal and neonatal services. A vital component of the neonatal system is the centralised, independent, statewide Newborn and Paediatric Emergency Transport Service (NETS). NETS has access to New South Wales’ electronic NICU “bed state” database, which facilitates the efficient transfer of babies and provides information for clinical audits.397 Since 1995, the NETS destination advice guidelines given to referring paediatricians have recommended that infants of less than 32 weeks’ gestation be transported to perinatal centres capable of offering tertiary care, rather than freestanding paediatric hospitals.398
New South Wales also offers a Perinatal Advice Line, which is a specialist telephone service that offers advice to community hospital obstetricians. In particular, it provides assistance in managing high-risk pregnancies and improving the safety of neonatal transfers to tertiary centres.399 A study that attempted to assess the impact of this and other aspects of the New South Wales perinatal system suggested that the fact that more outborn mothers
received prenatal steroid therapy in 1997/2002 compared to 1992/1995 ‘might also have been a surrogate marker of improved peripheral hospital access to expert advice through the Perinatal Advice Line network.’400
The same study found that there had been ‘a significant improvement in the overall
outcomes of extremely premature births after the development of a centralised neonatal transport system, almost-universal transfer of these high-risk infants to perinatal centres, and ready accessibility of tertiary care obstetric advice.’401 One finding was that outborn mortality rates, particularly for infants of 27/28 weeks, had improved significantly during the two study periods (1992/1995, 1997/2002). The study indicated that these improved outcomes were owing to the centralised, statewide nature of NETS and the
395 Lui, K. et al. (2006) ‘Improved Outcomes of Extremely Premature Outborn Infants: Effects of Strategic Changes in Perinatal and Retrieval Services’, Pediatrics. 118:5, 2076-2083.
396 Abdel-Latif, M. (2006), ‘Mortality and Morbidities Among Very Premature Infants Admitted After Hours in an Australian Neonatal Intensive Care Unit Network’, Pediatrics, 117:1632-1639.
397 Rashid, A., Bhuta, T., Berry, A. (1999), ‘A regionalised transport service, the way ahead?’, Arch Dis Child, 80:488-492.
398 Lui, K. et al. (2006) ‘Improved Outcomes of Extremely Premature Outborn Infants: Effects of Strategic Changes in Perinatal and Retrieval Services’, Pediatrics, 118:5, 2076-2083.
399 Ibid.
400 Ibid.
401 Ibid.

RAND Europe Australia
111
recommendation that high-risk infants be transferred to perinatal centres because their ‘greater patient load and appropriately streamlined clinical practices’ make them more suitable than freestanding paediatric hospitals.402
The state of Victoria uses some similar co-ordinating mechanisms. All its Level III/III NICUs are required to update bed status information to the central Victorian Perinatal Information Centre database three times a day, and to update the bed status whenever a change occurs.403 Victoria’s Department of Human Services collects neonatal performance indicators for Level II and III facilities to judge the system’s capacity to meet the demand for neonatal care. These indicators are: percentage of occupied neonatal beds; percentage of days on which a Level II neonatal unit is able to accept a down-transfer of a convalescent infant; number of Level III neonatal overflow transfers (the transfer of an infant between Level III centres because of lack of bed at the referring hospital).404 The number of these ‘overflow transfers’ undertaken annually in Victoria has declined consistently from 54 in 2002/2003 to 5 in 2006/6 is the number 6 correct here?.405 When a NICU cot is not available in the public system, the Victoria Department of Human Services will fund neonatal patients in private hospital nurseries for up to seven days. Those transfers are co-ordinated through the Newborn Emergency Transport Service (NETS).406 The Victoria Government recommends that in order to admit neonatal patients and to maintain safety standards, Level III units should plan for an average minimum occupancy of at least 70 per cent.407
Victoria also supports a Neonatal Services Advisory Committee, established in 2000, in order to provide advice to Victoria’s Minister for Health and its Department of Human Services on matters relating to neonatal intensive care services.408 Members are expected to have experience and expertise related to neonatal care, but the Committee is solely advisory and has no decision-making powers. In particular, the Committee advises on policy direction, system performance, methods to ensure delivery of high quality care and collaboration between Level II and Level III nurseries.409
402 Ibid.
403 Victoria Government Department of Human Services (2007), Public hospitals and mental health services: Policy and funding guidelines 2007-08, p.91. Available at: http://www.health.vic.gov.au/neonatal/perform.htm
404 Ibid.
405 Neonatal Emergency Transport Service of Victoria (2007), Clinical Report June 2002- July 2006, p.12. Available at: http://www.wch.org.au/emplibrary/nets/Final_NETSReport_2002-06_v10_singlePage.pdf
406 Victoria Government Department of Human Services (2007), Public hospitals and mental health services: Policy and funding guidelines 2007–08, p.24.
407 Victoria Government Department of Human Services (2005), Neonatal Services Guidelines: Defining Levels of Care in Victorian Hospitals, p.22.
408 Victoria Government Department of Human Services (2007), Public hospitals and mental health services: Policy and funding guidelines 2007–08, p.24.
409 Victoria Government Department Of Human Services (2006), Expressions Of Interest For Appointment To The Neonatal Services Advisory Committee (NSAC): Guidelines And Information For Applicants, p.1.

The provision of neonatal services: international comparisons RAND Europe
112
A 1997 study compared the highly centralised paediatric care found in the state of Victoria with the Trent Health Authority in the UK. It found that Trent children had longer stays in the ICU and had a higher risk of death. The study estimated that there were 453 excess deaths a year in the UK owing to sub- optimal paediatric intensive care. However, this study considered children up to the age of 16, which means its relevance to neonatal care may be limited.410 More recently, a 2004 study found that neonatal intensive care has been increasingly available for infants born between 500g and 1,000g in Victoria over the period 1979 to 1997. It also concluded that the gap in survival rates between “outborn” and “inborn” infants had widened over that period, and the quality of life of outborn survivors was inferior.411
The administration of neonatal services in Western Australia must deal with the almost unique challenges posed by the state’s enormous area, which, at 2.6 million square kilometres, makes it the world’s second largest sub-national entity. The neonatal network for Western Australia is made up of two tertiary level NICUs at the King Edward Memorial Hospital and the Princess Margaret Hospital, which have 80 and 25 cots respectively, and which are both located in Perth.412 Changes in Western Australia’s statewide neonatal network organisation have led to claims that there are increased difficulties in transferring neonates back to Level II care facilities. An audit overseen by Western Australia’s Neonatology Clinical Care Audit Committee aimed to ascertain the effort required to transfer a baby to another hospital, any delays that occur and the reasons for these delays. Delays of over three weeks were recorded and up to seven telephone calls per neonate transfer were required. The reasons given for these delays were that the lower-level units were too busy or that the care required by the babies was too demanding for the destination units.413
Given these variations, it is unsurprising that levels of care vary throughout the country. The Australia and New Zealand Neonatal Network have defined some standard levels of neonatal care, but these are rather broad.414 Guidelines for levels of neonatal care are usually issued by the state health department, or by the major tertiary neonatal care centre in the state (see ‘Best Practices’ below).
410 Pearson, G., et al. (1997), ‘Should paediatric intensive care be centralised? Trent versus Victoria’. Lancet, 349:1213-1217.
411 Doyle, L. (2004), ‘Changing availability of neonatal intensive care for extremely low birthweight infants in Victoria over two decades’, Medical Journal of Australia, 181:3, 136-9.
412 http://www.kemh.health.wa.gov.au/services/nccu/guidelines/documents/7260.pdf
413 Neonatology Clinical Care Audit Committee (2005), Annual Report to the Public on Activities undertaken or overseen by the Neonatology Clinical Care Audit Committee. Available at: http://www.pmh.health.wa.gov.au/general/about_us/documents/6057.pdf
414 Australian Institute of Health and Welfare National Perinatal Statistics Unit (1997-2006), Australia’s mothers and babies 2004, p.106. Citing Abeywardana, S. (2006), Report of the Australian and New Zealand Neonatal Network 2004. Sydney: Australian and New Zealand Neonatal Network (currently unavailable).

RAND Europe Australia
113
The Australian Government and state/territory governments jointly fund public hospital services.415 The Australian Government also funds health activities indirectly by subsidizing private health insurance cover through incentive arrangements.416 Victoria operates a system of casemix funding that comprises patient-service based funding and separate funding for training or specific services. The specific funding given for critical and neonatal care is measured by various criteria (mainly historical) and in 2006/2007 amounted to AUS $84,494,600 (1.8 per cent of Victoria’s total hospital funding).417
In 2006, the Australian College of Neonatal Nurses (ACNN) conducted a study into the Australian Neonatal Nursing workforce.418 The authors surveyed 214 nurses across the country. The study showed that the nurses in the sample had a large amount of experience: 68 per cent had been employed in nursing for greater than or equal to 21 years, while the figure was 16 per cent for the period of 16-20 years. 26 per cent of respondents held a neonatal diploma or neonatal intensive care unit certificate, 19 per cent had a midwifery certificate or diploma, and 14 per cent had a Bachelor of Nursing or Nursing Science degree.419 There are, however, some limitations to the study, such as limited distribution of the survey and low response rate (32 per cent). The ACNN also undertook a benchmarking survey into staffing at Australian Neonatal Units; the extent of this survey’s coverage is unclear, and a lack of supporting documentation means its results have not been included.420
8.4 Transport services
Neonatal transport is clearly an extremely important issue in Australia: the country’s population distribution means that some rural landowners may be more than 1,000 kilometres from the nearest perinatal care centre.421 In response, Victoria and New South Wales have developed sophisticated (and comprehensively documented) transport systems, which form the focus of this chapter. Another viable candidate for consideration is Western Australia’s Neonatal Transport Service.422
415 Throughout this chapter, the “$” sign refers to Australian dollars. The average conversion rate for July 2007 was 2.35 dollars to one pound sterling.
416 Australia Institute of Health and Welfare (2006), Australia’s Health 2006, p.287-288.
417 Victoria Government Department of Human Services (2007), Public hospitals and mental health services: Policy and funding guidelines 2007–08, p.160, Appendix 2 ‘Funding Structure Overview’. Available at: http://www.health.vic.gov.au/neonatal/perform.htm
418 Johnston, L., Trajanovska, M. (2006), Australian Neonatal Workforce Report, p.5. Available at: http://www.acnn.org.au/files/WhatsNew/Workforcereportfinal2.doc
419Ibid., p.4.
420 http://www.acnn.org.au/files/WhatsNew/benchmarkingsurvey2006.doc
421 Abdel-Latif, M. et al. (2006), 'Does Rural or Urban Residence Make a Difference to Neonatal Outcome in Premature Birth? A Regional Study in Australia', Archives of Disease in Childhood Fetal and Neonatal Edition, 91, F251 - F56.
422 http://www.kemh.health.wa.gov.au/services/nccu/guidelines/documents/3513.pdf
The provision of neonatal services: international comparisons RAND Europe
114
As noted above, New South Wales has a centralised, autonomous NETS service, which has been in operation since 1995. The Service has developed clinical guidelines, modified transport equipment and obtained purpose-built vehicles. It has to cover the 150 hospitals in which babies are delivered in New South Wales and occasionally performs an international retrieval from South East Asia and the Pacific Islands.423 NETS’ neonatal transport teams consist of a doctor (a paediatric registrar from New South Wales or a clinical fellow) and a trained intensive care nurse. There are always at least three teams available: one team, the first to respond, is located on base; the others are on call at home.424 NETS uses ground ambulances, helicopters and fixed wing aircraft. NETS can call on three dedicated ambulances that have been modified to accommodate neonatal incubators, and which are generally used when the travel distance is around one hour.425
The state of Victoria has a highly organised transportation system, comprised of three services: the Paediatric Emergency Transport System (PETS); the Perinatal Emergency Referral Service (PERS); and the Newborn Emergency Transport System (NETS). Both NETS and PETS have service agreements with Victoria’s Department of Human Services.426
Victoria’s PETS covers all of the state, southern New South Wales, and northern Tasmania.427 PETS deals with emergency transports of all children under age 15, while PERS and NETS deal specifically with the transport of newborns. PERS facilitates perinatal emergency transfers to appropriate facilities when required (it also provides neonatal resource information). It is the point of contact for those who need to arrange emergency transport for a mother or newborn and operates a 24-hour hotline.428 To improve the service provided, PERS is functionally and physically co-located with NETS. NETS provides the transportation for sick newborn infants and was established in 1976. The number of NETS retrievals increased from 933 to 1,018 per year between 2002 and 2006, and 4,669 infants were transported by the Service over the same period.429
Custom road ambulances, of which NETS has three, are used for distances up to 150 kilometres from the NETS base. Fixed wing aircraft are used for distances beyond 150–200 kilometres, although their usage may be curtailed by adverse weather and landing light availability (at night). Helicopters are used for distances between 30 kilometres and 200
423 Rashid, A., Bhuta, T., Berry, A. (1999), ‘A regionalised transport service, the way ahead?’, Arch Dis Child, 80, 488-492.
424 Ibid.
425 Ibid.
426 Victoria Government Department of Human Services (2007), Public hospitals and mental health services: Policy and funding guidelines 2007–08, p.6, p.25. Available at: http://www.health.vic.gov.au/neonatal/perform.htm
427 http://www.rch.org.au/pets/index.cfm?doc_id=5013
428 For criteria used by PERS when assessing transport options, see http://www.rwh.org.au/pers/index.cfm?doc_id=8905.
429 Neonatal Emergency Transport Service of Victoria (2007), Clinical Report June 2002-July 2006, p.5. Available at: http://www.wch.org.au/emplibrary/nets/Final_NETSReport_2002-06_v10_singlePage.pdf

RAND Europe Australia
115
kilometres, subject to weather conditions and a suitable landing site.430 A dedicated helicopter was provided for NETS retrievals in 2003/2004 and is considered to have enhanced flexibility and responsiveness. The number of helicopter transports has increased from 11 in 2002/2003 to a peak of 71 in 2004/2005. 431
430 http://www.rwh.org.au/nets/transport/emergency_services/index.cfm?doc_id=1451
431 Ibid.,p.4.

The provision of neonatal services: international comparisons RAND Europe
116
Table 8.2: Victoria NETS transfers by type and mode of transport, Australia, 2002-6432
Year Type of transport request
Location Mode of transport
2002/03 2003/04 2004/05 2005/06
Emergency
transports
Metropolitan
Road 639 663 663 685
Fixed Wing 2 0 2 0
Rotary Wing 0 5 3 6
Country
Road 159 166 121 130
Fixed Wing 109 124 147 136
Rotary Wing 11 25 68 48
Interstate
Road 2 0 0 0
Fixed-Wing 11 9 11 13
Rotary Wing 0 0 0 0
Sub Total 933 992 1015 1018
Elective transports
Metropolitan
Road 100 110 121 98
Fixed Wing 0 0 0 1
Rotary Wing 0 0 0 0
Country
Road 2 1 6 3
Fixed Wing 2 2 2 0
Rotary Wing 0 0 0 0
Interstate
Road 1 0 1 0
Fixed Wing 0 0 0 0
Rotary Wing 0 0 0 0
Sub Total 105 113 130 102
Return transports
Road 978 1091 1083 1031
Fixed Wing 115 90 140 141
Rotary Wing 0 0 0 0
Sub Total 1093 1181 1223 1172
Total 2131 2286 2368 2292
432 Adapted from Neonatal Emergency Transport Service of Victoria (2007), Clinical Report June 2002- July 2006, p.12. Available at: http://www.wch.org.au/emplibrary/nets/Final_NETSReport_2002-06_v10_singlePage.pdf
RAND Europe Australia
117
The departure times of these transports are influenced by the presence of a NETS team on site (it takes 30–45 minutes for an ambulance driver to arrive on site), and the type of transport (there is a 60-minute delay between the referral call and departure of a fixed wing aircraft). In order to structure referrals, they are classified into three categories according to the urgency of response needed: “Time critical” (depart NETS base within 15 minutes of referral call); “Urgent” (depart NETS base within 25 minutes of a referral call);, and “Non time critical” (depart NETS base within 60 minutes of a referral call).433 Mobilisation times (i.e. time from ‘decision to retrieve’ to ‘leaving NETS base’) for time critical road, fixed wing and helicopter retrievals have decreased by 37 per cent, 36 per cent and 44 per cent respectively.434
There is no charge for the NETS transport staff or the NETS equipment for transports within the usual NETS catchment range. However, the Melbourne Ambulance Service and Rural Ambulance Victoria Service charge for transporting the NETS team by road or air. These costs are covered by the referring hospital for all public patients, but private patients in private hospitals will be billed by the ambulance services.435 The current charges for the Melbourne Ambulance Service are: general emergency ambulance and attendance fee AUS $825.73; fixed wing transport fee AUS $759.97 for the first hour, AUS $12.68 for each additional minute; helicopter AUS $2,865.45 for the first hour, AUS $47.76 for each additional minute.436
A NETS transport team consists of a neonatal transport nurse (12 available), a neonatal medical transport fellow (5 available) or consultant (2 available) and an ambulance driver (for road retrievals) or paramedic (for Air Ambulance retrievals).437 By 2007, funding levels had allowed NETS to employ 7.5 Medical Transport Fellows.438
433 http://www.rwh.org.au/nets/transport/emergency_services/index.cfm?doc_id=1450
434 Neonatal Emergency Transport Service of Victoria (2007) Clinical Report June 2002-July 2006, p.4. Available at: http://www.wch.org.au/emplibrary/nets/Final_NETSReport_2002-06_v10_singlePage.pdf
435 http://www.rwh.org.au/nets/transport/emergency_services/index.cfm?doc_id=1453
436 http://www.ambulance-vic.com.au/Main-home/What-We-Do/Billing-policy.html. All amounts in Australian dollars. Accessed 13/07/07.
437 http://www.rwh.org.au/nets/transport/emergency_services/index.cfm?doc_id=1449
438 Neonatal Emergency Transport Service of Victoria (2007) Clinical Report June 2002-July 2006, p.4. Available at: http://www.wch.org.au/emplibrary/nets/Final_NETSReport_2002-06_v10_singlePage.pdf

The provision of neonatal services: international comparisons RAND Europe
118
Table 8.3: Composition of personnel present on transport missions for the Victoria Neonatal Emergency Transport Service, Australia, 2002-5439
Type of personnel 2002/03 2003/04 2004/05 2005/05
NETS Consultant 1.39 per cent 2.01 per cent 2.56 per cent 4.51 per cent
Nurse Only 14.56 per cent 9.64 per cent 12.80 per cent 12.75 per cent
NETS Fellow/Nurse 59.31 per cent 69.58 per cent 71.56 per cent 77.75 per cent
Other Doc/Nurse 23.34 per cent 19.58 per cent 13.88 per cent 7.16 per cent
8.5 Costs of neonatal services
In Australia, the relatively small number of children who require neonatal intensive care account for a significant proportion of acute inpatient care. It has been suggested that Australia might face a similar situation to the U.S., where health funds are reluctant to fund paediatric hospitals with patients requiring expensive care, resulting in access barriers for children who need complex, long-term services.440
In 2000/2001, allocated recurrent expenditure for diseases with neonatal causes for Australia amounted to AUS $358 million. This comprised AUS $334 million on admitted neonatal patients (a figure which includes a preliminary estimate of private medical services provided in hospital and expenditure on highly specialised drugs), AUS $12 million on out-of-hospital medical services, AUS $1 million on prescription pharmaceuticals and AUS $11 million on research. Although neonatal causes accounted for 0.5 per cent of total deaths, neonatal treatment costs represented 0.7 per cent of the total allocated expenditure. These costs amounted to approximately AUS $20 per capita in 2001, and represented a 22 per cent inflation-adjusted increase in expenditure from 1993/1994.441
A recent study undertook an economic evaluation of a population-based cohort of babies with a birth weight of 500g-999g born during four distinct time periods (1979 /1980, 1985/1987, 1991/1992, and 1997) in Victoria, and which were followed to at least two years of age. The evaluation comprised cost-effectiveness and cost-utility analyses. Costs were assessed mainly by the consumption of hospital resources, and the outcome data included survival and quality-adjusted survival rates at two years of age. The cost-effectiveness ratios (in 1997 Australian dollars) were similar between successive eras: AUS $5,270, AUS $3,130, and AUS $4,050 per life-year gained, respectively. The cost-utility ratios were similar between successive eras at AUS $5,270, AUS $3,690, and AUS $5,850 per quality-adjusted life-year gained, respectively, and were similar to the cost-effectiveness ratios. The cost-effectiveness and cost-utility ratios were generally higher in lower birth weight subgroups, but there were consistent gains in efficiency over the study period in infants of lower birthweight.442 A related study concluded that the relationship between the
439 Ibid., p.22.
440 Hanson, R., et al. (1998), ‘The true cost of treating children’, Medical Journal of Australia, 169:5, 1192-1202.
441 Australian Institute for Health and Welfare (2005), Health system expenditure on disease and injury in Australia 2000-1, p.12, p.15, p.23, p.26. All amounts are in Australian dollars.
442 Doyle, L. (2004), ‘Evaluation of Neonatal Intensive Care for Extremely Low Birth Weight Infants in Victoria Over Two Decades: II. Efficiency’, Pediatrics, 113:3, 510-514.
RAND Europe Australia
119
increase in the consumption of resources by NICUs and the increasing survival (and quality-adjusted survival) of infants had remained approximately linear.443
8.6 Best practices and guidelines
The Royal Australasian College of Physicians has published guidelines on the examination of the newborn and the management of procedure-related pain in neonates.444 Separately, the Australian College of Neonatal Nurses publishes position statements on topics such as the management of pain in sick hospitalised infants and the neonatal nurse practitioner role.445 However, many of the best practice guidelines originate wholly or in part from the major tertiary centres within the state neonatal networks. For example, the two tertiary level NICUs in the Western Australia neonatal network have created detailed guidelines that cover the entire range of neonatal care.446 The Victoria Department of Human Services developed a Neonatal Handbook in collaboration with the four neonatal units in Melbourne (Mercy Hospital for Women, Monash Medical Centre, The Royal Children’s Hospital and The Royal Women's Hospital). The Neonatal Handbook provides guidelines on clinical practice in the field of neonatal care and is available online.447 Furthermore, Victoria’s NETS provides guidelines on neonatal resuscitation448 and the Royal Women’s Hospital in Melbourne provides clinical practice guidelines for neonatal conditions.449
In 2005, the Victoria Government Department of Human Services produced detailed neonatal service guidelines that defined levels of care in neonatal units. These separated levels of neonatal service into Level I, Level II low dependency care, Level II high dependency care and Level III care, and specified what characteristics defined these different levels. Level III services, for example, need to be located at academic institutions because they require complex clinical, educational and research resources. The guidelines cover the following characteristics: organisation of services (including referral policies, communications, arrangements to ensure availability of required staff); staff administration (including staff education, staff efficiency and satisfaction, maintaining appropriate levels of qualified staff); policies and procedures (relating to infant and family-focused, holistic care, and admission and discharge criteria); the need to establish clinical guidelines using evidence-based tools; facilities and equipment (minimum standards, privacy provisions, access to laboratory services); and quality improvement programmes.450 The guidelines
443 Doyle, L. (2006) ‘Evaluation of neonatal intensive care for extremely-low-birth-weight infants’, Seminars in Fetal & Neonatal Medicine, 11:139-145, 142.
444 http://www.racp.edu.au/index.cfm?objectId=A4268489-2A57-5487-DEF14F15791C4F22
445 http://www.acnn.org.au/position_statements.php
446 http://www.kemh.health.wa.gov.au/services/nccu/guidelines/index.htm
447 http://www.rwh.org.au/nets/handbook/index.cfm?doc_id=447
448 http://www.netsvic.org.au/nets/index.cfm?doc_id=338
449 http://www.rwh.org.au/rwhcpg/neonatal.cfm?doc_id=2572
450 Victoria Government Department of Human Services (2005), Neonatal Services Guidelines: Defining Levels of Care in Victorian Hospitals, pp.5-7.
The provision of neonatal services: international comparisons RAND Europe
120
allow some variation in services based on the needs of individual patients, resource issues and problems unique to individual hospitals, but these must be documented.451
Victoria’s Department of Human Services includes quality improvement in its guidelines for neonatal levels of care. NICUs must contribute to the overall quality improvement programme of the host facility and study data provided by the Victorian Perinatal Data Collection Unit. They must monitor the routine collection of information relating to service delivery, including referrals, transfers, neonatal mortality and morbidity, and high-risk babies. This information should be assessed to identify problems and opportunities to improve, actions should be taken to achieve improvements and then re-evaluated to create long-term progress.452 Similarly, Western Australia’s Neonatology Clinical Care Audit Committee provides an annual report on its quality improvement activities. In 2005, this included audits on hand hygiene observation in NICUs, and audit of long-stay infants in a selected NICU, a neonatal follow-up programme (including a study of cerebral palsy and disability rates), consumer satisfaction, and discharge practices.453
The Perinatal National Minimum Dataset has collected data on all births in Australia since 1997. Information is collected from perinatal administrative and clinical record systems and forwarded to the relevant state or territory health authority. Data for the year as a whole are provided annually to the National Perinatal Statistics Unit for national collation. The Dataset has required data standards that improve data collection and comparison activities.454 The Australian and New Zealand Neonatal Network (ANZNN) monitors the care of high- risk newborns registered to Level III neonatal intensive care units. Unfortunately, it was not possible to access the Annual Reports of the Network.455
A recent study concluded that the availability of neonatal intensive care for extremely low birth weight infants was approaching 100 per cent in Victoria. It stated that the major challenge was now to improve the quality, rather than just the rate, of survival. One recommendation of how to do this is to further decrease the numbers of ‘outborn’ babies born in hospitals that cannot offer them the required level of care. Compared to ‘inborn’ babies, ‘outborn’ infants had significantly lower survival rates to two years of age, and therefore it might be appropriate to increase the proportion of low birth weight babies born in Level III centres in order to improve survival rates within a region.456
A 2006 article studied the effect of time of day of admission to a NICU on neonates treated in the New South Wales and Australia Capital Territory neonatal network between
451 Ibid.,p.31.
452 Ibid.,p.7.
453 Neonatology Clinical Care Audit Committee (2005), Annual Report to the Public on Activities undertaken or overseen by the Neonatology Clinical Care Audit Committee. Available at: http://www.pmh.health.wa.gov.au/general/about_us/documents/6057.pdf
454 Australian Institute of Health and Welfare National Perinatal Statistics Unit (2006), Australia’s mothers and babies 2004, p.2-3.
455 Ibid., p.5.
456 Doyle, L. (2006), ‘Evaluation of neonatal intensive care for extremely-low-birth-weight infants’, Seminars in Fetal & Neonatal Medicine, 11:139-145, 144.

RAND Europe Australia
121
1992 and 2002. Whilst 65 per cent of infants were admitted to the NICU outside 8am to 6pm, these infants did not experience increased neonatal mortality or major morbidity when compared to those admitted inside office hours. There was no association found between admission during the early morning hours or at periods before the end of medical shifts and high early mortality. The study concluded that ‘current staffing levels, specialisation, and networking are associated with lower circadian variation in adverse outcomes and after-hours admission to this NICU network and have no significant impact on early neonatal mortality and morbidity.’457
457 Abdel-Latif, M. (2006), ‘Mortality and Morbidities Among Very Premature Infants Admitted After Hours in an Australian Neonatal Intensive Care Unit Network’, Pediatrics, 117, 1632-1639.

123
CHAPTER 9 Sweden
9.1 Summary
9.1.1 Key features The implementation of neonatal care in Sweden varies from region to region but exists within a national framework of universal healthcare provision. Sweden has a compulsory, predominantly tax-based, health care system that covers the entire population. On the national level, the Ministry of Health and Social Affairs is responsible for ensuring that the system runs efficiently and pursues its fundamental objective (i.e. the effective use of healthcare resources, allocated according to need and governed by open and transparent decisions on priorities).458 The National Board of Health and Welfare is the Government’s central advisory and supervisory agency for health and social services.459
As the fourth largest country in Europe by area, with its population density focused significantly around its southern regions, Sweden has a well-organised and sophisticated ambulance service. However, it has no dedicated neonatal transfer system, relying instead on its ambulances for neonatal transfer. This service includes highly trained paramedics and specially adapted incubator cots, with specially adapted locking mechanisms to secure them within the vehicle. Similarly, although there are regionalised air ambulance services, there is not a dedicated neonatal air transfer system in place.
The number of neonatal deaths per 1,000 live births has decreased and stabilised over the past 20 years in Sweden. The improvement in the prognosis of very preterm infants during the last decades has been attributed primarily to improvements of neonatal intensive care, including the introduction of surfactant and antenatal steroid therapy. Also, the weight of
458 http://www.sweden.gov.se/sb/d/2061
459 Swedish National Board of Health and Welfare (2006), This is the National Board of Health and Welfare. Available at: http://www.socialstyrelsen.se/NR/rdonlyres/067C1106-7FD6-4194-B923-D40E0B257191/6817/200611813.pdf
The provision of neonatal services: international comparisons RAND Europe
124
babies has been increased due to increased weight of the mother and declining numbers of pregnant women that smoke.460
9.1.2 Key learning points Many high-risk pregnant women are referred to regional hospitals before delivery, as the Swedish health care system is mainly region based. On the regional level, county councils provide and finance health care services. The 21 counties are grouped into six medical care regions to facilitate cooperation on tertiary care, including neonatal intensive care. Specialised units, fully equipped for neonatal care, were introduced in Sweden during the 1960s and gradually spread.461 It should be noted that there have been wider changes in the Swedish health system during recent decades: between 1990 and 1995, the number of hospital beds was reduced by 28 per cent and health personnel reduced by 27 per cent, while health expenditure as a percentage of gross national product fell from 8.6 per cent to 7.2 per cent in that period. This led to three neonatal units being closed in 1997.462
During the last decades, neonatal intensive care has become increasingly centralised due to the relatively small number of children that require neonatal intensive care. Notably, Sweden continues to produce some of the lowest infant mortality rates in the world, and by far the lowest of the countries considered in this report. These facts suggest that a centralised system for the organisation of neonatal services may be appropriate for some countries because of the size and distribution of the patient population.
9.2 Statistics and trends
9.2.1 Preterm births In a recent report of the National Board of Health and Welfare (2004) it is estimated that approximately 0.16 per cent of total live births between 1985 and 2001 had a gestation of 23/26 weeks and six days.463 The most recent figure found on premature babies stems from STAKES National Research and Development Centre for Welfare and Health (2005), which states that babies with a gestational age before 37 weeks occurred in 5.5 per cent of all deliveries in 2003.464
460 Johansson, S., Montgomery, S.M., Ekbom, A., Otterblad Olausson, P., Granath, F., Norman, M., Cnattingius, S. (2004), ‘Preterm delivery, level of care, and infant death in Sweden: a population-based study’, Pediatrics, 113:5, 1230-1235.
461 Jonsson, E., Banta, H.D. (1995), ‘Health care technology in Sweden.’ In: Banta HD., Gelband, H., Battista, R.N., Jonsson, E. (eds)., Health care technology and its assessment in eight countries. U.S. Congress. Office of Technology Assessment, OTA-BP-H-140. Washington, DC: U.S. Government Printing Office, 1995.
462 Wallin, L. et al. (2000), ‘National Guidelines for Swedish Neonatal Nursing Care: evaluation of clinical application’, International Journal for Quality in Health Care, 12:6, 465-474.
463 Achterberg, P.W. (2005), Measuring up to the best? International differences in perinatal mortality (in Dutch). Available at: http://www.rivm.nl/bibliotheek/rapporten/270032001.pdf
464 STAKES National Research and Development Centre for Welfare and Health, Perinatal statistics in the Nordic countries. Statistical Summary 28/2005, 1 November 2005. Available at: http://www.stakes.fi/NR/rdonlyres/BDE35D36-E9BF-4CF6-9363-197B758BC512/0/0528taulut.pdf
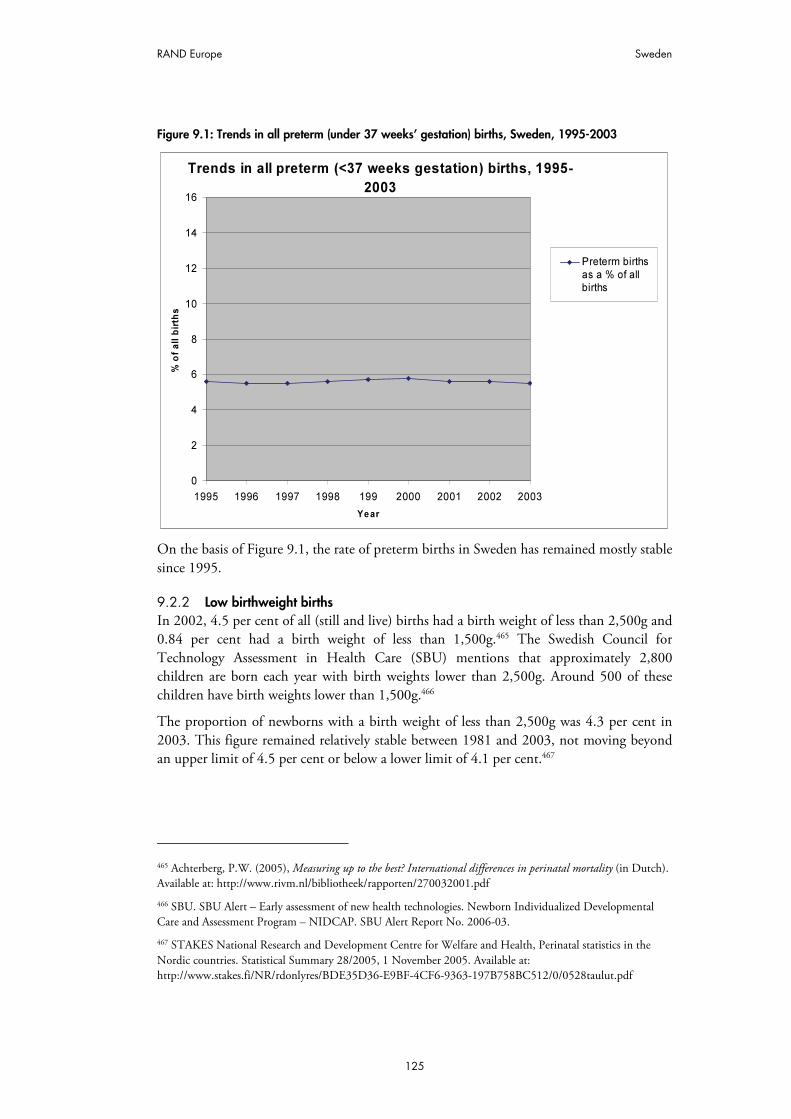
RAND Europe Sweden
125
Figure 9.1: Trends in all preterm (under 37 weeks’ gestation) births, Sweden, 1995-2003
Trends in all preterm (<37 weeks gestation) births, 1995-
2003
0
2
4
6
8
10
12
14
16
1995 1996 1997 1998 199 2000 2001 2002 2003
Year
% o
f a
ll b
irth
s
Preterm births
as a % of all
births
On the basis of Figure 9.1, the rate of preterm births in Sweden has remained mostly stable since 1995.
9.2.2 Low birthweight births In 2002, 4.5 per cent of all (still and live) births had a birth weight of less than 2,500g and 0.84 per cent had a birth weight of less than 1,500g.465 The Swedish Council for Technology Assessment in Health Care (SBU) mentions that approximately 2,800 children are born each year with birth weights lower than 2,500g. Around 500 of these children have birth weights lower than 1,500g.466
The proportion of newborns with a birth weight of less than 2,500g was 4.3 per cent in 2003. This figure remained relatively stable between 1981 and 2003, not moving beyond an upper limit of 4.5 per cent or below a lower limit of 4.1 per cent.467
465 Achterberg, P.W. (2005), Measuring up to the best? International differences in perinatal mortality (in Dutch). Available at: http://www.rivm.nl/bibliotheek/rapporten/270032001.pdf
466 SBU. SBU Alert – Early assessment of new health technologies. Newborn Individualized Developmental Care and Assessment Program – NIDCAP. SBU Alert Report No. 2006-03.
467 STAKES National Research and Development Centre for Welfare and Health, Perinatal statistics in the Nordic countries. Statistical Summary 28/2005, 1 November 2005. Available at: http://www.stakes.fi/NR/rdonlyres/BDE35D36-E9BF-4CF6-9363-197B758BC512/0/0528taulut.pdf

The provision of neonatal services: international comparisons RAND Europe
126
Figure 9.2: Trends in low birth weight births, Sweden, 1995-2005
Trends in low birthweight births, 1995-2005
0
2
4
6
8
10
12
1995 1996 1997 1998 1999 2000 2001 2002 2003
Year
% o
f to
tal liv
e b
irth
s
% of total livebirths with
birthweight<2,500g
9.2.3 Mortality rates In 2003, perinatal mortality (death within 7 days of birth, excluding stillbirths) stood at 0.9 per 1,000 newborns (including stillbirths). Neonatal mortality (death within 28 days of birth) was 1.3 per 1,000 live births.468 Figures from the OECD put the infant mortality rate (death within one year of birth) at 3.1 deaths per 1,000 live births, one of the lowest rates in the world.469 Since these rates for infant mortality originate from a different source from those for perinatal and neonatal mortality, and since the denominator for the perinatal mortality rates (the number of newborns including stillbirths) is different from that for the neonatal mortality rates (the number of live births), the three sets of rates have not been placed together in one graph. Rather, they are displayed on separate graphs (Figures 9.3 to 9.5), below.
468 STAKES National Research and Development Centre for Welfare and Health, Perinatal statistics in the Nordic countries. Statistical Summary 28/2005, 1 November 2005. Available at: http://www.stakes.fi/NR/rdonlyres/BDE35D36-E9BF-4CF6-9363-197B758BC512/0/0528taulut.pdf
469 Organisation for Economic Cooperation and Development (2007), World Health Statistics 2005.

RAND Europe Sweden
127
Figure 9.3: Trends in perinatal mortality, Sweden, 1995-2003
Trends in perinatal mortality, 1995-2003
0
1
2
3
4
5
6
7
8
1995 1996 1997 1998 1999 2000 2001 2002 2003
Year
De
ath
s p
er
1,0
00
ne
wb
orn
s (
inc
lud
ing
sti
llb
irth
s)
Perinatal
mortality(Death within0-7 days of
birth)
Figure 9.4: Trends in neonatal mortality, Sweden, 1995-2003
Trends in neonatal mortality, 1995-2003
0
1
2
3
4
5
6
7
8
1995 1996 1997 1998 1999 2000 2001 2002 2003
Year
De
ath
s p
er
1,0
00
liv
e b
irth
s
Neonatal
mortality(Death within0-27 days of
birth)

The provision of neonatal services: international comparisons RAND Europe
128
Figure 9.5: Trends in infant mortality, Sweden, 1995-2003
Trends in infant mortality, 1995-2003
0.0
1.0
2.0
3.0
4.0
5.0
6.0
7.0
8.0
1995 1996 1997 1998 1999 2000 2001 2002 2003
Year
De
ath
s p
er
1,0
00
liv
e b
irth
s
Infant
mortality(Death withinone year of
birth)
Based on these figures it appears that perinatal mortality has decreased and stabilised over the years in Sweden. This is mainly due to reduction in intrapartum and postpartum deaths.470 471 A different source indicates that of the babies weighing less than 1,500g in 2002, perinatal mortality was about 180 per 1,000 births. Perinatal mortality of the babies weighing less than 2,500g was approximately 57 per 1,000 births (the relative risk is 11 times higher than Swedish average for all births). This implies that approximately 30 per cent of all perinatal mortality in Sweden concerns children with a birth weight of less than 2,500g and approximately 20 per cent with a birth weight of less than 1,500g.472
9.2.4 Neonatal morbidity A 2005 study examined the trends in the prevalence of cerebral palsy in a population-based cohort born between 1995 and 1998 (88,371 live births). In this cohort 1.92 per 1,000 live births appeared to have cerebral palsy.473 For the 1995/1998 cohort (excluding eight post-neonatal derived cases), the gestational age-specific prevalence figures were 77 per
470 Nordstrom L. (2005), Quality improvement in perinatal care. Available at: http://www.kbh.uu.se/pdf/Quiip/Surveillance.pdf
471 Achterberg, P.W. (2005), Measuring up to the best? International differences in perinatal mortality (in Dutch). Available at: http://www.rivm.nl/bibliotheek/rapporten/270032001.pdf
472 Ibid.
473 Himmelmann, K., Hagberg, G., Beckung, E., Hagberg, B. Uvebrant, P. (2005), ‘The changing panorama of cerebral palsy in Sweden. IX. Prevalence and origin in the birth-year period 1995-1998’ Acta Paediatrica, Vol. 94:3, 287-294.
RAND Europe Sweden
129
1,000 for children born before 28 weeks’ gestation, 40 for children born at 28-31 weeks, 7 for children born at 32/36 weeks and 1.1 for children born after 36 weeks’ gestation. Spastic hemiplegic, diplegia and tetraplegia accounted for 38 per cent, 35 per cent and 6 per cent, dyskinetic cerebral palsy for 15 per cent and ataxia for six per cent respectively.474 Another recently published article gave the prevalence of cerebral palsy as 2.5 per 1,000 deliveries in Sweden.475
For the 1995/1998 cohort mentioned above, the aetiology in children born at term was considered to be prenatal in 38 per cent, peri-neonatal in 35 per cent and unclassifiable in 27 per cent. In children born preterm, it was 17 per cent, 49 per cent and 33 per cent respectively. In more than half the children with cerebral palsy, there are accompanying impairments, which may override the motor impairment in some. Epilepsy, learning disability of varying degree and profile, severe visual and hearing impairments may be possible to detect at an early age, while more subtle sensory and cognitive problems eventually become apparent at school age. Learning disability was present in 40 per cent, epilepsy in 33 per cent and severe visual impairment in 19 per cent.476
There has been a continuing decreasing trend in the prevalence of cerebral palsy for births occurring in the periods 1991/1994 and 1995/1998, both in children born at term and especially in those born preterm. However, there has been an increase in dyskinetic cerebral palsy in children born at term.477 478
9.3 Organisation and scale of provision of neonatal services
The Centre for Epidemiology of the National Board of Health and Welfare has national responsibility for health data registers, which includes the Medical Birth Register.479 The Medical Birth Register includes information on all deliveries and newborns in Sweden
474 Himmelman, K. (2006), Cerebral palsy in Western Sweden. Epidemiology and function, The Sahlgrenska Academy at Göteborg University Thesis 2006. Available at: https://gupea.ub.gu.se/dspace/bitstream/2077/753/1/Ram%20Cerebral%20palsy%20in%20western%20Sweden%20%20epidemiology%20and%20function.pdf
475 Nordstrom, L. (2005), Quality improvement in perinatal care.Available at: http://www.kbh.uu.se/pdf/Quiip/Surveillance.pdf
476 Himmelman, K. (2006) Cerebral palsy in Western Sweden. Epidemiology and function. The Sahlgrenska Academy at Göteborg University Thesis 2006. Available at: https://gupea.ub.gu.se/dspace/bitstream/2077/753/1/Ram%20Cerebral%20palsy%20in%20western%20Sweden%20%20epidemiology%20and%20function.pdf
477 K. Himmelmann, G., Hagberg, E., Beckung, B., Hagberg, P., Uvebrant (2005), ‚The changing panorama of cerebral palsy in Sweden, IX. Prevalence and origin in the birth-year period 1995-1998’. Acta Paediatrica, 94:3, 287-294..
478 Himmelman, K. (2006), Cerebral palsy in Western Sweden. Epidemiology and function, The Sahlgrenska Academy at Göteborg University Thesis 2006. Available at: https://gupea.ub.gu.se/dspace/bitstream/2077/753/1/Ram%20Cerebral%20palsy%20in%20western%20Sweden%20%20epidemiology%20and%20function.pdf.
479 Swedish National Board of Health and Welfare, Welcome to the Centre for Epidemiology. Available at: http://www.sos.se/epc/epceng.htm#epid

The provision of neonatal services: international comparisons RAND Europe
130
from 1973. The register covers all live births and stillbirths according to the national definitions.480 As there were difficulties in retrieving publicly available policy documents in English, this chapter relies mainly on data from the Centre for Epidemiology and journal articles.
As the vast majority of births take place in hospital (99 per cent), neonates are cared for in all hospitals, which include some degree of intensive care. In 1993, there were 45 neonatal units. Although obstetricians are responsible for deliveries with obstetrical risk, midwives generally conduct these deliveries with the exception of instrumental and operative deliveries.481 University hospitals are referral centres with full neonatal intensive care services, including neonatal surgery. During the 1960s, these specialised clinics appeared in Sweden and gradually spread.482 The levels of care provided by units follow the basic three-tier system of classification.483
The organisation of neonatal care has developed along similar lines in most hospitals. Neonatal intensive care units (NICUs) are run by paediatric specialists, are concentrated in the large and central district hospitals and are developed with the close collaboration of obstetrics and paediatrics departments.484 This suggests that the organisation of neonatal care is based on the demand for care and the ability to supply such care, both of which are affected by geographical factors.
Infants with very low birth weight are usually intubated at birth and mechanically ventilated at NICUs. Newborns below 500g birth weight are often small for their gestational age, with an increased risk of short- and long-term mortality and morbidity. The care given to neonates must therefore be individualised.485 An intervention model, the Newborn Individualised Developmental Care and Assessment Programme (NIDCAP) has
480 STAKES National Research and Development Centre for Welfare and Health, Perinatal statistics in the Nordic countries. Statistical Summary 28/2005, 1 November 2005. Available at: http://www.stakes.fi/NR/rdonlyres/BDE35D36-E9BF-4CF6-9363-197B758BC512/0/0528taulut.pdf
481 Kateman, H., Herschderfer, K. (2005), Multidisciplinary Collaborative Primary Maternity Care Project Current Practice in Europe and Australia. A descriptive study. Available at: http://www.mcp2.ca/english/documents/IntlReptFinal9Jul05.pdf
482 Jonsson, E., Banta, H.D. (1995), Health care technology in Sweden. In: Banta, H.D,, Gelband, H., Battista, R.N., Jonsson, E. (eds), Health care technology and its assessment in eight countries. U.S. Congress. Office of Technology Assessment, OTA-BP-H-140. Washington, DC: U.S. Government Printing Office, 1995.
483 Wallin, L. et al. (2000), ‘National Guidelines for Swedish Neonatal Nursing Care: evaluation of clinical application’, International Journal for Quality in Health Care, 12:6, 465-474.
484 Jonsson, E., Banta, H.D. (1995), Health care technology in Sweden. In: Banta, H.D,, Gelband, H., Battista, R.N., Jonsson, E. (eds), Health care technology and its assessment in eight countries. U.S. Congress. Office of Technology Assessment, OTA-BP-H-140. Washington, DC: U.S. Government Printing Office, 1995.
485 Schollin, J. (2005), ‘Views on neonatal care of newborns weighing less than 500 grams’. ActaPaediatrica, 94:2, 140-142.

RAND Europe Sweden
131
been developed to stimulate preterm infants at levels adapted to the child’s degree of neurological maturity.486
The number of children born who require neonatal intensive care is small. For example, the neonatal ward at Karolinska Institute is a centre for about 25,000 deliveries (2006), and there are 18 cots but only 9 intensive care cots (Level III) with ventilators.487 Karolinska Hospital has about 4,500 deliveries. The unit at Danderyd Hospital also has 18 cots (Level II). Danderyd's maternity hospital is one of the largest in Sweden with more than 6,500 deliveries. The three hospital units have about 1,200 admissions per year; about 100 patients of those have a birth weight below 1,000g.488
Due to the small numbers of newborns in need of neonatal intensive care, it appears not to be possible to develop an intensive care service at all departments. Neonatal intensive care has thus become increasingly centralised, as recommended in the National Board of Health and Welfare report on neonatal intensive care. The chief reasons for centralisation have been structural and organisational changes in some county councils, often linked with economic savings.489
Neonatal intensive care depends increasingly on resources, technology and competence – which makes demands on staff training and the ability to retain competent staff. Particularly in the metropolitan regions, there is a shortage of beds for neonatal intensive care, which has led to increased co-operation among neonatal departments for mutual help with care during peak periods. Also, there is a need for well-functioning networks to decentralise experience in resuscitation and stabilisation.490
A recent Swedish study evaluated quality of the perinatal care provided in relation to the size of the birth delivery unit (in terms of actual and estimated number of births), the presence of paediatric department and the size of the catchment area for deliveries. It found that neonatal mortality was significantly higher for infants in families living within the catchment area of the smallest units without a paediatric department. However, it concluded that the observed differences were rather minor, and that Sweden provided a fairly homogenous quality of perinatal care and an efficient referral system for risk pregnancies.491
486 SBU. SBU Alert – Early assessment of new health technologies. Newborn Individualized Developmental Care and Assessment Program – NIDCAP. SBU Alert Report No. 2006-03.
487 Interview with H. Lagercrantz by Norman Swan, 2003. Available at: http://www.abc.net.au/rn/talks/8.30/helthrpt/stories/s797463.htm
488 Karolinska Institute (2007), Neonatal Clinical Unit. Available at: http://ki.se/ki/jsp/polopoly.jsp?d=10744&l=en
489 National Board of Health and Welfare (2002). Sweden’s health care report. Available at: http://www.socialstyrelsen.se/NR/rdonlyres/748038A0-1F85-46A1-B314-0ADD2D003B4B/1408/20021113.PDF
490 Johansson, S., Montgomery, S.M., Ekbom, A., Otterblad Olausson, P., Granath, F., Norman, M., Cnattingius, S. (2004), ‘Preterm delivery, level of care, and infant death in Sweden: a population-based study’, Pediatrics, 113:5, 1230-1235.
491 Finnström, O. et al. (2006), ‘Size of delivery unit and neonatal outcome in Sweden: A catchment area analysis’, Acta Obstetrica Gynecologica Scandinavia, 85:1, 63-67.

The provision of neonatal services: international comparisons RAND Europe
132
9.4 Transport services
Sweden has an area of 449,964 square kilometres (173,731 square miles) and is the fourth largest country in Europe by area. As there are only a few major cities (all located in the south), transportation is a major issue.
From the document review it appeared that about 13 per cent of all neonates are transferred to children’s departments for observation and care, because of premature birth, oxygen deficiency (asphyxia) and infections.492 With regard to the organisation of transport services for neonates, specialised neonatal transport teams are not used in Sweden.493 Also, mobile transport teams are not developed nationwide, but regionally.494 All ambulance services are locally based and staffed with highly trained nurses. The service is organised in close relationship with the local health care centres.495
The use of air ambulances was noted in the four northern counties of Sweden, which share two fixed wing air ambulances. The basic crew for each plane consists of two pilots and a registered nurse with basic education in anaesthesia and/or intensive care and special education in flight medicine service. An anaesthesiologist and an additional nurse can be added to the crew if necessary. The helicopter and the fixed wing plane are equipped with what is needed to transport patients at an intensive care level. They can manage incubator transportation when necessary.496 In the south and middle parts of Sweden (and part of Finland), at a radius of approximately 600 kilometres from Uppsala, there is also an air ambulance.497
For these northern counties, the average number of patients transported each year to the University Hospital in Umeå was 1,400. There are, however, specified nursing guidelines about transportation of neonates. These include: stabilisation of infant before transport; information to parents; parent-infant meeting, ideally with skin-to-skin contact, before transport; infant assessment and relevant medical interventions during the transport; appropriate positioning and safety measures; staff collaboration and communication between involved units.498
492 National Board of Health and Welfare (2002), Sweden’s health care report. Available at: http://www.socialstyrelsen.se/NR/rdonlyres/748038A0-1F85-46A1-B314-0ADD2D003B4B/1408/20021113.PDF.
493 Hellström-Westas, L., Hanséus, K., Jögi, P., Lundström, N.R. (2001), ‘Long-distance transports of newborn infants with congenital heart disease’, Paediatric Cardiology, 22:5, 380-384.
494 Johansson, S., Montgomery, S.M., Ekbom, A., Otterblad Olausson, P., Granath, F., Norman, M., Cnattingius, S. (2004), ‘Preterm delivery, level of care and infant death in Sweden: a population-based study’, Pediatrics, 113:5, 1230-1235..
495 Gunnarsson, B. et al. (2007), ‘Ambulance Transport and Services in the Rural Areas of Iceland, Scotland and Sweden’, Journal of Emergency Primary Health Care, 5:1, 1447-4999. Available at: http://www.jephc.com/uploads/990222Final.pdf
496 Ibid.
497 http://www.akademiska.se/templates/page____10944.aspx
498 Wallin, L., et al. (2000), ‘National Guidelines for Swedish Neonatal Nursing Care: evaluation of clinical application’, International Journal for Quality in Health Care, 12:6, 465-474.

RAND Europe Sweden
133
Little has been published about specific problems that may occur during long-distance transports of newborn cardiac patients. A study on paediatric heart surgery was published in 2001.499 In this study, 286 transports were prospectively investigated during a 4-year period after centralisation of paediatric heart surgery in Sweden. A majority (77.3 per cent) of the transports was carried out by non-specialised teams. Ten severe adverse events, including the death of one infant, occurred during the transports (3.5 per cent). Another infant died later of cerebral complications from hypoxia, rendering a transport-related mortality of 0.7 per cent. Twenty-two infants (7.7 per cent) were severely hypoxic (oxygen saturation < 65 per cent) at arrival, and 12 of these infants suffered from transposition of the great arteries. During the second 2-year period, increased use of intravenous prostaglandin and transportation from tertiary-level units was associated with better transport outcome. During the same time period, overall 30-day postoperative mortality for paediatric cardiac surgery decreased from 4.0 per cent to 1.2 per cent. The authors concluded that when highly specialised treatment is centralised for quality reasons it is also important that risks associated with transport are considered and that the quality of transport is high. For some cardiac malformations, antenatal diagnosis and referral of the mother for delivery to a centre with paediatric cardiac surgery would probably further increase the chance of healthy survival in some infants.500
9.5 Costs of neonatal services
It was not possible to find overall cost figures for neonatal care in Sweden. In addition, limited quantitative information on neonatal care was available. The figures presented below – originating from several sources and referring to different years/study populations – provide some insight in the magnitude of costs related to neonatal care in Sweden.
Between 1979 and 1993, children with a birth weight of < 2,500g spent an average of 660 days per 1,000 live births in hospital due to neonatal diseases, which corresponds to 12.5 per cent of all care days for children and adolescents aged between 0 and 18 years (Stockholm county only).501 Another study indicates that around 150,000 children and young people between 0 and 19 years were at some time admitted for hospital care during 1999. Children aged less than one year counted for 29,093 hospital admissions (19.3 per cent of total costs). Their average length of stay was 6.9 days (average 4.1). Children aged <1 year were alone responsible for about one third of all care days (total: 61,280).502
499 Hellström-Westas, L., Hanséus, K., Jögi, P., Lundström, N.R. (2001), ‘Long-distance transports of newborn infants with congenital heart disease’, Paediatric Cardiology, 22:5, 380-384.
500 Hellström-Westas, L., Hanséus, K., Jögi, P., Lundström, N.R. (2001), ‘Long-distance transports of newborn infants with congenital heart disease’, Paediatric Cardiology, 22:5, 380-384.
501 Bremberg, S. (2003), Evidence-based health promotion for children and adolescents in Stockholm county. Available at: http://www.cbu.dataphone.se/EngBarnrapp/neonata.html
502 National Board of Health and Welfare (2002). Sweden’s health care report. Available at: http://www.socialstyrelsen.se/NR/rdonlyres/748038A0-1F85-46A1-B314-0ADD2D003B4B/1408/20021113.PDF
The provision of neonatal services: international comparisons RAND Europe
134
In a 2006 study, all live singleton deliveries in Sweden between 1998 and 2001 (336,136) were studied with regard to first-year hospitalizations of infants admitted for neonatal care 0 to 6 days after birth (24,583), as were hospitalizations of mothers for whom the date of admission lay ±1 month from the date of delivery. It appeared that on average, preterm infants (gestational age <37 weeks) had first-year lengths of stay roughly four times as long as full term infants admitted for neonatal care (30 days versus eight days). The average first-year length of stay of the extremely premature infants (gestational age 22/25 weeks) was more than six times as long that of infants born at 34/36 weeks’ gestation (108 days versus 17 days). Mothers delivering preterm had an average length of stay slightly more than twice as long as that of mothers of full term infants during the ante- and postpartum period.503
The costs of NIDCAP (Newborn Individualized Developmental Care and Assessment Program) involve costs for the specialised training of personnel and costs for the continuous behavioural observation.504 The total extra nursing time needed for ten weekly observations of an infant born after 27 weeks’ gestation, would cost approximately $700 in Sweden.505 On the other hand, at the Karolinska Institute a reduction of hospital charges of approximately $10,000 per infant, due to the reduced need of ventilator assistance, was estimated.506
9.6 Best practices and guidelines
Guidelines for practice are developed at both the national and local level in Sweden. At the national level, the Swedish Board of Health and Welfare is responsible for guidelines and good medical practice. In 1995 the Swedish Board of Health and Welfare issued the clinical Guideline for Pregnancy Care (Riktlinjer för hälsovård under graviditet), which contains guidelines for both normal and complicated pregnancy and birth. It provides a practice framework and recommendations for risk selection and referral from midwife to obstetrician. It appears that this recommendation is not followed in all areas of the country, especially where the relationship and communication between midwives and obstetricians is considered to be good.507
503 Ringborg, A., Berg, J., Norman, M., Westgren, M., Jonsson, B. (2006), ‘Preterm birth in Sweden: What are the average lengths of hospital stay and the associated inpatient costs?’, Acta Paediatrica, 95:12, 1550–1555.
504 SBU. SBU Alert – Early assessment of new health technologies. Newborn Individualized Developmental Care and Assessment Program – NIDCAP. SBU Alert Report No. 2006-03.
505 Throughout this chapter, the “$” sign refers to U.S. dollars. The average conversion rate for July 2007 was 2.03 dollars to one pound sterling.
506 Westrup, B., Kleberg, A., von Eichwald, K., Stjernqvist, K., Lagercrantz, H. (2000), ‘A randomized controlled trial to evaluate the effects of NIDCAP (Newborn Individualized Developmental Care and Assessment Program) in a Swedish setting’, Paediatrics, 105, 66-72.
507 Kateman, H., Herschderfer, K. (2005), Multidisciplinary Collaborative Primary Maternity Care Project Current Practice in Europe and Australia. A descriptive study. Available at: http://www.mcp2.ca/english/documents/IntlReptFinal9Jul05.pdf

RAND Europe Sweden
135
National policies regarding resuscitation of extremely preterm infants are proposed by the National Board of Health and Welfare and the Swedish Paediatric Society. According to a national survey, the professional community in Sweden agrees on and follows these policies regarding infants born after 24 weeks’ gestation.508
There are also Swedish guidelines for prevention and treatment of pain in the newborn infant509 and neonatal nursing guidelines. The neonatal nursing guidelines were initiated by the Uppsala University and Karolinska Institute and carried out in co-operation with almost all neonatal units in Sweden. In total, 13 guidelines were developed: general nursing; family-centred care; developmental supportive care; breastfeeding and nutrition; support to the family in crises; special nursing care: emergency cases; transportation; interventions to intensive care; CPAP-treatment; pain management; skin care; hygiene routines and management of central and peripheral lines; medication administration and medical-technical safety.510
The guidelines on emergency cases include: neonatologists and neonatal nurse attends all high-risk deliveries; infant assessment and relevant medical interventions; infant’s father, and mother if possible, accompanying to the neonatal unit after delivery; and adequate information provision. The guidelines on interventions in intensive care include recommendations for weighing, suctioning, X-raying and transferring the infant from incubator to parent, while the infant is on CPAP or ventilator treatment; assessment of infant; planning and co-ordination of safe and gentle performance; stabilising infants during procedure; and parent information and involvement. 511
Views differ on the wisdom of treating neonates born after very short pregnancy terms, as a European concerted action revealed. Infants born after 24 weeks are treated as a matter of course in most countries. In Sweden, this is justified on the basis that treatment can be withdrawn if serious complications occur.512 Also, a more individualised approach for the newborn infant was recommended already in 1989, and has been established by the introduction of the NIDCAP.513
508 Johansson, S., Montgomery, S.M., Ekbom, A., Otterblad Olausson, P., Granath, F., Norman, M., Cnattingius, S. (2004), ‘Preterm delivery, level of care and infant death in Sweden: a population-based study’, Pediatrics, 113:5, 1230-1235.
509 Larsson, BA., Gradin, M., Lind, V., Selander B. (2002), ‘Swedish guidelines for prevention and treatment of pain in the newborn infant’, Läkartidningen, 25: 99 (17), 1946-9.
510 Wallin, L. et al. (2000), ‘National Guidelines for Swedish Neonatal Nursing Care: evaluation of clinical application’, International Journal for Quality in Health Care, 12:6, 465-474.
511 Ibid.
512 Health Council of the Netherlands (2000), Perinatal intensive care, The Hague: Health Council of the Netherlands, Available at: http://www.gr.nl/pdf.php?ID=26
513 SBU. SBU Alert – Early assessment of new health technologies. Newborn Individualized Developmental Care and Assessment Program – NIDCAP. SBU Alert Report No. 2006-03.


137
REFERENCES


139
Reference List
Abdel-Latif, M. (2006), ‘Mortality and Morbidities Among Very Premature Infants Admitted After Hours in an Australian Neonatal Intensive Care Unit Network’, Pediatrics, 117, 1632-1639.
Abdel-Latif, M. et al. (2006), ‘Does Rural or Urban Residence Make a Difference to Neonatal Outcome in Premature Birth? A Regional Study in Australia’, Archives of Disease in Childhood Fetal and Neonatal Edition, 91, F251 - F56.
Abeywardana, S. (2006), Report of the Australian and New Zealand Neonatal Network 2004. Sydney: Australian and New Zealand Neonatal Network.
Achterberg, P.W. (2005), ‘Measuring up to the best? International differences in perinatal mortality’, (in Dutch), Available at: http://www.rivm.nl/bibliotheek/rapporten/270032001.pdf
Altimer, L., Brown, B., Tedeschi, L. (2006), NANN Guidelines for Neonatal Nursing Policies, Procedures, Competencies, and Clinical Pathways, 4th edition.
American Academy of Pediatrics (2004), ‘Policy Statement: Levels of Neonatal Care’, Pediatrics, 114:5, 1341-47.
Anderson, P., Doyle, L. (2003), ‘Neurobehavioral Outcomes of School-age Children Born Extremely Low Birth-Weight or Very Preterm in the 1990s’, Journal of the American Medical Association, 289:24, 3264-3272.
Australian Bureau of Statistics (2006), Deaths, Australia 2005.
Australian Institute of Health and Welfare (2004), Bulletin, Issue 21.
Australia Institute of Health and Welfare (2006), Australia’s Health 2006.
Australian Institute of Health and Welfare National Perinatal Statistics Unit (1997-2006), Australia’s mothers and babies, 1995-2004.
Australian Institute for Health and Welfare (2005), Health system expenditure on disease and injury in Australia 2000-1.
BLISS (2007), Handle with Care: A Review of Scottish Neonatal Services, London.
BLISS (2005), Special Care for Sick Babies: Choice or Chance? London.

The provision of neonatal services: international comparisons RAND Europe
140
Bremberg, S. (2003), ‘Evidence-based health promotion for children and adolescents in Stockholm county’, Available at: http://www.cbu.dataphone.se/EngBarnrapp/neonata.html
British Association of Perinatal Medicine (2001), Standards for Hospitals Providing Neonatal Intensive and High Dependency Care, 2nd edition, London: British Association of Perinatal Medicine.
British Columbia Ministry of Health & PHSA (2005), Provincial Health Services.
British Columbia Reproductive Care Program (2005), Levels of Perinatal Care. Available at: http://www.rcp.gov.bc.ca/whatsnew_pdfs/levels per cent20of per cent20perinatal per cent20care per cent20may per cent206 per cent202005.pdf
British Columbia Reproductive Care Program (2003), British Columbia Perinatal Database Registry Annual Report 2003.
British Columbia Women’s Hospital and Health Centre & PHSA (2006), BC Women’s Strategic Plan.
British Columbia Women’s Hospital and Health Centre & PHSA (2002), Specialised Perinatal Services Provincial Plan. Available at: http://www.interiorhealth.ca/NR/rdonlyres/9819A53D-0EE3-42D4-9F8E-BA99C82F67DE/1129/ProvincialPerinatalPlan.PDF
California Code of Regulations (1995), Title 22: Social Security, Volume 28, Revised November 1995. Perinatal Unit General Requirements §70547- 79723. Available at: http://www.calregs.com/linkedslice/default.asp?SP=CCR-1000&Action=Welcome
California School Nurses Organisation (2007), CACSHCNEWS, 1:3. Available at: http://www.csno.org/docs/CaCSHCNews_January%202007%20(v%5B1%5D.1,%20i.3).pdf
Canadian Institute of Health Information (2004), Giving Birth in Canada: A Regional Profile.
Canadian Institute for Health Institute Information (2004), Giving Birth in Canada: The Costs.
Canadian Institute of Health Information, National Health Expenditure Database Definitions. Available at: http://www.cihi.ca/cihiweb/dispPage.jsp?cw_page=statistics_nhex_definitions_e
Canadian Institute of Health Information (2004), Providers of Infant and Maternity Care.
Canadian Neonatal Network (2005), Annual Report 2005.
Canadian Pediatric Society (2006), ‘Levels of Neonatal Care: Position Statement’, Paediatric Child Health, .11:5, 303-306.
Canadian Perinatal Surveillance System (2003), Canadian Perinatal Health Report 2003.

RAND Europe References
141
Centre for Healthcare Innovation and Improvement (2002), Report on Tertiary Care in British Columbia. Available at: http://www.chii.ubc.ca/publications/tertiaryReport.pdfChildren's and Women's Health Centre of BC (2002), Specialised Perinatal Services Provincial Plan, Vancouver: Children's and Women's Health Centre of BC Provincial Health Services Authority.
Clements, K.M., et al. (2007), ‘Preterm birth associated cost of early intervention services: an analysis by gestational age’, Pediatrics, 119:4, 866-74.
Council on Maternal and Infant Health in the State of Georgia (1999), Recommended Guidelines for Perinatal Care in Georgia, 2nd edition.
Cuevas, K.D., et al. (2005), ‘The cost of prematurity: hospital charges at birth and frequency of rehospitalizations and acute care visits over the first year of life: a comparison by gestational age and birth weight’, American Journal of Nursing, 105:7, 56–64.
Department of Health Expert Working Group on Neonatal Intensive Care Services (2003), Report of the Neonatal Intensive Care Services Review Group Available at: http://www.dh.gov.uk/prod_consum_dh/groups/dh_digitalassets/@dh/@en/documents/digitalasset/dh_4018744.pdf
Department of Justice, Canada, (2007), Canada Health Act (R.S., 1985, c. C-6). Available at: http://laws.justice.gc.ca/en/ShowFullDoc/cs/C-6///en
Dobrez, D., Gerber, S., Budetti, P. (2006), ‘Trends in Perinatal Regionalisation and the Role of Managed Care’, Obstetrics and Gynecology, 108, 839-845.
Doyle, L. (2004), ‘Changing availability of neonatal intensive care for extremely low birthweight infants in Victoria over two decades’, Medical Journal of Australia, 181:3, 136-139.
Doyle, L. (2004), ‘Evaluation of Neonatal Intensive Care for Extremely Low Birth Weight Infants in Victoria Over Two Decades: II. Efficiency’, Pediatrics, 113:3, 510-514.
Doyle, L. (2006), ‘Evaluation of neonatal intensive care for extremely-low-birth-weight infants’, Seminars in Fetal & Neonatal Medicine, 11, 139-145.
Draper, E.S., et al. (2004),‘The potential impact on costs and staffing of introducing clinical networks and British Association of Perinatal Medicine standards to the delivery of neonatal care’, Archives of Disease in Childhood:Fetal and Neonatal Edition, 89, 236-40.
Fanaroff, A.A., Stoll, B.J., Wright, L.L., et al. (2007), ‘Trends in neonatal morbidity and mortality for very low birthweight infants’, American Journal Obstet Gynecol 196:147.e1-147.e8. 147e2

The provision of neonatal services: international comparisons RAND Europe
142
Finnström, O. et al. (2006), ‘Size of delivery unit and neonatal outcome in Sweden: A catchment area analysis’, Acta Obstetrica Gynecologica Scandinavia, 85:1, 63-67.
Gerber, S., Dobrez, D., Budetti, P. (2001), ‘Managed care and perinatal regionalisation in Washington State’, Obstetrics and Gynecology, 98, 139-43.
Gilbert, W.M., Nesbitt, T.S., and Danielsen, B. (2003), ‘The cost of prematurity: quantification by gestational age and birthweight’, Obstetrics and Gynecology, 102:3, 488 – 492.
Goodman, D. et al. (2002), ‘The relation between the availability of neonatal intensive care and neonatal mortality’, New England Journal of Medicine, 346:20, 1538-1544.
Gould, J., Marks, A., Chavez, G. (2002), ‘Expansion of Community-Based Perinatal Care in California’, Journal of Perinatology, 22, 630-640.
Gunnarsson, B. et al. (2007), ‘Ambulance Transport and Services in the Rural Areas of Iceland, Scotland and Sweden’, Journal of Emergency Primary Health Care, 5:1, 1447-4999.
Hack, M., Costello, D. W. (2007), ‘Decrease in frequency of cerebral palsy in preterm infants’, The Lancet, 369:9555, 7-9.
Hansard, (2007), ‘House of Commons Written Answers for 31 January 2007, Col.354w’, HMSO.
Hanson, R., et al. (1998), ‘The true cost of treating children’, Medical Journal of Australia, 169:5, 1192-1202.
Health Council of the Netherlands (2000), Perinatal intensive care, The Hague: Health Council of the Netherlands. Available at: http://www.gr.nl/pdf.php?ID=26
Hein, H. (1999), ‘Regionalisation of Perinatal Health Care: A lesson learned but lost’, Journal of Perinatology, 19:8, 584-588.
Hein, H. (2004), ‘Regionalised perinatal care in North America’, Seminars in Neonatology, 9, 111-116.
Hellström-Westas L, Hanséus K, Jögi P, Lundström NR. (2001), ‘Long-distance transports of newborn infants with congenital heart disease’, Paediatric Cardiology, 22:5, 380-384.
Himmelmann, K., Hagberg, G., Beckung, E., Hagberg, B. Uvebrant., P. (2005), ‘The changing panorama of cerebral palsy in Sweden. IX. Prevalence and origin in the birth-year period 1995-1998’, Acta Paediatrica, 94:3, 287-294.
Himmelman, K. (2006), Cerebral palsy in Western Sweden. Epidemiology and function, The Sahlgrenska Academy at Göteborg University Thesis 2006. Available at: https://gupea.ub.gu.se/dspace/bitstream/2077/753/1/Ram%20Cerebral%20pals

RAND Europe References
143
y%20in%20western%20Sweden%20%20epidemiology%20and%20function.pdf
Horbar, J., Badger, G., Carpenter, J. (2002), ‘Trends in Mortality and Morbidity for Very Low Birth Weight Infants, 1991-1999’, Pediatrics, 110, 143-151.
Illinois Code of Regulations, Title 77: Public Health, Chapter I: Department Of Public Health, Subchapter L: Maternal And Childcare, Part 640 Regionalised Perinatal Health Care Code, Section 640.80 Regional Perinatal Networks – Composition And Funding.
Interview with H. Lagercrantz by Norman Swan, 2003. Available at: http://www.abc.net.au/rn/talks/8.30/helthrpt/stories/s797463.htm
ISD Scotland National Statistics (2006), ‘All births by term and birthweight’. Available in http://www.isdscotland.org/isd/files/mat_bb_table7.xls (ed.), Excel.
Johansson, S., Montgomery, S.M., Ekbom, A., Otterblad Olausson, P., Granath, F., Norman, M., Cnattingius, S. (2004), ‘Preterm delivery, level of care, and infant death in Sweden: a population-based study’, Pediatrics, 113:5, 1230-1235.
Johnston, L., Trajanovska, M. (2006), Australian Neonatal Workforce Report. Available at: http://www.acnn.org.au/files/WhatsNew/Workforcereportfinal2.doc
Joint Commission on Accreditation of Health Organisations (2002), Health Care at the Crossroads: Strategies for Addressing the Evolving Nursing Crisis, p.5.
Jonsson, E., Banta, H.D. (1995), ‘Health care technology in Sweden’ In: Banta, H.D., Gelband, H., Battista, R.N., Jonsson, E. (eds), Health care technology and its assessment in eight countries. U.S. Congress. Office of Technology Assessment, OTA-BP-H-140. Washington, DC: U.S. Government Printing Office.
Karolinska Institute (2007), Neonatal Clinical Unit. Available at: http://ki.se/ki/jsp/polopoly.jsp?d=10744&l=en
Kateman, H., Herschderfer, K. (2005), Multidisciplinary Collaborative Primary Maternity Care Project Current Practice in Europe and Australia. A descriptive study. Available at: http://www.mcp2.ca/english/documents/IntlReptFinal9Jul05.pdf
Khoshnood, B., et al. (1996), ‘Models for determining cost of care and length of stay in neonatal intensive care units’, International Journal of Technology Assessment in Health Care, 12:1, 62-71.
Laing, I., et al. (2004), Designing a Neonatal Unit: Report for the British Association of Perinatal Medicine, British Association of Perinatal Medicine.
The provision of neonatal services: international comparisons RAND Europe
144
Larsson, B.A.., Gradin, M.., Lind, V., Selander, B. (2002), ‘Swedish guidelines for prevention and treatment of pain in the newborn infant’, Läkartidningen, 25:99(17), 1946-9.
Lee, S., et al. (2000), ‘Variations in Practice and Outcomes in the Canadian NICU Network: 1996-1997’, Pediatrics, 106, 1070-1079.
Lewitt, E., et al. (1995), ‘The direct cost of low birth eight’, Future Child, 5:1, 35-36. Cited in Richardson, D., et al. (2001).
Lui, K., et al. (2006), ‘Improved Outcomes of Extremely Premature Outborn Infants: Effects of Strategic Changes in Perinatal and Retrieval Services’, Pediatrics, 118:5, 2076-2083.
Lupton, B., Pendray, M. (2004), ‘Regionalised neonatal emergency transport’, Seminars in Neonatology, 9, 125-133.
Macfarlane, A. (2007), ‘Personal communication on collecting cross-national data’.
March of Dimes Birth Defects Foundation (1993), Toward Improving the Outcome of Pregnancy: The 90s and Beyond.
March of Dimes National Foundation (1976), Toward Improving the Outcome of Pregnancy: Recommendations for the Regional Development of Maternal and Perinatal Services.
Marlow, N., and Bryan Gill, A. (2007), ‘Establishing neonatal networks: the reality’, Archives of Disease in Childhood, 92:2, 137-142.
Mathews, T.J., MacDorman, M.F. (2007), ‘Infant mortality statistics from the 2004 period linked birth/infant death data set’, National vital statistics report, 55:14. Hyattsville, MD: National Center for Health Statistics.
McCall, E., et al. (2007), Eighth Annual Report on Very Low Birth Weight Infants born in Northern Ireland in 2005, (Neonatal Intensive Care Outcomes, Research and Evaluations Group).
MCOL (2006), Managed Care National Statistics. Available at: http://www.mcareol.com/factshts/factnati.htm
Mehta, S., et al. (2000), ‘Differential Markers for Regionalisation’, Journal of Perinatology, 20, 366-372.
National Association of Neonatal Nurses (1999), Position Statement No.3009, Minimum Staffing Levels in NICUs. Available at: http://www.nann.org/files/public/3009.doc
National Board of Health and Welfare (2002), Sweden’s health care report. Available at: http://www.socialstyrelsen.se/NR/rdonlyres/748038A0-1F85-46A1-B314-0ADD2D003B4B/1408/20021113.PDF
National Center for Health Statistics (2006), National Vital Statistics Reports, 55: 1.
RAND Europe References
145
National Community Child Health Database (NCCHD): Births in Wales 2005. Available at: http://new.wales.gov.uk/topics/statistics/headlines/health-2007/hdw20070614/?lang=en
National Health Services Scotland (2005), Scottish Perinatal and Infant Mortality and Morbidity Report, (Edinburgh). Available at: http://www.isdscotland.org/isd/3109.html
National Health Services Scotland (2006), Neonatal Transport Service Annual Report 2004- 2005.
National Statistics (2006), Health Statistics Quarterly 32: Winter 2006. Available at: http://www.statistics.gov.uk/downloads/theme_health/HSQ32.pdf.
Neonatal Emergency Transport Service of Victoria (2007), Clinical Report June 2002- July 2006. Available at: http://www.wch.org.au/emplibrary/nets/Final_NETSReport_2002-06_v10_singlePage.pdf
Neonatal Transport Service (2005), Annual Report 2004-2005 (NHS Scotland).
Neonatology Clinical Care Audit Committee (2005), Annual Report to the Public on Activities undertaken or overseen by the Neonatology Clinical Care Audit Committee. Available at: http://www.pmh.health.wa.gov.au/general/about_us/documents/6057.pdf
New York State Health Department Regulations 721.6(a)-(c). Available at: http://w3.health.state.ny.us/dbspace/propregs.nsf/4ac9558781006774852569bd00512fda/832aa8a4b2a0ca9c85256ff10060eeba?OpenDocument
Nordstrom L. (2005), Quality improvement in perinatal care. Available at: http://www.kbh.uu.se/pdf/Quiip/Surveillance.pdf
Office of National Statistics, Preterm births for 2005. Available at: http://www.statistics.gov.uk/StatBase/Product.asp?vlnk=14882&More=Y
Office of National Statistics (2006), Births & Deaths Summary: Vital statistics for Wales, 1991-2005.
Office of National Statistics (2006), Live births, stillbirths and infant deaths, 1975-2005. Available at: http://www.statistics.gov.uk/STATBASE/Expodata/Spreadsheets/D9405.xls. Accessed 13th August 2007.
Office of National Statistics (2006), Birth Statistics, Series FM1 no. 27-34.
Office of National Statistics (2006), Health Statistics Quarterly 32: Winter 2006; Office of National Statistics (2002), Health Statistics Quarterly 16: Winter 2002; Office of National Statistics (2001), Health Statistics Quarterly 12: Winter 2001.

The provision of neonatal services: international comparisons RAND Europe
146
Oh, W., Gilstrap, L., eds. (2002), Guidelines for Perinatal Care. 5th edition. Elk Grove Village, IL: American Academy of Pediatrics, American College of Obstetricians and Gynecologists.
Organisation for Economic Cooperation and Development (2007), World Health Statistics 2005.
Parmanum, J., et al. (2000), ‘National Census of Availability of Neonatal Intensive Care’, BMJ, 321:7263, 727-29.
Pearson, G., et al. (1997), ‘Should paediatric intensive care be centralised? Trent versus Victoria’, Lancet, 349, 1213-1217.
Perinatal Partnership Program of Eastern and Southeastern Ontario (2006), Annual Perinatal Statistical Report 2005-06.
Perinatal Partnership Program of Eastern & Southeastern Ontario (2007), Perinatal Newsletter 24:1.
Petrou, S., et al. (2003), ‘The impact of preterm birth on hospital inpatient admissions and costs during the first five years of life’, Pediatrics, 112:6, 1290 – 97.
Phibbs, C., et al. (2007), ‘Level and Volume of Neonatal Intensive Care and Mortality in Very-Low-Birth-Weight Infants’, New England Journal of Medicine, 256:21, 2165-75.
Platt, M.J., et al. (2007), ‘Trends in cerebral palsy among infants of very low birthweight (<1500 g) or born prematurely (<32 weeks) in 16 European centres: a database study’, Lancet, 369:9555, 43-50.
Provincial Perinatal Surveillance System Committee (2007), Ontario Provincial Perinatal Report 2006.
Public Health Agency of Canada (2000), The Family-Centred Maternity and Newborn Care: National Guidelines, 4th edition. Available at: http://www.phac-aspc.gc.ca/dca-dea/prenatal/fcmc1_e.html
Rashid, A., Bhuta, T., Berry, A. (1999), ‘A regionalised transport service, the way ahead?’, Arch Dis Child, 80, 488-492.
Redshaw, M., and Hamilton, K. (2005), A Survey of Current Neonatal Unit Organisation and Policy, Oxford: National Perinatal Epidemiology Unit.
Richardson, D., et al. (1998), ‘Declining Severity Adjusted Mortality: Evidence of Improving Neonatal Intensive Care’, Pediatrics, 102:4, 893-399.
Richardson, D.K, et al. (2001), ‘A critical review of cost reduction in neonatal intensive care. I. The structure of costs’, Journal of Perinatology, 21:2, 107 - 115.
RAND Europe References
147
Ringborg, A., Berg, J., Norman, M., Westgren, M., Jonsson, B. (2006), ‘Preterm birth in Sweden: What are the average lengths of hospital stay and the associated inpatient costs?’, Acta Paediatrica, 95:12, 1550–1555.
Rogowski, J. (1999), ‘Measuring the cost of neonatal and perinatal care’, Paediatrics, 103:1, 329-335.
Rogowski, J., Staiger, D., and Horbar, J. (2004), ‘Variations In The Quality Of Care For Very-Low-Birthweight Infants: Implications For Policy’, Health Affairs, 23:5, 88-97.
Sankaran, K., et al. (2002), ‘Variations in mortality rates among Canadian neonatal intensive care units’, Canadian Medical Association Journal, 166:2, 173-178.
SBU., SBU Alert – Early assessment of new health technologies. Newborn Individualized Developmental Care and Assessment Program – NIDCAP. SBU Alert Report No. 2006-03.
Schollin, J. (2005), ‘Views on neonatal care of newborns weighing less than 500 grams’, Acta Paediatrica, 94:2, 140-142.
Scottish Executive Health Department (2001), A Framework for Maternity Services in Scotland.
Shaffer, E. (2001), State Policies and Regional Neonatal Care: Progress and Challenges 25 Years After TIOP, March of Dimes Foundation.
Skeoch, C.H., et al. (2007), ‘Fit to fly: practical challenges in neonatal transfers by air’, Archives of Disease in Childhood, 90, 456–460.
Smith, S.L. and Hall, M.A. (2003), ‘Developing a neonatal workforce: role evaluation and retention of advanced neonatal nurse practitioners’, Archives of Disease in Childhood, 88, 426-429.
STAKES National Research and Development Centre for Welfare and Health, Perinatal statistics in the Nordic countries. Statistical Summary 28/2005, 1 November 2005. Available at: http://www.stakes.fi/NR/rdonlyres/BDE35D36-E9BF-4CF6-9363-197B758BC512/0/0528taulut.pdf
Stark, A. (2004), ‘Policy Statement: Committee on Fetus and Newborn: Levels of Neonatal Care’, Pediatrics, 114:5, 1341-1347.
Statistics Canada, Canadian Vital Statistics, Birth Database. Available at: http;//www.statcan.ca
St. John, E. (2000), ‘Cost of neonatal care according to gestation age at birth and survival status’, American Journal of Obstetrics and Gynecology, 182:1, 170-175.
Swedish National Board of Health and Welfare (2006), This is the National Board of Health and Welfare. Available at: http://www.socialstyrelsen.se/NR/rdonlyres/067C1106-7FD6-4194-B923-D40E0B257191/6817/200611813.pdf

The provision of neonatal services: international comparisons RAND Europe
148
Swedish National Board of Health and Welfare, Welcome to the Centre for Epidemiology. Available at: http://www.sos.se/epc/epceng.htm#epid
Synnes, A., et al. (2006), ‘Neonatal Intensive Care Unit Characteristics Affect the Incidence of Severe Intraventricular Hemorrhage’, Medical Care, 44:8, 754-759.
Tennessee Department of Health (2004), Tennessee Perinatal Care System: Guidelines for Regionalisation, Hospital Care Levels, Staffing and Facilities, 5th edition.
Thompson, L., Goodman, D., Little, G. (2002), ‘Is more neonatal care always better? Insights from a cross-national comparison of reproductive care’, Pediatrics, 109, 1036-1043.
Tubman, R. (2006), ‘Position Paper on Specialist Neonatal Services in Northern Ireland’. Available at: http://www.dhsspsni.gov.uk/print/neonatalservicesinni.pdf
Tudehope, D.I., et al. (1989), ‘Cost analysis of neonatal intensive and special care’, Australian Paediatric Journal, 25:2, 61-65.
Turrill, S. (2000), 'Is access to a standardized neonatal intensive care possible?', Journal of Nursing Management, 8, 49-56.
U.S. Department of Health and Human Services (2000), Healthy People: 2010 Conference edition. Washington (DC).
Victoria Government Department of Human Services (2005), Neonatal Services Guidelines: Defining Levels of Care in Victorian Hospitals.
Victoria Government Department Of Human Services (2006), Expressions Of Interest For Appointment To The Neonatal Services Advisory Committee (NSAC): Guidelines And Information For Applicants.
Victoria Government Department of Human Services (2007), Public hospitals and mental health services: Policy and funding guidelines 2007-08. Available at: http://www.health.vic.gov.au/neonatal/perform.htm
Vincer, M., et al. (2006), ‘Increasing Prevalence of Cerebral Palsy Among Very Preterm Infants: A Population-Based Study’, Pediatrics, 118, 1621-1626.
Wallin, L., et al. (2000), ‘National Guidelines for Swedish Neonatal Nursing Care: evaluation of clinical application’, International Journal for Quality in Health Care, 12:6, 465-474.
Welsh Assembly (2005), All Wales Standards for Neonatal Services, Children and Young People's Specialised Services Project (CYPSS).
Westrup, B., Kleberg, A., von Eichwald, K., Stjernqvist, K., Lagercrantz, H. (2000), ‘A randomized controlled trial to evaluate the effects of NIDCAP (Newborn
RAND Europe References
149
Individualized Developmental Care and Assessment Program) in a Swedish setting’, Paediatrics, 105, 66-72.
Wilson-Costello, D., Friedman, H., Nori Minich, M., et al. (2007), ‘Improved Neurodevelopmental Outcomes for Extremely Low Birth Weight Infants in 2000–2002’, Pediatrics, 119:1, 37-45.
Woodward, G., et al. (2002), ‘The state of pediatric interfacility transport: Consensus of the Second National Paediatric and Neonatal Interfacility Transport Medicine Leadership Conference’, Pediatric Emergency Care, 18:1, 38-43.
Yu, V., Dunn, P. (2004), ‘Development of regionalised perinatal care’, Seminars in Neonatology, 9:2, 89-97.


151
APPENDICES

152
Appendix A: Methodology
Obtaining data and information
Published Literature Search Strategy The NAO detailed seven areas in their Request for Proposals (RfP) to be covered by the international literature review. Early groundwork and general reading around the topics allowed us to aggregate some of these areas to produce five domains of interest. These are:
1. Statistics on trends in preterm and low birthweight babies; trends in outcomes including mortality and co-morbidities such as cerebral palsy, blindness and learning difficulties.
2. Organisation and scale of provision of neonatal services; commissioning of neonatal services.
3. Transport services.
4. Costs of neonatal services.
5. Best practices in care for babies and their parents.
We used these domains to draw up a set of five data extraction templates to guide our research process, and submitted these to the NAO for comments and feedback. After approval, the main research task was to complete one set of templates for each country investigated. We also used these domains to form the basis of our list of search terms for a comprehensive literature survey, supplemented by initial reading around each topic.
These search terms were generated by identifying key words relating to each of the topics, and combining them logically to maximise coverage of the topic. For example, we identified the word “unit” as being important and therefore we ran searches on the phrases “neonatal units”, “perinatal units”, and “birth units”, amongst others. The complete list of search terms utilised is provided in Appendix I.
We then systematically inputted all the search terms to three online databases: PubMed (www.ncbi.nlm.nih.gov/entrez/), Medline (http://medline.cos.com/) and Highwire (http://highwire.stanford.edu/). These are widely-used databases that are accepted as a solid foundation for a literature search in the field of health and medicine. We limited our search to articles in English published from 1999 onwards. Our approach was to aim for comprehensiveness, and therefore we accepted the fact that closely-related search terms
RAND Europe Appendix A: Methodology
153
(such as “neonatal health” and “neonatal health outcomes”) would produce some overlaps in their search results. However, we did include articles that appeared to present substantive contributions to issues surrounding neonatal care, even though they were mainly concerned with countries not included in our study
We trawled the search results to identify articles that may have relevance to the current study. As noted above, we wished our search to be comprehensive, and therefore our default position was to retain, rather than discard, any articles of uncertain relevance. The basic principles for assessing whether an article should be retained are given below:
1. We discarded articles concerned with a topic unrelated to human neonatal care. (e.g. “neonatal transfer” in Medline generates the article Mitchell, et al. (2007), ‘Effects of cobalt/vitamin B(12) status in ewes on ovum development and lamb viability at birth’, Reproduction, fertility, and development, 19:4, 553-62).
2. We discarded articles concerned with a specific element of neonatal science or practice that was not related to the aim of the NAO study (e.g. Clark and Reid (2003), ‘The potential of recombinant surfactant protein D therapy to reduce inflammation in neonatal chronic lung disease, cystic fibrosis, and emphysema’, Archives of Disease in Childhood, 88, 981-984).
3. We discarded articles that were specific to countries not included in our study (e.g. Trotman (2006), ‘The neonatal intensive care unit at the University Hospital of the West Indies: The first few years' experience’, The West Indian Medical Journal, 55:2, 77-79). However, as stated above, we retained articles that offered a broad understanding of the field even if concerned with a country outside our focus (e.g. Mullane, et al. (2004), ‘Neonatal transportation: the effects of a national neonatal transportation system’, Irish Journal of Medical Science, 173:2, 105-8). In addition, we retained comparative studies of neonatal systems, since they were likely to offer methodological insights which could be applied to our study.
Following the initial triage of papers and contact with the field experts (see below), we were able to further filter our search results by reading the abstract for each paper and selecting papers by relevance.
Overall, our initial search produced approximately 1,200 articles; after the filtering, 112 were retrieved to obtain the study information
Expert consultations In addition to web-based literature searches, we also contacted leading neonatologists and neonatal services experts in the UK to discuss other sources of data, and whether they felt our search terms and data extraction templates covered the key issues. In addition, we contacted government officials or practitioners in our effort to supplement any missing data and information. The following experts, researchers and practitioners (in alphabetical order) were contacted and provided useful information and valuable help:
• Dr Phil Booth (Aberdeen Maternity Hospital)
• Dr Jim Chalmers (ISD Scotland)
• Dr Liz Draper (University of Leicester)
The provision of neonatal services: international comparisons RAND Europe
154
• Dr Andy Leslie (National Perinatology Epidemiology Unit; Nottingham City Hospital)
• Dr Andrew Lyon (Edinburgh Royal Infirmary)
• Professor Alison Macfarlane (City University)
• Professor Neil Marlow (University of Nottingham)
• Dr Gopi Menon (Edinburgh Royal Infirmary)
• Dr James Moorcraft (Royal Glamorgan Hospital)
• Dr Liz Reaney (Department of Health, Social Services and Public Safety, Northern Ireland)
• Dr Maggie Redshaw (National Perinatology Epidemiology Unit)
• Dr Ben Stenson (Director of Neonatal Transport Networks, Scotland; Consultant Neonatologist, New Royal Infirmary of Edinburgh at Little France)
• Dr Richard Tubman (Chair, Neonatal Services Working Group NI; Consultant Neonatologist, Royal Jubilee Maternity Hospital)
• Dr Janet Tucker (University of Aberdeen)
Locating “grey” literature and country-specific reports Although medical databases are an extremely important source of data for literature reviews, they frequently do not store information available in reports produced by professional associations, neonatal networks, and government agencies and departments. This so-called “grey” information is often very useful, particularly with regard to supplying data for trend analyses. Since the majority of such information was gleaned from sources related to individual countries, this section is divided into country-specific sub-sections.
United States of America The main source of information for U.S. specific data was the Vital Statistics System, part of the National Center for Health Statistics.514 The National Vital Statistics Reports, produced by the Center, supply annual information on preterm and low birth weight births, neonatal and infant mortality, and associated morbidities.515 High-level information on infant mortality (and the wider health context of the U.S.) was supplied by the annual Health in the USA report, also produced by the Center.516
In order to discover information about guidelines, best practices and positions taken by associations, we looked for information from the following organisations:
• The American Academy of Paediatrics (in particular, their published guidelines and standards)
514 http://www.cdc.gov/nchs/nvss.htm
515 http://www.cdc.gov/nchs/products/pubs/pubd/nvsr/nvsr.htm
516 http://www.cdc.gov/nchs/hus.htm
RAND Europe Appendix A: Methodology
155
• The National Association of Neonatal Nurses (in particular, their position papers)
• National Institute of Child Health and Human Development
• National Association of Paediatric Nurse Practitioners
• American College of Nurse-Midwives
• National Association of Paediatric Nurse Practitioners
• Foundation for Neonatal Research and Education
• The Institute of Medicine (in particular, its report Preterm Births: Causes, Consequences (2007))
• The March of Dimes Foundation
Canada The main information source for Canadian data was the Canadian Institute of Health Information.517 The Institute, in collaboration with Statistics Canada, provided trend data on preterm and low birthweight births and infant mortality.518 The Institute’s report series called ‘Giving Birth in Canada’ provided a wealth of information on neonatal providers, regional variations, and the cost of neonatal care. We also gathered more general information on Canadian hospital care costs from the Institute’s website.519
Another source of valuable information was the Canadian Neonatal Network, in particular their Annual Report for 2005.
In order to discover information about guidelines, best practices and positions taken by associations, we looked for information from the following organisations:
• The Canadian Paediatric Society and its journal, Paediatrics and Child Health.
• Canadian Nurses Association
• Health Canada
Australia The main source of information in Australia was the Australian Institute of Health and Welfare, in particular its National Perinatal Statistics Unit.520 521 This Unit produces a detailed annual report called Australia’s Mothers and Babies, which provides information
517 http://secure.cihi.ca/cihiweb/splash.html
518 http://secure.cihi.ca/cihiweb/splash.html
519 For example: Canadian Institute of Health Information (2004), Hospital Trends in Canada: Results of a Project to Create a Historical Series of Statistical and Financial Data for Canadian Hospitals Over Twenty-Seven Years; Pink and Johnson (2001), The Financial Management of Acute Care in Canada: A Review of Funding, Performance Monitoring and Financial Reporting Practices.
520 www.aihw.gov.au
521 http://www.npsu.unsw.edu.au/

The provision of neonatal services: international comparisons RAND Europe
156
on preterm and low birth weight births, neonatal infant mortality and morbidity, and NICU admissions data. A complete set of reports is available from 1994 to 2004. The Australian and New Zealand Neonatal Network contributes information to these reports, and also produces its own annual reports. The AIHW Perinatal Unit also provides information on the Australian Perinatal National Minimum Dataset and the issues surrounding the Australian Birth Anomalies reporting system.
In addition, the New South Wales Health Agency produces an annual New South Wales Mothers and Babies Report.
In order to discover information about guidelines, best practices and positions taken by associations, we looked for information from the following organisations:
• The Australian Neonatal Nurses Association
• The Victoria Government (in particular its Neonatal Services guidelines)
• The Perinatal Society of Australia and New Zealand
• Cochrane Reviews on neonatology:
• http://www.nichd.nih.gov/cochrane/
• World Health Organisation e-Library OPAC
• http://dosei.who.int/uhtbin/cgisirsi/rIgW11n779/0/49
• Council of International Neonatal Nurses
• European Society of Paediatric and Neonatal Intensive Care
Sweden Similar activities are followed for obtaining statistical and other relevant benchmarking data from Sweden.
List of search terms used for literature review
Statistics on trends in preterm and low weight babies Trends Preterm
Trends Low birth weight
Trends gestation
Trends gestation period
Trends premature
Trends prematurity
Figures preterm
Figures low birth weight
Figures gestation
Increase Preterm
Increase Low birth weight
Increase gestation
Increase gestation period
Increase premature
Increase prematurity
Decrease Preterm
Decrease Low birth weight
Decrease gestation

RAND Europe Appendix A: Methodology
157
Figures gestation period
Figures premature
Figures prematurity
Decrease gestation period
Decrease premature
Decrease prematurity
Organisation and scale of provision of neonatal services Neonatal networks
Neonatal care
Neonatal units
Neonatal centers
Neonatal centres
Neonatal services
Perinatal networks
Perinatal care
Perinatal units
Perinatal centres
Perinatal centers
Perinatal services
Birth units
Birth centers
Birth centres
Birth services
Organisation neonatal
Organisation perinatal
Organisation birth
Organisation neonatal care
Organisation perinatal care
Organisation neonatal
Organisation perinatal
Organisation birth
Organisation neonatal care
Organisation perinatal care
Organisation neonatal networks
Regionalisation perinatal
Facilities neonatal
Facilities perinatal
Facilities neonatal care
Facilities perinatal care
Neonatal speciality
Neonatal subspeciality
Perinatal speciality
Perinatal subspeciality
Governance neonatal
Governance perinatal
Governance neonatal care
Governance perinatal care
Governance neonatal networks
Governance perinatal networks
Management neonatal
Management perinatal
Management neonatal care
Management perinatal care
Management neonatal networks
Management perinatal networks
Funding neonatal
Funding perinatal
Funding neonatal networks
Funding perinatal networks
Funding neonatal care
Funding perinatal care
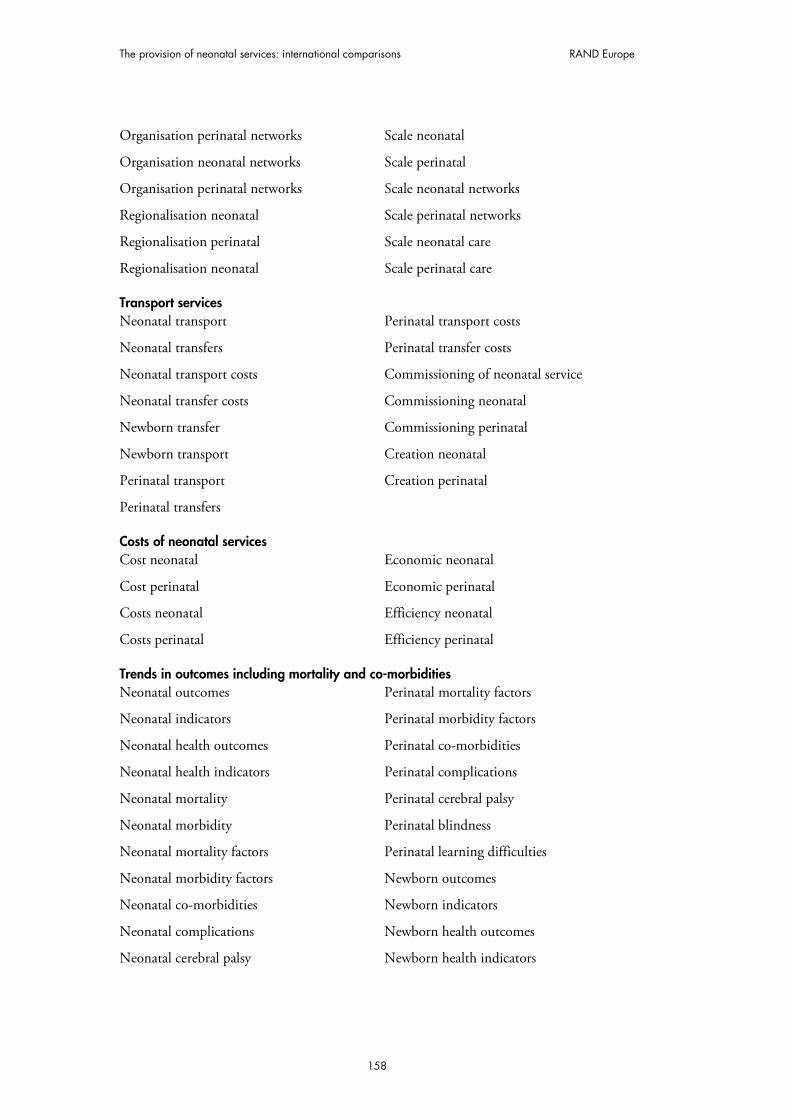
The provision of neonatal services: international comparisons RAND Europe
158
Organisation perinatal networks
Organisation neonatal networks
Organisation perinatal networks
Regionalisation neonatal
Regionalisation perinatal
Regionalisation neonatal
Scale neonatal
Scale perinatal
Scale neonatal networks
Scale perinatal networks
Scale neonatal care
Scale perinatal care
Transport services Neonatal transport
Neonatal transfers
Neonatal transport costs
Neonatal transfer costs
Newborn transfer
Newborn transport
Perinatal transport
Perinatal transfers
Perinatal transport costs
Perinatal transfer costs
Commissioning of neonatal service
Commissioning neonatal
Commissioning perinatal
Creation neonatal
Creation perinatal
Costs of neonatal services Cost neonatal
Cost perinatal
Costs neonatal
Costs perinatal
Economic neonatal
Economic perinatal
Efficiency neonatal
Efficiency perinatal
Trends in outcomes including mortality and co-morbidities Neonatal outcomes
Neonatal indicators
Neonatal health outcomes
Neonatal health indicators
Neonatal mortality
Neonatal morbidity
Neonatal mortality factors
Neonatal morbidity factors
Neonatal co-morbidities
Neonatal complications
Neonatal cerebral palsy
Perinatal mortality factors
Perinatal morbidity factors
Perinatal co-morbidities
Perinatal complications
Perinatal cerebral palsy
Perinatal blindness
Perinatal learning difficulties
Newborn outcomes
Newborn indicators
Newborn health outcomes
Newborn health indicators

RAND Europe Appendix A: Methodology
159
Neonatal blindness
Neonatal retinopathy
Neonatal learning difficulties
Perinatal outcomes
Perinatal indicators
Perinatal health outcomes
Perinatal health indicators
Perinatal mortality
Perinatal morbidity
Newborn mortality
Newborn morbidity
Newborn mortality factors
Newborn morbidity factors
Newborn co-morbidities
Newborn complications
Newborn cerebral palsy
Newborn blindness
Newborn learning difficulties
Best practices in care for babies and their parents Neonatal best practice
Neonatal guidelines
Neonatal standards
Neonatal levels of care
Perinatal best practice
Perinatal guidelines
Perinatal standards
Perinatal levels of care
Newborn best practice
Newborn guidelines
Newborn standards
Newborn levels of care


161


