The Prudential Series Fund SEMIANNUAL REPORT June 30, 2017 Based on the variable contract you own or the portfolios you invested in, you may receive additional reports that provide financial information on those investment choices. Please refer to your variable annuity or variable life insurance contract prospectus to determine which portfolios are available to you. The views expressed in this report and information about the Fund’s portfolio holdings are for the period covered by this report and are subject to change thereafter. The accompanying financial statements as of June 30, 2017, were not audited and, accordingly, no auditor’s opinion is expressed on them. Please note that this document may include prospectus supplements that are separate from and not a part of this report. Please refer to your variable annuity or variable life insurance contract prospectus to determine which supplements are applicable to you. Jennison Portfolio — Class II Shares
Transcript
The Prudential Series Fund
SEMIANNUAL REPORT June 30, 2017
Based on the variable contract you own or the portfolios you invested in, you mayreceive additional reports that provide financial information on those investmentchoices. Please refer to your variable annuity or variable life insurance contractprospectus to determine which portfolios are available to you.
The views expressed in this report and information about the Fund’s portfolio holdingsare for the period covered by this report and are subject to change thereafter.
The accompanying financial statements as of June 30, 2017, were not audited and,accordingly, no auditor’s opinion is expressed on them.
Please note that this document may include prospectus supplements that areseparate from and not a part of this report. Please refer to your variable annuity orvariable life insurance contract prospectus to determine which supplements areapplicable to you.
Jennison Portfolio — Class II Shares
Investors should carefully consider the contract and the underlying portfolios’ investment objectives, risks, and charges andexpenses before investing. The contract prospectus and the underlying portfolio prospectuses contain information on theinvestment objectives, risks, and charges and expenses, as well as other important information. Read them carefully beforeinvesting or sending money.
The Prudential Series Fund may offer two classes of shares in each Portfolio: Class I and Class II. Class I shares are sold onlyto separate accounts of The Prudential Insurance Company of America, Pruco Life Insurance Company, and Pruco LifeInsurance Company of New Jersey (collectively, Prudential) and to separate accounts of insurance companies not affiliatedwith Prudential where Prudential has assumed responsibility for the administration of contracts issued through such non-affiliated insurance companies, as investment options under variable life insurance and variable annuity contracts (theContracts). (A separate account keeps the assets supporting certain insurance contracts separate from the general assetsand liabilities of the insurance company.) Class II shares are offered only to separate accounts of non-Prudential insurancecompanies for the same types of Contracts.
The Fund files with the Commission a complete listing of portfolio holdings as of its first and third quarter-end calendar on FormN-Q. Form N-Q is available on the Commission’s website at www.sec.gov or by visiting the Commission’s Public ReferenceRoom. For more information on the Commission’s Public Reference Room, please visit the Commission’s website or call(800)SEC-0330. Form N-Q is also available on the Fund’s website at www.prudential.com/variableinsuranceportfolios or bycalling the telephone numbers referenced above, for variable annuity and variable life insurance contract owners.
The Fund’s Statement of Additional Information contains additional information about the Fund’s Trustees and is availablewithout charge upon request by calling (888)778-2888.
The Prudential Series FundTable of Contents
Semiannual Report June 30, 2017
� L E T T E R T O C O N T R A C T O W N E R S
� P R E S E N T A T I O N O F P O R T F O L I O H O L D I N G S
� F E E S A N D E X P E N S E S
� F I N A N C I A L R E P O R T S
Section A Schedule of Investments and Financial StatementsSection B Notes to Financial StatementsSection C Financial Highlights
� A P P R O V A L O F A D V I S O R Y A G R E E M E N T S
[THIS PAGE INTENTIONALLY LEFT BLANK]
The Prudential Series FundLetter to Contract Owners
Semiannual Report June 30, 2017
� D E A R C O N T R A C T O W N E R
At Prudential, our primary objective is to help investors achieve and maintain long-term financial success. This Prudential SeriesFund semiannual report outlines our efforts to achieve this goal. We hope you find it informative and useful.
Prudential has been building on a heritage of success for more than 135 years. We believe the array of our products provides ahighly attractive value proposition to clients like you who are focused on financial security.
Your financial professional is the best resource to help you make the most informed investment decisions. Together, you canbuild a diversified investment portfolio that aligns with your long-term financial goals. Please keep in mind that diversificationand asset allocation strategies do not assure a profit or protect against loss in declining markets.
Thank you for selecting Prudential as one of your financial partners. We value your trust and appreciate the opportunity to helpyou achieve financial security.
Sincerely,
Timothy S. CroninPresident,The Prudential Series Fund July 31, 2017
The Prudential Series FundPresentation of Portfolio Holdings — unaudited
June 30, 2017
Jennison
Five Largest Holdings (% of Net Assets)
Apple, Inc. 5.9%
Amazon.com, Inc. 5.0%
Facebook, Inc. 4.5%
Alibaba Group Holding Ltd.(China) 4.0%
Microsoft Corp. 3.7%
For a complete list of holdings, please refer to the Schedule of Investments section of this report. Holdings reflect only long-terminvestments. Holdings/Issues/Industries/Sectors are subject to change.
The Prudential Series FundFees and Expenses — unaudited
June 30, 2017
As a contract owner investing in a Portfolio of the Fund through a variable annuity or variable life contract, you incur ongoing costs,including management fees, and other Portfolio expenses. This example is intended to help you understand your ongoing costs (indollars) of investing in the Fund and to compare these costs with the ongoing costs of investing in other investment options. Thisexample does not reflect fees and charges under your variable annuity or variable life contract. If contract charges were included, thecosts shown below would be higher. Please consult the prospectus for your contract for more information about contract feesand charges.
The example is based on an investment of $1,000 invested at the beginning of the period and held for the entire period January 1, 2017through June 30, 2017.
Actual ExpensesThe first line of the table below provides information about actual account values and actual expenses. You may use this information,together with the amount you invested, to estimate the Portfolio expenses that you paid over the period. Simply divide your accountvalue by $1,000 (for example, an $8,600 account value divided by $1,000 = 8.6), then multiply the result by the number in the firstline under the heading entitled “Expenses Paid During the Six-Month Period” to estimate the Portfolio expenses you paid on youraccount during this period. As noted above, the table does not reflect variable contract fees and charges.
Hypothetical Example for Comparison PurposesThe second line of the table below provides information about hypothetical account values and hypothetical expenses based on thePortfolio’s actual expense ratio and an assumed rate of return of 5% per year before expenses, which is not the Portfolio’s actual return.The hypothetical account values and expenses may not be used to estimate the actual ending account balance or expenses you paidfor the period. You may use this information to compare the ongoing costs of investing in the Portfolio and other investment options.To do so, compare this 5% hypothetical example with the 5% hypothetical examples that appear in the shareholder reports of the otherinvestment options.
Please note that the expenses shown in the table are meant to highlight your ongoing Portfolio costs only and do not reflect anycontract fees and charges, such as sales charges (loads), insurance charges or administrative charges. Therefore the second line of thetable is useful to compare ongoing investment option costs only, and will not help you determine the relative total costs of owningdifferent contracts. In addition, if these contract fee and charges were included, your costs would have been higher.
The Prudential Series Fund Portfolio
BeginningAccount Value
January 1, 2017
EndingAccount ValueJune 30, 2017
Annualized ExpenseRatio based on theSix-Month period
Expenses PaidDuring the
Six-Month period*
Jennison (Class I) Actual $1,000.00 $1,175.70 0.63% $3.40
Hypothetical $1,000.00 $1,021.67 0.63% $3.16
Jennison (Class II) Actual $1,000.00 $1,173.30 1.03% $5.55
Hypothetical $1,000.00 $1,019.69 1.03% $5.16
* Portfolio expenses (net of fee waivers or subsidies, if any) for each share class are equal to the annualized expense ratio for eachshare class (provided in the table), multiplied by the average account value over the period, multiplied by the 181 days in the six-month period ended June 30, 2017, and divided by the 365 days in the Portfolio’s fiscal year ending December 31, 2017 (to reflectthe six-month period). Expenses presented in the table include the expenses of any underlying portfolios in which the Portfoliomay invest.
[THIS PAGE INTENTIONALLY LEFT BLANK]
JENNISON PORTFOLIO
SCHEDULE OF INVESTMENTS as of June 30, 2017 (unaudited)
LONG-TERM INVESTMENTS — 100.1%COMMON STOCKS Shares Value
The following abbreviations are used in the semiannual report.
ADR American Depositary ReceiptOTC Over-the-counterLIBOR London Interbank Offered RateREIT Real Estate Investment Trust
* Non-income producing security.
(a) All or a portion of security is on loan. The aggregate market valueof such securities, including those sold and pending settlement, is$128,145,126; cash collateral of $131,052,445 (included inliabilities) was received with which the Portfolio purchased highlyliquid short-term investments.
(b) Represents security purchased with cash collateral received forsecurities on loan and includes dividend reinvestment.
(w) PGIM Investments LLC, the manager of the Portfolio, also serves asmanager of the Prudential Investment Portfolios 2 — PrudentialCore Ultra Short Bond Fund and Prudential Institutional MoneyMarket Fund.
Fair value measurements:
Various inputs are used in determining the value of the Portfolio’s investments. These inputs are summarized in the three broad levels listed below.
Level 1—unadjusted quoted prices generally in active markets for identical securities.Level 2—quoted prices for similar securities, interest rates and yield curves, prepayment speeds, foreign currency exchange rates and other
observable inputs.Level 3—unobservable inputs for securities valued in accordance with Board approved fair valuation procedures.
The following is a summary of the inputs used as of June 30, 2017 in valuing such portfolio securities:
SCHEDULE OF INVESTMENTS as of June 30, 2017 (unaudited)
During the period, there were no transfers between Level 1, Level 2 and Level 3 to report.
Industry classification:
The industry classification of investments and liabilities in excess of other assets shown as a percentage of net assets as of June 30, 2017 were asfollows:
107.8Liabilities in excess of other assets . . . . . . . . . . . . . . . . . . . . . . . (7.8)
100.0%
Financial instruments/transactions — summary of offsetting and netting arrangements:
The Portfolio entered into financial instruments/transactions during the reporting period that are either offset in accordance with current requirementsor are subject to enforceable master netting arrangements or similar agreements that permit offsetting. The information about offsetting and relatednetting arrangements for financial instruments/transactions, where the legal right to set-off exists, is presented in the summary below.
Offsetting of financial instrument/transaction assets and liabilities:
NOTES TO FINANCIAL STATEMENTS OFTHE PRUDENTIAL SERIES FUND
(Unaudited)
1. General
The Prudential Series Fund (“Series Fund”), organized as a Delaware statutory trust, is registered under theInvestment Company Act of 1940, as amended (“1940 Act”), as a diversified open-end management investmentcompany. The Series Fund is composed of seventeen Portfolios (“Portfolios”), each with separate series shares.The information presented in these financial statements pertains to the Jennison Portfolio (the “Portfolio”).
The Portfolio’s investment objective is long-term growth of capital.
2. Accounting Policies
The Series Fund follows investment company accounting and reporting guidance of the Financial AccountingStandards Board (“FASB”) Accounting Standard Codification Topic 946 Financial Services-InvestmentCompanies. The following accounting policies conform to U.S. generally accepted accounting principles. TheSeries Fund and the Portfolios consistently follow such policies in the preparation of their financial statements.
Securities Valuation: The Portfolio holds securities and other assets that are fair valued at the close of eachday (generally, 4:00 PM Eastern time) the New York Stock Exchange (“NYSE”) is open for trading. Fair valueis the price that would be received to sell an asset or paid to transfer a liability in an orderly transactionbetween market participants on the measurement date. The Board of Trustees (the “Board”) has adoptedvaluation procedures for security valuation under which fair valuation responsibilities have been delegated toPGIM Investments LLC (“PGIM Investments” or “the Manager”) (formerly known as Prudential InvestmentsLLC). Under the current valuation procedures, the Valuation Committee is responsible for supervising thevaluation of portfolio securities and other assets. The valuation procedures permit the Portfolio to utilizeindependent pricing vendor services, quotations from market makers, and alternative valuation methods whenmarket quotations are either not readily available or not deemed representative of fair value. A record of theValuation Committee’s actions is subject to the Board’s review, approval, and ratification at its next regularlyscheduled quarterly meeting.
Various inputs determine how each Portfolio’s investments are valued, all of which are categorized accordingto the three broad levels (Level 1, 2, or 3) detailed in the Schedule of Investments.
Common and preferred stocks, exchange-traded funds, and derivative instruments, such as futures oroptions, that are traded on a national securities exchange are valued at the last sale price as of the close oftrading on the applicable exchange where the security principally trades. Securities traded via NASDAQ arevalued at the NASDAQ official closing price. To the extent these securities are valued at the last sale price orNASDAQ official closing price, they are classified as Level 1 in the fair value hierarchy. In the event that nosale or official closing price on valuation date exists, these securities are generally valued at the meanbetween the last reported bid and ask prices, or at the last bid price in the absence of an ask price. Thesesecurities are classified as Level 2 in the fair value hierarchy.
Common and preferred stocks traded on foreign securities exchanges are valued using pricing vendorservices that provide model prices derived using adjustment factors based on information such as localclosing price, relevant general and sector indices, currency fluctuations, depositary receipts, and futures, asapplicable. Securities valued using such model prices are classified as Level 2 in the fair value hierarchy. Themodels generate an evaluated adjustment factor for each security, which is applied to the local closing priceto adjust it for post closing market movements. Utilizing that evaluated adjustment factor, the vendor providesan evaluated price for each security. If the vendor does not provide an evaluated price, securities are valuedin accordance with exchange-traded common and preferred stock valuation policies discussed above.
Investments in open-end, non-exchange-traded mutual funds are valued at their net asset values as of theclose of the NYSE on the date of valuation. These securities are classified as Level 1 in the fair valuehierarchy since they may be purchased or sold at their net asset values on the date of valuation.
Securities and other assets that cannot be priced according to the methods described above are valuedbased on pricing methodologies approved by the Board. In the event that unobservable inputs are used whendetermining such valuations, the securities will be classified as Level 3 in the fair value hierarchy.
B1
When determining the fair value of securities, some of the factors influencing the valuation include: the natureof any restrictions on disposition of the securities; assessment of the general liquidity of the securities; theissuer’s financial condition and the markets in which it does business; the cost of the investment; the size ofthe holding and the capitalization of the issuer; the prices of any recent transactions or bids/offers for suchsecurities or any comparable securities; any available analyst media or other reports or information deemedreliable by the investment adviser regarding the issuer or the markets or industry in which it operates. Usingfair value to price securities may result in a value that is different from a security’s most recent closing priceand from the price used by other mutual funds to calculate their net asset values.
Restricted and Illiquid Securities: Subject to guidelines adopted by the Board, each Portfolio may invest upto 15% of its net assets in illiquid securities, including those which are restricted as to disposition undersecurities law (“restricted securities”). Restricted securities are valued pursuant to the valuation proceduresnoted above. Illiquid securities are those that, because of the absence of a readily available market or due tolegal or contractual restrictions on resale, cannot be sold within seven days in the ordinary course of businessat approximately the amount at which the Portfolio has valued the investment. Therefore, a Portfolio may findit difficult to sell illiquid securities at the time considered most advantageous by its Subadviser and may incurexpenses that would not be incurred in the sale of securities that were freely marketable. Certain securitiesthat would otherwise be considered illiquid because of legal restrictions on resale to the general public maybe traded among qualified institutional buyers under Rule 144A of the Securities Act of 1933. These Rule144A securities, as well as commercial paper that is sold in private placements under Section 4(2) of theSecurities Act, may be deemed liquid by the Portfolio’s Subadviser under the guidelines adopted by the Boardof the Portfolio. However, the liquidity of a Portfolio’s investments in Rule 144A securities could be impaired iftrading does not develop or declines.
Foreign Currency Translation: The books and records of the Portfolios are maintained in U.S. dollars.Foreign currency amounts are translated into U.S. dollars on the following basis:
(i) market value of investment securities, other assets and liabilities — at the current rates of exchange;
(ii) purchases and sales of investment securities, income and expenses — at the rates of exchangeprevailing on the respective dates of such transactions.
Although the net assets of the Portfolio are presented at the foreign exchange rates and market values at theclose of the period, the Portfolio does not generally isolate that portion of the results of operations arising as aresult of changes in the foreign exchange rates from the fluctuations arising from changes in the marketprices of long-term portfolio securities held at the end of the period. Similarly, the Portfolio does not isolate theeffect of changes in foreign exchange rates from the fluctuations arising from changes in the market prices oflong-term portfolio securities sold during the period. Accordingly, holding period realized foreign currencygains (losses) are included in the reported net realized gains (losses) on investment transactions.Notwithstanding the above, the Portfolio does isolate the effect of fluctuations in foreign currency exchangerates when determining the gain (loss) upon the sale or maturity of foreign currency denominated debtobligations; such amounts are included in net realized gains (losses) on foreign currency transactions.
Additionally, net realized gains (losses) on foreign currency transactions represent net foreign exchange gains(losses) from the disposition of holdings of foreign currencies, forward currency contracts, currency gains(losses) realized between the trade and settlement dates on securities transactions, and the differencebetween the amounts of interest, dividends and foreign withholding taxes recorded on the Portfolio’s booksand the U.S. dollar equivalent amounts actually received or paid. Net unrealized currency gains (losses) fromvaluing foreign currency denominated assets and liabilities (other than investments) at period end exchangerates are reflected as a component of net unrealized appreciation (depreciation) on foreign currencies.
Master Netting Arrangements: The Series Fund, on behalf of the Portfolio, is subject to various MasterAgreements, or netting arrangements, with select counterparties. These are agreements which a subadvisermay have negotiated and entered into on behalf of the Portfolio. A master netting arrangement between thePortfolio and the counterparty permits the Portfolio to offset amounts payable by the Portfolio to the samecounterparty against amounts to be received; and by the receipt of collateral from the counterparty by thePortfolio to cover the Portfolio’s exposure to the counterparty. However, there is no assurance that suchmitigating factors are easily enforceable. In addition to master netting arrangements, the right to set-off existswhen all the conditions are met such that each of the parties owes the other determinable amounts, thereporting party has the right to set-off the amount owed with the amount owed by the other party, the reporting
B2
party intends to set-off, and the right of set-off is enforceable by law. During the reporting period, there was nointention to settle on a net basis and all amounts are presented on a gross basis on the Statement of Assetsand Liabilities.
Securities Lending: The Portfolio may lend its portfolio securities to banks and broker-dealers. The loans aresecured by collateral at least equal to the market value of the securities loaned. Collateral pledged by eachborrower is invested in an affiliated money market fund and is marked to market daily, based on the previousday’s market value, such that the value of the collateral exceeds the value of the loaned securities. Loans aresubject to termination at the option of the borrower or the Portfolio. Upon termination of the loan, the borrowerwill return to the Portfolio securities identical to the loaned securities. Should the borrower of the securities failfinancially, the Portfolio has the right to repurchase the securities in the open market using the collateral. ThePortfolio recognizes income, net of any rebate and securities lending agent fees, for lending its securities inthe form of fees or interest on the investment of any cash received as collateral. The borrower receives allinterest and dividends from the securities loaned and such payments are passed back to the lender inamounts equivalent thereto. The Portfolio also continues to recognize any unrealized gain (loss) in the marketprice of the securities loaned and on the change in the value of the collateral invested that may occur duringthe term of the loan. In addition, realized gain (loss) is recognized on changes in the value of the collateralinvested upon liquidation of the collateral. Net earnings from securities lending are disclosed on theStatement of Operations as “Income from securities lending, net”.
Concentration of Risk: Foreign security and currency transactions may involve certain considerations andrisks not typically associated with those of domestic origin as a result of, among other factors, the possibilityof political or economic instability or the level of the governmental supervision and regulation of foreignsecurities markets.
Securities Transactions and Net Investment Income: Securities transactions are recorded on the trade date.Realized gains (losses) from investment and currency transactions are calculated on the specific identificationmethod. Dividend income is recorded on the ex-date. Interest income, including amortization of premium andaccretion of discount on debt securities, as required, is recorded on the accrual basis. Expenses are recordedon an accrual basis, which may require the use of certain estimates by management that may differ from actual.
Net investment income or loss (other than administration and distribution fees which are charged directly tothe respective class) and unrealized and realized gains (losses) are allocated daily to each class of sharesbased upon the relative proportion of adjusted net assets of each class at the beginning of the day.
Equity Real Estate Investment Trusts (REITs): The Portfolio invests in Equity REITs, which report informationon the source of their distributions annually. Based on current and historical information, a portion ofdistributions received from Equity REITs during the period is estimated to be dividend income, capital gain orreturn of capital and recorded accordingly. When material these estimates are adjusted periodically when theactual source of distributions is disclosed by the Equity REITs.
Taxes: For federal income tax purposes, the Portfolio is treated as a separate taxpaying entity. The Portfoliois treated as a partnership for tax purposes. No provision has been made in the financial statements for U.S.federal, state, or local taxes, as any tax liability arising from operations of the Portfolios is the responsibility ofthe Portfolio’s shareholders (Participating Insurance Companies). The Portfolio is not generally subject toentity-level taxation. Shareholders of the Portfolio are subject to taxes on their distributive share of partnershipitems. Withholding taxes on foreign dividends, interest and capital gains are accrued in accordance with thePortfolio’s understanding of the applicable country’s tax rules and regulations. Such taxes are accrued net ofreclaimable amounts, at the time the related income/gain is recorded. The Portfolio generally attempts tomanage its diversification in a manner that supports the diversification requirements of the underlyingseparate accounts.
Distributions: Distributions, if any, from the Portfolio are made in cash and automatically reinvested inadditional shares of the Portfolio. Distributions are recorded on the ex-date.
Estimates: The preparation of financial statements requires management to make estimates andassumptions that affect the reported amounts and disclosures in the financial statements. Actual results coulddiffer from those estimates.
B3
3. Agreements
The Series Fund has a management agreement with PGIM Investments. Pursuant to this agreement, PGIMInvestments has responsibility for all investment management services and supervises the subadviser’sperformance of such services. PGIM Investments has entered into a subadvisory agreement with JennisonAssociates LLC (“Jennison”) (the “Subadviser”), under which Jennison provides investment advisory services forthe Portfolio. PGIM Investments pays for the services of the Subadviser, cost of compensation of officers of thePortfolio, occupancy and certain clerical and administrative expenses of the Portfolio. The Portfolio bears allother costs and expenses.
The management fee paid to PGIM Investments is accrued daily and payable monthly at an annual rate of0.60% of the Portfolio’s average daily net assets. The effective management fee was 0.60% for the sixmonths ended June 30, 2017.
The Series Fund, on behalf of the Portfolio, has a distribution agreement, pursuant to Rule 12b-1 under the1940 Act, with Prudential Investment Management Services LLC (“PIMS”), which acts as the distributor of theClass I and Class II shares of the Portfolio. The Portfolio compensates PIMS for distributing and servicing thePortfolio’s Class II shares pursuant to a plan of distribution (the “Class II Plan”), regardless of expensesactually incurred by PIMS. The distribution fees are accrued daily and payable monthly. No distribution orservice fees are paid to PIMS as distributor of the Class I shares of the Portfolio. Pursuant to the Class IIPlan, the Class II shares of the Portfolio compensate PIMS for distribution-related activities at an annual rateof 0.25% of the average daily net assets of the Class II shares.
The Series Fund has an administration agreement with PGIM Investments, which acts as the administrator ofthe Class II shares of the Portfolio. The administration fee paid to PGIM Investments is accrued daily andpayable monthly, at the annual rate of 0.15% of the average daily net assets of the Class II shares.
PIMS, PGIM Investments, PGIM, Inc. and Jennison are indirect, wholly-owned subsidiaries of PrudentialFinancial, Inc. (“Prudential”).
The Portfolio has entered into brokerage commission recapture agreements with certain registered broker-dealers. Under the brokerage commission recapture program, a portion of the commission is returned to thePortfolio on whose behalf the trades were made. Such amounts are included within realized gain (loss) oninvestment transactions presented in the Statement of Operations. For the six months ended June 30, 2017,brokerage commission recaptured under these agreements was $55,187.
4. Other Transactions with Affiliates
Prudential Mutual Fund Services LLC (“PMFS”), an affiliate of PGIM Investments and an indirect, wholly-ownedsubsidiary of Prudential, serves as the transfer agent of the Portfolio. The transfer agent’s fees and expenses inthe Statement of Operations include certain out-of-pocket expenses paid to non-affiliates, where applicable.
The Portfolio invests its overnight sweep cash in the Prudential Core Ultra Short Bond Fund (the “Core Fund”)and its securities lending cash collateral in the Prudential Institutional Money Market Fund (the “Money MarketFund”), each a series of Prudential Investment Portfolios 2, registered under the 1940 Act and managed byPGIM Investments. Earnings from the Core Fund and the Money Market Fund are disclosed on the Statementof Operations as “Affiliated dividend income” and “Income from securities lending, net”, respectively.
For the reporting period ended June 30, 2017, PGIM, Inc. was compensated $59,536 by PGIM Investmentsfor managing the Portfolio’s securities lending cash collateral as subadviser to the Money Market Fund.
In February 2016, Prudential, the parent company of the Investment Manager (PGIM Investments) selfreported to the Securities and Exchange Commission (“SEC”) and certain other regulators that, in somecases, it failed to maximize securities lending income for certain Portfolios of the Series Fund due to a long-standing restriction benefitting Prudential. The Board was not notified of the restriction until after it had beenremoved. Prudential paid the affected Portfolios an amount equal to the estimated loss associated with theunauthorized restriction. At the Board’s direction, this payment occurred on June 30, 2016. The estimatedopportunity loss was calculated by an independent consultant hired by Prudential whose calculationmethodology was subsequently reviewed by a consultant retained by the independent trustees of the SeriesFund. The amount of opportunity loss payment to the Portfolio is disclosed in the Portfolio’s “Statement ofChanges in Net Assets” and “Financial Highlights” as “Capital Contributions”.
B4
In addition to the above, Prudential has paid and continues to directly pay certain legal, audit and othercharges in connection with the matter on behalf of the Portfolios.
The SEC Staff and other regulators continue to review the matter.
The Portfolio may enter into certain securities purchase or sale transactions under Board approvedRule 17a-7 procedures. Rule 17a-7 is an exemptive rule under the 1940 Act, that permits purchase and saletransactions among affiliated investment companies, or between an investment company and a person that isaffiliated solely by reason of having a common (or affiliated) investment adviser, common directors, and/orcommon officers. Such transactions are subject to ratification by the Board. For the period ended June 30,2017 no such transactions were entered into by the Portfolio.
The Portfolio was reimbursed $0 and $19,828 for the six months ended June 30, 2017 and the year endedDecember 31, 2016, respectively, by Prudential for foreign withholding taxes for certain countries due to thePortfolio’s status as a partnership for tax purposes.
5. Portfolio Securities
The aggregate cost of purchases and proceeds from sales of portfolio securities (excluding short-terminvestments and U.S. Treasury securities) for the six months ended June 30, 2017, were $496,940,403 and$546,354,350, respectively.
6. Tax Information
The Portfolio is treated as a partnership for tax purposes. The character of the cash distributions, if any, madeby the partnership is generally classified as nontaxable return of capital distributions. After each fiscal yeareach shareholder of record will receive information regarding their distributive allocable share of thepartnership’s income, gains, losses and deductions.
With respect to the Portfolio, book cost of assets differs from tax cost of assets as a result of the Portfolio’sadoption of a mark to market method of accounting for tax purposes. Under this method, tax cost of assetswill approximate fair market value.
Management has analyzed the Portfolio’s tax positions taken on federal, state and local income tax returns forall open tax years and has concluded that no provision for income tax is required in the Portfolio’s financialstatements for the current reporting period. The Portfolio’s federal, state and local income tax returns for taxyears for which the applicable statutes of limitations have not expired are subject to examination by theInternal Revenue Service and state departments of revenue.
7. Borrowings
The Series Fund, on behalf of the Portfolio, along with other affiliated registered investment companies (the“Funds”), is a party to a Syndicated Credit Agreement (“SCA”) with a group of banks. The purpose of the SCAis to provide an alternative source of temporary funding for capital share redemptions. The SCA provides for acommitment of $900 million for the period October 6, 2016 through October 5, 2017. The Funds pay anannualized commitment fee of .15% of the unused portion of the SCA. The Portfolio’s portion of thecommitment fee for the unused amount, allocated based upon a method approved by the Board, is accrueddaily and paid quarterly. The interest on borrowings under the SCA is paid monthly and at a per annuminterest rate based upon a contractual spread plus the higher of (1) the effective federal funds rate, (2) the1-month LIBOR rate or (3) zero percent.
The Portfolio utilized the SCA during the six months ended June 30, 2017. The average balance outstandingis for the number of days the Portfolios had utilized the credit facility.
The Series Fund offers Class I and Class II shares. Neither Class I nor Class II shares of the Portfolio aresubject to any sales charge or redemption charge and are sold at the net asset value of the Portfolio. Class Ishares are sold only to certain separate accounts of Prudential to fund benefits under certain variable lifeinsurance and variable annuity contracts (“contracts”). Class II shares are sold only to separate accounts ofnon-Prudential insurance companies as investment options under certain contracts. Class I shares are alsooffered to separate accounts of non-affiliated insurers for which Prudential or its affiliates administer and/orreinsure the variable life insurance or variable annuity contracts issued in connection with the separateaccounts. The separate accounts invest in shares of the Series Fund through subaccounts that correspond tothe Portfolios. The separate accounts will redeem shares of the Series Fund to the extent necessary toprovide benefits under the contracts or for such other purposes as may be consistent with the contracts.
Transactions in shares of beneficial interest were as follows:
As of June 30, 2017, all of Class I shares of record of the Portfolio were owned by the Prudential InsuranceCompany of America (“PICA”), or subsidiaries thereof, on behalf of the owners of the variable insuranceproducts issued by PICA. PICA is an indirect, wholly-owned subsidiary of Prudential.
10. Recent Accounting Pronouncements and Reporting Updates
On October 13, 2016, the SEC adopted new rules and forms and amended existing rules and forms which areintended to modernize and enhance the reporting and disclosure of information by registered investmentcompanies and to improve the quality of information that funds provide to investors, including modifications toRegulation S-X which would require standardized, enhanced disclosure about derivatives in investmentcompany financial statements. The compliance dates of the modifications to Regulation S-X are August 1,2017 and other amendments and rules are generally June 1, 2018 and December 1, 2018. Management iscurrently evaluating the impacts to the financial statement disclosures.
B6
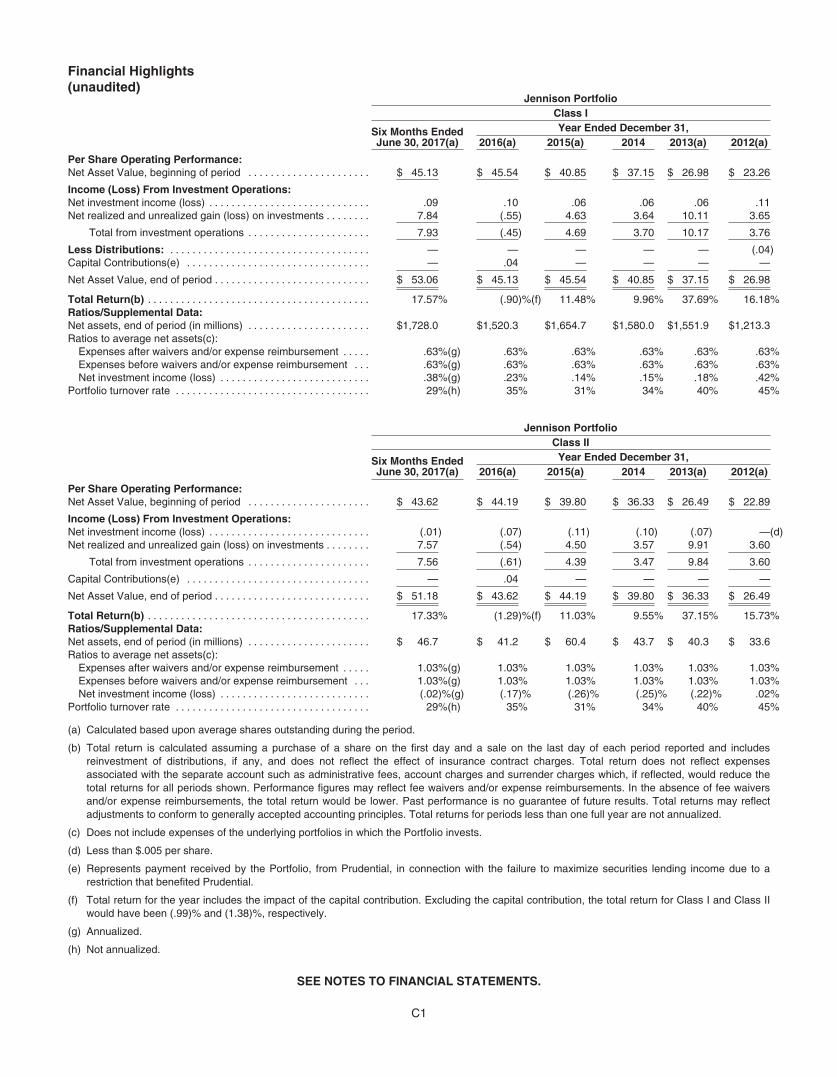
Financial Highlights(unaudited)
Jennison PortfolioClass I
Six Months EndedJune 30, 2017(a)
Year Ended December 31,2016(a) 2015(a) 2014 2013(a) 2012(a)
(a) Calculated based upon average shares outstanding during the period.
(b) Total return is calculated assuming a purchase of a share on the first day and a sale on the last day of each period reported and includesreinvestment of distributions, if any, and does not reflect the effect of insurance contract charges. Total return does not reflect expensesassociated with the separate account such as administrative fees, account charges and surrender charges which, if reflected, would reduce thetotal returns for all periods shown. Performance figures may reflect fee waivers and/or expense reimbursements. In the absence of fee waiversand/or expense reimbursements, the total return would be lower. Past performance is no guarantee of future results. Total returns may reflectadjustments to conform to generally accepted accounting principles. Total returns for periods less than one full year are not annualized.
(c) Does not include expenses of the underlying portfolios in which the Portfolio invests.
(d) Less than $.005 per share.
(e) Represents payment received by the Portfolio, from Prudential, in connection with the failure to maximize securities lending income due to arestriction that benefited Prudential.
(f) Total return for the year includes the impact of the capital contribution. Excluding the capital contribution, the total return for Class I and Class IIwould have been (.99)% and (1.38)%, respectively.
(g) Annualized.
(h) Not annualized.
SEE NOTES TO FINANCIAL STATEMENTS.
C1
[THIS PAGE INTENTIONALLY LEFT BLANK]
Approval of Advisory Agreements
The Trust’s Board of Trustees
The Board of Trustees (the Board) of The Prudential Series Fund (the Trust) consists of nine individuals, eight of whom are not“interested persons” of the Trust, as defined in the Investment Company Act of 1940, as amended (the 1940 Act) (the IndependentTrustees). The Board is responsible for the oversight of the Trust and each of its Portfolios, their operations, and performs the variousduties imposed on the directors of investment companies by the 1940 Act. The Independent Trustees have retained independent legalcounsel to assist them in connection with their duties. The Chair of the Board is an Independent Trustee. The Board has established fourstanding committees: the Audit Committee, the Governance Committee, the Compliance Committee and the Investment Review and RiskCommittee. Each committee is chaired by an Independent Trustee.
Annual Approval of the Trust’s Advisory Agreements
As required under the 1940 Act, the Board determines annually whether to renew the Trust’s management agreement with PGIMInvestments LLC (“PGIM Investments”) and the Jennison’s Portfolio’s (the Portfolio) subadvisory agreement. As is further discussed andexplained below, in considering the renewal of the agreements, the Board, including all of the Independent Trustees, met on June 13-14,2017 (“the Meeting”) and approved the renewal of the agreements through July 31, 2018, after concluding that the renewal of theagreements was in the best interests of the Trust, the Portfolio and the Portfolio’s beneficial shareholders.
In advance of the Meeting, the Trustees requested and received materials relating to the agreements, and had the opportunity to askquestions and request further information in connection with the consideration of those agreements. Among other things, the Boardconsidered comparisons with other mutual funds in a relevant peer universe and peer group, as is further discussed below.
In approving the agreements, the Board, including the Independent Trustees advised by independent legal counsel, considered thefactors it deemed relevant, including the nature, quality and extent of services provided, the performance of the Portfolio, theprofitability of PGIM Investments and its affiliates, expenses and fees, and the potential for economies of scale that may be shared withthe Portfolio and its shareholders. In their deliberations, the Trustees did not identify any single factor that alone was responsible for theBoard’s decision to approve the agreements. In connection with its deliberations, the Board considered information provided at or inadvance of the Meeting, as well as information provided throughout the year at regular and special Board meetings, includingpresentations from PGIM Investments and subadviser personnel such as portfolio managers.
The Trustees determined that the overall arrangements between the Trust and PGIM Investments, which serves as the Trust’s investmentmanager pursuant to a management agreement, and between PGIM Investments and Jennison Associates LLC (Jennison), which servesas the Portfolio’s subadviser pursuant to the terms of a subadvisory agreement with PGIM Investments, are in the best interests of theTrust, the Portfolio and the Portfolio’s shareholders in light of the services performed, fees charged and such other matters as theTrustees considered relevant in the exercise of their business judgment. The Board considered the approval of the agreements for thePortfolio as part of its consideration of agreements for multiple Portfolios, but its approvals were made on a Portfolio-by-Portfolio basis.
The material factors and conclusions that formed the basis for the Trustees’ determinations to approve the renewal of the agreementsare discussed separately below.
Nature, quality and extent of services
The Board received and considered information regarding the nature, quality and extent of services provided to the Trust by PGIMInvestments and the subadviser. The Board considered the services provided by PGIM Investments, including but not limited to theoversight of the subadviser, as well as the provision of recordkeeping and compliance services to the Trust. With respect to PGIMInvestments’ oversight of the subadviser, the Board noted that PGIM Investments’ Strategic Investment Research Group (SIRG), abusiness unit of PGIM Investments, is responsible for screening and recommending new subadvisers when appropriate, as well asmonitoring and reporting to the Board on the performance and operations of the subadvisers. The Board also considered that PGIMInvestments pays the salaries of all of the officers and management Trustees of the Trust. The Board also considered the investmentsubadvisory services provided by the subadviser, as well as compliance with the Trust’s investment restrictions, policies andprocedures. The Board considered PGIM Investments’ evaluation of the subadviser, as well as PGIM Investments’ recommendation,based on its review of the subadviser, to renew the subadvisory agreement.
The Board reviewed the qualifications, backgrounds and responsibilities of PGIM Investments’ senior management responsible for theoversight of the Trust and the subadviser, and also reviewed the qualifications, backgrounds and responsibilities of the subadviser’sportfolio managers who are responsible for the day-to-day management of the Portfolio. The Board was provided with informationpertaining to PGIM Investments’ and the subadviser’s organizational structure, senior management, investment operations and otherrelevant information pertaining to PGIM Investments and the subadviser. The Board also noted that it received favorable compliancereports from the Trust’s Chief Compliance Officer (CCO) as to PGIM Investments and the subadviser. The Board noted that JennisonAssociates LLC (Jennison), which serves as the subadviser to the Portfolio, is affiliated with PGIM Investments.
The Board concluded that it was satisfied with the nature, extent and quality of the investment management services provided by PGIMInvestments and the subadvisory services provided to the Portfolio by the subadviser, and that there was a reasonable basis on which toconclude that the Portfolio benefits from the services provided by PGIM Investments and the subadviser under the management andsubadvisory agreements.
Costs of Services and Profits Realized by PGIM Investments
The Board was provided with information on the profitability of PGIM Investments and its affiliates in serving as the Trust’s investmentmanager. The Board discussed with PGIM Investments the methodology utilized in assembling the information regarding profitabilityand considered its reasonableness. The Board recognized that it is difficult to make comparisons of profitability from fund managementcontracts because comparative information is not generally available and is affected by numerous factors, including the structure of theparticular adviser, the types of funds it manages, its business mix, numerous assumptions regarding allocations and the adviser’scapital structure and cost of capital. The Board considered information regarding the profitability of Jennison, which is an affiliate ofPGIM Investments, on a consolidated basis. Taking these factors into account, the Board concluded that the profitability of PGIMInvestments and its affiliates in relation to the services rendered was not unreasonable.
Economies of Scale
The Board received and discussed information concerning whether PGIM Investments realizes economies of scale as the Portfolio’sassets grow beyond current levels. The Board noted that economies of scale, if any, may be shared with the Portfolio in several ways,including low management fees from inception, additional technological and personnel investments to enhance shareholder services,and maintaining existing expense structures in the face of a rising cost environment. The Board recognized the inherent limitations ofany analysis of economies of scale, stemming largely from the Board’s understanding that most of PGIM Investments’ costs are notspecific to individual funds, but rather are incurred across a variety of products and services.
Other Benefits to PGIM Investments and the Subadviser
The Board considered potential ancillary benefits that might be received by PGIM Investments, the subadviser, and their affiliates as aresult of their relationship with the Trust. The Board concluded that potential benefits to be derived by PGIM Investments includedcompensation received by insurance company affiliates of PGIM Investments from the subadviser, as well as benefits to its reputation orother intangible benefits resulting from PGIM Investments’ association with the Trust. The Board also considered information providedby PGIM Investments regarding the regulatory requirement that insurance companies determine that the fees and charges under theirvariable contracts are reasonable. The Board noted that the insurance company affiliates of PGIM Investments at least annually reviewand represent that the fees and charges of the variable contracts using the Portfolio are reasonable. The Board concluded that thepotential benefits to be derived by the subadviser included the ability to use soft dollar credits, brokerage commissions that may bereceived by affiliates of the subadviser, as well as the potential benefits consistent with those generally resulting from an increase inassets under management, specifically, potential access to additional research resources and benefits to their reputations. The Boardconcluded that the benefits derived by PGIM Investments and the subadviser were consistent with the types of benefits generally derivedby investment managers and subadvisers to mutual funds.
Performance of the Portfolio / Fees and Expenses / Other Factors
With respect to the Portfolio, the Board also considered certain additional specific factors and made related conclusions relating to thehistorical performance of the Portfolio for the one-, three-, five- and ten-year periods ended December 31, 2016, except as otherwisenoted below. The Board compared the historical performance of the Portfolio to the comparable performance of the Portfolio’s benchmarkindex and to a universe of mutual funds (the Peer Universe) that were determined by Broadridge, Inc. (Broadridge), an independentprovider of mutual fund data, to be similar to the Portfolio.
The Board also considered the Portfolio’s actual management fee, as well as the Portfolio’s net total expense ratio, for the calendar year2016. The Board considered the management fee for the Portfolio as compared to the management fee charged by PGIM Investments toother funds and accounts and the fee charged by other advisers to comparable mutual funds in a group of mutual funds that weredetermined by Broadridge to be similar to the Portfolio (the Peer Group). The actual management fee represents the fee rate actuallypaid by Portfolio shareholders and includes any fee waivers or reimbursements. The net total expense ratio for the Portfolio representsthe actual expense ratio incurred by Portfolio shareholders, but does not include the charges associated with the variable contracts.
The mutual funds included in the Peer Universe and each Peer Group were objectively determined by Broadridge, an independentprovider of mutual fund data. The comparisons placed the Portfolio in various quartiles, with the 1st quartile being the best 25% of themutual funds (for performance, the best performing mutual funds and, for expenses, the lowest cost mutual funds). To the extent thatPGIM Investments deems appropriate, and for reasons addressed in detail with the Board, PGIM Investments may have provided and theBoard may have considered, supplemental data compiled by Broadridge for the Board’s consideration.
The section below summarizes key factors considered by the Board and the Board’s conclusions regarding the Portfolio’s performance,fees and overall expenses. The section sets forth gross performance comparisons (which do not reflect the impact on performance of anysubsidies, expense caps or waivers that may be applicable) with the Peer Universe, actual management fees with the Peer Group (whichreflect the impact of any subsidies or fee waivers), and net total expenses with the Peer Group, each of which were key factorsconsidered by the Board.
Jennison PortfolioPerformance 1 Year 3 Years 5 Years 10 Years
• The Board noted that the Portfolio outperformed its benchmark index over the five- and ten-year periods, though itunderperformed for the one- and three-year periods.
• The Board noted PGIM Investments’ assertion that the Portfolio’s recent underperformance was temporary and isolated to thebeginning of 2016. In this regard, the Board considered that, during 2015, the Portfolio outperformed its benchmark indexand ranked in the first quartile of its Peer Universe.
• The Board also considered information provided by PGIM Investments which indicated that the Portfolio had historicallydemonstrated the ability to strongly rebound from periods of underperformance. In this regard, the Board noted that thePortfolio’s recent performance had shown improvement, with the Portfolio outperforming its benchmark index and PeerUniverse median for the first quarter of 2017.
• The Board also noted that it would continue to monitor the Portfolio’s performance.
• The Board concluded that, in light of the above, it would be in the best interests of the Portfolio and its shareholders to renewthe agreements, and that the management fees (including subadvisory fees) and total expenses were reasonable in light ofthe services provided.
**********
After full consideration of these factors, the Board concluded that the approval of the agreements was in the best interests of the Trust,the Portfolio and its beneficial shareholders.
[THIS PAGE INTENTIONALLY LEFT BLANK]
[THIS PAGE INTENTIONALLY LEFT BLANK]
[THIS PAGE INTENTIONALLY LEFT BLANK]
The Prudential Series Fund Class II Portfolios are available through life insurance contracts issued by various insurancecompanies other than The Prudential Insurance Company of America and its affiliates. The funds in The Prudential SeriesFund are distributed by Prudential Investment Management Services (PIMS), LLC, a Prudential Financial company andmember SIPC. PIMS’ principal business address is 655 Broad Street, 19th Floor, Newark, NJ 07102. Each company issolely responsible for its own financial condition and contractual obligations.
Life insurance and annuity contracts contain exclusions, limitations, reductions of benefits, and terms for keeping them inforce. Your licensed financial professional can provide you with costs and complete details. Contract guarantees are basedon the claims-paying ability of the issuing company.