Articles published in The Quality Management Forum may not be reproduced without consent of the author(s). A Peer-Reviewed Publication of the Quality Management Division of the American Society for Quality The Quality Management www.asq-qm.org AS ® Inside This Issue The Continuum of Quality Improvement in Public Health ............ 1 Chair’s Message ......... 2 Yes, It Really is All About You .......... 10 The Certified Manager of Quality/Organizational Excellence............. 13 Aiming for Perfection: An Exploration of Leadership and Excellence ......... 17 Quality Management Journal Preview ......... 21 Introduction As the public health community expands its use of quality improvement (QI), there is often confusion about how all the tools, techniques, methodologies, models, and approaches fit together. There are the basic and advanced tools of quality improvement: Quality Function Deployment, Lean Six Sigma, Daily Management, Mobilizing for Action through Planning and Partnerships (MAPP), 1 Turning Point, 2 Baldrige, 3 and state quality award models. At times, these models are introduced as competing techniques and processes; they are not tied together into a system through which they complement each other. The public health community would benefit from an overall approach to building an improvement culture. As shown in Fig. 1, QI in public health is a never-ending process that pervades the organization when fully implemented. Top organizational leaders address the quality of the system at a macro level (Big QI ). In the middle, professional staff attacks problems in programs or service areas by improving particular processes (Little qi ). At the individual level, staff members seek ways of improving their own behaviors and environments (Individual qi ). The Continuum of Quality Improvement in Public Health By Grace Duffy, Kim McCoy, John Moran, and William Riley Winter 2010 Volume 35, Number 4 (The ConTinuum of QualiTy improvemenT in publiC healTh, ConTinued on page 3) Big ‘QI’ MACRO MESO Little ‘qi’ MICRO Individual ‘qi’ INDIVIDUAL Figure 1: Continuous Quality Improvement System in Public Health
Transcript
Articles published in The Quality Management Forum may not be reproduced without
consent of the author(s).
A P e e r - R e v i e w e d P u b l i c a t i o n o f t h e Q u a l i t y M a n a g e m e n t D i v i s i o n o f t h e A m e r i c a n S o c i e t y f o r Q u a l i t y
T h e Q u a l i t y M a n a g e m e n t
www.asq-qm.orgAS
®
Inside This IssueThe Continuum of
Quality Improvement in
Public Health. . . . . . . . . . . .1
Chair’s Message . . . . . . . . .2
Yes, It Really is
All About You . . . . . . . . . . 10
The Certified Manager of
Quality/Organizational
Excellence. . . . . . . . . . . . . 13
Aiming for Perfection:
An Exploration of Leadership
and Excellence . . . . . . . . . 17
Quality Management
Journal Preview . . . . . . . . . 21
Introduction
As the public health community expands its use of quality improvement (QI), there is often confusion about how all the tools, techniques, methodologies, models, and approaches fit together. There are the basic and advanced tools of quality improvement: Quality Function Deployment, Lean Six Sigma, Daily Management, Mobilizing for Action through Planning and Partnerships (MAPP),1 Turning Point,2 Baldrige,3 and state quality award models. At times, these models are introduced as competing techniques and processes; they are not tied together into a system through which they
complement each other. The public health community would benefit from an overall approach to building an improvement culture.
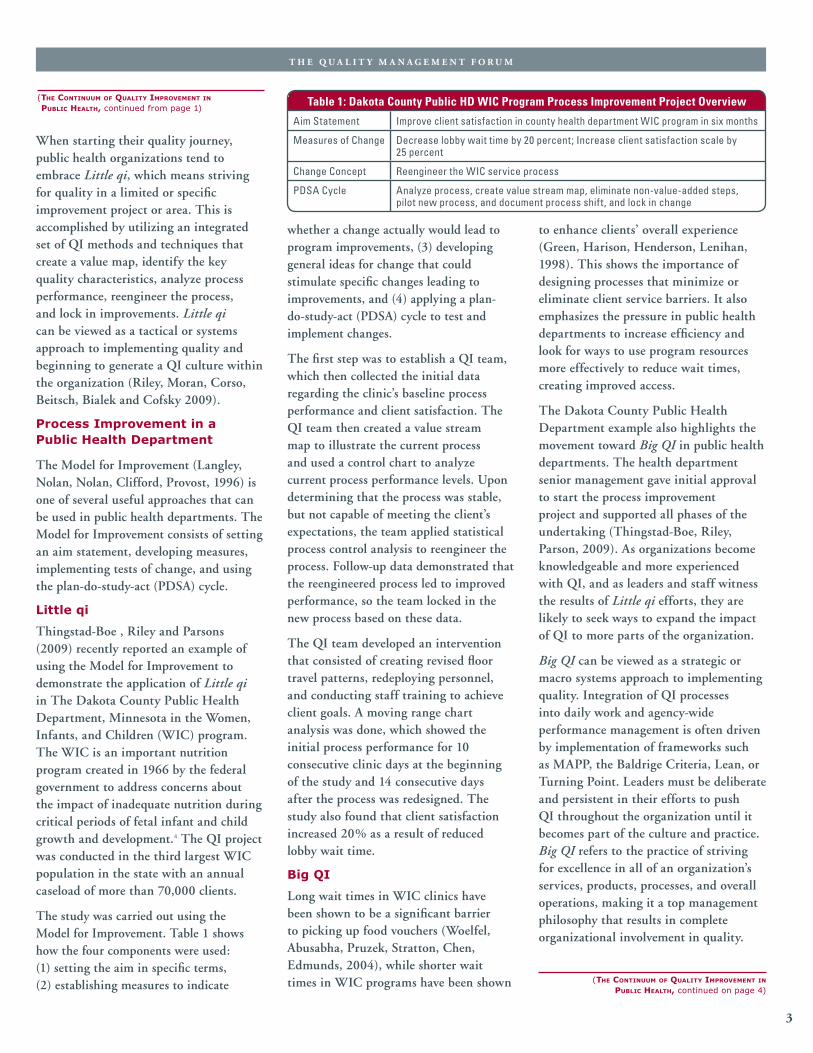
As shown in Fig. 1, QI in public health is a never-ending process that pervades the organization when fully implemented. Top organizational leaders address the quality of the system at a macro level (Big QI). In the middle, professional staff attacks problems in programs or service areas by improving particular processes (Little qi). At the individual level, staff members seek ways of improving their own behaviors and environments (Individual qi).
The Continuum of Quality Improvement in Public HealthBy Grace Duffy, Kim McCoy, John Moran, and William Riley
Winter 2010
V o l u m e 3 5 , N u m b e r 4
(The ConTinuum of QualiTy improvemenT in publiC healTh, ConTinued on page 3)
Big ‘QI’
MACRO
MESO
Little ‘qi’
MICRO
Individual ‘qi’
INDIVIDUAL
Figure 1: Continuous Quality Improvement System in Public Health
T H E Q U A L I T Y M A N A G E M E N T F O R U M
2
Chair’s MessageBy Jd Marhevko
I thought it would be helpful to remind you of the of the resources available to you as a QMD member. Our web site www.asq-qm.org contains valuable information about events, trends, and—most importantly—personal contact information for your leadership team. And if you’re reading this, you know that the QMD provides you with a quarterly Quality Management Forum (QMF).
Here are some of the benefits you receive as a QMD member:
• Access the QMD web site www.asq-qm.org, as well as the ASQ web site www.asq.org (if you are a full member)
• Access hundreds of articles, dozens of podcasts and tools, all previous issues of the QMF, and connections to events. A link to the podcasts from our 2009 QMD Conference is attached www.asq-qmd.org/2009podcasts
• Access QMF online at www.asq-qmd.org/qmd-forum-newsletter
• Receive Quality Progress magazine monthly
• Become a published author in the QMF or on the web site. Submit an article for review at www.asq-qmd.org/how-to-get-published
• Participate in one of the specialized technical committees, which have received recognition for their contributions by authoring numerous Quality Press books. We’ve recently added two new technical committees, on Social Responsibility and on Public Health
• Participate in web-based training on various topics
• Access a variety of on-line training resources, listed at www.qmd.qualitycampus.com/courses.asp?m1=5&m2=0. Click on Course Info
• Create a QMD member profile on the web site at www.asq-qmd.org/userprofilemodule/edit/
• Join us on the QMD Linked-In site at www.linkedin.com/groups?gid=1776051
• Further your knowledge and skills by volunteering for QMD leadership activities
These benefits are included as part of your annual QMD membership fee! To contact the QMD team, go to www.asq-qmd.org/qmd-leadership.
We would really like your feedback about to how well the QMD is fulfilling your professional quality-related needs and about how we can better support your specific quality goals. You can provide your input by completing the brief survey at this link: asq.qualtrics.com/SE/?SID=SV_8Dj2SbB5a9FWSG0&SVID=Prod.
Thank you for being a QMD member! I hope that you will be able to take advantage of these benefits to assist you in achieving your professional and personal goals. On behalf of your QMD leadership team, I want to emphasize that we are eager to provide you with the support and services that you want and need.
to enhance clients’ overall experience (Green, Harison, Henderson, Lenihan, 1998). This shows the importance of designing processes that minimize or eliminate client service barriers. It also emphasizes the pressure in public health departments to increase efficiency and look for ways to use program resources more effectively to reduce wait times, creating improved access.
The Dakota County Public Health Department example also highlights the movement toward Big QI in public health departments. The health department senior management gave initial approval to start the process improvement project and supported all phases of the undertaking (Thingstad-Boe, Riley, Parson, 2009). As organizations become knowledgeable and more experienced with QI, and as leaders and staff witness the results of Little qi efforts, they are likely to seek ways to expand the impact of QI to more parts of the organization.
Big QI can be viewed as a strategic or macro systems approach to implementing quality. Integration of QI processes into daily work and agency-wide performance management is often driven by implementation of frameworks such as MAPP, the Baldrige Criteria, Lean, or Turning Point. Leaders must be deliberate and persistent in their efforts to push QI throughout the organization until it becomes part of the culture and practice. Big QI refers to the practice of striving for excellence in all of an organization’s services, products, processes, and overall operations, making it a top management philosophy that results in complete organizational involvement in quality.
(The ConTinuum of QualiTy improvemenT in publiC healTh, continued on page 4)
When starting their quality journey, public health organizations tend to embrace Little qi, which means striving for quality in a limited or specific improvement project or area. This is accomplished by utilizing an integrated set of QI methods and techniques that create a value map, identify the key quality characteristics, analyze process performance, reengineer the process, and lock in improvements. Little qi can be viewed as a tactical or systems approach to implementing quality and beginning to generate a QI culture within the organization (Riley, Moran, Corso, Beitsch, Bialek and Cofsky 2009).
Process Improvement in a Public Health Department
The Model for Improvement (Langley, Nolan, Nolan, Clifford, Provost, 1996) is one of several useful approaches that can be used in public health departments. The Model for Improvement consists of setting an aim statement, developing measures, implementing tests of change, and using the plan-do-study-act (PDSA) cycle.
Little qi
Thingstad-Boe , Riley and Parsons (2009) recently reported an example of using the Model for Improvement to demonstrate the application of Little qi in The Dakota County Public Health Department, Minnesota in the Women, Infants, and Children (WIC) program. The WIC is an important nutrition program created in 1966 by the federal government to address concerns about the impact of inadequate nutrition during critical periods of fetal infant and child growth and development.4 The QI project was conducted in the third largest WIC population in the state with an annual caseload of more than 70,000 clients.
The study was carried out using the Model for Improvement. Table 1 shows how the four components were used: (1) setting the aim in specific terms, (2) establishing measures to indicate
whether a change actually would lead to program improvements, (3) developing general ideas for change that could stimulate specific changes leading to improvements, and (4) applying a plan-do-study-act (PDSA) cycle to test and implement changes.
The first step was to establish a QI team, which then collected the initial data regarding the clinic’s baseline process performance and client satisfaction. The QI team then created a value stream map to illustrate the current process and used a control chart to analyze current process performance levels. Upon determining that the process was stable, but not capable of meeting the client’s expectations, the team applied statistical process control analysis to reengineer the process. Follow-up data demonstrated that the reengineered process led to improved performance, so the team locked in the new process based on these data.
The QI team developed an intervention that consisted of creating revised floor travel patterns, redeploying personnel, and conducting staff training to achieve client goals. A moving range chart analysis was done, which showed the initial process performance for 10 consecutive clinic days at the beginning of the study and 14 consecutive days after the process was redesigned. The study also found that client satisfaction increased 20% as a result of reduced lobby wait time.
Big QI
Long wait times in WIC clinics have been shown to be a significant barrier to picking up food vouchers (Woelfel, Abusabha, Pruzek, Stratton, Chen, Edmunds, 2004), while shorter wait times in WIC programs have been shown
(The ConTinuum of QualiTy improvemenT in publiC healTh, continued from page 1)
Table 1: Dakota County Public HD WIC Program Process Improvement Project Overview
Aim Statement Improve client satisfaction in county health department WIC program in six months
Measures of Change Decrease lobby wait time by 20 percent; Increase client satisfaction scale by 25 percent
Change Concept Reengineer the WIC service process
PDSA Cycle Analyze process, create value stream map, eliminate non-value-added steps, pilot new process, and document process shift, and lock in change
T H E Q U A L I T Y M A N A G E M E N T F O R U M
4
Large Scale Public Health System Quality Improvement
Building a QI capacity in public health needs to be done at both the large-scale system level as well as the organizational level. At the large-scale public health system level, the authors of this article are involved in integrating the macro, meso, micro, and individual models of continuous QI within a number of public health organizations at the local, state and regional levels. For example, the Minnesota Public Health Collaborative for Quality Improvement (Riley, McCoy, 2009) provides a framework for beginning to build a QI culture in a state public health system.
The macro level of the Continuous Quality Improvement (CQI) System shown back in Fig. 1 is the strategic integration of long-term approaches to meet priority public health outcomes at the national, regional, or state level. The meso level includes the planning and deployment of programs that translate strategic vision and long range outcomes into state, county, city and other local projects or activities to meet specific community needs. The micro level encompasses the health department projects and programs instituted at the functional unit level.
Table 2 shows how the macro, meso, micro, and individual levels of the CQI System model relate to Big QI, Little qi,
(The ConTinuum of QualiTy improvemenT in publiC healTh, continued from page 3)
Measurement Reporting System. The reporting system includes data that describe local public health
• Programs and functions
• Budgets
• Staffing and capacity.
At the macro level the Minnesota Department of Health coordinates a five-year local assessment and planning process that is mandated by statute to facilitate achievement of the desired statewide outcomes for each of the six areas of public health responsibility.
The Minnesota Department of Health joins 15 other state programs at a national level through the Multi-State Learning Collaborative (MLC), funded by the Robert Wood Johnson Foundation. The MLC was established in 2006 and is targeted to end in 2011 with the kickoff of a nation-wide system of performance management and public health system accreditation. The goals of the MLC are to advance accreditation and quality improvement strategies in public health departments. There are currently 16 states involved in the collaborative.5 The goal of the Robert Wood Johnson Foundation and the Public Health Accreditation Board6 is for 60% of the U.S. population to be served by an accredited health department by 2015.
Minnesota joined the MLC during the second phase of activities in 2007. The Minnesota Public Health Collaborative for Quality Improvement (MPHCQI) was established as a partnership among the Minnesota Department of Health,
and Individual qi. The meso level of the CQI System model overlays both the macro and micro levels as a transition for deployment from organizational to unit-specific projects. Table 2 also suggests the use of basic and advanced tools of quality within the scope of organization versus unit activities. Although flexibility is required in using tools based on project need, the basic tools of quality, such as flowcharts and histograms, address more quantitative and tangible issues of immediate problem solving,. The advanced tools of quality use more behavioral and decision-making tools, such as force field analysis and interrelationship digraphs. The meso CQI System level uses even more flexible tools such as Quality Function Deployment and Lean Six Sigma to provide structure for translating customer needs into specific actions and tasks for problem solving and improvement. The individual system level uses any tools that support the specific task, although the basic tools are most often employed.
The Minnesota Department of Health, in partnership with local health departments, established 40 essential local activities that define what all residents of Minnesota should be able to expect from their local health department. These activities are organized into six areas of public health responsibility. These micro-level local activities are monitored at the macro (senior management) level, according to the continuous improvement model in Fig. 1, through annual reporting via the Planning and Performance
Table 2: Macro, Meso, Micro, and Individual Mapped to Big, Little and Individual QI
Topic Big ‘QI’—Organization-Wide Little ‘qi’—Program/Unit Individual ‘qi’
Improvement
Quality Improvement Planning
Evaluation of Quality Processes
Quality Improvement Goals
System Focus
Tied to the Strategic Plan
Responsiveness to a Community Need
Cut Across All Programs and Activities
Strategic Plan
Specific Project Focus
Program/Unit Level
Performance of a Process Over Time
Delivery of a Service
Individual Program/Unit Level Plans
Daily Work Level Focus
Tied to Yearly Individual Performance
Performance of Daily Work
Daily Work
Individual Performance Plans
System Level Macro Meso Micro Individual
Quality Tools Advanced QFD/Lean Six Sigma Basic
T H E Q U A L I T Y M A N A G E M E N T F O R U M
5
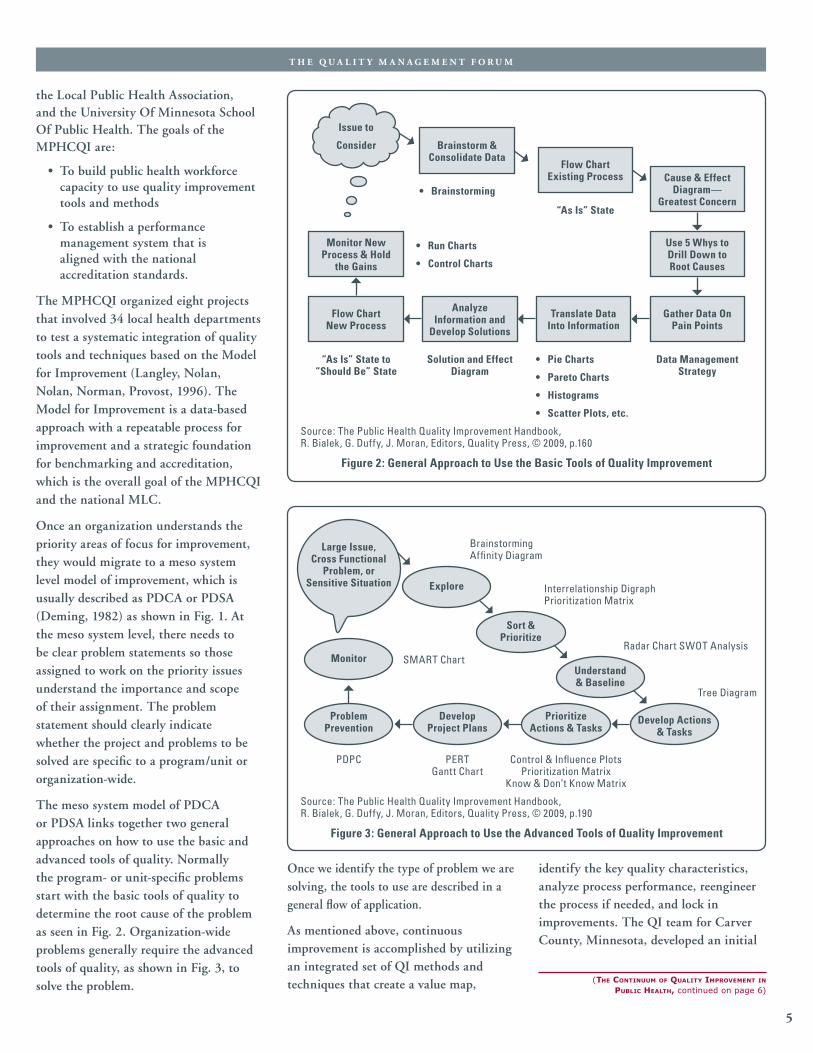
identify the key quality characteristics, analyze process performance, reengineer the process if needed, and lock in improvements. The QI team for Carver County, Minnesota, developed an initial
(The ConTinuum of QualiTy improvemenT in publiC healTh, continued on page 6)
the Local Public Health Association, and the University Of Minnesota School Of Public Health. The goals of the MPHCQI are:
• To build public health workforce capacity to use quality improvement tools and methods
• To establish a performance management system that is aligned with the national accreditation standards.
The MPHCQI organized eight projects that involved 34 local health departments to test a systematic integration of quality tools and techniques based on the Model for Improvement (Langley, Nolan, Nolan, Norman, Provost, 1996). The Model for Improvement is a data-based approach with a repeatable process for improvement and a strategic foundation for benchmarking and accreditation, which is the overall goal of the MPHCQI and the national MLC.
Once an organization understands the priority areas of focus for improvement, they would migrate to a meso system level model of improvement, which is usually described as PDCA or PDSA (Deming, 1982) as shown in Fig. 1. At the meso system level, there needs to be clear problem statements so those assigned to work on the priority issues understand the importance and scope of their assignment. The problem statement should clearly indicate whether the project and problems to be solved are specific to a program/unit or organization-wide.
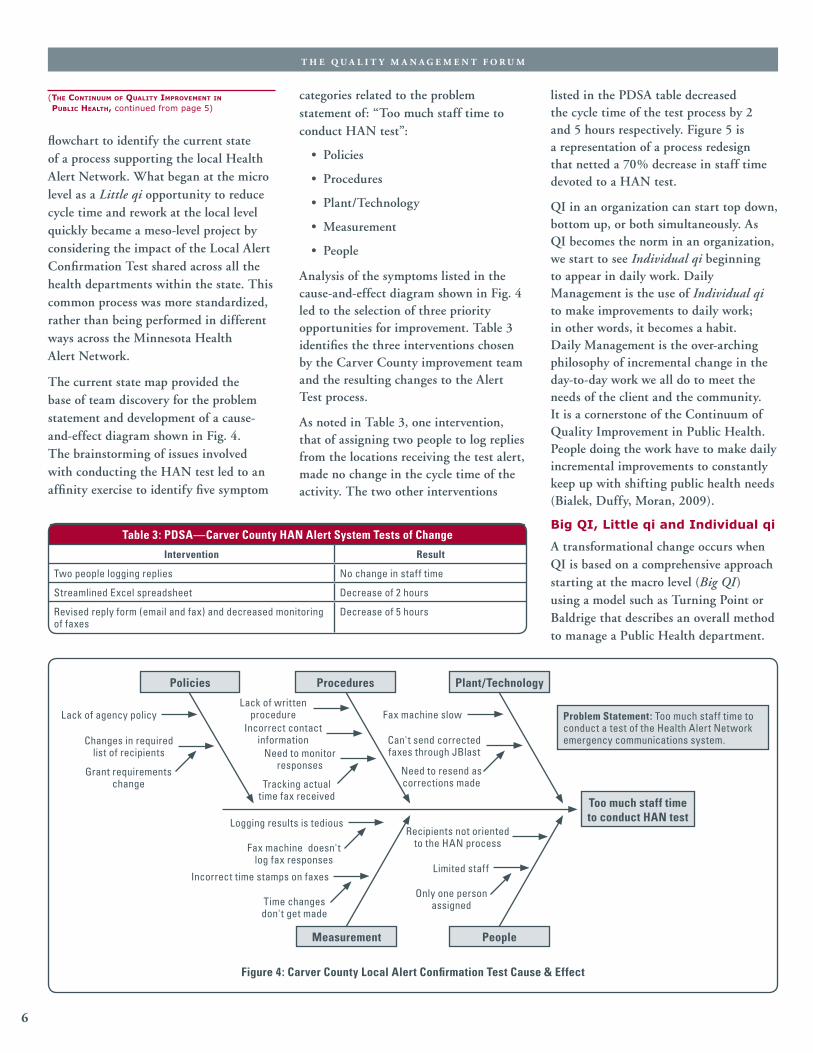
The meso system model of PDCA or PDSA links together two general approaches on how to use the basic and advanced tools of quality. Normally the program- or unit-specific problems start with the basic tools of quality to determine the root cause of the problem as seen in Fig. 2. Organization-wide problems generally require the advanced tools of quality, as shown in Fig. 3, to solve the problem.
Once we identify the type of problem we are solving, the tools to use are described in a general flow of application.
As mentioned above, continuous improvement is accomplished by utilizing an integrated set of QI methods and techniques that create a value map,
Figure 3: General Approach to Use the Advanced Tools of Quality Improvement
T H E Q U A L I T Y M A N A G E M E N T F O R U M
6
flowchart to identify the current state of a process supporting the local Health Alert Network. What began at the micro level as a Little qi opportunity to reduce cycle time and rework at the local level quickly became a meso-level project by considering the impact of the Local Alert Confirmation Test shared across all the health departments within the state. This common process was more standardized, rather than being performed in different ways across the Minnesota Health Alert Network.
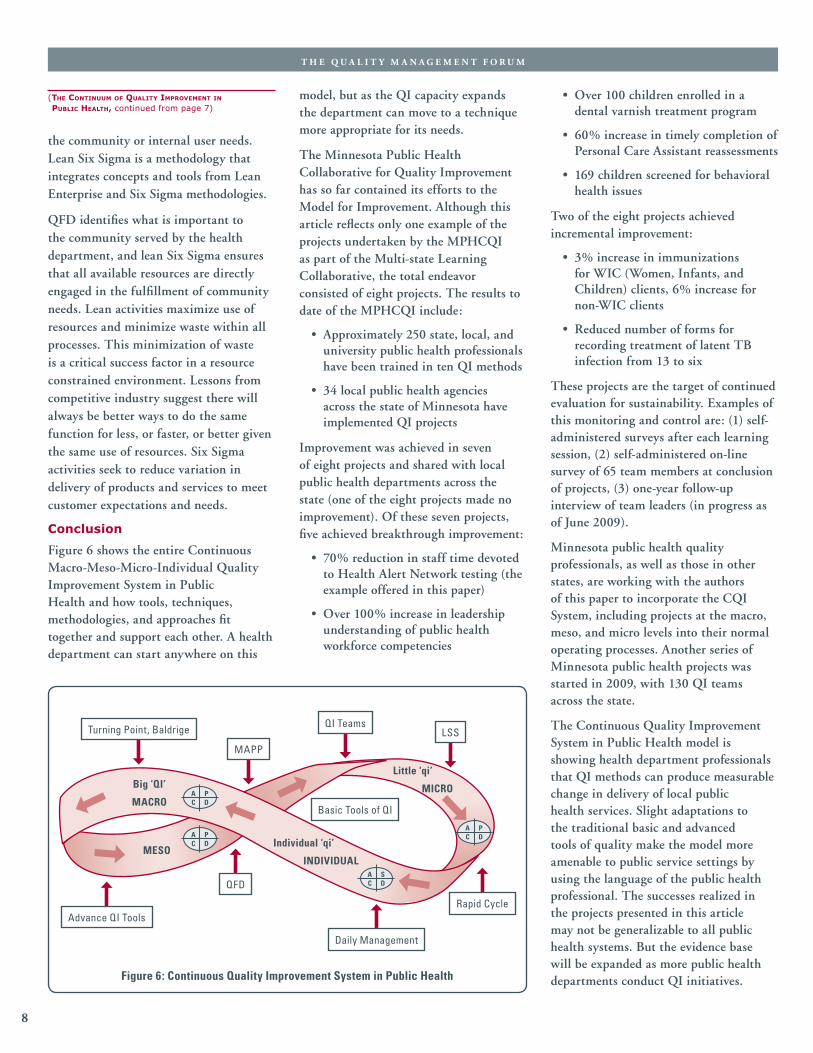
The current state map provided the base of team discovery for the problem statement and development of a cause-and-effect diagram shown in Fig. 4. The brainstorming of issues involved with conducting the HAN test led to an affinity exercise to identify five symptom
(The ConTinuum of QualiTy improvemenT in publiC healTh, continued from page 5)
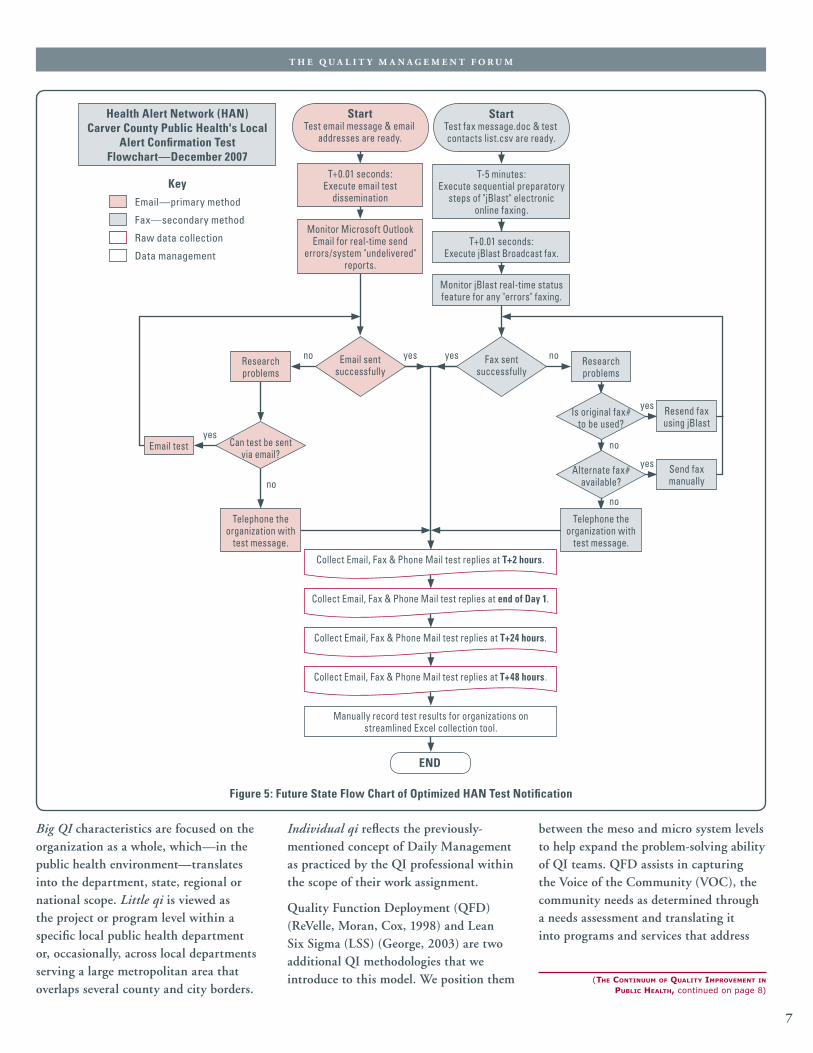
listed in the PDSA table decreased the cycle time of the test process by 2 and 5 hours respectively. Figure 5 is a representation of a process redesign that netted a 70% decrease in staff time devoted to a HAN test.
QI in an organization can start top down, bottom up, or both simultaneously. As QI becomes the norm in an organization, we start to see Individual qi beginning to appear in daily work. Daily Management is the use of Individual qi to make improvements to daily work; in other words, it becomes a habit. Daily Management is the over-arching philosophy of incremental change in the day-to-day work we all do to meet the needs of the client and the community. It is a cornerstone of the Continuum of Quality Improvement in Public Health. People doing the work have to make daily incremental improvements to constantly keep up with shifting public health needs (Bialek, Duffy, Moran, 2009).
Big QI, Little qi and Individual qi
A transformational change occurs when QI is based on a comprehensive approach starting at the macro level (Big QI) using a model such as Turning Point or Baldrige that describes an overall method to manage a Public Health department.
categories related to the problem statement of: “Too much staff time to conduct HAN test”:
• Policies
• Procedures
• Plant/Technology
• Measurement
• People
Analysis of the symptoms listed in the cause-and-effect diagram shown in Fig. 4 led to the selection of three priority opportunities for improvement. Table 3 identifies the three interventions chosen by the Carver County improvement team and the resulting changes to the Alert Test process.
As noted in Table 3, one intervention, that of assigning two people to log replies from the locations receiving the test alert, made no change in the cycle time of the activity. The two other interventions
Too much staff time to conduct HAN test
Procedures
Lack of written procedure
Incorrect contact information
Need to monitor responses
Tracking actual time fax received
Policies
Lack of agency policy
Changes in required list of recipients
Grant requirements change
Fax machine slow
Can't send corrected faxes through JBlast
Need to resend as corrections made
Plant/Technology
People
Recipients not oriented to the HAN process
Limited staff
Only one person assigned
Measurement
Incorrect time stamps on faxes
Time changes don't get made
Logging results is tedious
Fax machine doesn't log fax responses
Problem Statement: Too much staff time to conduct a test of the Health Alert Network emergency communications system.
Figure 4: Carver County Local Alert Confirmation Test Cause & Effect
Table 3: PDSA—Carver County HAN Alert System Tests of Change
Intervention Result
Two people logging replies No change in staff time
Streamlined Excel spreadsheet Decrease of 2 hours
Revised reply form (email and fax) and decreased monitoring of faxes
Decrease of 5 hours
T H E Q U A L I T Y M A N A G E M E N T F O R U M
7
Individual qi reflects the previously-mentioned concept of Daily Management as practiced by the QI professional within the scope of their work assignment.
Quality Function Deployment (QFD) (ReVelle, Moran, Cox, 1998) and Lean Six Sigma (LSS) (George, 2003) are two additional QI methodologies that we introduce to this model. We position them
between the meso and micro system levels to help expand the problem-solving ability of QI teams. QFD assists in capturing the Voice of the Community (VOC), the community needs as determined through a needs assessment and translating it into programs and services that address
(The ConTinuum of QualiTy improvemenT in publiC healTh, continued on page 8)
Big QI characteristics are focused on the organization as a whole, which—in the public health environment—translates into the department, state, regional or national scope. Little qi is viewed as the project or program level within a specific local public health department or, occasionally, across local departments serving a large metropolitan area that overlaps several county and city borders.
END
StartTest email message & email
addresses are ready.
T+0.01 seconds: Execute email test
dissemination
Monitor Microsoft Outlook Email for real-time send
errors/system "undelivered" reports.
StartTest fax message.doc & test contacts list.csv are ready.
T-5 minutes: Execute sequential preparatory
steps of "jBlast" electronic online faxing.
Monitor jBlast real-time status feature for any "errors" faxing.
T+0.01 seconds: Execute jBlast Broadcast fax.
Email sent successfully
Fax sent successfully
Can test be sent via email?
Research problems
Email test
Research problems
Is original fax# to be used?
Alternate fax# available?
Resend fax using jBlast
Send fax manually
Telephone the organization with
test message.
Telephone the organization with
test message.
Collect Email, Fax & Phone Mail test replies at T+2 hours.
Collect Email, Fax & Phone Mail test replies at end of Day 1.
Collect Email, Fax & Phone Mail test replies at T+24 hours.
Collect Email, Fax & Phone Mail test replies at T+48 hours.
Manually record test results for organizations on streamlined Excel collection tool.
Health Alert Network (HAN)Carver County Public Health's Local
Alert Confirmation Test Flowchart—December 2007
Key Email—primary method
Fax—secondary method
Raw data collection
Data management
yes
no yes
yes
no
no
no
yes
yes
no
Figure 5: Future State Flow Chart of Optimized HAN Test Notification
T H E Q U A L I T Y M A N A G E M E N T F O R U M
8
the community or internal user needs. Lean Six Sigma is a methodology that integrates concepts and tools from Lean Enterprise and Six Sigma methodologies.
QFD identifies what is important to the community served by the health department, and lean Six Sigma ensures that all available resources are directly engaged in the fulfillment of community needs. Lean activities maximize use of resources and minimize waste within all processes. This minimization of waste is a critical success factor in a resource constrained environment. Lessons from competitive industry suggest there will always be better ways to do the same function for less, or faster, or better given the same use of resources. Six Sigma activities seek to reduce variation in delivery of products and services to meet customer expectations and needs.
Conclusion
Figure 6 shows the entire Continuous Macro-Meso-Micro-Individual Quality Improvement System in Public Health and how tools, techniques, methodologies, and approaches fit together and support each other. A health department can start anywhere on this
(The ConTinuum of QualiTy improvemenT in publiC healTh, continued from page 7)
• Over 100 children enrolled in a dental varnish treatment program
• 60% increase in timely completion of Personal Care Assistant reassessments
• 169 children screened for behavioral health issues
Two of the eight projects achieved incremental improvement:
• 3% increase in immunizations for WIC (Women, Infants, and Children) clients, 6% increase for non-WIC clients
• Reduced number of forms for recording treatment of latent TB infection from 13 to six
These projects are the target of continued evaluation for sustainability. Examples of this monitoring and control are: (1) self-administered surveys after each learning session, (2) self-administered on-line survey of 65 team members at conclusion of projects, (3) one-year follow-up interview of team leaders (in progress as of June 2009).
Minnesota public health quality professionals, as well as those in other states, are working with the authors of this paper to incorporate the CQI System, including projects at the macro, meso, and micro levels into their normal operating processes. Another series of Minnesota public health projects was started in 2009, with 130 QI teams across the state.
The Continuous Quality Improvement System in Public Health model is showing health department professionals that QI methods can produce measurable change in delivery of local public health services. Slight adaptations to the traditional basic and advanced tools of quality make the model more amenable to public service settings by using the language of the public health professional. The successes realized in the projects presented in this article may not be generalizable to all public health systems. But the evidence base will be expanded as more public health departments conduct QI initiatives.
model, but as the QI capacity expands the department can move to a technique more appropriate for its needs.
The Minnesota Public Health Collaborative for Quality Improvement has so far contained its efforts to the Model for Improvement. Although this article reflects only one example of the projects undertaken by the MPHCQI as part of the Multi-state Learning Collaborative, the total endeavor consisted of eight projects. The results to date of the MPHCQI include:
• Approximately 250 state, local, and university public health professionals have been trained in ten QI methods
• 34 local public health agencies across the state of Minnesota have implemented QI projects
Improvement was achieved in seven of eight projects and shared with local public health departments across the state (one of the eight projects made no improvement). Of these seven projects, five achieved breakthrough improvement:
• 70% reduction in staff time devoted to Health Alert Network testing (the example offered in this paper)
• Over 100% increase in leadership understanding of public health workforce competencies
Big ‘QI’
MACRO
MESO
Little ‘qi’
MICRO
Individual ‘qi’
INDIVIDUAL
Basic Tools of QI
Turning Point, Baldrige
MAPP
QI TeamsLSS
Daily Management
Rapid Cycle
QFD
Advance QI Tools
AC
PD
AC
PD
AC
PD
AC
SD
Figure 6: Continuous Quality Improvement System in Public Health
T H E Q U A L I T Y M A N A G E M E N T F O R U M
9
Inc. Dr. Moran was employed for 21 years by Polaroid, where he held various senior management positions. He can be reached at [email protected]. His mailing address is 40 Mast Cove Road, PO Box 335, Eliot, Maine 03903.
William Riley, PhD, is an associate dean at the School of Public Heath, University of Minnesota. He specializes in quality improvement, quality control and safety. He teaches healthcare quality improvement, finance and process control. Dr. Riley has over 20 years experience as a senior executive and has held the position of president and CEO of several health care organizations, including an integrated delivery system; a large multi-specialty medical group; and a health plan joint venture. He is the author of numerous studies and articles related to quality control in public health. He can be reached at [email protected]. His mailing address is William Riley, PhD, Associate Dean,School of Public Health, University of Minnesota, D305 Mayo, MMC 819, 420 Delaware Street SE, Minneapolis, MN 55455.
Kim McCoy, MS, MPH, is a principal planning specialist at the Minnesota Department of Health. She is the Minnesota coordinator for the Multi-state Learning Collaborative program. She has worked in federal, state, and local public health and began her public health career as a Presidential Management Fellow at the Centers for Disease Control and Prevention. Kim holds an MPH in Public Health Administration, an MS in Health Services Research—University of Minnesota. Kim may be reached at [email protected]. Her mailing address is Principal Planning Specialist, Minnesota Department of Health, Office of Public Health Practice Golden Rule Building, Suite 220, PO Box 64882, St. Paul, MN 55164-0882.
John W. Moran, MBA, PhD, CMC, CMQ/OE, is senior quality advisor to the Public Health Foundation. He has over 30 years of quality improvement expertise. Dr. Moran is a retired senior vice-president of information systems, administrative and diagnostic services at New England Baptist Hospital. He was previously chief operating officer of Changing Healthcare,
management,The Public Health Quality Improvement Handbook.Milwaukee,WI:ASQQualityPress,pp.1-14
Deming,W.E.(1982).Out of the Crisis.MIT,p.88
George,M.L.(2003).Lean Six Sigma for Service.NewYork:McGrawHill.
Green,C.G.,Harison,M.,Henderson,K.,Lenihan,A.(1998).Atotalqualitymanagementinthedeliveryofpublichealthservices:AfocusonNorthCarolinaWICPrograms.Journal of Public Health Management Practices,4(72):81.
Langley,J.G.,Nolan,K.M.,Nolan,T.W.;Clifford,L.N.;Provost,L.P.(1996).The Improvement Guide: A Practical Approach to Enhancing Organizational Performance.Sadbury,MA:Jossey-Bass.
Langley,G.J.;Nolan,K.M.;Nolan,T.W.,Norman,C.L.,Provost,L.P.(2009)The Improvement Guide: A Practical Approach to Enhancing Organizational Performance.2nded.SanFrancisco,CA:Jossey-Bass.
Riley,W.,Moran,J.W.,Corso,L.,Beitsch,L.,Bialek,R.,Cofsky,A.(2009).DefiningqualityimprovementinpublicHealth.”Journal of Public Health Management and Practice.February2010
Riley,W.,McCoy,K.,(2009).QI Collaboratives for a Healthier Minnesota.WorldConferenceonQualityandImprovement,SessionW06,Minneapolis,MN
Thingstad-Boe,D.,Riley,W.,Parsons,H.“ImprovingServiceDeliveryinaCountyHealthDepartmentWICClinic:AnApplicationofStatisticalProcessControlTechniques.”American Journal of Public Health,September2009;V99:pp.1619-1625.
Grace L. Duffy, CMQ/OE, CQA, CQIA, CLSSMBB, provides services in organizational and process improvement, leadership, quality, customer service and teamwork. Her clients include government, healthcare, public health, education, manufacturing, services and not-for-profit organizations. She is co-author of The Quality Improvement Handbook; The Executive Guide to Improvement and Change; The Public Health Quality Improvement Handbook; and Executive Focus: Your Life and Career. Grace holds a Masters in Business Administration from Georgia State University. She is an ASQ Fellow and Past Vice President of ASQ. Grace can be reached at [email protected]. Her mailing address is 3203 Antigua Bay Lane, Tavares, FL 32778.
For information on advertising in the Forum, contactBruce DeRuntz, Editor, at [email protected]
A Quality Investment
Advertising in the Quality Management Forum
Business Card 3.687" x 2.187" .......................................$125 per issue
1/4 Page-Vertical 3.687" x 4.594" .......................................$475 per issue
1/2 Page-Horizontal 7.657" x 4.594" .......................................$750 per issue
Full page 7.657" x 9.188" ..................................... $1350 per issue
T H E Q U A L I T Y M A N A G E M E N T F O R U M
1 0
about…”; “Did you consider…”. But this time, they are interested in learning more only in order to find ways to stop the change from happening.
3. Level Three: “I understand, but I don’t like you!” It is unusual for all personalities in an organization to meld together without stress and disagreements, so you may not be everyone’s best friend. This level is much harder to deal with, but as a leader of change, you must successfully handle this kind of resistance as well. What you need to understand is that the questions you get from this level sound amazingly like the first two levels: “Would you say more about….”; “Have you thought about…”; “Did you consider…”.
4. Level Four: “I understand it, but you’re evil!” This is a level we seem to be discovering more and more in industry. Whether it is due to politics, union labor vs. management, or clashes of ethnic backgrounds, there seems to be a (thankfully) small subset of employees in companies who just refuse to understand and/or believe what leadership is saying. The bad news is that this group will nod their heads and seem to understand and agree with you—until they get out of the room and can start a covert resistance movement.
Planning for Change
In order to be able to handle all types of resistance, to get the early adopters and natural leaders working toward implementation, and to get the program off the ground, here are six questions you need to ask yourself:
1. Does my leadership/staff understand the program and the reason(s) for implementing it?
2. Is there a high-quality communication plan in place to let the entire program/business know the details?
3. Are there well-defined strategic and tactical plans for how the program will be implemented?
4. Is there a plan to get middle management involved early and often?
5. Are there clearly defined roles and responsibilities for the implementation?
6. Is there a well-thought-out metrics plan in place with milestones and with consequences for not meeting goals?
Once these questions are answered affirmatively, it all comes down to you and your leadership style to make it happen.
Does my leadership/staff understand the program and the reason(s) for implementing it? It is imperative that you have
In these times of economic unrest, it is extremely difficult to maintain the status quo in your business processes and still positively impact the bottom line. Doing nothing to improve the business of doing business can be the quickest way to bankruptcy. You need to do something to change things! The really scary part is that the success or failure of the entire change implementation may be all about you.
So, you have made a decision that something has to change to keep your program from being cancelled or your business from going under. You’ve read the books, been through a couple of classes, and have made a decision to implement some kind of continuous improvement program.
You also recognize that the hardest issue you face is the culture of your own program/company. By its very nature, that culture is a product of your past successes, and many employees won’t immediately see the necessity for change.
Change Is Not Comfortable
There are five stages of change that most of us, including innovators and early adopters, go through:
1. Awareness that change is coming
2. Interest in seeing change happen
3. Personal evaluation of the change
4. The decision to try it out in one small area
5. Adoption of the change
In order to minimize some of the resistance, anyone who is trying to make wide-scale change happen must address these concerns prior to beginning the implementation.
Resistance will happen. In order to be successful in spite of employees’ natural opposition to change, you will need to understand the four levels of resistance and how to handle each level (adapted from Maurer’s Why Don’t You Want What I Want [2002]).
1. Level One: “I don’t understand.” This is a request for more information. The questions you’ll receive at this level sound like, “Would you say more about….”; “Have you thought about….”; and “Did you consider….” This is the only level where a PowerPoint presentation will help. You should be prepared to say the same thing several different ways in order to suit the many adult learning styles.
2. Level Two: “I understand, but I don’t like it” Interestingly enough, the questions you get at this level sound like, “Would you say more about….”; “Have you thought
Yes, It Really is All About YouBy Sandy Miller
T H E Q U A L I T Y M A N A G E M E N T F O R U M
1 1
were changing, as well as the employees we were using to make the changes. They have to know the why, how, and who in order to give their support.”
Are there clearly defined roles and responsibilities for the implementation? Almost as important as having a tactical plan is knowing who is going to make that plan happen. You cannot possibly do all that needs to be done yourself, so think about whom you can tap for each role in the implementation. You need to look for the natural leaders in your organization, if possible. These are the people everyone turns to when there is a problem that needs to be solved. This is not the place to use those individuals in the organization whom managers can afford to let go of. If these people are going to save the business, you want someone you can trust to make the right decisions. If people aren’t busy enough in their jobs, there is usually a reason having to do with trust in their ability. If you cannot trust them to do the job they were hired for, can you trust them to lead a huge culture change?
Is there a well-thought-out metrics plan in place with milestones and with consequences for not meeting goals? How are you going to measure success? Don’t fall into the trap of equating activity with success! Just because people are busy does not mean the bottom line is being impacted. Implementation success should be measured much like rolled throughput yield. Each project or event should be held to the same standards, and then the yield percentage of successful sustainment of each project/event should be multiplied to create an overarching sustainment percentage for the implementation.
The final part of Question #6 involves consequences, aka accountability. For today’s change leader, this is where the buck stops. Before the beginning of the implementation, carefully consider what you are going to do to enforce the goals and objectives you have decided are the right ones. There will be resistance—most likely from all levels—so how are you going to handle it? Will you treat resistance from your staff the same as you do resistance from an hourly employee? If a team really tries, but doesn’t make the goals for the event, what will your response be?
Tools to Sustain Change
Here are a couple of tools that can help:
1. Performance Evaluations: Put specific, measureable goals for implementation on everyone’s performance evaluations. This, of course, lets all employees know that you are serious, and it also sends them the message of involvement and accountability.
2. S.M.A.R.T. Goals: For each and every project and/or event, make sure the goals are a stretch. It has been my experience that a team will strive for the goals they
(yes, iT really is all abouT you, continued on page 12)
your immediate staff at the top level of the organization on board. Remember, they have not had the time to think about it, understand it, or ask questions; so expecting them to blindly follow your great idea could drive them right into the cycle of resistance (Maurer 2002). They may not have done the studies or participated in the classes you have, so a certain amount of information dissemination is critical. This will usually be a one- to two-day overview, and it should be a high-level understanding of the principles and some level of practice with the tools you are going to use during the implementation, with time at the end for them to develop a tactical plan.
Is there a high-quality communication plan in place to let the entire program/business know the details? Communicate, communicate, communicate—you can never over-communicate. Some pieces of the communication plan should be:
1. What we’re doing
2. Why we’re doing it
3. What will happen if we don’t
4. What’s expected at each level
5. What’s in it for them (WIIFM)
The last one should be the focus of all. So tell them what they can expect if it works, and what they can expect if it doesn’t. Also, be sure to tell them in as many different media as possible: company newsletters, staff notes, company videos, signs on bulletin boards and doors into and out of the buildings, snail mail to their homes, and emails to their offices. It takes all of these and any other ideas you can garner to make sure the people who are going to be involved in the change hear the real story—directly from you.
Are there well-defined strategic and tactical plans on how the program will be implemented? As with any change in the direction of the business, once you have decided on the strategy you will use, you need to define the tactics that will be employed to make it happen. Are you going to select one area as a pilot? Will it be a program-wide/company-wide all ot nothing? Should you select instead more than one pilot—maybe one on the factory floor, one in the business organization, and one in engineering? It is your decision, but the plan needs to have milestones identified that will lead you to overall implementation.
Is there a plan to get middle management involved early and often? This sounds like a no-brainer, but many of the companies with which I work have stated that their number one lesson learned from implementation is this: “We knew we had support from the top down—the leadership of the company was on board from the start. We could also tell how involved the employees at the bottom were—they could see the impact the improvements had on their own jobs and wanted more. What we totally forgot was to include the people who owned most of the processes we
T H E Q U A L I T Y M A N A G E M E N T F O R U M
1 2
YOU make (or at least approve) the plan YOU communicate the plan YOU pick the players YOU measure the success YOU ensure accountability, and through it all YOU handle the resistance to change, after which,
YOU are the hero(ine) who saved the program/company!
ReferenceMaurer,Rick.(2002).Why Don’t You Want What I Want? How to Win Support for Your Ideas
without Hard Sell, Manipulation or Power Plays.Atlanta,GA:BardPress.
As President of X-Stream LEAN LLC and a Master Black Belt Sensei, Sandy Miller works with diverse customers for leadership coaching and mentoring, training (Green Belt and Black Belt), as well as facilitating process improvement events for government and industry organizations. Prior to X-Stream LEAN, Sandy spent 25 years in the aerospace and defense industry. Sandy can be reached at [email protected]. Her mailing address is X-Stream LEAN LLC, 31948 J Road, Hotchkiss, CO 81419.
are given. So if you give them a goal for cycle time improvement of 20%, they will typically reach about 22% and quit. However, if you give them a goal of 80%—and explain that you know it’s a stretch—but say that you have confidence in them getting there, they will usually reach the 80% + 8%. So even if they don’t make 80% (say only 72%) they’ve done great work!
Conclusion
Having participated in or led more than 52 full organizational implementations of change, I can confidently state that the entire success or failure of the change implementation is all about you:
YOU decide what needs to be done YOU ensure the considerations before change can be answered affirmatively
(yes, iT really is all abouT you, continued from page 11)
Visit the new QMD website at www.asq-qm.org
T H E Q U A L I T Y M A N A G E M E N T F O R U M
1 3
Quality Management Conference. There are 150 multiple-choice open book questions and two constructed response (i.e. essay) closed book questions during the four-hour exam, which is based on the Manager of Quality/Organizational Excellence Body of Knowledge (BoK) 2.
The Quality Management Division makes every effort to encourage and support CMQ/OE certification. For example, at step 2 (“Prepare for the exam”) under the Internet citation mentioned in the previous paragraph, several training courses and books are cited with links to get more information. Also, an interactive sample exam is available to help prospective examinees get a feel for what to expect and to help them determine which areas of the ASQ Body of Knowledge they need to study further. The sample also gives valuable tips for taking the exam.
QMD also makes available a PDF version of a brochure explaining the CMQ/OE certification at the following website: http://www.asq.org/pdf/certification/inserts/cmqoe-insert-2006.pdf.
(The manager of QualiTy/organizaTional exCellenCe, continued on page 14)
Looking for a better job or promotion, or just striving to improve your knowledge and skills? You should consider obtaining the Manager of Quality/Organizational Excellence Certification (CMQ/OE). Completing this certification is a great way to improve your chances for advancement, or just to make you a more confident, more knowledgeable, and more valuable manager. Furthermore, according to the most recent ASQ salary survey (December 2008), having this certification results in a difference in annual salary (on average) of more than $9,000.1 So there is no question that it pays to be certified!
The requirements for this certification can be found at http://www.asq.org/certification/manager-of-quality/index.html, and they are listed under step 1, which is titled “Is this the right certification for you?” If you meet the minimum education/experience and “expectation” requirements, you are ready to apply and prepare for the certification exam. The exam is conducted twice a year, in March and October, at local and international ASQ sites, plus at certain conferences such as the
The Certified Manager of Quality/Organizational ExcellenceBy Robert B. Austenfeld, Jr., PhD
A. Organizational Structures & Culture
B. Leadership Challenges
C. Teams & Team Processes
D. ASQ Code of Ethics
A. Strategic Planning Models
B. Business Environment Analysis
C. Strategic Plan Deployment
A. Management Skills & Abilities
B. Communication Skills & Abilities
C. Project Management
D. Quality Systems
E. Quality Models & Theories
A. Problem Solving Tools
B. Process Management
C. Measurement: Assessment & Metrics
A. Customer Identification & Segmentation
B. Customer Relationship Management
A. Supplier Selection
B. Supplier Communications
C. Supplier Performance
D. Supplier Improvement
E. Supplier Cert., Partnerships & Alliances
F. Supplier Logistics
A. Training Plans
B. Needs Analysis
C. Trng Mat/Curriculum Dev & Delivery
D. Training Effectiveness & Evaluation
Part I Leadership
Part II Strategic Plan Development &
Deployment
Part III Management Elements &
Methods
Part IV Quality
Management Tools
Part V Customer-Focused
Organizations
Part VI Supply Chain Management
Part VII Training &
Development
Certified Manager of Quality/Organizational Excellence
Body of Knowledge
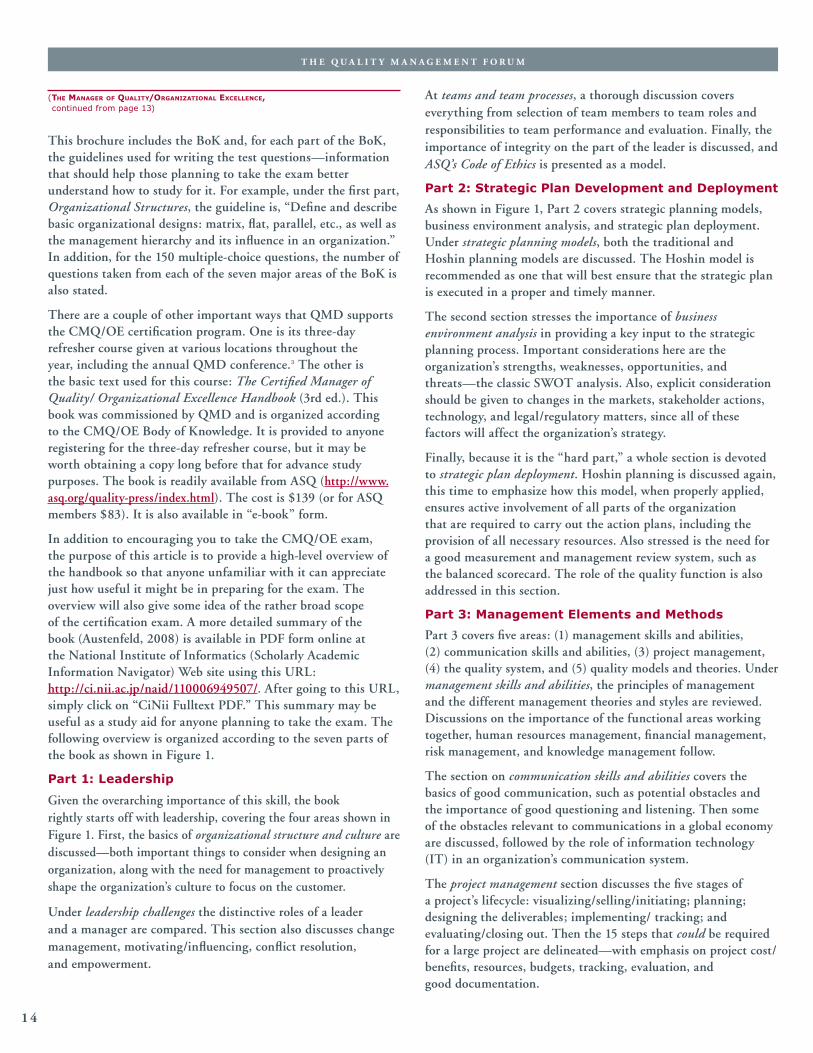
Figure 1: Outline of Westcott Book and the CMQ/OE Body of Knowledge
T H E Q U A L I T Y M A N A G E M E N T F O R U M
1 4
This brochure includes the BoK and, for each part of the BoK, the guidelines used for writing the test questions—information that should help those planning to take the exam better understand how to study for it. For example, under the first part, Organizational Structures, the guideline is, “Define and describe basic organizational designs: matrix, flat, parallel, etc., as well as the management hierarchy and its influence in an organization.” In addition, for the 150 multiple-choice questions, the number of questions taken from each of the seven major areas of the BoK is also stated.
There are a couple of other important ways that QMD supports the CMQ/OE certification program. One is its three-day refresher course given at various locations throughout the year, including the annual QMD conference.3 The other is the basic text used for this course: The Certified Manager of Quality/ Organizational Excellence Handbook (3rd ed.). This book was commissioned by QMD and is organized according to the CMQ/OE Body of Knowledge. It is provided to anyone registering for the three-day refresher course, but it may be worth obtaining a copy long before that for advance study purposes. The book is readily available from ASQ (http://www.asq.org/quality-press/index.html). The cost is $139 (or for ASQ members $83). It is also available in “e-book” form.
In addition to encouraging you to take the CMQ/OE exam, the purpose of this article is to provide a high-level overview of the handbook so that anyone unfamiliar with it can appreciate just how useful it might be in preparing for the exam. The overview will also give some idea of the rather broad scope of the certification exam. A more detailed summary of the book (Austenfeld, 2008) is available in PDF form online at the National Institute of Informatics (Scholarly Academic Information Navigator) Web site using this URL: http://ci.nii.ac.jp/naid/110006949507/. After going to this URL, simply click on “CiNii Fulltext PDF.” This summary may be useful as a study aid for anyone planning to take the exam. The following overview is organized according to the seven parts of the book as shown in Figure 1.
Part 1: Leadership
Given the overarching importance of this skill, the book rightly starts off with leadership, covering the four areas shown in Figure 1. First, the basics of organizational structure and culture are discussed—both important things to consider when designing an organization, along with the need for management to proactively shape the organization’s culture to focus on the customer.
Under leadership challenges the distinctive roles of a leader and a manager are compared. This section also discusses change management, motivating/influencing, conflict resolution, and empowerment.
At teams and team processes, a thorough discussion covers everything from selection of team members to team roles and responsibilities to team performance and evaluation. Finally, the importance of integrity on the part of the leader is discussed, and ASQ’s Code of Ethics is presented as a model.
Part 2: Strategic Plan Development and Deployment
As shown in Figure 1, Part 2 covers strategic planning models, business environment analysis, and strategic plan deployment. Under strategic planning models, both the traditional and Hoshin planning models are discussed. The Hoshin model is recommended as one that will best ensure that the strategic plan is executed in a proper and timely manner.
The second section stresses the importance of business environment analysis in providing a key input to the strategic planning process. Important considerations here are the organization’s strengths, weaknesses, opportunities, and threats—the classic SWOT analysis. Also, explicit consideration should be given to changes in the markets, stakeholder actions, technology, and legal/regulatory matters, since all of these factors will affect the organization’s strategy.
Finally, because it is the “hard part,” a whole section is devoted to strategic plan deployment. Hoshin planning is discussed again, this time to emphasize how this model, when properly applied, ensures active involvement of all parts of the organization that are required to carry out the action plans, including the provision of all necessary resources. Also stressed is the need for a good measurement and management review system, such as the balanced scorecard. The role of the quality function is also addressed in this section.
Part 3: Management Elements and Methods
Part 3 covers five areas: (1) management skills and abilities, (2) communication skills and abilities, (3) project management, (4) the quality system, and (5) quality models and theories. Under management skills and abilities, the principles of management and the different management theories and styles are reviewed. Discussions on the importance of the functional areas working together, human resources management, financial management, risk management, and knowledge management follow.
The section on communication skills and abilities covers the basics of good communication, such as potential obstacles and the importance of good questioning and listening. Then some of the obstacles relevant to communications in a global economy are discussed, followed by the role of information technology (IT) in an organization’s communication system.
The project management section discusses the five stages of a project’s lifecycle: visualizing/selling/initiating; planning; designing the deliverables; implementing/ tracking; and evaluating/closing out. Then the 15 steps that could be required for a large project are delineated—with emphasis on project cost/benefits, resources, budgets, tracking, evaluation, and good documentation.
(The manager of QualiTy/organizaTional exCellenCe, continued from page 13)
T H E Q U A L I T Y M A N A G E M E N T F O R U M
1 5
Part 5: Customer-Focused Organizations
Since one “definition” of quality is providing the customer products/service that not only satisfy but also delight, it seems most appropriate that one of the book’s seven main parts be devoted wholly to the customer. Part 5 is divided into two sections: (1) customer identification and segmentation and (2) customer relationship management. Regarding customer identification and segmentation, the book first stresses the importance of specifically identifying the organization’s internal and external customers as well as providing the support needed to ensure all these customers are truly satisfied. Then the section covers why an organization should segment and gives some suggestions on how best to carry it out.
The customer relationship management section addresses how to understand and anticipate customer needs, including the use of the quality function deployment (QFD), “house of quality,” and the listening post process. Following this discussion, the ways to measure customer satisfaction and increase loyalty are covered. This section concludes with ten steps for ensuring top-level customer service and the importance of being responsive to any special needs of different customers. Having everyone in the organization focused on customer satisfaction and the expeditious handling of customer complaints are stressed in this section.
Part 6: Supply Chain Management
This part and the one that follows (on training) are much shorter than the others but just as important. Since the quality of an organization’s supplies will obviously affect the quality of products/services, having good suppliers can make a critical difference. Part 6 discusses supplier selection, communications, performance, and improvement followed by supplier certification, partnerships and alliances, and finally supplier logistics. What follows here are examples of some key points that are covered.
In most cases an organization should have good supplier selection criteria based on such things as experience, past performance, and level of quality management. To avoid misunderstandings, it is best to spell out in writing the organization’s requirements, not only for the product itself but also for any others that apply (e.g., deliver, security, safety). An easy-to-understand supplier performance report is a way to provide important feedback to the supplier on how he/she is doing—an example is given. There are several ways to help the supplier improve, such as through joint preventive/corrective action programs and through provision of technical assistance. Certifying a supplier can reduce the transaction costs for delivery of consistently high-quality goods. Alliances/partnerships offer opportunities for “win-win” relationships with an organization’s suppliers. And a final “example” point is the importance of IT in ensuring the coordination of all parties in the supply chain.
(The manager of QualiTy/organizaTional exCellenCe, continued on page 16)
Part 3 concludes by discussing first the quality system an organization should have and then the various quality models and theories. The former covers the role of the quality manger in ensuring that a good quality system exists and that it is effective. Regarding the latter, the following models/methodologies are described: the Baldrige National Quality Program (BNQP), ISO 9001 and other third-party standards, total quality management (TQM), and continuous quality improvement (CQI). Finally, the philosophies of major contributors to the quality movement are addressed, such as those of Crosby, Deming, Feigenbaum, and Ishikawa.
Part 4: Quality Management Tools
Part 4 is broken down into problem solving tools, process management, and measurement: assessment and metrics. Under problem solving tools, various types are listed and described, such as the seven classic quality tools (e.g., the cause-and-effect diagram and the Pareto chart), basic management and planning tools (e.g., the affinity diagram and priorities matrix), process improvement tools (e.g., failure mode and effects analysis [FMEA] and statistical process control), and innovation and creativity tools (e.g., brainstorming and lateral thinking). This section concludes with a discussion of cost of quality (COQ) and the four categories of cost—internal failure, external failure, appraisal, and prevention.
The essence of good quality is having good processes. The section on process management begins with a discussion of process goals/objectives and process analysis. The latter is accomplished primarily through process mapping, which is described in detail. The section then goes on to list and describe 19 lean tools for improving processes (e.g., Five S, Kaizen blitz/event, and single-piece flow). The process management section concludes with a brief description of what might be termed more of a “system” improvement methodology: the theory of constraints (TOC) based on the need to concentrate on the “weakest link.”
Measurement: assessment and metrics begins with a general discussion of metrics and process measurement systems. This is followed by key points related to sampling and statistical analysis (sample size, risk in acceptance sampling, and the common measures of central tendency and variability). Next, trend and pattern analysis are covered, followed by theory of variation. Under the latter, the important concepts of common and special causes of variation are explained. This section concludes with a discussion of process capability (Cp and Cpk), data reliability and validity (closely related to the measurement instruments), the need for qualitative data, and the use of surveys.
T H E Q U A L I T Y M A N A G E M E N T F O R U M
1 6
Part 7: Training and Development
This final part of the handbook covers the all-important need for training and development that, along with things such as its knowledge management system, contribute to making the organization a truly “learning” one. Two important points are made at the outset. The first is the difference between education, which means gaining knowledge, and training, which means gaining one or more skills. Both are important, with education (learning facts and how to think) applying more as one goes further up the management chain. The second point is the need to constantly review the organization’s training needs in light of today’s rapid changes in technology and competition.
Part 7 then breaks down into discussions of training plans, needs analysis, training material/curriculum development and delivery, as well as training effectiveness and evaluation. Training plans should derive from the organization’s strategic plan; i.e., support some stated strategic goal such as improving customer satisfaction. When identifying training needs, one of the first questions to ask is if the “problem” is really due to a lack of training, since it could be that the system itself is the cause and therefore needs to be changed.
Under needs analysis, several things that could trigger a need for training are discussed. And, in the absence of such a trigger, ways to find out if certain training is needed anyway are covered. Once the need is established, a “checklist” set of questions is provided to ensure nothing is overlooked in formulating the training program.
Several tips for a successful training program are given under the training material/curriculum development and delivery section, such as letting those involved know how the training will personally benefit them and being sure there are specific and measureable learning objectives. This section also lists several alternatives to the traditional classroom/OJT methods of training.
Finally, the section on training effectiveness and evaluation describes the five levels of evaluation, ranging from the “smile” test usually given to the most rigorous level of measuring the actual monetary return to the organization on the training investment. This section also emphasizes the need to evaluate a training program continually—from its beginning—to ensure all phases from planning through execution to final outcomes are making sense and working towards the ultimate objective of the training.
(The manager of QualiTy/organizaTional exCellenCe, continued from page 15)
Conclusion
The purpose of this article has been two-fold. First, to encourage anyone who has not done so to consider becoming certified as a manager of quality/organizational excellence in order to, in the words of ASQ, “enhance your career and boost your organization’s bottom line.” It is also an excellent method of self-improvement, making yourself more “marketable,” and increasing your earning power. The second purpose has been to provide a high-level overview of The Certified Manager of Quality/Organizational Excellence Handbook (3rd ed.), the basic reference for the certification exam.
Robert B. Austenfeld, Jr. served 25 years in the Marine Corps as a communications officer. Upon retirement in 1985, Bob returned to school to get his PhD in education from the University of Southern California. Following this, he worked for McDonnell Douglas for over three years, first as a procedures analyst and then as a group leader. In 1993, Bob received an MBA from Pepperdine University and also joined the faculty of Commercial Sciences of Hiroshima Shudo University, teaching business strategy, management, TQM, and international communications. He holds CQM/OE certification. Bob can be reached at [email protected]. His mailing address is #204 4-11-30, Sumiyoshi-yama te, Higashinada-ku, Kobe 658-0063, Japan.
T H E Q U A L I T Y M A N A G E M E N T F O R U M
1 7
Why have so many attempts at business transformation failed? Can it be the continuous improvement paradigm itself? Based on the current state as the frame of reference, this paradigm shapes an expectation of incremental change rather than business transformation. What if the frame of reference were a perfect end state? A leadership strategy based on this paradigm would target perfection rather than improvement, to maximally position both individuals and businesses to become excellent (May, 2007; Liker, 2004).
The new paradigm would target an optimized system that transfers value to all stakeholders at the lowest overall cost. The pursuit of this perfect end state would drive a belief that there are limitless opportunities for refinement. Although perfection can never be fully realized, its pursuit can inspire a drive for excellence.
The pursuit of perfection can be distinguished from perfectionism. Perfectionism is retrospective and judgmental in its point of view. It devalues what has already been done because it is not perfect. The pursuit of perfection is prospective and nonjudgmental. It asks the question, What choices should be made today to move closer to the perfect end state?
However, aiming for perfection is not enough, since it also requires a rigorous focus on the means to achieve it and sustained commitment. The most solid foundation for business success involves promoting a culture of excellence, which can be assessed by three questions:
1. What is the organizational aim: perfection or improvement?
2. What method will be used to achieve that aim: by means or by ends?
3. What type and level of commitment is being fostered: sustained or situational?
The answers to these questions determine the organization’s focus and sets into motion a series of consequences that shape the organization’s culture.
Most organizations aim to improve, and this pursuit is fundamentally different from the pursuit of perfection. This difference has cultural and organizational implications. Specifically, many methods and commitment levels are compatible with an improvement imperative, yet almost all are incompatible with the pursuit of perfection.
Closely tied to this is the role of transformational leadership, which uses inspiration as its currency. Inspirational leaders describe the path to a perfect end state and make a compelling invitation to others to partner on the journey. They place members of the organization within an inspiring vision in which they see their personal development as being aligned with an overarching organizational pursuit of perfection. Arguably, then, one measure of the success of a leader is the extent to which individuals commit to sustained personal development as part of their role in the organization.
What is the Organizational Aim: Perfection or Improvement?
Leadership targets perfection by defining, understanding, and concentrating on the flow of value to customers. Value is defined by the customer and represents any transformation in a product or service that the customer is willing to pay for and that is done right the first time. It’s the “done right the first time” part that implies that the customer expects perfection.
Perfection Focus
Seeing the flow of value through a business is the first step in aiming for a perfect end result. The aim should be to understand, from the systems to the process level, how the structure of work affects process outcomes, and how the outcomes constrain or support value creation. If leadership substitutes any other short-term business target for value, then that target will obscure the organization’s capacity to see how value is actually created.
Long-term, the objective is to create a system that optimizes the value-transfer process for all stakeholders at the lowest overall cost. Such a system would target perfection by using metrics that measure the speed with which value is created. Such metrics would drive leaders to focus on the relationship between time and quality. The practical effect would be to concentrate on reducing process and product variability, driving down waste and cycle time concurrently. This represents the classic business transformation to an agile, adaptable, and responsive lean enterprise.
Process knowledge increases as the organization concentrates on creating customer value. To understand the value stream, an organization needs to improve systems thinking, teaming skills, and communication across functions. While necessary, these activities may not realize immediate gains. Since the long-term focus is to increase the speed with which value is created, the consequences of developing a highly efficient value stream can be a sustainable competitive advantage, as operational excellence becomes a differentiating factor in the marketplace.
(aiming for perfeCTion: an exploraTion of leadership and exCellenCe, continued on page 18)
Aiming for Perfection: An Exploration of Leadership and ExcellenceBy James E. Braggs and Robert D. Lesniak
T H E Q U A L I T Y M A N A G E M E N T F O R U M
1 8
Process capability can be thought of as the probability that a process will pass on a perfect result to the customer (Johnston and Broms, 2000).
Means Approach
When process measurement is initiated, the first discovery is that few processes are stable and capable. Capable processes are the consequence of intentional management decisions and do not occur by chance. Management by means is the first step to bringing stability and capability to a collection of business processes. Long-term, the measurement of a series of processes can be used to understand and improve systemic capability: the probability that a series of processes will approach a perfect customer outcome.
Leaders target systemic capability by creating and connecting highly capable processes across the value stream. In so doing, they develop a deep understanding of how individual and aggregate business capabilities combine to transfer value to stakeholders. This understanding enables leaders to see the entire business as a system, aiming to optimize the entire system over time (Deming, 1993).
Ends Approach
In contrast, leaders who choose not to focus on establishing process capability end up focusing on process outcomes by default. They implicitly accept instability as normal and crises as inevitable. This is a logical consequence of managing by ends—attempting to manage the results of a process. The focus is on the scoreboard rather than on the fundamentals. There is a drive to achieve the ends whether the means enable it or not, which leads to setting arbitrary targets that may not be rational. Long-term, when a process is managed by ends, there is a tendency to concentrate on distinguishing between good and bad performance. This might lead to addressing only the weak areas of the business.
In the same way, targeting perfection at the personal level is synonymous with the pursuit of excellence, which must be desired and chosen. The conscious choice to work on becoming excellent may begin in small ways by doing excellent work, or may begin with a larger dream or personal vision. The more passion and energy this vision evokes, the greater the motivation to align choices with this vision. Pursuing excellence, then, involves consistently reflecting a high personal standard in one’s work. A long history of excellent work becomes the distinguishing mark or personal legacy of the individual.
In contrast, when people seek to simply improve, they emphasize incremental change targeting improvement over their current state. As long as positive change is observed, then the movement forward is considered legitimate, whether that change approximates their potential or not. Long-term, this perspective is validated by clear evidence of personal growth.
What Method Will be Used to Achieve that Aim: By Means or by Ends?
Management by means involves examining the quantifiable behavior of processes and determining whether that process behavior is capable of meeting customer requirements. Doing this requires an understanding of the cause-and-effect relationships between processes and their resulting customer value.
Improvement Focus
By contrast, when improvement is the focus, leadership concentrates on change over a baseline. The emphasis is on the current condition as a framework for organizing improvement. Targets or benchmarks are set relative to the baseline, whether they are rational or not. In other words, leadership can target improvements that may not add value from the customer’s perspective. Therefore, improvement alone—separate from value creation—is insufficient to create or sustain competitive advantage.
Further, when inward-looking organizational metrics take precedence over value creation, they drive short-term results, but often at the expense of process knowledge. Consequently, learning cycle times must increase as process knowledge diminishes. The focus on short-term improvements over the baseline will reinforce the improvement imperative yet obscure the extent to which the knowledge base is reduced—a knowledge base necessary to build a sustainable future.
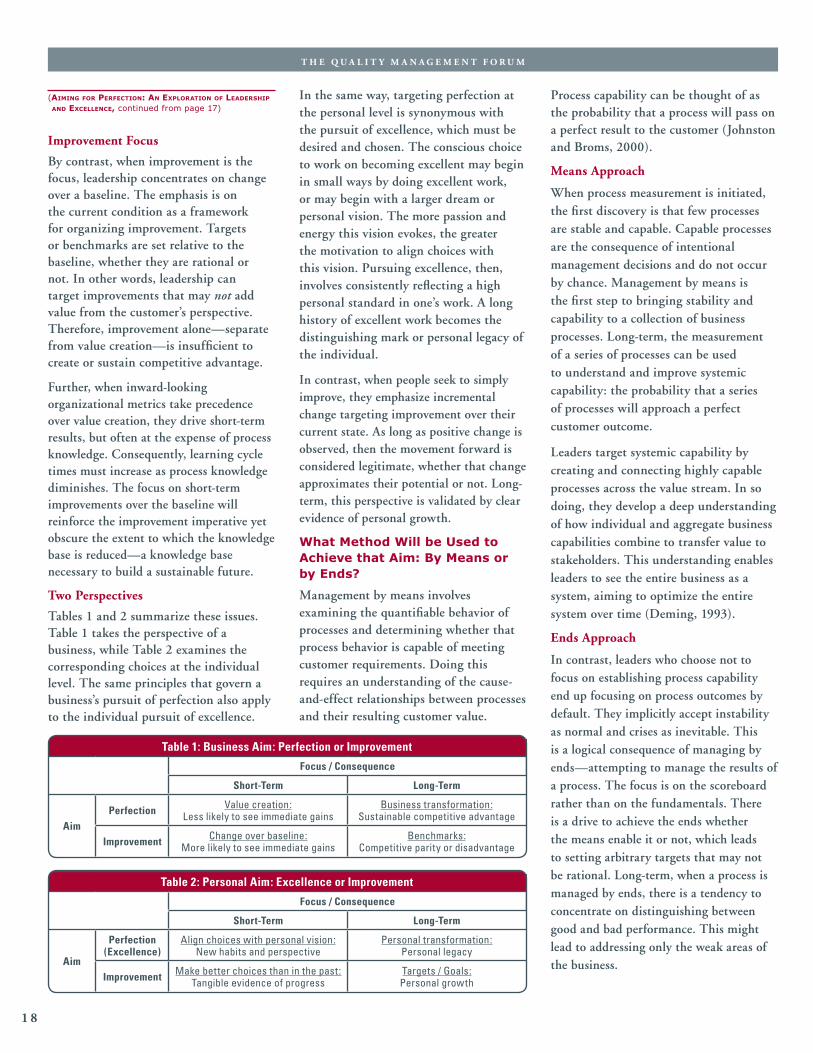
Two Perspectives
Tables 1 and 2 summarize these issues. Table 1 takes the perspective of a business, while Table 2 examines the corresponding choices at the individual level. The same principles that govern a business’s pursuit of perfection also apply to the individual pursuit of excellence.
(aiming for perfeCTion: an exploraTion of leadership and exCellenCe, continued from page 17)
Table 2: Personal Aim: Excellence or Improvement
Focus / Consequence
Short-Term Long-Term
Aim
Perfection (Excellence)
Align choices with personal vision: New habits and perspective
Personal transformation: Personal legacy
Improvement Make better choices than in the past: Tangible evidence of progress
Targets / Goals:Personal growth
Table 1: Business Aim: Perfection or Improvement
Focus / Consequence
Short-Term Long-Term
AimPerfection Value creation:
Less likely to see immediate gainsBusiness transformation:
Sustainable competitive advantage
Improvement Change over baseline:More likely to see immediate gains
Benchmarks: Competitive parity or disadvantage
T H E Q U A L I T Y M A N A G E M E N T F O R U M
1 9
Because the character of sustained commitment may not result in dramatic short-term results, leaders must resist the temptation to waiver from the vision. They must lead by example and model sustained commitment even in the face of difficulty. By doing so, they demonstrate integrity and coherence through their leadership.
Situational
In contrast, situational commitment levels vary with business interests and shifting priorities. The leadership may exhibit visible signs of commitment, such as slogans or exhortations, rather than the substance of that commitment—behavior consistent with correct principle over time.
Situational commitment is focused on activities that target quick results. Although near term successes may be realized, such results may not be in the best interest of the company. Situational commitment can lead to episodic rates of improvement characterized by declines and plateaus. Because situational commitment will tend to fade over time, real sustainable improvements become rare. Without deep process knowledge, explanations for events may be offered without rational empirical evidence or understanding.
Two Perspectives
Tables 5 and 6 summarize the implications of commitment levels. Table 5 takes the perspective of a business, while Table 6 examines the corresponding choices for individuals. The same leadership question confronts both individuals and businesses: What type of commitment is being fostered—sustained or situational?
Again, individuals who pursue excellence sustain their commitment over time. They commit to doing all tasks well, even when the tasks are difficult. They stay focused in the face of setbacks or hardships and seldom count the cost of their commitment. They view achievements
What Type of Commitment is being Fostered: Sustained or Situational?
When a business commits to establishing a culture of sustained excellence, it must commit to preparation. The goal is to build a collective and individual willingness to persevere through difficulty, speak the truth, question assumptions, and cultivate a diversity of perspectives that can be harnessed to serve the needs of the business. Leaders must concentrate on building infrastructure that enables. Training, resources, and staffing must visibly reflect the commitment of leadership at the highest levels to transform the organization.
Sustained
Deming‘s first rule was “Establish Constancy of Purpose,” the idea that quality is achieved only with a sustained commitment. Deming viewed sustained commitment as a central tenet of business excellence (Deming, 1986).
The hallmark of a sustained commitment is behavior that is consistent with correct principle over time. Leadership actions are always under observation; inconsistencies between words and deeds are picked up quickly. In large measure, an organization learns to sustain its commitment through the actions of its leaders over time.
Dr. W. Edwards Deming argued against a management strategy centered on meeting arbitrary targets at the expense of process knowledge (Deming, 1986). Strategies that are intended to position the company for long-term growth require a significant foundation of training, teaming, collaboration, and improved learning cycles.
Two Perspectives
Tables 3 and 4 summarize the implications of managing by means vs. by ends. Table 3 takes the perspective of a business, while Table 4 examines the corresponding choices for individuals. The same leadership question confronts both individuals and businesses: By which method are the goals to be realized?
Individuals who pursue excellence invest heavily in personal growth, committing to lifelong learning and development. They focus on mastering skills and competencies, realizing that the means to excellence is preparation. By contrast, individuals who focus on ends de-emphasize preparation, concentrating instead on achieving milestones and accomplishments. Measuring success according to whether the ends are met may lose the opportunity to gain new domain knowledge. Both approaches can result in achievements; but focusing on ends may not result in repeatable or sustainable performance.
(aiming for perfeCTion: an exploraTion of leadership and exCellenCe, continued on page 20)
Table 3: Business Method: By Means or by Ends
Focus / Consequence
Short-Term Long-Term
Method
By MeansProcess capability:
Process stability and capabilitySystemic capability:
Consistently meeting customer requirement
By EndsResults, numeric targets:
Clarity about good and bad performance
Weak areas of the business: Instability and crisis management
Table 4: Personal Method: By Means or by Ends
Focus / Consequence
Short-Term Long-Term
MethodBy Means
Personal mastery: New knowledge or skill
Lifelong learning:Domain expertise
By Ends Milestones and accomplishments: Gains may not be repeatable
High-leverage opportunities: Opportunity for new knowledge lost
T H E Q U A L I T Y M A N A G E M E N T F O R U M
2 0
that is objective and visible to the world. They must understand the means to attain that end state before they can invite others to partner on that journey. Armed with a clear path and strong conviction, the invitation can be persuasive—offering to show others how to become excellent. For such an invitation to be compelling it must both resonate and also place individuals within that vision; for example, “If I can show you how to become world class, to prove it where no one can dispute it, to separate yourself from all other teams, will you agree to partner with me?” If given a chance, most people will choose excellence.
Conclusion
Most companies today have invested considerable resources in developing and articulating vision statements that paint an inspiring picture of a perfect end state. While creating these visions, leaders seldom consider that by embracing the improvement model, they may undermine their own vision.
By embracing the improvement model without question, leaders deflect attention away from the vision since the frame of reference is the current state. Leaders inevitably shape an organizational culture that relies on tactical improvement strategies that focus on incremental improvement over baseline. Consequently, the culture that emerges may not enable the business to create a sustainable future.
Leaders must think deeply about the implications of pursuing perfection rather than improvement. Obviously, there are many possible paths that a leader can choose. However, only one path is compatible with aiming for perfection. To aim for perfection, one must focus on means and foster sustained commitment. All other paths merely target improvement.
Leadership is about making choices. A leader will choose to pursue excellence or improvement, to manage by means or by ends, and to encourage sustained or situational commitment. A leader’s effectiveness can be measured by the extent to which individuals in
inspiring vision in which they see their development as being aligned with an overarching organizational pursuit of perfection. The result is that a high proportion of the company’s employees will embrace sustained personal excellence and apply that mindset to the exigencies of business performance.
Inspirational leaders, therefore, attempt consciously to connect people’s individual interests with something larger than themselves. By providing a deeper meaning or purpose for their actions, they seek to evoke a passionate, sustained commitment to excellence. The highest leverage of an inspirational vision occurs when leaders themselves believe that the vision is attainable. When they strongly believe in the vision, they present more compelling arguments for the pursuit of excellence, and they are more likely to inspire others. Those who have been inspired then become leaders themselves, able to inspire merely by the force of their convictions, or by the evidence of their sustained commitment. This is the infectious nature, the force multiplier, of inspirational leadership.
All of this is based on the premise that given a choice and a clear path, most people will choose excellence. Leaders must paint a clear, unambiguous end state
as opportunities for further growth and development. Over time, their personal commitment to excellence is incorporated into their self-definition: excellence is no longer just what they do; it becomes part of who they are (May, 2007).
By contrast, individuals with situational commitment want to realize achievement without personal change. Examples would be losing weight by crash dieting or cramming for an exam. They may realize some near-term gains or improvement, but they will likely experience wide variation in performance, and their gains will likely be unsustainable.
Inspirational Leadership: An Invitation to Become Excellent
Inspirational leaders describe the path to a perfect end state and make a compelling invitation to others to partner on the journey. “When there is a genuine vision (as opposed to the all-too-familiar ‘vision statement’), people excel and learn, not because they are told to but because they want to” (Senge, 1990).
Leaders create a culture of excellence by nurturing an environment where individuals commit to sustained personal development as part of their role in the organization. Leaders place the members of the organization within an
(aiming for perfeCTion: an exploraTion of leadership and exCellenCe, continued from page 19)
Table 5: Business Commitment: Sustained vs. Situational
Focus / Consequence
Short-Term Long-Term
MethodBy Means
Personal mastery: New knowledge or skill
Lifelong learning:Domain expertise
By Ends Milestones and accomplishments: Gains may not be repeatable
High-leverage opportunities: Opportunity for new knowledge lost
Table 6: Personal Commitment: Sustained vs. Situational
Focus / Consequence
Short-Term Long-Term
MethodBy Means
Personal mastery: New knowledge or skill
Lifelong learning:Domain expertise
By Ends Milestones and accomplishments: Gains may not be repeatable
High-leverage opportunities: Opportunity for new knowledge lost
T H E Q U A L I T Y M A N A G E M E N T F O R U M
2 1
Robert D. Lesniak is a quality systems specialist with The Boeing Company in Long Beach, California, where he has worked for 26 years. Robert received a bachelor's degree in industrial management from Purdue University and a master's degree in quality assurance from California State University, Dominguez Hills. He is an ASQ Certified Quality Engineer and an ASQ Certified Six Sigma Black Belt, and also serves on the Technical Program Committee for the ASQ World Conference. He can be reached at [email protected]. His mailing address is The Boeing Company, 2401 E. Wardlow Rd. Mailcode: C054-0069, Long Beach, CA 90807-5309.
James E. Braggs is a quality systems specialist with The Boeing Company in Long Beach, California, where he has worked for 19 years. James has a Lean Six Sigma Black Belt from the University of California, Irvine, and he teaches the UCI Lean Six Sigma Certificate programs leading to Green and Black Belts. James received a master's degree in sociology from the University of Hawaii and is pursuing a master's degree in statistics from California State University, Long Beach. He can be reached at [email protected]. His mailing address is The Boeing Company, 2401 E. Wardlow Rd. Mailcode: C078-0207, Long Beach, CA 90807-5309.
the organization feel free to pursue excellence. In the end, excellence is determined by the nature of the choices that are made by the leadership and embraced by the organization. The leader must target perfection, lead by means, and foster sustained commitment.
ReferencesDeming,W.E.(1986).Out of the crisis.Cambridge:MIT,
CenterforAdvancedEngineeringStudy.
Deming,W.E,(1993).The new economics for industry, government, education.Cambridge:MITPress.
Johnson,H.T,andBroms,Anders.(2000).Profit beyond measure: Extraordinary results though attention to work and people.NewYork:TheFreePress.
Liker,Jeffery.(2004).The Toyota way.NewYork:McGraw-Hill.
May,MatthewE.(2007).The elegant solution: Toyota’s formula for mastering innovation.NewYork:TheFreePress.
Senge,PeterM.(1990).The fifth discipline: The art and practice of the learning organization.NewYork:Currency/Doubleday.
Process Improvement: Using Toyota’s A3 ReportsSatya S. Chakravorty, Kennesaw State University
Toyota uses A3 reports to drive process improvement. The company created these reports as a tool to identify problems, find solutions, and report results of improvement activities. The A3 report is an effective tool because it contains not only text, but also pictures, diagrams, and charts, all of which enrich and clarify the data.
The author found no study, however, that explained how to implement the A3 report in manufacturing operations. Thus, the purpose of this study is to show how A3 reports are implemented in a successful process improvement project in aircraft maintenance and repair operations. In doing so, he shows a systematic approach, an improvement event, and the process used to implement and document the reports.
An improvement event is generally completed in four weeks and has four distinct phases: 1) preparation and training; 2) process mapping and analysis; 3) process mapping and analysis of future state; and 4) implementation and ownership transfer. The author notes five implications of this process improvement effort involving A3 reports. This research shows how to effectively guide a process improvement effort using A3 reports to reduce waste from the operations.
As a continuing feature of the QMF, we are showcasing the most recent articles in our sister publication, the Quality Management Journal (QMJ). The QMF focuses on the practical application of quality principles, and the QMJ focuses on the research aspect of quality. We hope that you will visit their website and begin the synthesis process of merging theory with application to advance the field of quality. http://www.asq.org/pub/qmj/index.html
The QMJ provides relevant knowledge about quality management practice that is grounded in rigorous research. They seek:
• Empirical articles that provide objective evidence concerning actual quality management practice and its effectiveness.
• Research case studies that consider either a single application or a small number of cases.
• Management theory articles that present significant new insight and demonstrated practice.
• Review articles that create links to the existing academic literature and aid in the development of an identifiable quality management academic literature.
(QualiTy managemenT Journal preview, continued on page 22)
T H E Q U A L I T Y M A N A G E M E N T F O R U M
2 2
Enhancing Six Sigma Implementation Through Human Resource ManagementXingxing Zu, Morgan State University, and Lawrence D. Fredendall, Clemson University
Many companies claim to have achieved remarkable improvements as a result of implementing Six Sigma methodology. Not all organizations, however, have had the same success. Organizations that have implemented Six Sigma successfully claim that the best way to manage the change that results from the implementation is through issues related to human resource management (HRM). This article presents a study that investigates the role of HRM practices on Six Sigma implementation.
Prior research identified three HRM practices—employee involvement, employee training, and employee performance and recognition—that are important in forming a quality culture and influencing the attitudes of employees in favor of quality.
Three hypotheses were proposed to determine if the traditional HRM practices significantly affect the level to which an organization applies Six Sigma methods such as the structured improvement procedure and performance metrics:
• Hypothesis 1: The three traditional quality-oriented HRM practices have a positive direct effect on the use of Six Sigma methodology.
• Hypothesis 2: The Six Sigma role structure has a positive direct effect on the use of Six Sigma methodology.
• Hypothesis 3: The Six Sigma role structure has a positive direct effect on the three traditional quality-oriented HRM practices.
The data for the study were drawn from a Web-based survey that investigated the implementation of quality management programs in the U.S. manufacturing industry. The study comprised 95 plants that had implemented Six Sigma as a formal quality management method.
For the current study, the Six Sigma and HRM constructs were measured using a seven-point Likert scale. Results of this study indicate that the three HRM practices significantly affect the use of Six Sigma methodology. In addition, it was found that Six Sigma role structure integrates with the traditional quality-oriented HRM practices in supporting the use of Six Sigma methodology.
The Role of Front-Line Ideas in Lean Performance ImprovementAlan G. Robinson, University of Massachusetts, and Dean M. Schroeder, Valparaiso University
Over the years, many manufacturing and service organizations have adopted lean principles in hopes of improving performance. Yet the majority of these companies have not been truly successful at becoming lean. This can be explained by the fact that many leaders of companies that start lean efforts lack a real understanding of the principles involved and, therefore, focus on short-term application of isolated tools rather than the deeper changes necessary. This paper identifies a critical component that is often missing in underperforming initiatives—the ability to get large numbers of improvement ideas from front-line employees.
The authors noticed that there appeared to be a relationship between the performance of a company’s idea system and the success of its lean effort, as defined by its rate of productivity improvement. In several companies they studied, the lean initiatives resulted in only limited productivity improvement until management adopted a high-performance idea system. The authors decided to delve more deeply into the cause of this relationship.
The data used in this study were derived from field research in more than 300 organizations in 25 countries. All were applying lean principles with employee ideas as their primary continuous improvement tool. The three strongest relationships the authors’ data showed between high-performing idea systems and lean performance improvement are that a high-performing idea system: 1) creates a lean improvement culture by engaging the work force in daily improvement activity; 2) taps improvement opportunities that are difficult for managers to spot; and 3) promotes rapid organizational learning.
The authors’ work has identified what they believe to be two barriers for any company setting up a high-performing idea system. First, most managers have experience with only the suggestion-box type of system, which causes them to shy away from any kind of initiatives to promote front-line ideas. The second barrier is that high-performing idea systems frequently require significant and difficult changes in operating practices.
(QualiTy managemenT Journal preview, continued from page 21)
T H E Q U A L I T Y M A N A G E M E N T F O R U M
2 3
To see a QMD organization chart and complete roster of QMD officers, committee chairs, and volunteers, go to the QMD Organization pages on the QMD Web site at www.asq-qmd.org.
ChairJd Marhevko,SPX Test & MeasurementVP Operational Excellence7121 N Haggerty RoadCanton, MI 48187Office Phone: (734) 582-2386Cell: (419) 704-5603E-Mail: [email protected]
Chair ElectH. Fred WalkerRochester Institute of TechnologyRoss Building 10; Room 111615 Lomb Memorial DriveRochester, NY 14623-5603Office Phone: (585) 475-5955Fax: (585) 475-7080E-Mail: [email protected]
Past ChairHeather McCainGarmin International1200 East 151st StreetOlathe, KS 66062Office Phone: (913) 440-2236Cell: (913) 302-9350E-Mail: [email protected]
Vice-Chair, MarketingMilt Krivokuca9 OlympusIrvine, CA 92603Cell: (949) 892-7994E-Mail: [email protected]
Vice-Chair, Print InitiativesBruce DeRuntzCollege of EngineeringSouthern Illinois University CarbondaleCarbondale, IL 62901Office Phone: (618) 453-7829E-Mail: [email protected]
Vice-Chair, Face-to-Face InitiativesDavid M. Little Tyco Electronics MS 18-11 PO Box 3608 Harrisburg, PA 17105-3608 Office Phone: (717) 810-3741 E-Mail: [email protected]
Vice-Chair, e-Based InitiativesRonald L. MeierIllinois State UniversityCampus Box 5100Normal, IL 61790Office Phone: (309) 438-2905E-Mail: [email protected]
Vice-Chair, OperationsGrace L. DuffyManagement and Performance Systems3203 Antigua Bay LaneTavares, FL 32778Office Phone: (352) 343-9267Cell: (352) 406-8262E-Mail: [email protected]
Chair, Editorial Review BoardDenis Leonard, Business Excellence Consulting
Editorial Review BoardSuzanne Andrews, Metropolitan Life Insurance CompanyHank Campbell, University of Arkansas at Pine BluffMark R. Chandler, Federal Highway Administration
William Denney, Quality Texas FoundationMac McGuire, McGuire & Associates Consulting
Pradip V. Mehta, Mehta Consulting LLCOz Rahman, Boston-Power Inc
Matthew J. Roe, Dow ChemicalMustafa Shraim, SQPS LtdGabriel Smith, John Deere
Chad Vincent, Baxter Health CorporationJeanette Wilde, Los Alamos National Laboratory
Consulting EditorDave Roberts, PhD
The Quality Management Forum is a peer-reviewed publication of the Quality Management Division of the American Society for Quality. Published quarterly, it is QMD’s primary channel for communicating quality management information and Division news to Quality Management Division members. The Quality Management Division of ASQ does not necessarily endorse opinions expressed in The Quality Management Forum. Articles, letters and advertisements are chosen for their general interest to Division members, but conclusions are those of the individual writers.
Address all communications regarding The Quality Management Forum, including article submissions, to:
Bruce DeRuntzCollege of Engineering Southern Illinois University CarbondaleCarbondale, IL 62901Office Phone: (618) 453-7829E-Mail: [email protected]
Address all communications regarding the Quality Management Division of ASQ to:
Jd Marhevko,SPX Test & MeasurementVP Operational Excellence7121 N Haggerty RoadCanton, MI 48187Office Phone: (734) 582-2386Cell: (419) 704-5603E-Mail: [email protected]
Address all communications regarding QMD membership including change of address to:
American Society for QualityCustomer Service CenterP.O. Box 3005Milwaukee, WI 53201-30051-800-248-1946 or (414) 272-8575
For more information on how to submit articles or advertise in The Quality Management Forum see the Quality Management Division Web site at www.asq-qm.org. Articles must be received ten weeks prior to the publication date to be considered for that issue.
Contact the ASQ Customer Service Center at 1-800-248-1946 or (414) 272-8575 to replace issues lost or damaged in the mail.