Distribution Unlimited The Quality-Volume Relationship: Comparing Civilian and MHS Practice Holly Brevig, Christina Colosimo, Ted Jaditz, Ramona Krauss, Kara Mandell, Robert Morrow, Jessica Oi, and Wilhelmina Tsang November 2014
Transcript
Distribution Unlimited
The Quality-Volume Relationship:
Comparing Civilian and MHS
Practice Holly Brevig, Christina Colosimo, Ted Jaditz, Ramona Krauss, Kara Mandell,
This document contains the best opinion of CNA at the time of issue.
It does not necessarily represent the opinion of the sponsor.
Distribution
Approval for Public Release; Distribution Unlimited. Specific authority: N00014-11-D-0323.
Copies of this document can be obtained through the Defense Technical Information
Center at www.dtic.mil or contact CNA Document Control and Distribution Section
at 703-824-2123.
Approved by: November 2014
Dr. Eric Christensen, Research Team Leader
Health Research and Policy
Resource Analysis Division
i
Abstract
The literature shows that the best outcomes occur when patients get their health care in high-volume settings. High-volume surgeons are more proficient. High volume hospitals are safer. These findings have changed how civilian health care is delivered. Civilian hospitals, insurance companies, governments, and institutions all focus on volume as an indicator of quality. The Military Health System (MHS) lags by comparison. Fewer MHS patients have their procedures in high-volume settings. MHS also misses opportunities to consolidate low-volume hospitals into higher-volume regional facilities. For many product lines, most operations are done by surgeons who perform the procedure infrequently. There are nearly 10 million TRICARE beneficiaries, and thus ample opportunities for MHS to set up high-volume "center of excellence" programs to meet existing beneficiary demand for services. Such initiatives could improve average patient outcomes while supporting clinical currency for MHS physicians.
ii
This page intentionally left blank.
iii
Executive Summary
Peer-reviewed medical journals frequently publish articles that show that high
volume is generally correlated with better outcomes. High volume surgeons have
Figure 1. Screen shot, Beth Israel Deaconess Medical Center, volume of
common procedures ..................................................................................... 10 Figure 2. Screen shot, Leapfrog Group Hospital Survey results ........................... 11 Figure 3. Detail: Anne Arundel Medical Center abdominal aortic aneurysm
repair scores from Leapfrog Group ........................................................... 12 Figure 4. Hospital volume for hip replacements in Arizona (2011) ..................... 15 Figure 5. Distribution of spinal fusion volume, by key provider
type (FY13) ...................................................................................................... 23 Figure 6. Distribution of total knee arthroplasty (TKA) volume, orthopedic
surgeons (FY13) .............................................................................................. 24 Figure 7. Distribution of total hip arthroplasty volume, orthopedic surgeons
(FY13) ............................................................................................................... 25 Figure 8. Distribution of spinal fusions, total hip arthroplasty, and total
knee arthroplasty, specialty surgeons (FY13) .......................................... 26 Figure 9. Average total ICU admissions per year, by MTF (FY11–FY13) .............. 28 Figure 10. Average ICU sepsis cases per year, by MTF (FY11-FY13)....................... 29 Figure 11. Average ICU pneumonia cases per year, by MTF (FY11-FY13) ............. 30 Figure 12. Average ICU cardiac care admissions per year, by
MTF (FY11-FY13) ............................................................................................ 31 Figure 13. Average mechanical ventilation ICU cases per year, by MTF (FY11-
Table 1. Leapfrog hospital volume targets .............................................................. 13 Table 2. Aetna Institutes of Quality and Institutes of Excellence annual
volume standards .......................................................................................... 14 Table 3. Blue Cross Blue Shield Blue Distinction Centers ..................................... 14 Table 4. Where do patients get a knee replacement? ............................................ 19 Table 5. Where do patients get a hip replacement? ............................................... 20 Table 6. Where do patients get a CABG? .................................................................. 20 Table 7. Where do patients get a spinal fusion? ..................................................... 21 Table 8. Volume of selected surgeries, by site (FY13) ........................................... 34
x
This page intentionally left blank.
xi
Glossary
AAA Abdominal Aortic Aneurysm
AHRQ Agency for Healthcare Research and Quality
AMC Army Medical Center
CABG Coronary Artery Bypass Graft
C-section Cesarean-Section
eMSM enhanced Multi-Service Market
FY Fiscal Year
GME Graduate Medical Education
ICU Intensive Care Unit
IQI Inpatient Quality Indicators
MDR MHS Data Repository
MHS Military Health System
MTF Military Treatment Facility
NH Naval Hospital
NMC Naval Medical Center
PCI Percutaneous Coronary Intervention
THA Total Hip Arthroplasty
TKA Total Knee Arthroplasty
xii
This page intentionally left blank.
1
Introduction
Starting in the 1970s, researchers have assessed how patient outcomes relate to the
settings where care is provided. A review [1] written for an Institute of Medicine
workshop concluded that for many different types of surgery, the more times a
procedure is performed in a given hospital, and the more times a practitioner
performed it, the better the health outcomes.
The literature has evolved. Studies continue to look at surgery using finer measures
of surgeon performance, and conclude that higher-volume surgeons are more skilled
[2]. Studies find volume effects for treatments other than surgery, too. While there
are exceptions, the consensus of the literature is that higher procedure volumes are
correlated with better patient outcomes.
This report provides a brief introduction to the current state of the literature on the
relationship between the volume of services provided and the quality of that medical
care. We review some areas where this literature has had a concrete impact on the
practice of medicine. We provide examples of how civilian hospitals announce their
procedure volume statistics on their corporate webpages. We note that the Leapfrog
Group, a nonprofit group focused on reducing medical errors and improving hospital
safety, uses procedure volume as part of its metrics to rate hospitals. We describe
how insurance companies encourage beneficiaries to select “centers of excellence”—
high-volume facilities staffed by high-volume surgeons who follow safe practices. We
show how multiple states publish highly specific hospital procedure data on their
websites and encourage patients to use these data as a quality signal. We also note
the use of volume data as a quality measure by professional associations and by the
U.S. Department of Health & Human Services’ Agency for Healthcare Research and
Quality (AHRQ).
Next we look at military medicine through the lens of the quality-volume literature.
We compare Military Health System (MHS) facilities with their civilian counterparts.
We find that for many product lines of surgery, civilian systems are much more
highly centralized than is MHS. We also note examples where MHS misses
opportunities to consolidate low-volume programs into regional centers; and that for
many lines of surgery, most procedures are performed by low-volume surgeons.
We appreciate the difficulties in comparing the MHS direct care system with civilian
facilities. The primary mission of MHS is operational support. Managers of the MHS
2
face constraints that are not present in civilian systems. As a result, MHS is not
optimized for the secondary mission of providing care to its beneficiary population.
The Military Health System is missing an opportunity. There are nearly 10 million
beneficiaries who are eligible to receive care in the direct care system. There is ample
beneficiary demand to support high-volume programs for a variety of surgical
services in many different locations. An MHS that was designed to be in accord with
the principles and findings of the quality-volume literature would look very different
from the current one.
3
The Literature on Volume and Quality
A 1979 paper in the New England Journal of Medicine [3] found a strong negative
correlation between the number of surgeries performed in a hospital and the surgical
mortality rate. Adjusting for case mix, high-volume facilities had death rates 25 to 40
percent lower than low-volume facilities. Luft et al. used the results to advocate for
regionalization of many types of complex surgeries.
These policy recommendations were controversial. Many subsequent authors
attempted to replicate the findings. Critics assailed both the study’s methods and the
generalizability of its results.
This section discusses the current literature relating volume of procedures to patient
outcomes. Papers look at patient outcomes such as mortality, complications, and
length of stay. Outcomes are related to the number of procedures performed at a
location or by the provider, either cumulatively or per unit time. Researchers use a
variety of strategies to control for differences across patients that contribute to
outcomes and to control for other features of the hospital where treatment occurs or
of the clinician or clinicians who provide treatment. The early papers addressed
major surgery; more-recent papers have addressed nonsurgical treatment such as
intensive care unit (ICU) ventilator support and pneumonia treatment.
This section begins with a review of various ways the findings have been criticized.
We then lay out recent papers that attempt to address these criticisms.
The literature has reached broad consensus. The positive relationship between
quality and volume is empirically robust. High-volume surgeons have lower
complication rates, lower re-operation rates, lower readmission rates, and lower
mortality rates and they are faster in the operating room. Patients who frequent high-
volume hospitals have lower mortality rates, lower complication rates, lower
readmission rates, and shorter lengths of stay.
Critiques of the literature
Luft et al. showed a strong correlation between procedure volumes and patient
outcomes. The single most significant criticism is that the quality-volume effect is a
statistical black box. While volume is correlated with quality of outcomes, we do not
4
know the mechanism, or limits, or even the direction of causation [4]. How does
volume generate better outcomes? How many procedures are enough? Does volume
cause quality, or is it that patients seek out high-quality providers and thus quality
causes volume?
In addition, there are numerous criticisms of the methods used in this line of
research. The key areas of contention are as follows:
Early studies of the quality-volume effect focused on data from a few
states. Data from a few large databases (notably from New York State)
appear frequently in the earliest papers in the literature. As a result, many
researchers questioned whether this was a local phenomenon or a general
finding [1].
The quality-volume relationship is criticized as highly variable, and many
papers have poor methods [1]. For example, methods used to adjust for
risk in different populations are frequently unsophisticated.
There is a lack of proper adjustment for case mix [5]. Do hospitals “cherry
pick” patients who are likely to do well? Proper adjustment for differences
in disease burden and demographics between patient populations can
have a large impact on the assessment of hospital and surgeon outcomes.
The magnitude of any relationship between hospital volume and
outcomes is uncertain [6]. Retrospective studies find that historical
volume correlates with historical performance; however, the correlation
between current volumes and future outcomes is much more uncertain.
This suggests that the relationship is unstable.
There is debate on whether volume has a large or small overall impact on
outcomes, and on whether that impact is constant over time [7]. Evidence
may suggest that the size of the effect is shrinking over time.
These are significant criticisms. While current studies address some aspects of these
critiques, it is fair to say that no study fully addresses them all.
Recent findings in the peer-reviewed
literature
The relationship between surgery volume and outcome quality remains an active area
of research. In the following review, we focus on papers published since 2007. By
that time, researchers are aware of the criticisms of the early work and take steps to
address them.
5
Recent papers by and large confirm the quality-volume relationship. In most
samples, surgeons and hospitals at the high end of the volume distribution tend to
have better outcomes than surgeons and hospitals at the low end of the distribution.
We break out our findings by type of surgery:
Appendectomy
o Surgeons who are in the top half of the volume distribution
(performing between 66 and 120 appendectomies per year) have better
outcomes than do surgeons in the bottom half (who perform 65 or
fewer) [8].
o A 2013 paper [9] finds no influence of hospital volume on patient
mortality rates.
Bariatric surgery
o There is a strong correlation between the average number of bariatric
surgeries a surgeon performs annually and his or her level of surgical
skill as rated by other surgeons. Surgical volume also is associated with
lower mean operating room times [2].
Cataract surgery
o Surgeons who perform fewer than 250 cataract surgeries per year have
double the complication rate of surgeons who perform 251 to 500
cataract surgeries per year. These surgeons, in turn, have double the
complication rates of surgeons who perform 501 to 1,000 surgeries per
year. Surgeons who perform more than 1,000 cataract surgeries per
year have the lowest adverse event rate [10].
Cesarean section
o For low- and medium-risk patients, high-volume hospitals have
significantly lower Cesarean-section rates than low-volume hospitals
[11].
Cholecystectomy
o Surgeons who perform fewer than 12 procedures per year in facilities
that perform fewer than 120 procedures per year have the highest
rates of postsurgical complication, including acute myocardial
infarction, pulmonary compromise, postoperative infection, deep vein
thrombosis, pulmonary embolism, hemorrhage, and re-operation. Best
outcomes are in facilities that perform more than 244 per year and
with surgeons that perform more than 36 per year [12].
6
o Lowest rates of re-operation and readmission are in hospitals that
perform more than 244 procedures per year [13].
o Length of stay is lower in facilities where more than 255 procedures
are performed per year [14].
Colectomy
o Surgeons who perform more than 200 colectomies per year have
shorter operating times than surgeons who perform fewer than 30 per
year [15].
Hysterectomy
o Surgeons in the lowest third of the volume distribution have
complication rates 50 percent higher than surgeons in the top third of
the distribution. Women treated in high-volume centers are 18 percent
less likely to experience a complication. Total costs of care are lower
for high-volume surgeons and at high-volume hospitals [16].
o A 2010 paper by Rogo-Gupta et al. finds that high-volume surgeons
have a 30 percent lower chance of an operative injury and a
significantly lower chance of complications or ICU admission
compared with low-volume surgeons [17].
Knee replacement
o Readmission, re-operation, mortality, and length of stay are all more
favorable in high-volume facilities than low-volume facilities [18].
o A systematic review by Lau et al. [19] finds that low-volume surgeons
have higher rates of infection, longer procedure times, longer lengths
of stay, a greater probability of a transfusion, and worse reported
patient outcomes.
o Surgeons who perform more than 67 procedures per year have better
outcomes than surgeons who perform fewer than 17 cases per year
[20].
o Hospitals where 200 knee replacements per year are performed have
lower complications and lower one-year mortality rates compared with
lower-volume hospitals [21].
7
Hip replacement
o Hospitals that perform more than 200 hip replacements per year have
lower complication rates and lower mortality than lower-volume
hospitals [21].
o For hip replacements, low surgeon volume has a bigger impact on
length of stay for hip replacements than do patient comorbidities; best
outcomes are recorded with surgeons who perform 53 procedures per
year or more [20].
o Patients of surgeons who perform more than 35 hip replacements per
year have lower risk for dislocation and early revision compared to
patients whose surgeons perform 35 or fewer hip replacements per
year [22].
Spinal surgery
o Patients of surgeons who perform 32 or more spinal decompressions
and fusions per year have lower re-operation rates and higher rates of
long-term survival compared to patients whose surgeons perform 31 or
fewer hip replacements per year [23].
Mastectomy
o Patient survival rates are highest in hospitals that perform more than
70 mastectomies per year [24].
Prostatectomy
o A 2013 paper finds lowest length of stay for patients whose surgeons
perform more than 17 radical prostatectomies per year and at
hospitals where more than 49 are performed per year [25].
o Surgeons who perform more than 24 radical prostatectomies a year
have lower complication rates [26].
Intensive care units
o Hospitals with greater than 120 ICU admissions per year for sepsis
have lower mortality rates than facilities with less than 40 admissions
per year for sepsis [27].
o Physicians who treat more than 315 pneumonia cases per year have
lower mortality rates than physicians who treat fewer than 36 [28].
8
o Facilities with greater than 50 ICU admissions for cardiac-related
conditions have better mortality rates than facilities with less than 20
admissions [29].
o Facilities that admit more than 282 cases per year requiring mechanical
ventilation have lower mortality rates than facilities that admit fewer
than 99 per year [30].
We found no papers that show that low-volume providers and hospitals had more
favorable outcomes than high-volume providers and hospitals.
These references start to fill in the details of how volume leads to quality: Theory
and recent empirical evidence suggest that performing a high volume of a single type
of surgery may be associated with greater proficiency in that surgery [2, 31]. The
best hospitals tend to have both high volume and better process standardization and
adherence to evidence-based practices [17].
9
Impact on the Practice of Medicine
The quality-volume literature has had a major impact on the practice of medicine. In
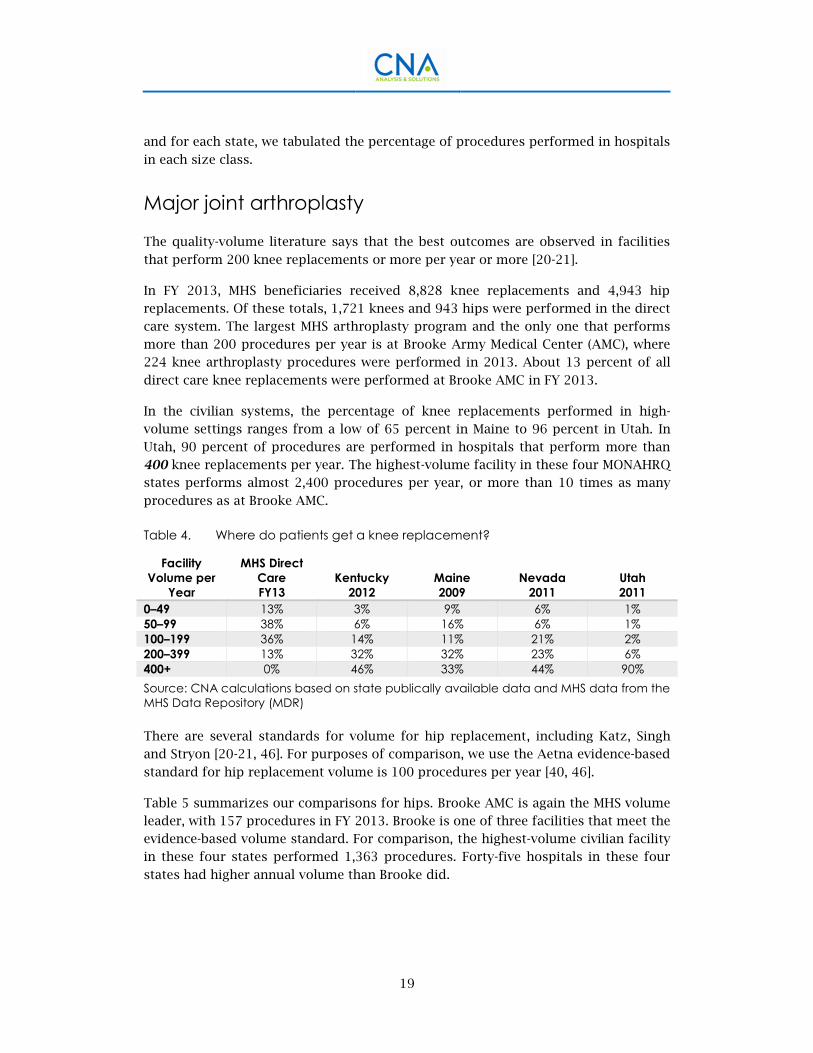
this section, we sketch out some of the ways that modern institutions apply volume
data to their business activities.
It is easy to find prominent civilian hospitals that publish procedure
volumes on their websites, from which we infer that hospital managers
believe procedure volume is important. Hospitals also voluntarily report
procedure volume data to participate in civilian quality measurement
programs.
Insurance companies have programs to recognize high-volume providers
and encourage their beneficiaries to have their procedures done at these
sites.
State health departments publish procedure volume information on
hospitals and encourage patients to take this into account when selecting
a facility.
While most physician professional associations are reluctant to endorse
the quality-volume literature, a small number acknowledge that volume is
a valid indicator of quality of care. In addition, medical education has long
emphasized the importance of repetition to build proficiency.
The Agency for Healthcare Research and Quality publishes its Inpatient
Quality Indicators resources based on hospital volume.
Civilian hospitals and the Leapfrog Group
Many civilian hospitals voluntarily report volume information on their corporate
websites, and civilian groups use this information to calculate hospital safety ratings.
The Beth Israel Deaconess Medical Center website is a convenient example of the
kinds of information that hospitals make public. This teaching hospital, located in
Boston, Massachusetts, is part of the Harvard University Medical School. On its
website (Figure 1), Beth Israel Deaconess currently publishes its fiscal year (FY) 2010,
10
FY 2011, FY 2012, and FY 2013 procedure volumes for 15 common types of surgery,
including various types of heart surgery, gastric bypass, hip and knee replacement,
and prostatectomy. Reports are clear and comprehensive. In the knee replacement
section, for example, reports include the number of primary knee replacements (317
in FY 2012), the number of revisions (62), and the number of patients undergoing
bilateral knee replacement (9).
Figure 1. Screen shot, Beth Israel Deaconess Medical Center, volume of common
procedures
Source: Beth Israel Deaconess Medical Center [32]
Beth Israel Deaconess explicitly calls out the link between quality and volume. As
shown in the screen shot in Figure 1, text provided with the report table states:
One element that is associated with good care is hospital volume.
While researchers are still trying to understand the exact relationship
between volume and quality, studies have found that surgical teams
with experience—that is, routinely performing a sufficient number of
cases—have better results. [32]
11
The Leapfrog Group is a nonprofit group that compiles safety ratings based on data
provided by hospitals. The member organizations (corporations and public agencies
that buy health benefits) that comprise Leapfrog represent about 34 million
beneficiaries and more than $60 billion in health care expenditures. Leapfrog
publishes safety ratings for hospitals that volunteer to participate in its program.
Data provided by participating hospitals include process measures and procedure
volume for select procedures, as well as hospital staffing and safety practices. These
data are used to calculate a safety score for each hospital. Hospital safety scores are
publicly available on Leapfrog’s website. The hospitals are rated on whether they
have appropriate safety processes in place and on patient outcomes. Hospitals also
are rated on whether they perform select procedures in sufficient volume. Figure 2
shows a screen shot from a part of the survey data that is reported for hospitals in
Maryland.
Figure 2. Screen shot, Leapfrog Group Hospital Survey results
Source: Leapfrog Group, retrieved November 17, 2014 [33]
The Leapfrog report provides summary assessments of hospital safety, with grades
ranging from a low of “willing to report” to a high of “fully meets standards.” The
12
screen shot shows the section of the report that provides information on high-risk
surgeries. Patients who want additional information can click on the question mark
symbol. For example, when we click on the link for Anne Arundel Medical Center for
Abdominal Aortic Aneurysm Repair, we see that the facility performed 56 procedures
and that the estimated probability of patient survival was 98.2 percent (Figure 3).
Figure 3. Detail: Anne Arundel Medical Center abdominal aortic aneurysm repair
scores from Leapfrog Group
Source: Leapfrog Group, retrieved November 17, 2014 [33]
Its 2014 Leapfrog Hospital Survey Results include rating scores based on volume for
five procedures: aortic valve replacement, abdominal aortic aneurysm (AAA) repair,
pancreatic resection, esophageal resection, and high-risk births. In addition to these
five, Leapfrog also publishes minimum volume targets which are not included in the
rating scores for three additional procedures: coronary artery bypass graft (CABG),
percutaneous coronary intervention (PCI), and bariatric surgery. The Leapfrog
surgeon and hospital volume targets for all eight procedures are given in Table 1.
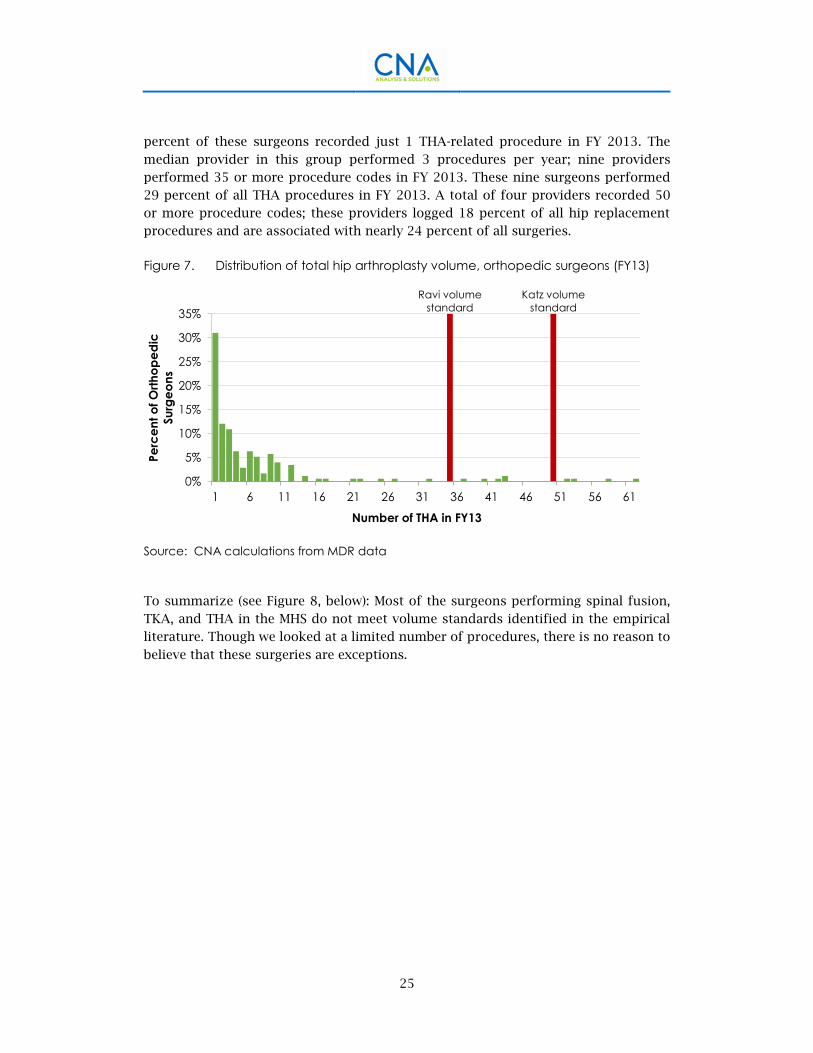
percent of these surgeons recorded just 1 THA-related procedure in FY 2013. The
median provider in this group performed 3 procedures per year; nine providers
performed 35 or more procedure codes in FY 2013. These nine surgeons performed
29 percent of all THA procedures in FY 2013. A total of four providers recorded 50
or more procedure codes; these providers logged 18 percent of all hip replacement
procedures and are associated with nearly 24 percent of all surgeries.
Figure 7. Distribution of total hip arthroplasty volume, orthopedic surgeons (FY13)
Source: CNA calculations from MDR data
To summarize (see Figure 8, below): Most of the surgeons performing spinal fusion,
TKA, and THA in the MHS do not meet volume standards identified in the empirical
literature. Though we looked at a limited number of procedures, there is no reason to
believe that these surgeries are exceptions.
Ravi volume
standard
Katz volume
standard
0%
5%
10%
15%
20%
25%
30%
35%
1 6 11 16 21 26 31 36 41 46 51 56 61
Pe
rce
nt
of O
rth
op
ed
ic
Su
rge
on
s
Number of THA in FY13
26
Figure 8. Distribution of spinal fusions, total hip arthroplasty, and total knee
arthroplasty, specialty surgeons (FY13)
Source: CNA calculations from MDR data
Intensive care units operate at low volumes
Data from FY 2013 MHS administrative records shows that most MTFs with ICUs are
providing services at volumes that are low relative to the standards called out in the
peer-reviewed literature.
Total admissions
Glance et al. [50] finds the best outcomes in facilities in the highest quartile of their
sample (with volumes above 1,234 admissions per year) and poorest outcomes in
facilities in the lowest quartile (with volumes below 631 admissions per year).
Only 7 of 39 MTFs (18 percent) with ICUs in the MHS had a volume of admissions of
1,234 per year or greater during FYs 2011–2013. Sixty (60) percent of MTFs had
annual admissions lower than 631 per year. (See Figure 9.)
Sepsis cases
Hospitals with at least 120 admissions yearly for sepsis have the lowest mortality
rates, while hospitals with fewer than 40 admissions yearly have the highest rates
[27].
0%
10%
20%
30%
40%
50%
60%
70%
1 2-13 32+ 1 2-34 35-49 50+ 1 2-23 24-49 50+
Spinal Fusions Total Hip Arthroplasty Total Knee
Arthroplasty
Pe
rce
nta
ge
of
Su
rge
on
s
Volume of Surgeries in FY13
27
Only 5 of 39 MTFs (13 percent) with ICUs met the high-volume standards during FYs
2011–2013. (See Figure 10.)
Pneumonia cases
Patient mortality rates are higher for physicians who treat fewer than 36 cases of
pneumonia in the ICU per year than for physicians who treat more than 315 cases
[28].
Regardless the number of physicians operating at MTFs, not one MTF ICU admitted
315 pneumonia cases during FYs 2011–2013. (See Figure 11.)
Cardiac care
Facilities with greater than 50 ICU admissions for cardiac-related conditions have
better mortality rates than do facilities with less than 20 admissions per year [29].
More than three-quarters of MTFs admitted 50 or more cardiac care cases during FYs
2011–2013. (See Figure 12.)
Mechanical ventilation
Mortality rates are higher in facilities that admit fewer than 99 cases of patients
requiring mechanical ventilation than in facilities with 282 or more cases in the ICU
per year [30].
Only one MTF admitted more than 282 cases in the ICU requiring mechanical
ventilation during FYs 2011–2013. (See Figure 13.)
28
Figure 9. Average total ICU admissions per year, by MTF (FY11–FY13)
Source: CNA calculation from MDR data
29
Figure 10. Average ICU sepsis cases per year, by MTF (FY11-FY13)
Source: CNA calculations from MDR data
30
Figure 11. Average ICU pneumonia cases per year, by MTF (FY11-FY13)
Source: CNA calculations from MDR data
31
Figure 12. Average ICU cardiac care admissions per year, by MTF (FY11-FY13)
Source: CNA calculations from MDR data
32
Figure 13. Average mechanical ventilation ICU cases per year, by MTF (FY11-FY13)
Source: CNA calculations from MDR data
33
Low-volume programs are clustered
geographically
Over the last several years, many MTFs have closed down low-volume lines of major
surgery. Still, we frequently see relatively low volume military facilities in close
proximity to each other. Our findings are summarized in Table 8.
We recognize that some of the lowest-volume facilities listed in this table may
possibly be coding errors. Even so, we see cases where the MHS could rationalize and
operate one facility that meets the evidence-based volume targets, rather than
multiple facilities at low volume.
In the National Capital Area, for example, two major hospitals operate less than 30
miles from each other. Ft. Belvoir and Walter Reed National Military Medical Center
operate competing programs in hip and knee replacement and in spine surgery.
Unifying the hip and knee programs and directing their patients to one facility would
eliminate one very low volume program. Unifying the spine programs would
eliminate a low-volume facility and allow the combined program to meet the higher
Aetna volume target for its Institute of Quality.
34
Table 8. Volume of selected surgeries, by site (FY13)
Surgery Location MTF
Procedures
(#)
Knee
replacement
National Capital
Area eMSM
Walter Reed Natl Mil Med Cntr 53
Ft Belvoir Community Hosp 26
Kimbrough Amb Car Cntr-Ft Meade 4
Puget Sound eMSM Madigan AMC-Ft. Lewis 133
NH Bremerton 33
San Antonio eMSM BAMC-SAMMC JBSA FSH 224
59th Med Wing-Lackland 1
San Diego eMSM NMC San Diego 188
NH Camp Pendleton 1
Tidewater eMSM NMC Portsmouth 191
633rd Med Grp Langley-Eustis 21
Hip
replacement
National Capital
Area eMSM
Walter Reed Natl Mil Med Cntr 50
Ft Belvoir Community Hosp 11
Puget Sound eMSM Madigan AMC-Ft. Lewis 80
NH Bremerton 18
San Diego eMSM NMC San Diego 124
NH Camp Pendleton 1
Tidewater eMSM NMC Portsmouth 129
633rd Med Grp Langley-Eustis 12
Spine surgery National Capital
Area eMSM
Walter Reed Natl Mil Med Cntr 155
Ft Belvoir Community Hosp 72
Key: eMSM= Enhanced Multi-Service Markets. NH-Naval Hospital. NMC=Naval Medical
Center. AMC=Army Medical Center.
Source: CNA calculations from MDR data
In the Puget Sound area are two facilities about 40 miles apart that are operating
competing orthopedic programs. Sending all joint replacement patients at Naval
Hospital Bremerton to Madigan AMC would put Madigan very nearly at the volume
target for hip replacements.
In San Diego, sending patients the 50 miles from Naval Hospital Camp Pendleton to
Naval Medical Center San Diego would transfer hip replacement patients from a low-
volume program to a program that meets the hip replacement volume target, and it
would eliminate a low-volume knee program.
35
Summary and Conclusions
Patients who have their treatments in high-volume settings generally have better
outcomes. For many complex procedures and treatments, there are reputable,
broadly accepted studies that link better outcomes to higher volumes.
The quality-volume literature has been embraced by civilian institutions. Civilians
use volume statistics for marketing and facility and provider assessment. Civilian
medical care has organized itself to send most patients to receive their care in high-
volume settings.
Most MTFs are performing their complex surgeries at low volumes. Most patients in
the MHS receive their surgeries in settings that the literature associates with poorer
quality outcomes. Few MHS physicians meet the volume targets from the literature.
With a few exceptions, most facilities miss volume targets for ICU care.
We appreciate that MHS direct care facilities have not been managed with the quality-
volume targets in mind. Many changes are necessary if MHS facilities are to have a
reasonable prospect of significant increases in procedure volume. Implementing
these changes would not be easy or quick. Still, low volume presents several
problems for MHS.
First, the direct impact on quality is significant. If the empirical relationships that
exist everywhere in civilian medicine also exist in the MHS, then holding all else
constant, MHS beneficiaries treated in direct care settings have greater chance of
poor outcomes, including mortality, complication, longer length of stay, and higher
re-operation rates.
Second, MHS physicians do not have the benefits associated with high volume:
Holding all else constant, because they perform few procedures, providers have
higher complication rates, higher re-operation rates, higher readmission rates, and
higher mortality rates and they are slower in the operating room.
Third, there are ripple effects across the program. For example, low volume also has
implications for graduate medical education (GME). Low volume of surgical patients
has an adverse impact on GME for surgical specialties. Residents in a Family Practice
GME program are required to serve a rotation in an intensive care unit; low volume of
complicated cases through these ICUs cannot be helpful for GME. Critical skills
across the enterprise have fewer training opportunities.
36
The alternative vision is one of an MHS designed around quality-volume principles.
The vision includes centers of excellence based on process standardization and
evidence based practices, resourced to allow providers to achieve high levels of
proficiency honed by frequent practice. TRICARE covers nearly 10 million
beneficiaries. There is an opportunity to capture the patient workload necessary to
achieve this vision of high volume targets for prividers and facilities.
37
References
[1] Halm, Ethan A., Clara Lee, and Mark R. Chassin. 2002. “Is Volume Related to Outcome in Health Care? A Systematic Review and Methodologic Critique of the Literature.” Annals of Internal Medicine 137 (6): 511-520. doi: 10.7326/0003-4819-137-6-200209170-00012.
[2] Birkmeyer, J. D., J. F. Finks, A. O'Reilly, M. Oerline, A. M. Carlin, A. R. Nunn, J. Dimick, M. Banerjee, and N. J. Birkmeyer. 2013. “Surgical skill and complication rates after bariatric surgery.” N Engl J Med 369 (15): 1434-42. doi: 10.1056/NEJMsa1300625. NLM.
[3] Luft, H. S., J. P. Bunker, and A. C. Enthoven. 1979. “Should operations be regionalized? The empirical relation between surgical volume and mortality.” N Engl J Med 301 (25): 1364-9. doi: 10.1056/nejm197912203012503. NLM.
[4] Matsen, F. A. 2002. “The relationship of surgical volume to quality of care: scientific considerations and policy implications.” J Bone Joint Surg Am 84-a (8): 1482-3; author reply 1483-5. NLM.
[5] Khuri, S. F., J. Daley, W. Henderson, K. Hur, J. O. Gibbs, G. Barbour, J. Demakis, G. Irvin, J. F. Stremple, F. Grover, G. McDonald, E. Passaro, Jr., P. J. Fabri, J. Spencer, K. Hammermeister, and J. B. Aust. 1997. “Risk adjustment of the postoperative mortality rate for the comparative assessment of the quality of surgical care: results of the National Veterans Affairs Surgical Risk Study.” J Am Coll Surg 185 (4): 315-27. NLM.
[6] Chowdhury, M. M., H. Dagash, and A. Pierro. 2007. “A systematic review of the impact of volume of surgery and specialization on patient outcome.” Br J Surg 94 (2): 145-61. doi: 10.1002/bjs.5714. NLM.
[7] Shervin, N., H. E. Rubash, and J. N. Katz. 2007. “Orthopaedic procedure volume and patient outcomes: a systematic literature review.” Clin Orthop Relat Res 457: 35-41. doi: 10.1097/BLO.0b013e3180375514. NLM.
[8] Wei, P. L., S. P. Liu, J. J. Keller, and H. C. Lin. 2012. “Volume-outcome relation for acute appendicitis: evidence from a nationwide population-based study.” PLoS One 7 (12): e52539. doi: 10.1371/journal.pone.0052539. NLM.
[9] Andersson, R. E. 2013. “Short and long-term mortality after appendectomy in Sweden 1987 to 2006. Influence of appendectomy diagnosis, sex, age, co-morbidity, surgical method, hospital volume, and time period. A national population-based cohort study.” World J Surg 37 (5): 974-81. doi: 10.1007/s00268-012-1856-x. NLM.
38
[10] Bell, C. M., W. V. Hatch, G. Cernat, and D. R. Urbach. 2007. “Surgeon volumes and selected patient outcomes in cataract surgery: a population-based analysis.” Ophthalmology 114 (3): 405-10. doi: 10.1016/j.ophtha.2006.08.036. NLM.
[11] Lee, K. S., and J. M. Kwak. 2014. “Effect of patient risk on the volume-outcome relationship in obstetric delivery services.” Health Policy [Epub ahead of print]. doi: 10.1016/j.healthpol.2014.05.007. NLM.
[12] Murphy, M. M., S. C. Ng, J. P. Simons, N. G. Csikesz, S. A. Shah, and J. F. Tseng. 2010. “Predictors of major complications after laparoscopic cholecystectomy: surgeon, hospital, or patient?” J Am Coll Surg 211 (1): 73-80. doi: 10.1016/j.jamcollsurg.2010.02.050. NLM.
[13] Harrison, E. M., S. O'Neill, T. S. Meurs, P. L. Wong, M. Duxbury, S. Paterson-Brown, S. J. Wigmore, and O. J. Garden. 2012. “Hospital volume and patient outcomes after cholecystectomy in Scotland: retrospective, national population based study.” BMJ (Clinical Research ed.) 344: e3330. doi: 10.1136/bmj.e3330. NLM.
[14] Csikesz, N. G., A. Singla, M. M. Murphy, J. F. Tseng, and S. A. Shah. 2010. “Surgeon volume metrics in laparoscopic cholecystectomy.” Dig Dis Sci 55 (8): 2398-405. doi: 10.1007/s10620-009-1035-6. NLM.
[15] Yasunaga, H., Y. Matsuyama, and K. Ohe. 2009. “Effects of hospital and surgeon volumes on operating times, postoperative complications, and length of stay following laparoscopic colectomy.” Surg Today 39 (11): 955-61. doi: 10.1007/s00595-008-4052-8. NLM.
[16] Wallenstein, M. R., C. V. Ananth, J. H. Kim, W. M. Burke, D. L. Hershman, S. N. Lewin, A. I. Neugut, Y. S. Lu, T. J. Herzog, and J. D. Wright. 2012. “Effect of surgical volume on outcomes for laparoscopic hysterectomy for benign indications.” Obstet Gynecol 119 (4): 709-16. doi: 10.1097/AOG.0b013e318248f7a8. NLM.
[17] Rogo-Gupta, L. J., S. N. Lewin, J. H. Kim, W. M. Burke, X. Sun, T. J. Herzog, and J. D. Wright. 2010. “The effect of surgeon volume on outcomes and resource use for vaginal hysterectomy.” Obstet Gynecol 116 (6): 1341-7. doi: 10.1097/AOG.0b013e3181fca8c5. NLM.
[18] Bozic, K. J., J. Maselli, P. S. Pekow, P. K. Lindenauer, T. P. Vail, and A. D. Auerbach. 2010. “The influence of procedure volumes and standardization of care on quality and efficiency in total joint replacement surgery.” J Bone Joint Surg Am 92 (16): 2643-52. doi: 10.2106/jbjs.i.01477. NLM.
[19] Lau, R. L., A. V. Perruccio, R. Gandhi, and N. N. Mahomed. 2012. “The role of surgeon volume on patient outcome in total knee arthroplasty: a systematic review of the literature.” BMC Musculoskelet Disord 13: 250. doi: 10.1186/1471-2474-13-250. NLM.
[20] Styron, J. F., S. M. Koroukian, A. K. Klika, and W. K. Barsoum. 2011. “Patient vs provider characteristics impacting hospital lengths of stay after total knee or hip arthroplasty.” J Arthroplasty 26 (8): 1418-26.e1-2. doi: 10.1016/j.arth.2010.11.008. NLM.
39
[21] Singh, J. A., C. K. Kwoh, R. M. Boudreau, G. C. Lee, and S. A. Ibrahim. 2011. “Hospital volume and surgical outcomes after elective hip/knee arthroplasty: a risk-adjusted analysis of a large regional database.” Arthritis Rheum Pmc3149786 63 (8): 2531-9. doi: 10.1002/art.30390. NLM.
[22] Ravi, Bheeshma, Richard Jenkinson, Peter C Austin, Ruth Croxford, David Wasserstein, Benjamin Escott, J Michael Paterson, Hans Kreder, and Gillian A Hawker. 2014. “Relation between surgeon volume and risk of complications after total hip arthroplasty: propensity score matched cohort study.” BMJ 348: g3284 doi: 10.1136/bmj.g3284.
[23] Bederman, S. S., H. J. Kreder, I. Weller, J. A. Finkelstein, M. H. Ford, and A. J. Yee. 2009. “The who, what and when of surgery for the degenerative lumbar spine: a population-based study of surgeon factors, surgical procedures, recent trends and reoperation rates.” Can J Surg Pmc2724822 52 (4): 283-290. NLM.
[24] Scharl, A., and U. J. Gohring. 2009. “Does Center Volume Correlate with Survival from Breast Cancer?” Breast Care (Basel) Pmc2941652 4 (4): 237-244. doi: 10.1159/000229531. NLM.
[25] Kelly, M., L. Sharp, F. Dwane, T. Kelleher, F. J. Drummond, and H. Comber. 2013. “Factors predicting hospital length-of-stay after radical prostatectomy: a population-based study.” BMC Health Serv Res Pmc3750445 13: 244. doi: 10.1186/1472-6963-13-244. NLM.
[26] Schmitges, J., Q. D. Trinh, M. Sun, F. Abdollah, M. Bianchi, L. Budaus, G. Salomon, T. Schlomm, P. Perrotte, S. F. Shariat, F. Montorsi, M. Menon, M. Graefen, and P. I. Karakiewicz. 2012. “Venous thromboembolism after radical prostatectomy: the effect of surgical caseload.” BJU Int 110 (6): 828-33. doi: 10.1111/j.1464-410X.2012.10941.x. NLM.
[27] Reinikainen, M., S. Karlsson, T. Varpula, I. Parviainen, E. Ruokonen, M. Varpula, T. Ala-Kokko, and V. Pettila. 2010. “Are small hospitals with small intensive care units able to treat patients with severe sepsis?” Intensive Care Med 36 (4): 673-9. doi: 10.1007/s00134-009-1688-9. NLM.
[28] Lin, H. C., S. Xirasagar, C. H. Chen, and Y. T. Hwang. 2008. “Physician's case volume of intensive care unit pneumonia admissions and in-hospital mortality.” Am J Respir Crit Care Med 177 (9): 989-94. doi: 10.1164/rccm.200706-813OC. NLM.
[29] Carr, B. G., J. M. Kahn, R. M. Merchant, A. A. Kramer, and R. W. Neumar. 2009. “Inter-hospital variability in post-cardiac arrest mortality.” Resuscitation 80 (1): 30-4. doi: 10.1016/j.resuscitation.2008.09.001. NLM.
[30] Darmon, M., E. Azoulay, J. P. Fulgencio, B. Garrigues, C. Gouzes, P. Moine, D. Villers, V. Teboul, J. R. le Gall, and S. Chevret. 2011. “Procedure volume is one determinant of centre effect in mechanically ventilated patients.” Eur Respir J 37 (2): 364-70. doi: 10.1183/09031936.00195209. NLM.
[31] Sadideen, Hazim, and Roger Kneebone. “Practical skills teaching in contemporary surgical education: how can educational theory be applied to promote effective learning?” The American Journal of Surgery 204 (3): 396-401. doi: 10.1016/j.amjsurg.2011.12.020.
40
[32] Beth Israel Deaconness Medical Center. 2014. "Volume of Common Procedures." http://www.bidmc.org/Quality-and-Safety/Specific-Service-Measures/Volume-of-Common-Procedures.aspx.
[33] The Leapfrog Group. 2014. "Leapfrog Hospital Ratings." www.Leapfroggroup.org.
[34] Allareddy, V., V. Allareddy, and B. R. Konety. 2007. “Specificity of procedure volume and in-hospital mortality association.” Ann Surg Pmc1899201 246 (1): 135-9. doi: 10.1097/01.sla.0000259823.54786.83. NLM.
[35] The Leapfrog Group. 2008. "Factsheet on Evidence-based Hospital Referral (EBHR)."
[38] Allareddy, V., M. M. Ward, V. Allareddy, and B. R. Konety. 2010. “Effect of meeting Leapfrog volume thresholds on complication rates following complex surgical procedures.” Ann Surg 251 (2): 377-83. doi: 10.1097/SLA.0b013e3181cb853f. NLM.
[39] Blue Cross Blue Shield Association. 2014. "Blue Distinction Centers for Bariatric Surgery® 2014 Evaluation Components." August 15, 2014. http://www.bcbs.com/healthcare-partners/blue-distinction-for-providers/2014_Bariatric_Surgery_Evaluation_Components.pdf.
[40] Aetna. 2013. Aetna Institutes of Quality® Fact Book. August 14, 2014. http://www.aetna.com/individuals-families-health-insurance/document-library/aetna-ioq-factbook.pdf.
[41] Blue Cross Blue Shield Association. 2013. "Blue Distinction Specialty Care Program." http://www.bcbs.com/why-bcbs/blue-distinction/.
[42] Arizona Department of Health Services. 2014. "2011 AZ Compare." http://pub.azdhs.gov/hospital-discharge-stats/2011/index.html.
[43] Arizona Department of Health Services. 2014. "2011 AZ Compare - About Hospital Quality." http://pub.azdhs.gov/hospital-discharge-stats/2011/AboutHospitalQuality.html.
[44] Hillis, L. David, Peter K. Smith, Jeffrey L. Anderson, John A. Bittl, Charles R. Bridges, John G. Byrne, Joaquin E. Cigarroa, Verdi J. DiSesa, Loren F. Hiratzka, Adolph M. Hutter, Jr., Michael E. Jessen, Ellen C. Keeley, Stephen J. Lahey, Richard A. Lange, Martin J. London, Michael J. Mack, Manesh R. Patel, John D. Puskas, Joseph F. Sabik, Ola Selnes, David M. Shahian, Jeffrey C. Trost, Michael D. Winniford, Alice K. Jacobs, Jeffrey L. Anderson, Nancy Albert, Mark A. Creager, Steven M. Ettinger, Robert A. Guyton, Jonathan L. Halperin, Judith S. Hochman, Frederick G. Kushner, E. Magnus Ohman, William Stevenson, and Clyde W. Yancy. “2011 ACCF/AHA guideline for coronary artery bypass graft surgery: Executive summary.” The Journal of Thoracic and Cardiovascular Surgery 143 (1): 4-34. doi: 10.1016/j.jtcvs.2011.10.015.
[45] Department of Health and Human Services. 2007. "Guide to Inpatient Quality Indicators: Quality of Care in Hospitals – Volume, Mortality, and Utilization " http://www.qualityindicators.ahrq.gov.
[46] Katz, J. N., E. Losina, J. Barrett, C. B. Phillips, N. N. Mahomed, R. A. Lew, E. Guadagnoli, W. H. Harris, R. Poss, and J. A. Baron. 2001. “Association between hospital and surgeon procedure volume and outcomes of total hip replacement in the United States medicare population.” J Bone Joint Surg Am 83-a (11): 1622-9. NLM.
[47] Dasenbrock, Hormuzdiyar H, Michelle J Clarke, Timothy F Witham, Daniel M Sciubba, Ziya L Gokaslan, and Ali Bydon. 2012. “The impact of provider volume on the outcomes after surgery for lumbar spinal stenosis.” Neurosurgery 70 (6): 1346-1354.
[48] Katz, Jeffrey N., Jane Barrett, Nizar N. Mahomed, John A. Baron, R. John Wright, and Elena Losina. 2004. “Association Between Hospital and Surgeon Procedure Volume and the Outcomes of Total Knee Replacement.” J Bone Joint Surg Am 86-A (9): 1909-1916.
[49] Wei, Min-Hsiung, Yi-Ling Lin, Hon-Yi Shi, and Herng-Chia Chiu. 2010. “Effects of Provider Patient Volume and Comorbidity on Clinical and Economic Outcomes for Total Knee Arthroplasty: A Population-Based Study.” The Journal of Arthroplasty 25 (6): 906-912.e1. doi: 10.1016/j.arth.2009.06.033.
[50] Glance, L. G., Y. Li, T. M. Osler, A. Dick, and D. B. Mukamel. 2006. “Impact of patient volume on the mortality rate of adult intensive care unit patients.” Crit Care Med 34 (7): 1925-34. doi: 10.1097/01.ccm.0000226415.93237.84. NLM.