“A project submitted in partial fulfillment of the requirements of the ICM Diploma of Business” 11 Quantitative analysis - to identify areas of improvement in KFC by using mix of quantitative techniques. Coma
Transcript
“A project submitted in partial fulfillment of the requirements of the ICM Diploma of Business”
11
Quantitative analysis - to
identify areas of improvement
in KFC by using mix of
quantitative techniques.
Coma
1 | P a g e
Table of Contents Executive Summary .................................................................................................................... 2
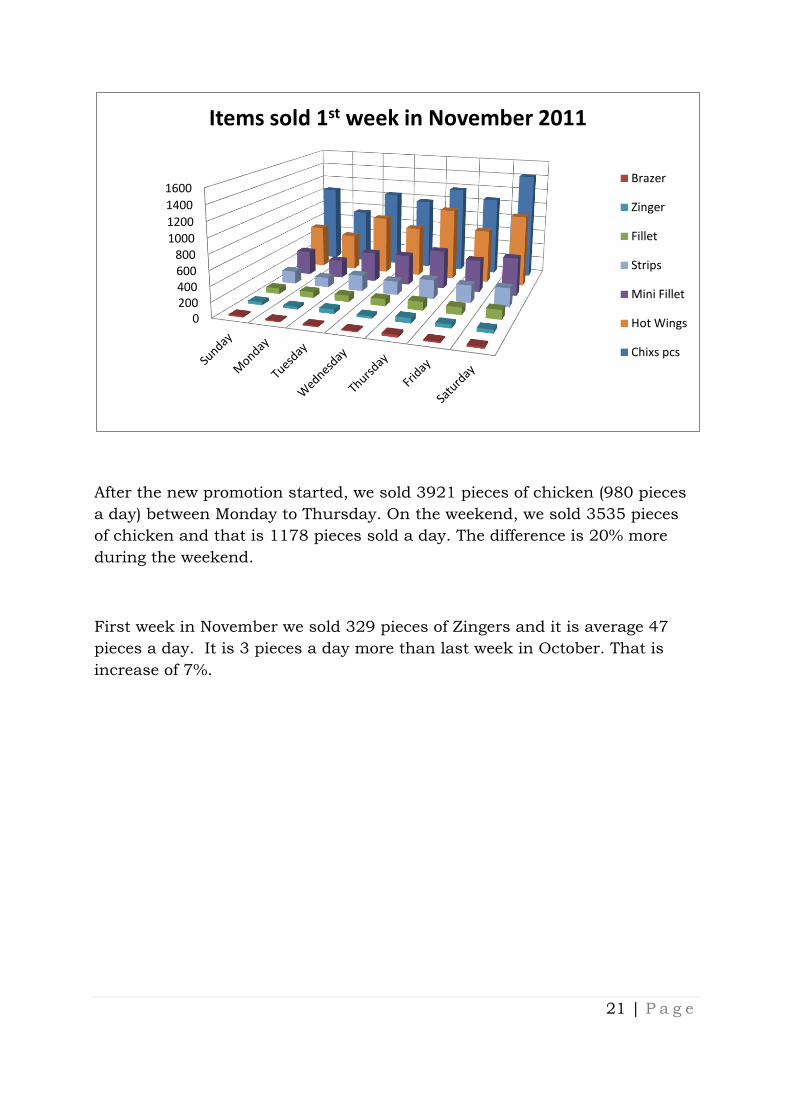
Monday to Thursday we sold 2952 pieces of chicken that is average 738
pieces a day. On the weekend we sold 4219 pieces and that is 1406 pieces of
chicken a day. This is approximately 91% more than the week days.
In final week of my research in November we sold 367 pieces of Zingers and
that is average 52 pieces a day. That is immense increase for Zingers.
During of all eight weeks KFC Jervis Centre sale was €270,096.50 in 2011.
In 2010 the sale was €275,756.07.
Total difference is -€5,659.57. Variances of customers served during years
2011 and 2010 are -1 942 paying customers.
That means that KFC is losing customers. That is disappointing. Let’s find
out what is the reason.
0
200
400
600
800
1000
1200
1400
1600
Items sold 4th week in November 2011
Brazer
Zinger
Fillet
Strips
Mini Fillet
Hot Wings
Chixs pcs
31 | P a g e
Questionnaire
Questionnaire design
I designed a simple questionnaire. Then I got it filled in by 30 customers.
Then I did improve the questionnaire which should help KFC to find their
SWOT points. And as I hope, help KFC to improve their sales and
transaction outputs. I asked another 200 customers in KFC Jervis Centre to
fill out for me the questionnaire.
Questions number 1 and 2 are to find out what are the demographic
segmentations. Demographic segmentation consists of dividing the market
into groups based on variables such as age, occupation, gender, family size
etc.
Questions number 3 to 8 are from Marketing mix range. ‘The marketing mix
is the combination of techniques used to market a brand. The techniques are often called the Ps.’ 2 Question number 3 – Product & Brand to get an idea of customer values.
Question number 4 – Product & Brand to get an idea of the brand equity.
Question number 5 – Product to get an idea of customer choices.
Question number 6 – Product to get an idea of customer taste/choices.
Deeper understanding of customers tastes.
Question number 7 and 8– Price. Does the customer perceive the cost of the product as fair, or is it too expensive? Question number 9 – Place. How convenient is it to find the product? Is it
easy, or does the customer have to make an effort?
Question number 10 – Frequency. To establish customer loyalty. It is one of the behavioural variable segmentation.
Question number 11 – Quality. Is the customer satisfied with KFC product quality? ‘If a product fulfils the customer’s expectations, the customer will be pleased
and consider that the product is of acceptable or even high quality. If his or
2 Cate Farrall and Marianne Lindsley, Professional English in Use- Marketing, Cambridge University Press, 2008, p8.
32 | P a g e
her expectations are not fulfilled, the customer will consider that the product
is of low quality. This means that the quality of a product may be defined as “its ability to
fulfil the customer’s needs and expectations”.’3 Question number 12 – Speed of service. Are the customers satisfied by speed
of service from KFC tills? Question number 13 and 14 – Suggestions. Can KFC improve speed of
service and quality of product and services?
These last two questions are the most important because KFC is losing customers in November. On behalf of these two answers KFC can improve their sales.
What did I find out the answers from the questionnaire?
3 S. C. Arora, Product quality, UNITED NATIONS INDUSTRIAL DEVELOPMENT
ORGANIZATION, 2006, p1.
33 | P a g e
Original questionnaire
KFC Questionnaire
1) Age...................................
2) Your occupation...............
3) Why do You choose KFC but another restaurant? ...............................................
4) What meal/food did You purchase this visit? ...................................................... 5) Why do You choose this meal/food? ................................................................... 6) How much You pay for Your meal/food? ............................................................. 7) In terms of location, why do You go to this KFC? ................................................ 8) How does the KFC brand affect Your decision?
Very much
Normal
Very little 9) How often do You come to KFC?
Every 3 days
Once a week
Once a month
Other option........... 10) What do You thing about the price?
Very expensive
Expensive but still payable
Reasonable
Cheap 11) How do You feel about KFC food?
Delicious
Good
Normal
Not good 12) Are You happy with speed of service?
Yes
No...................Why? .......................... 13) What are Your suggestions for improving KFC service quality? (If any)
3) Why did You choose KFC rather than another restaurant? ..................................
4) How does the KFC brand affect Your decision to dine here?
Very much
Normal
Very little 5) What meal/food did You purchase this visit? ......................................................
6) Why do You choose this meal/food? ................................................................... 7) How much You pay for Your meal/food? ............................................................. 8) What do You thing about the price?
Very expensive
Expensive but still payable
Reasonable
Cheap 9) In terms of location, why do You go to this KFC? ................................................ 10) How often do You come to KFC?
Every 3 days
Once a week
Once a month
Other option........................ 11) How do You feel about KFC food?
Delicious
Good
Normal
Not good 12) Are You happy with speed of service?
Yes
No...................Why? .......................... 13) What would You suggest to improve the service at KFC? ..................................... 14) What would You suggest to improve the quality at KFC? .....................................
Thank you very much for your cooperation!
35 | P a g e
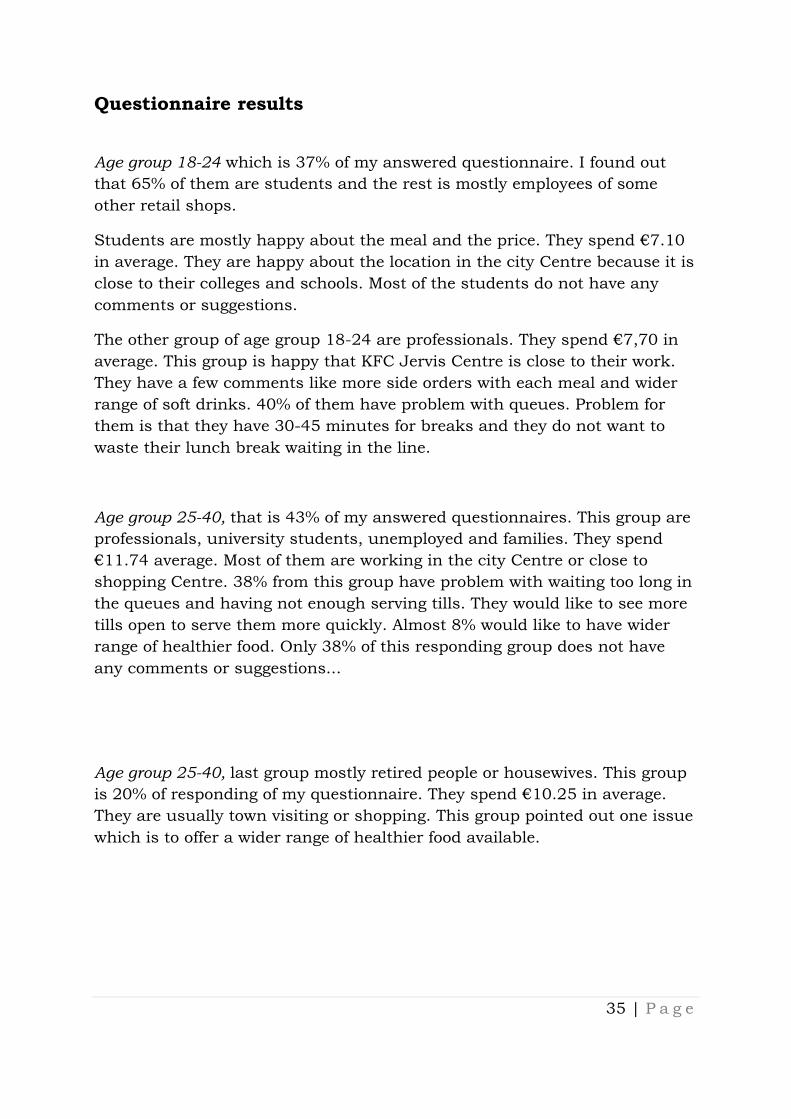
Questionnaire results
Age group 18-24 which is 37% of my answered questionnaire. I found out
that 65% of them are students and the rest is mostly employees of some
other retail shops.
Students are mostly happy about the meal and the price. They spend €7.10
in average. They are happy about the location in the city Centre because it is
close to their colleges and schools. Most of the students do not have any
comments or suggestions.
The other group of age group 18-24 are professionals. They spend €7,70 in
average. This group is happy that KFC Jervis Centre is close to their work.
They have a few comments like more side orders with each meal and wider
range of soft drinks. 40% of them have problem with queues. Problem for
them is that they have 30-45 minutes for breaks and they do not want to
waste their lunch break waiting in the line.
Age group 25-40, that is 43% of my answered questionnaires. This group are
professionals, university students, unemployed and families. They spend
€11.74 average. Most of them are working in the city Centre or close to
shopping Centre. 38% from this group have problem with waiting too long in
the queues and having not enough serving tills. They would like to see more
tills open to serve them more quickly. Almost 8% would like to have wider
range of healthier food. Only 38% of this responding group does not have
any comments or suggestions...
Age group 25-40, last group mostly retired people or housewives. This group
is 20% of responding of my questionnaire. They spend €10.25 in average.
They are usually town visiting or shopping. This group pointed out one issue
which is to offer a wider range of healthier food available.
36 | P a g e
SWOT analysis
Strengths – What do we do well?
Strong brand name Perceived quality for price Strong trademarks recipes
Long market history and fanatic followers
Weaknesses – What can we improve?
Long queues Limited menu Lack of knowledge about their customers
Opportunities – What opportunities for improvement are open to KFC Jervis
Centre?
Now that it is clear that customer loss is directly linked to long queues
and speed of service we have a chance to rectify this.
How can we turn our strengths into opportunities? Guarantees to
customers that we recognise the problem in service and that a solution
is being found.
Threats – What threats could harm us?
The trend of losing customers to competing restaurants.
This restaurant could be possibly closed down!!!
37 | P a g e
Promotional sale compare to non-promotional item
During first four weeks in October we sold 1185 pieces of Zingers. This is an
average 296,25 pieces per week. This period of time we are taking as non-
promotional item.
In November we sold 1311 pieces. That is 327,75 pieces per week. So there
is growth in sold Zingers 11%.
38 | P a g e
Conclusion
The issue of a customer loss in KFC Jervis Centre are addressed in this
report.
It establishes one of the main reasons for customer loss as not adequate
speed of service.
The use of the questionnaire in this case was very relevant to establish first
of all the main reason for customer loss but also to establish how to improve
the problem.
Evidently, in this report, was that KFC Jervis Centre did not take into
account or acknowledge that services threat could give opportunities to other
restaurants on the floor to give them bigger “share of market”.
Although work is needed to address the problem of poor speed of service and
customer loss, a solution is at hand and with some simple improvements
can quickly be enforced.
Overall KFC Jervis Centre is in a healthy position and with a few simple