THE REACTIONS OF TRIMETHYL GROUP Va LEWIS BASES
WITH SIMPLE BORON LEWIS ACIDS
by
DONALD CHARLES MENTE, B.A.
A DISSERTATION
IN
CHEMISTRY
Submitted to the Graduate Faculty of Texas Tech University m Partial FulfiHment of the Requirements for
the Degree of
DOCTOR OF PHILOSOPHY
Approved
May, 1975
AJO'^
ACKNOWLEDGMENTS
The author wishes to express his sincere gratitude to
Dr. Jerry L. Mills for his direction of this dissertation
and to Dr. Roy E. Mitchell for his aid during the calori-
metric determinations. Also acknowledged are the Texas Tech
Graduate School and the Robert A. Welch Foundation for their
generous financial support.
11
CONTENTS
ACKNOWLEDGMENTS ii
LIST OF TABLES iv
LIST OF FIGURES vi
I. INTRODUCTION 1
II. EXPERIMENTAL 5
Instrumental 5
Special Apparatus 6
Gas-Phase Calorimetry 8
Preparations 16
III. RESULTS AND DISCUSSION 22
Calorimetry 22
Nmr Spectra 30
Vibrational Spectra 33
Mass Spectra 44
Conductivity Data ^ 44
Tensiometric Titrations 47
Gas-Phase Displacement Reactions 49
Melting Point Data 50
IV. SUMMARY AND CONCLUSIONS 52
REFERENCES 53
APPENDICES 57
A. REPRESENTATIVE SPECTRA 57
B. SUGGESTIONS FOR FURTHER INVESTIGATION 59
• • •
111
LIST OF TABLES
I. Measured Enthalpies, AH (kcal/mole ) . . . 24
II. NMR Data: Chemical Shifts of Lewis Base Methyl Protons in Benzene-d^ Solvent . . . . 31
III. NMR Data: Chemical Shifts of Lewis Base Methyl Protons in Methylene Chloride Solvent 33
IV. ~ Infrared Spectral Absorptions of Trimethyphos-phine and Trimethylphosphine Adducts with Tentative Assignments 34
V. Infrared Spectral Absorptions of Trimethyl-arsine and Trimethylarsine Adducts with Tentative Assignments 35
VI. Infrared Spectral Absorptions of Trimethyl-stibine and Trimethylstibine Adducts with Tentative Assignments 36
VII. Infrared Spectral Absorptions of Boron Lewis Acids 37
VIII. Raman Spectral Absorptions of Boron Lewis Acids 37
IX. Raman Spectral Absorptions of Trimethylphos-phine and Trimethylphosphine Adducts with Tentative Assignments 38
X. Raman Spectral Absorptions of Trimethylar-sine and Trimethylarsine Adducts with Tentative Assignments 39
XI. Raman Spectral Absorptions of Trimethyl-stibine, Trimethylstibine Adducts and Uncharacterized Reaction Products with Tentative Assignments 4 0
XII. Calculated Vibrational Force Constants for Acid-Base Bond Symmetric Stretch 43
XIII. Mass Spectra of Complexes 45
IV
LIST OF FIGURES
7
1. Tensimeter
2. Gas-Phase Calorimeter ^^
3. Gas-Phase Calorimetry Cell ^^
4. Sample Calorimeter Recorder Output 15
5. Plot of Tensiometric Titration of Me-Sb with •BCI3 • • ' '
VI
CHAPTER I
INTRODUCTION
Since G. N. Lewis expounded his generalized definitions
of acidity and basicity in 1938, the class of compounds known
as Lewis acid-base adducts has been of interest to chemists.
Lewis defined acids as any species which can accept an elec-
tron pair and bases as species which can donate an electron
pair. This concept has proven to be of such general appli-
cability that it is still in common use. 2
The study of Lewis acid-base interactions by Brown, 3 4 5
Burg, Shore and many others led to the extension of the
Lewis Acid-Base Theory to the Hard-Soft-Acid-Base Theory by
Pearson. Hard molecules are small and nonpolarizable while
soft molecules include a large active moiety and are rather
polarizable. The use of Hard-Soft-Acid-Base Theory allows
qualitative prediction of adduct stabilities inasmuch as
complexes formed by the reaction of an acid and a base of
like hardness are more stable than complexes of mixed hard-
ness. Drago has proposed the use of a four parameter linear
free energy relationship as a more sophisticated method of
predicting the stability of Lewis acid-base adducts. Drago's
technique has been very successful in predicting adduct sta-bilities in the form of AH ,. . ^, ,4.A^^ (hereafter re-
adduct formation ferred to as AH , ), but the small number of compounds
for which the necessary parameters are available has limited
its utility.
One of the most striking trends among Lewis acid-base
complexes is the order of relative Lewis acidities among the
boron halides. From simple electronegative a arguments, one
would predict the acid strengths to follow the order
BF- > BCl^ > BBr,. This order has been observed for the
interactions of boron halides with Lewis bases such as
8a b dimethyl ether. ' However, for most systems the order of
acid strengths is exactly the opposite, i.e.: BBr^ > BCl^ 9
> BF-. This reversal of expected Lewis acidity strengths
is attributed to a phenomenon known as pir-pTr backbonding,
wherein electron density from the filled substituent orbitals 5
is back-donated into the empty boron 2p orbital.
Two Lewis bases which have been widely used in the
study of the relative Lewis acidities of the boron halides
and in the subsequent development of the Hard-Soft-Acid-Base 5
Theory are trimethylamine and trimethylphosphine. With few
I ' and trimethylstibine, have been almost com-
exceptions, the heavier congeners of these bases, trimethyl-
arsine"
pletely neglected by researchers in the field of Lewis acid-
base complexes. One reason for the lack of studies involving
trimethylarsine and trimethylstibine is their extreme air
sensitivity. Both of these Lewis bases are spontaneously
inflammable in air, and the resulting oxidation products are
extremely malodorous and very toxic as well. These compounds
12 may now be readily handled by modern vacuum-line techniques.
In view of the dearth of information concerning the
acid-base complexes of trimethylarsine and trimethylstibine,
it was decided that an investigation of the reactions of
these bases with the boron halides BF-, BCl-, and BBr- as
well as the boron Lewis acids B^H^ and BMe- should be under-2 6 3
taken. Trimethylphosphine was included in the study to pro-2 4 5 vide continuity with earlier work in the area. ' '
The most valid experimental methods for the determin-
ation of relative adduct stabilities are those which allow
the direct determination of the heat of adduct formation
(AH JJ J.) or the heat of adduct dissociation. These data adduct
are difficult to obtain due to the fact that adduct forma-
tion must be sole mode of interaction between the acid and
base. It is also desirable for the initial and final 13 thermodynamic states to be comparable.
Due to the disparate physical nature of the uncomplexed
acids and bases (volatile liquids or gases) and the resulting
complexes (thermally stable solids), a direct determination
of AH ^^ ^ could not be made, Monitoring the reaction adduct
Acid(g) + Base(g) ->- Adduct(s) by calorimetry allowed the ther-
modynamic quantity AH^^^^^^^^ (where AH^^^^^^^^ = AH^^^^^^ +
AH ^^ ^ -, . ^. ) to be measured. In a series of closely adduct sublimation
related adducts such as those involved in the present study.
the heats of sublimation should not vary greatly. For the
reactions of a particular boron Lewis acid, the variation
between reaction enthalpies (AH ) is at least 2 0 kcal rxn
mole ; therefore, small variations in heats of adduct
sublimation (AH , ,) will not change the relative order of
base strengths.
In addition to the calorimetric determination of AH rxn
for the various systems, it was decided to examine the
adducts by a variety of physical techniques including proton
nuclear magnetic resonance, infrared and Raman spectroscopy,
mass spectrometry, conductivity, tensiometric titration, gas-
phase displacement reactions and melting point determination.
Of special interest is the comparison of adduct stability
trends indicated by these physical techniques with the rela-14 tive stabilities of the adducts obtained calorimetrically.
CHAPTER II
EXPERIMENTAL
Instrumental
Proton nuclear magnetic resonance spectra were recorded
on a Varian Associates A-60 nmr spectrometer or on a Varian
Associates Model XL-lOO-15 nmr spectrometer. All reported
spectra were recorded on a Varian Associates XL-lOO-15 nmr
spectrometer. All nmr samples were prepared by condensing
the desired amount of acid and/or base into a nmr tube con-
taining degassed benzene-d^ or methylene chloride. Follow-
ing the addition of the reactants, the tubes were flame
sealed and removed from the high-vacuum system. All H
chemical shifts are reported with respect to internal tetra-
methylsilane.
The infrared (ir) spectra were recorded from 3000 to
270 cm~ using a Perkin-Elmer Model 457 grating infrared
spectrophotometer. The ir spectra of the adducts were
recorded in Nujol or n-nonane mulls between Csl plates. Ir
spectra of the uncomplexed acids and bases were recorded in
a lO-cm gas-phase ir cell equipped with Csl windows. The
Raman spectra were recorded from 1500 to 100 cm using a
Jerrell-Ashe Model 25-500 laser Raman spectrophotometer
equipped with a Coherent Radiation Model 52-A argon ion
laser. Raman adduct samples were prepared in sealed Pyrex
glass capillary tubes. All vibrational spectra were obtained
at ambient temperature.
The mass spectra of the adducts were obtained using a
Varian MAT-311 mass spectrometer operating at 70 eV.
Conductivities were measured using a Leeds and Northrup
conductivity bridge in conjunction with an inert-atmosphere
conductivity cell.
Special Apparatus
All manipulations of air-sensitive compounds were per-
12 formed on a high-vacuum system using standard techniques.
The high-vacuum system was equipped with ground glass stop-
cocks greased with Apiezon M. Pressures were maintained
— 4 —6 between 10 and 10 Torr through the use of a mercury dif-
fusion pump coupled with a Welch Scientific Duo Seal vacuum
pump. Pressures were monitored via either a mercury manom-
eter or a Scientific Associates McLeod Gauge. The vacuum
line was calibrated assuming ideal gas behavior with manom-
eter volume taken into account.
Tensiometric titrations were performed with a tensime-
ter''" similar to that shown in Figure 1. The tensimeter was
constructed of Pyrex glass, using greaseless Teflon stopcocks
and couplings. Pressures inside the tensimeter were moni-
tored via a capillary tube mercury manometer in conjunction
with a cathetometer.
8
Gas-phase displacement reactions were performed by con-
densing a known quantity (~0.1 mmol) of the acid into a
250-ml bulb which was connected to a second 250-ml bulb via
a high-vacuum Teflon stopcock. The arrangement was such
that an equal quantity of base could be introduced into the
second bulb. The stopcock connecting the two bulbs was then
opened, allowing the gases to mix and react at ambient tem-
perature. This resulted in the solid adduct being distrib-
uted over a large surface area. An equimolar amount of the
displacing reactant (either acid or base) was then intro-
duced into the two-bulb apparatus. The progress of the
reaction was monitored using gas-phase ir spectroscopy.
Gas-Phase Calorimetry
The calorimeter used in these experiments was of the
16 constant temperature environment type. All reactions
were run at 25.00°. The temperature of the bath surrounding
the calorimeter was maintained at 24.95° using a Tronac Pre-
cision Temperature Controller PTC-1000.
The temperature in the calorimeter was monitored via a
Wheatstone bridge using a 10 K thermistor with the bridge
unbalance being recorded on a Sargent Recorder Model-SR and
driving an attached Kiethly Instruments 150B microvolt am-
meter. The bridge was operated with 0.01° full scale, or
-5 + 5 X 10 degree sensitivity. The calorimeter vessel
(Figure 2) was a 400-ml vacuum glass dewar containing the
sample cell, heater, thermistor probe, magnet, stirrer and
the calorimetric fluid, which was water in all experiments.
The calorimeter was electrically calibrated. The three
primary electrical standards, each accurate to 0.01%, were
a United States National Bureau of Standards 10 ohm resistor,
an Eppley Cell potential source, and the sixty Hertz alter-
nating current frequency of the electrical mains.
The thermistor probe was calibrated by comparing the
resistance values (in ohms) noted on the Wheatstone Bridge
to temperatures measured with a Brooklyn Calorimetric Ther-
mometer. In this manner, the temperature in the calorimeter
was closely monitored throughout the experiment.
The E. H. Seargent Coulometric Current Source was used
to provide a constant current to the heater which in turn
delivered a known quantity of heat to the calorimetric fluid
before and after the chemical reaction was allowed to occur.
Because these heatings were used to interpret the heat
evolved by the chemical reaction, the calibration of the
heat delivery system was of extreme importance. The coulom-
eter was calibrated by placing it in a circuit which included
the N.B.S. 10 ohm resistor hooked in parallel with a potenti-
ometer (referenced to the Eppley Cell). The constant current
generated was found to be 0.0962 amps for the setting used
throughout this work.
10
Figure 2. Gas-Phase Calorimeter. A. Heater; B. Calo-rimetry Cell (not to scale); C. Stirrer; D. Pivoting Magnet; E. Thermistor Probe
11
The resistance of the heater was determined by placing
the heater in a circuit in series with the calibrated coulom-
eter and the 10 ohm standard resistor, By passing a constant
current (I) through the circuit, a voltage drop (V ,) across
the standard resistor and a voltage drop (V, ) across the
heater could be measured using the potentiometer. The two
voltages thus obtained were related by the following expres-
sion:
(where R, and R ., are the resistance of the heater and of n sta
the standard resistor, respectively). Solution of the
expression R, = (10 ohms)(1.622v)/(.1955v) yielded a value
of 83.22 ohms for the resistance of the heater.
Having accurately determined the resistance of the
heater and the amperage of the constant current supplied to
the heater, the power (rate of heat delivery) of the heater
(B) was calculated as follows: -1 2
B(joules sec ) = (I amps) (R ^ ohms)
= (.09621)^(83.22)
= 0.7703 joules sec
= 0.1841 calories sec
The calorimetry cell (Figure 3) was constructed of
18-mm pyrex glass and measured 7 0 mm in length when sealed.
The cell was connected to a high-vacuum system for loading
13
by standard taper joints attached to each end of the cell.
Following connection to the high-vacuum line, the cell was
-4 evacuated to a pressure of 1 X 10 Torr or less. The
sample of gas to undergo reaction was then measured using a
calibrated portion of the high-vacuum line in conjunction
with a mercury manometer and a cathetometer. (The standard
quantity of reactant used in each experiment was 0.100 mmol
except in those systems involving boron tribromide, where
low volatility forced a reduction to 0.029 mmol quantities).
The measured amount of reactant gas was condensed into the
cell using liquid nitrogen, and the cell was sealed at the
constriction. The cell was then carefully turned over, the
other end connected to the vacuum line, and the loading pro-
cedure for the other reactant was repeated.
Once filled, the calorimetry cell was placed in the
calorimeter with the stainless steel ball held securely in
place by an Alnico IV magnet, and the system was brought to
24.98° and allowed to equilibrate. An electrical calibra-
tion was done using an amount of heat estimated to be the
same as the chemical heat. After thermal equilibrium was
reestablished, the magnet was moved which allowed the stain-
less steel ball to drop and break the breakseal with resul-
tant mixing and reaction of the gases, A second electrical
calibration was done after the reestablishment of thermal
equilibrium. All temperature rises were estimated by the
14 1 /-1-
method of Wadso. The smallest experimental heats ob-
served were on the order of one calorie, which produced a
temperature rise of 0.0025°, with an uncertainty due to
temperature measurement of 2%.
The greatest source of error in our procedure was en-
countered in the measurement of the small quantities (0.1
mmol) of gaseous reactants used in each experiment. The
experimental values fall within a 5% error range.
The raw calorimetry data were obtained in the form of
time vs temperature plots of which Figure 4 is a typical
example. The graph in Figure 4 illustrates the addition of
a single heat increment to the calorimeter. Lines UV and WX
represent the steady rate of heat loss (thermal modulus) by
the calorimeter to the surrounding bath. Point V indicates
the time when the addition of the heat increment began and
the temperature of the calorimeter at that time. Point W
represents the time and temperature parameters at the com-
pletion of the heat increment addition. The oscillatory
character of the lines is indicative of the amount of back-
ground that was present in a typical experiment. A minimum
of fifteen minutes was allowed between heat increment addi-
tions in all experiments.
The temperature rises were estimated by the method of
17 Wadso, a refinement of a method first proposed by Dickenson
in 1914. Following the completion of an experiment, line L
16
was drawn normal to the time axis in such a manner that the
areas of the triangles A and A' were equal. Lines UV and WX
were extended as illustrated and lines L' and L'' were drawn
parallel to line L. The three lines L, L', and L'' and the
average of their lengths was calculated. The average length
of the lines corresponded to the temperature increase inside
the calorimeter. The temperature increases which resulted
from the addition of known heat increments both before and
after the chemical reaction were compared to the heat gener-
ated by the chemical reaction. In this manner, the reaction
enthalpies were readily determined. The advantage of this
method of heat determination is obvious, The many variables
which contribute to the heat capacity of the calorimeter
were taken into account by the procedure since the calorim-
eter was calibrated immediately before and after the measure-
ment of each experimental chemical reaction enthalpy.
The reported enthapies are the average of from two to
six actual determinations. All data sets include values
obtained from cells prepared at different times, using dif-
ferent samples of reactant.
Preparations 18
(a) Trimethylphosphine. Trimethylphosphine was pre-
pared by the dropwise addition of 13.75 g (0.1 mol) of
phosphorus trichloride to an etheral solution containing a
17
slight excess of methylmagnesium iodide under inert atmo-
sphere. The trimethylphosphine and ether were distilled
onto an aqueous solution containing 47.0 g (0.2 mol) of
silver iodide, and the trimethylphosphine was isolated as
19 the trimethylphosphine-silver iodide complex. The dis-
tillation of the trimethylphosphine and ether from the solid
residue was a crucial step. The trimethylphosphine seemed
to adhere to the solids and continued forceful heating past
dryness was necessary to obtain a satisfactory yield.
The complex was decomposed by mild heating under vacuum
and the trimethylphosphine was purified via trap-to-trap
distillation using an ethyl acetate (-83.6°) slush bath to
trap the trimethylphosphine. The purity of the trimethyl-
20 phosphine was confirmed by its vapor pressure, gas-phase
21 1 22 ir, and H nmr spectrum.
23
(b) Trimethylarsine. Trimethylarsine was prepared
by the dropwise addition of a solution of 18.15 g (0.1 mol)
of arsenic trichloride in 125 ml of xylene to a solution con-
taining a slight excess of methylmagnesium iodide in n-butyl
ether under an inert atmosphere. The temperature of the
reaction was kept well below 50°. The trimethylarsine was
distilled into a three-necked flask fitted with suitable
stopcocks to allow direct transfer to a high-vacuum system.
The trimethylarsine was purified using standard trap-to-trap
18
distillation procedures with an ethyl acetate (-83.6°) slush
bath used to trap the purified product. The purity of the
product was verified by its vapor pressure, gas-phase ir,
1 22 and H nmr spectrum.
Trimethylarsine was the most difficult of three Lewis
bases to prepare. The use of diethyl ether as a solvent was
precluded by the lack of a satisfactory method to separate
the trimethylarsine. The similar vapor pressures of the two
liquids, coupled with an apparent dipole-dipole interaction
rendered both conventional distillation and vacuum line
fractionation techniques useless for the isolation of
trimethylarsine.
Di-n-butyl ether, which was used as the solvent for the
successful preparations of trimethylarsine, is very hydro-
scopic and required extensive drying before use. This was
satisfactorially accomplished by the distillation (at 50
Torr) of di-n-butyl ether from a vessel containing calcium
hydride into a vessel containing sodium/potassium amalgam.
A redistillation of the solvent into a vessel containing
molecular sieves provided sufficiently dry di-n-butyl ether.
Several attempts were made to prepare trimethylarsine
using anisole as a solvent. Only minute yields were achieved,
and it was concluded that anisole is an inappropriate solvent
for the preparation of trimethylarsine.
19
When preparing trimethylarsine, extreme care was re-
quired to avoid the presence of excess methyl iodide in the
reaction mixture because its separation from the product was
found to be virtually impossible.
(c) Trimethylstibine. Trimethylstibine was prepared
by the dropwise addition of an etheral solution of 22.8 g
(0.1 mol) of antimony trichloride to a solution containing
excess methylmagnesium iodide in diethyl ether under inert
atmosphere. The ether and trimethylstibine were distilled
into a three-necked flask with maintenance of the inert
atmosphere. The trimethylstibine was converted to trimethyl-
2 6
antimony dibromide by the addition of a solution of ele-
mental bromine in carbon tetrachloride to the etheral solu-
tion of trimethylstibine until the brown color of the bromine
solution persisted. The trimethylantimony dibromide which
resulted was air-stable and was readily purified by filtra-
tion. The trimethylantimony dibromide was reduced by the
action of granular zinc and water to yield trimethylstibine
which was collected on a vacuum line and purified by trap-to-
trap distillation. A chloroform slush bath (-63°) was used
to collect the trimethvlstibine. Vapor pressure measure-"? 0 on 1 2 8
ments, gas phase ir, and H nmr were used to verify the purity of the trimethylstibine.
28 (d) Trimethylborane. Trimethylborane was prepared
20
by the slow dropwise addition of a solution of 26 ml (0.1
mol) of BF^ etherate in 200 ml ether to excess methylmag-
nesium iodide in ether at 0°. The trimethylborane was
collected in a trap at liquid nitrogen temperature (-196°)
using a dry nitrogen carrier gas system. A dry ice-acetone
slush bath (-78°) was used to trap out the diethyl ether in
the product stream. The trimethylborane was transferred to
a high-vacuum system and purified by conventional trap-to-
trap distillation techniques, using a carbon disulfide slush
bath (-112°) to trap the trimethylborane. Purity of the
trimethylborane was confirmed by vapor pressure measure-
29 28 ments, and ir spectroscopy,
(e) Diborane. Diborane was produced by the action of
1.6 g (0.029 mol) of potassium borohydride on 30 ml of 85%
phosphoric acid (orthophosphoric acid) in an apparatus at-
tached to a high vacuum system. Diborane was trapped in a
liquid nitrogen trap (-196°) and was purified by repeated
passage through a trap held at -112° (carbon disulfide slush)
to remove any less volatile materials. Purity of the diborane
31 was verified via gas phase ir spectroscopy and vapor pres-
4- 30 sure measurements.
(f) Boron tribromide. Boron tribromide was obtained
commercially (Alfa) and was purified on a high vacuum system
by trap-to-trap distillation using a chlorobenzene (-45°)
21
slush bath to trap the boron tribromide. The purity of the
boron tribromide was confirmed by vapor pressure measure-
32 33 ments and gas-phase ir spectroscopy.
(g) Boron trichloride. Boron trichloride was obtained
commercially (Matheson Gas Products) and purified on a high
vacuum system by trap-to-trap distillation using a carbon
disulfide (-112°) slush bath to trap the pure boron trichlo-
ride. The purity of the boron trichloride was checked by
34 , . ^ 35 vapor pressure measurements and ir spectroscopy.
(h) Boron trifluoride. Boron trifluoride was obtained
commercially (Matheson Gas Products) and purified on a high
vacuum system by trap-to-trap distillation using a trap at
liquid nitrogen (-196°) temperature to hold the purified
boron trifluoride. The purity of the boron trifluoride was
36 ^ , . confirmed by vapor pressure measurements and gas-phase ir
37 spectroscopy.
CHAPTER III
RESULTS AND DISCUSSION
Calorimetry
Trimethylphosphine in the gas-phase reacted quantita-
tively at room temperature with boron trifluoride, boron
trichloride, boron tribromide, trimethylborane and diborane
in the gas-phase to form the solid Lewis acid-base adducts
of one-to-one stoichiometry as indicated by reaction 1.
" V ( g ) + BX3(g, -Me^p.BX^,^), (1)
where X = F, Cl, Br, H, or Me.
Trimethylarsine reacted completely in an analogous man-
ner with boron trichloride, boron tribromide, and diborane,
and reacted incompletely with boron trifluoride (vide infra)
at room temperature. No discernable reaction occurred at
room temperature between trimethylborane and trimethylarsine,
Trimethylstibine formed one-to-one adducts with boron
trichloride and boron tribromide, and reacted anomalously
with boron trifluoride and diborane. No reaction occurred
between trimethylstibine and trimethylborane.
The heats of reaction, AH , observed for all of the rxn
adducts of -the boron acids, excluding diborane, involved the
sum of the heats for equations 2 and 3, AH = AH ,, . +
AH , , . . . , where, sublimation'
22
23
Acid. V + Base. . - Adduct, , AH ^^ ^ ^g) (g) (g) adduct (2)
Adduct. . - Adduct, . AH , ^ . ^. (3)
vg) (s) sublimation. '
The reactions where the acid was borane involved an additional
step, that of symmetric cleavage of diborane into borane.
i B^Hg - BH^ AH = 17.75 kcal/mole^^ (4)
The calorimetric data for reactions involving diborane have
been corrected accordingly. The measured heats of reaction
are summarized in Table I.
The adducts Me^P-BF-, Me-P-BCl-, Me-P-BBr-, Me-P-BH-,
Me^P-BMe^, Me^As-BCl^, Me^As-BBr-, Me As-BH , Me Sb-BCl and
Me-Sb*BBr_ had small saturation vapor pressures at room tem-
perature, indicating negligible dissociation of the adducts
into their respective free acids and free bases, as well as
negligible quantities of adduct in the vapor phase. As a
typical example, the adduct Me-As'BH- had one of the highest 3
pressures, 1.5 Torr at room temperature. In the calorimetry
cell this corresponded to less than 1% of the species being
in the gas phase, which is well within our calorimetric ac-
curacy. However, the adduct Me-As-BF- exhibited a consider-
able dissociation vapor pressure at room temperature. The
AH for this system has been corrected for incomplete re-rxn ^
action in the ampoule. The correction in each experiment
was calculated from the thermodynamic K = 855 (standard state
is gas at one atmosphere) obtained in a separate tensiometric
experiment, where
24
TABLE I. Measured Enthalpies, AH (kcal/mole)
Adduct Expe r imen ta l Values ( k c a l . / m o l e ) Average
( k c a l . / m o l e )
Me^P.BF^
Me^P.BCl^
Me-P-BBr^
Me-P.BMe-
Me P.BH^
Me As.BF-
Me-As-BCl^
Me-AS'BBr-
Me-As-BMe-
Me-As.BH^
Me^Sb+BF^
Me-Sb-BCl^
Me-Sb.BBr^
Me-Sb+BMe^
Me^Sb+BH^
- 4 4 . 8 , - 4 6 . 5 , - 4 2 . 3 , - 4 7 . 8 , - 4 7 . 2 , - 4 3 . 2
- 6 8 . 7 , - 6 8 . 4
- 1 2 2 . 8 , - 1 2 1 . 7
- 4 1 . 9 , - 4 0 . 8 , - 3 9 . 5 , - 4 0 . 8
- 7 8 . 8 , - 7 9 . 3 , - 8 1 . 6
- 2 1 . 0 , - 1 9 . 8
- 4 6 . 3 , - 4 6 . 1
- 8 2 . 6 , - 8 2 . 2 , - 7 9 . 0
- 0 . 0 , - 0 . 0 , - 0 . 0
- 4 8 . 2 , - 4 9 . 7 , - 5 0 . 9
- 4 . 2 , - 4 . 8 , - 3 . 6
- 2 7 . 1 , - 2 6 . 4
- 2 0 . 8 , - 1 9 . 9 , - 1 8 . 9
- 0 . 0 , - 0 . 0 , - 0 . 0
- 5 . 0 , - 8 . 2
-45.5
-68.6
-122.3
-41.0
-79.9^
-20.4*^
-46.2
-81.2
-0.0
-49.6^
-4.2^
-26.8
-19.8
-0.0
-6.6^
^For the r e a c t i o n Acid ^^^ + Base ^^^ -^ Adduct (s)-Includes
correction for AH^^„ of 1/2 B H ^ BH = 17.8, Ref. 38. rxn ^ u j j
^Corrected for adduct dissociation (see text). Anomolous Reaction; not simple adduct formation (see text). All values used fall within 3% of the mean (reported) value. Values falling outside this range were rejected upon inspec-tion for indications of errors in the measurement of reactants
„ _ solid adduct
25
a
P (a , . -,) • (a , ,_ ) ^ gas phase acid gas phase base
(pressure^^^^) . (pressurej^^^^) ' ^ ^
This equilibrium constant neglects any adduct in the gas
phase, which, under the conditions of the experiment, is
negligible.
Except as noted, all reactions were quantitative and
of one-to-one stoichiometry. Under the conditions of the
experiments, no interaction or reaction other than simple
Lewis acid-base adduct formation was observed.
While there are numerous ways to evaluate the strength
of a bond formed between a Lewis acid and a Lewis base, the
most direct method is calorimetry, The reactions between
the Lewis bases trimethylphosphine, trimethylarsine, and
trimethylstibine with the Lewis acids boron trifluoride,
boron trichloride, boron tribromide, trimethylborane and
diborane have been examined by gas-phase calorimetry.
The data in Table I represents the sum of the enthalpies
for both the gas-phase acid-base reaction and the heat of
sublimation of the adduct. In order to properly evaluate
the relative strength of the methylated phosphine, arsine,
and stibine Lewis bases towards the boron Lewis acids, it
would be desirable to separate the two thermodynamic quanti-
ties. However, in a series of closely related compounds
26
such as these, the heats of sublimation should not vary
greatly, and in all probability, are related primarily to
molecular weights. For the reactions of a particular boron
Lewis acid with the series of bases, the variation between
reaction enthalpies is at least 20 kcal/mole; therefore,
small variations in heats of sublimation could not change
the relative order of base strengths.
The method employed allows at least a semi-quantitative
determination of acid-base interactions. It has the decided
advantage that it requires an extremely simple, disposable
calorimetry cell, and the data can be gathered rather quickly
once the starting compounds are purified. Admittedly, the
thermodynamic data is of relatively low accuracy (5%). The
39
elegant thermodynamic data obtamed by Brown and co-workers
by the use of gas-phase dissociation techniques yields highly
accurate results (AH to + 0.1 kcal/mole) and also gives the
heat of formation of the adduct, AH ,, , directly. The
difference betv/een the heats measured for a particular acid-
base system by gas-phase calorimetry in this work and the
*In a classic series of papers concerning the properties of some Lewis acid-base adducts, Greenwood et al. reported values of -18.0 and -20.3 kcal/mole fo^ the AH^^j^^^^^^^^^ of
C^H^N-BCl-, and Ci-HcN-GaCl^, respectively. N. N, Greenwood 5 5 3 5 5 3
and K. Wade, J. Chem, Soc. 1663 (1958); N, N. Greenwood and K. Wade, ibid., 1671 (1958); N. N, Greenwood and K. Wade, ibid., 1130 (1960); N. N. Greenwood and P. G. Perkins, ibid., 1145 (1960).
27
heats calculated by gas-phase dissociation methods should be
the heat of sublimation of the adduct. However, the gas-
phase dissociation method is very tedious and, more impor-
tantly, is limited to the study of compounds that are appre-
ciably, but not completely, dissociated in the range of
0-160°, and that are sufficiently volatile to provide sig-
nificant pressure in the reaction vessel at temperatures for
which the dissociation is not complete. This means that
40 compounds which are highly dissociated (such as Me^As'BF^),
and weakly dissociated (such as Me^As-BCl^/ Me^As'BBro/
Me^P'BClof and Me^P'BBr^) cannot be studied by the technique.
The gas-phase calorimetry also excludes all heats of solu-
tion. Solution calorimetry would be difficult to use on
many of the systems studied because of high volatility and
great reactivity of the free acids and bases, and because of
very limited solubility of the adducts.
In 1951 Hewitt and Holliday made a study of the melt-
ing points of the borane adducts of trimethyl Group Va ad-
ducts: Me^P-BH^, 100°; Me^N-BH^, 94°; Me^As-BH^, 72°;
Me^Sb-BH^, not formed at 25°. Using only melting points as
a criterion for coordinate bond strength, it was established
that the order of decreasing basicity is Me^P > Me- As Me^Sb.
The calorimetric data reported herein supports their conclu-
sion, and, in fact, it was found that the same trend obtains
28
for all of the boron acids used. Unlike the report of Hewitt
and Holliday, a reaction was found to occur between trimethyl-
stibine and diborane; however, the reaction was not of simple
adduct formation, but appeared to be a condensation polymer-
ization reaction with the release of non-condensable gas.
The only trimethylborane adduct formed was Me-P-BMe-.
.41 Sujishi previously found from gas-phase dissociation experi-
ments a AH^^^^^^ of -16.47 kcal/mole at 100°, while more 7
recently Drago reported a value of -16.24 kcal/mole at 25°.
The difference between our AH value of -41.0 kcal/mole rxn '
and their values yields a heat of sublimation of approxi-
mately -24.6 kcal/mole. Recently the reaction between
Me-P'BMe- and excess trimethylphosphine in toluene was 42 studied by nmr spectroscopy. The reaction was found to
proceed by a dissociative mechanism, with a AH of -15.0
kcal/mole. A very weak interaction between trimethylborane
34 and trimethylarsine has been reported to occur at 0°
(K = 1.6). Calorimetrically we found no reaction at 25°. p
Brown and Drago both report gas-phase AH^^^^^^ values
for Me-P-BF- of -18.9 kcal/mole. By subtraction from the
experimental AH of -45.5 kcal/mole, a heat of sublimation
of -26.6 kcal/mole is obtained. Since the gas-phase disso-
ciation method is unsuitable for the study of the highly 40 dissociated Me^As-BF^ complex, there are no available data
to compare with our value of -20.4 kcal/mole, The reaction
29
of BF- with trimethylstibine was anomalous. A value of -4.2
kcal/mole was obtained in the calorimeter. Although this
value was independent of stoichiometry, the products in-
cluded both liquid and gas phase material, demonstrating
that the measured AH does not correspond to simple adduct
formation.
Relatively little information exists on the boron tri-
chloride and boron tribromide adducts of these bases. Only
two references to Me^As-BCl^ appear in the literature,''" ' ^
with the only physical property given being the melting
point. Apparently Me^Sb'BCl^ has not been previously re-
ported, and only a very recent reference exists for
Me^As-BBr^ and Me^Sb-BBr^. As can be seen in Table I, very
strong adducts are formed between the methylated bases with
boron tribromide and boron trichloride.
Several trends can be noted from the data in Table I.
It has been found that, as expected, the base strength
towards a particular boron acid generally decreases as the
Group Va base becomes heavier. The relative strengths of
the boron acids towards each base, listed in order of de-
creasing strength, is BBr- > BH- ^ BCl- > BF- > BMe^. This
trend is well established by the data, and is consistent
with the results previously found for the relative boron 9
halide acid strengths towards pyridine and nitrobenzene and
with the previous results concerning the position of BH., as
30
an electron acceptor with respect to boron halides.^'^^'^^
While Hard-Soft-Acid-Base theory can be used with reasonable
success to predict the trends which were observed, some dif-
ficulty arises at several points. The most serious problem
occurs with the adducts Me^Sb-BCl^ and Me^Sb-BBr^. The soft
base Me^Sb should form a stronger adduct with the softer acid
BBr^. In fact, the stronger adduct is Me^Sb-BCl^. Perhaps 7
Drago's four parameter method using electrostatic, (E), and
covalent, (C), terms would be useful. However, presently
a lack of C and E values for the systems under investigation
precludes such a comparison.
Nmr Spectra
The nmr chemical shift data for the methyl protons on
the free and complexed Lewis bases are listed in Tables II
and III. The solubilities of the adducts studied proved to
be very low in all common solvents. All reported data were
obtained using saturated solutions. In the case of benzene-
d^, some of the methyl proton chemical shifts of the coor-
dinated base were observed upfield of the chemical shift of
the methyl protons of the uncoordinated base. From. consider-
ation of simplistic inductive effects, a downfield shift of
the coordinated base would be predicted, Previous work has
demonstrated that these unusual chemical shifts are due to
anisotropic solvent effects, Such effects were neither
31
TABLE II. NMR Data: Chemical Shifts of Lewis Base Methyl m Benzene-dg Solvent
System
Me P
Me-P*BF-
Me^P-BCl^
Me-P'BBr-
Me-P-BMe-
Me^P-BH
Me^As
Me-As«BF-
Me^As-BCl-
Me-AS'BBr_
Me-As + BMe-
Me^As-BH-
Me-Sb
Me-Sb + BF-
Me-Sb-BCl-
Me-Sb-BBr-
Me^Sb + BMe-
Me-,Sb + B-H^ 3 2 6
Chemical Shift^
82
78^
72
65
55^
67
78
67.5
65
67
78^
69
59
e
73
95
59^
e
Coordination , Chemical Shift
+10
+17
+15
+10.5
+13
+11
0
+ 9
-14
-36
0
Hz downfield from internal TMS. Coordination chemical shift = (chemical shift reference)-(chemical shift of coor-dinated species) in Hz, System exchanging, chemical shift dependent on concentration and temperature, see refs, 42, 48 No reaction. No base methyl protons observed for 1:1 stoichiometry.
32
TABLE III. NMR Data: Chemical Shifts of Lewis Base Methyl Protons in Methylene Chloride Solvent
, Coordination ^ /„_% System Chemical Shift^ Chemical Shift^ " P-H '
Me^P
Me^P'BF^
Me^P-BCl^
Me^P-BBr^
Me^P-BMe^
Me^P-BH^
Me^As
Me^As-BF^
Me^As-BCl^
Me^As-BBr^
Me^As + BME3
Me^As-BH^
Me^Sb
Me^Sb + BF3
Me^Sb-BCl^
Me-^Sb'BBr^
Me^Sb + BMe^
Me^Sb + B^Hg
99
lll^
200
165
lOO^
131.5
94
94
202
148
94^
225
75
e
140
114
75^
e
-101
- 66
- 32.!
0
-106
- 54
0
-131
- 65
- 39
0
11
9
14
•y.
^Hz downfield from internal TMS. Coordination chemical shift = (chemical shift reference)-(chemical shift of coor-dinated species) in Hz. ^System exchanging, chemical shift dependent on concentration and temperature, see refs. 42, 4 8 % o reaction. ^No base methyl protons observed for 1:1 stoichiometry.
33
expected nor observed in methylene chloride solvent. In all
cases the spectra of the base protons were broadened con-
siderably upon adduct formation. This was attributed to the
interaction with the quadrapolar boron nucleus. No new acid-
base exchange phenomona on the nmr time scale were observed
for the entire series of adducts. The two systems which
undergo exchange, Me^P'BMe^ and Me^P-BF^, have been pre-
viously described. ' For the systems Me^As + BMe^ and
Me^Sb + BMe^f H nmr indicated that there was no reaction.
Only resonances corresponding to free acid and free base
were observed, with the chemical shift being invariant with
both temperature and concentration. B nmr spectra were
not obtained because of insufficient solubility of most of
the adducts.
The use of nmr chemical shifts as a criterion for adduct
48 bond strengths is at best tenuous. This work demonstrates
that for these compounds no correlation exists between the
calorimetric data (Table I) and the H nmr chemical shifts
using either benzene or methylene chloride solvent.
Vibrational Spectra
A comparison of the infrared (Tables IV-VII) and Raman
(Tables VIII-XI) spectra of the adducts with the spectra of
the uncomplexed acids and bases demonstrates vibrational fre-
quency shifts characteristic of simple coordinate covalent
34
TABLE IV. Infrared Spectral Absorptions of Trimethyphos-phine and Trimethylphosphine Adducts with Tentative Assignments^
.24 Me-P
2960-
Me-P'
2960-
Me^P
2960
•2890 1430 1350 1310 1060 980 960 708 653 305 263
.BCI3
-2890 1415 1299 1291 1060 985 950 798 770 725 700 660 393 292
•BMe^
-2845 1460 1375 1295 1145 942 860 745 700 355
C-C-C-C-C-C-C-P-P-P-P-
vs s s s w s s w s s s s w w
vs m m m s s m w w w
H H H H H H H 'C •C
•C •C
C-H C-H C-H C-H C-H C-H C-H B-Cl B-Cl P-C P-C P-C B-Cl P-C
C-H C-H C-H C-H B-C C-H C-H P-C P-C P-B
Me-P*BF-
2960-2890 vs 1470-1450 s
1375 s 1365 m 1301 m 955 m 875 w 787 m 720 m 530 m 298 m
Me-P-BBr^
2960-2845 vs 1410 w 1310 w 1290 m 975 m 945 m 780 m 760 m 720 m 640 w 610 m 320 vw
Me^P-BH^^^
2960-2840 vs 2395-2340 vs
1455 s 1375 s 1291 m 1135 m 1068 m 940 s 883 m 753 m 708 m 570 w
C-H C-H,B-F C-H C-H C-H C-H P-C B-F P-C
P-C
C-H C-H C-H C-H C-H C-H P-C B-Br B-Br P-C P-C P-C
C-H B-H C-H C-H C-H B-H B-H C-H B-H P-C P-C P-B
^Frequencies reported in cm very; s, strong; m, medium;
-1
w, Notation
weak.
for intensities: v
35
TABLE V. Infrared Spectral Absorptions of Trimethylarsine and Trimethylarsine Adducts with Tentative Assignments^
Me-As 24
2993-2925 2925 2920 2906 1436 1427 1417 1283 1270 1260 1252 896 888 591 582 570
Me^As-BBr^
C-H C-H C-H C-H C-H C-H C-H C-H C-H C-H C-H C-H C-H As-C As-C As-C
Me-As*BCl-
2960-2840 2720 1456 1412 1374 1262 1190 915 785 635 590
vs w s w s w w m m m m
C-H C-H C-H C-H C-H C-H C-H C-H B-Cl As-C As-C
Me-As-BH-11
2975-2860 vs C-H 2530 w C-H 1937 vw C-H 1913 vw C-H 1419 w C-H 1270 s C-H 918 vs C-H 845 w B-Br 810 m B-Br 679 s 640 s As-C 602 s As-C 584 s As-C 291 w B-Br
2975-2840 vs C-H 2400-2340 s B-H
2260 m B-H 1895 w B-H 1425 s C-H 1268 s C-H 1135 m B-H 1052 s B-H 900 s C-H 852 m B-H 620 w As-C 605 m As-C 490 w As-C
- . -1 Frequencies reported in cm V, very; s, strong; m, medium;
Notation w, weak.
for intensities
36
TABLE VI. Infrared Spectral Absorptions of Trimethylstibine and Trimethylstibine Adducts with Tentative Assignments^
Me-Sb 27
2920-2850 C-H 1375 C-H 1220 C-H
1210 C-H 820 C-H 520 Sb-C
Me-Sb-BCl- Me-Sb'BBr^
2920-2850 vs 1460 1375 1265 965 860 580 520
s s m w m w w
C-H C-H C-H C-H B-Cl B-Cl Sb-C Sb-C
2930-2850 vs C-H 1460 1375 1300 1150 860 610 575
s s w w w w w
C-H C-H C-H
B-Br
Sb-C
a . "1 Frequencies reported in cm V, very; s, strong; m, medium;
Notation w, weak.
for intensities
37
TABLE VII. Infrared Spectral Absorptions of Boron Lewis Acids^
BF. 37'
BCl. 35
BBr. 33
BMe. 28
^2^6 31
1509
1454
888
718
691
480
995
480
471
244
856
820
393
375
278
2980
1305
1180
1160
1145
960
2388
2348
1137
1065
1056
855
TABLE VIII. Raman Spectral Absorptions of Boron Lewis Acids'
37 BF3
1505
1454
888
480
30x33=
995
956
417
224
33
856
820
278
150
BMe-
1440
1295
1195
1145
1060
970
906
53
864
755
675
486
394
320
W 1130
1184
818
802
788
Frequencies reported in cm
38
TABLE IX. Raman Spectral Absorptions of Trimethylphosphine and Trimethylphosphine Adducts with Tentative Assignments^
Me-P'BF-
1438 s B-F,C-H 776 s C-H,B-F 697 m B-F 680 m B-F,P-C 639 s P-C 315 m P-C 293 w P-C 269 m P-C 242 s P-B
Me-P'BBr-
1410 w C-H 978 w C-H 789 s B-Br 773 s B-Br 677 s P-C 629 w P-C 319 s P-C 277 s P-C 264 m B-Br 174 s P-B 147 s B-Br
52 Me-P-BMe^ Me^P-BH^ 1437 m C-H 1428 w C-H 1033 w C-H 960 w C-H 946 w C-H 762 s P-C 841 w C-H 714 s P-C 767 s B-C 662 s P-C 708 s P-C 580 s P-B 683 s P-C 520 w 467 s P-B 296 w P-C 234 s P-B 276 s 222 s B-Cl 218 s
161 s 134 w
54 Me^P
1412 1312 1293 1072 973 948 708 653 305 263
Me^P'
1431 790 778 680 665 300 248 210
C-H C-H C-H C-H C-H C-H P-C P-C P-C P-C
BCI3
w C-H s B-Cl s B-Cl m P-C s P-C s P-C m P-B s B-Br
^Frequencies reported in cm -^. Notation for intensities: V, very; s, strong; m, medium; w, weak.
39
TABLE X. Raman Spectral Absorptions of Trimethylarsine and Trimethylarsine Adducts with Tentative Assignments
54 Me-As
1416 C-H 583 As-C 1263 C-H 568 As-C 1242 C-H 239 As-C 996 C-H 224 As-C
Me-As'BF- Me^As-BCl^
1424 w C-H 1422 w C-H 1305 w B-F 1126 w C-H 718 w B-F 704 w B-Cl 658 s C-H 641 s As-C 637 s C-H 601 s As-C 595 s As-C 265 s As-C 460 w B-F 183 s As-B 181 s As-B
Me^As-BBr^ Me^As-BH^
a
1422 m C-H 1424 m C-H 1128 m C-H 1285 w C-H 959 w C-H 1270 w C-H 679 s B-Br 1140 w B-H 608 s As-C 635 s As-C 468 w 616 s As-C 318 w 497 s As-B 296 w As-C 220 m As-C 264 w As-C 171 s As-C-B 221 m As-B
^Frequencies reported in cm""'-. Notation for intensities V, very; s, strong; m, medium; w, weak.
40
TABLE XI. Raman Spectral Absorptions of Trimethylstibine, Trimethylstibine Adducts and Uncharacterized Reaction Products with Tentative Assignments^
1414 1213
C-C--H -H
Me^Sb-BCl^
1409 1243 1223 1209 770 719 557 408 305 274 264 210 157
w w w w w w w m w m w s s
C-H C-H C-H C-H B-Cl B-Cl Sb-C B-Cl
B-Cl Sb-B
"SR Me^Sb'"'
1194 813 520
C-C-Sb-
-H -H -C
5; L3 Sb-C 188 Sb-C
Me-Sb'BBr-
1408 1236 1226 630 620 316 281 256 180 164 130 121
m w w s s w w w s s m s
C-H C-H C-H B-Br B-Br
B-Br Sb-C
B-Br Sb-B
Raman Spectra Liquid Product of Me^Sb + BF3
1405 w 1228 w 1223 w 1202 w 783 w 570 vs 523 V 198 w 153 vs
Raman Spectra Solid Product Me^Sb + B^Hg
1255 w 1235 w 1214 w 774 w 586 s 314 w
of
-1 ^Frequencies reported in cm ". Notation for intensities V, very; s, strong; m, medium; w, weak.
41
bond formation. The peaks attributable to the vibrations
of the trimethyl Lewis base species were shifted to slightly
higher wave numbers, which is indicative of a shortening of
the M-C bond with a concommitant change in the C-M-C bond
angle due to decreased lone pair repulsion upon coordination.
All frequency shifts observed for the coordinated Lewis bases
were quite small, on the order of 10 to 20 cm""'-. Cullen
49 et_al^. have demonstrated the quaternization of tertiary
arsines resulted in shifts on the order of 50 cm' '-. The
large vibrational frequency increase observed upon quaterni-
zation may be attributed to the higher oxidation state of the
arsenic atom with the attendant increase in As-C bond strength.
Clearly the tertiary bases in our study formed covalent ad-
ducts with the boron Lewis acids rather than quaternary salts.
All of the boron Lewis acids exhibited vibrational fre-
quency shifts to lower wavenumbers upon coordination. Such
2 shifts occur typically when planar, sp hybridized boron
3 Lewis acids coordinate and adopt an approximately sp tetra-
50 hedral configuration. The resultant changes in X-B-X bond
angles and B-X bond strengths were observed as a sizable de-
crease (-100 cm ) in the frequencies of the associated
vibrational modes.
By tentatively assigning the M-B symmetric stretch
observed in the Raman spectra, approximate force constants
for the M-B bonds were calculated. The values given in
42
Table XII were calculated via the simple harmonic oscillator
approximation with the assumption that the observed M-B mode
was a pure M-B stretching mode. The calculated M-B vibra-
tional force constants correlate well with the observed
^^rxn ^^l^^s determined in our laboratory (Table I). While
the general ordering of adduct stabilities (as determined
via calorimetry) approximates the ordering of the strength of
the adduct bonds (as measured by the force constants), there
are minor relative differences. For example, the adduct
which has the second greatest AH , i.e., Me.As.BBr-, has rxn 3 3
the fourth largest force constant. These apparent incon-
sistencies might arise from several sources. First, the
measured AH values include AH^,, . ^.. ^ of the adducts. rxn suDiimation
Although the variation among the AH , , . ^. values is suDiimation
probably not great, it is possible that if the AH ^^ ^ were aaauct
measured directly rather than AH , small differences in the rxn
relative ordering of adduct stabilities might result. Sec-
ondly, the force constant data could be in error due to
either misassignment of the M-B stretching mode or to the
assumption that the M-B stretching mode is not mixing with
other modes. Thirdly, and most likely, there is no particu-
lar reason that the trend in complex stability should be in 51 exactly the same order as the trend m M-B bond strengths.
Variations in reorganization energies could easily explain
minor variations in the ordering of complex stability.
43
TABLE XII.
Adduct
Me-P'BF-
Me^P-BCl^
Me-P-BBr^
Me-P-BMe.,
Me^P-BH^
Me^As-BF^
Me^As'BCl^
Me^As-BBr^
Me^As-BH^
Me^Sb-BCl^
Me^Sb-BBr^
Calculated Vibrational Force Base Bond Symmetric Stretch^
Assigned Peak
(cm~ )
242
248
174
234
571
181
183
221
497
151
121
Constants for Acid-
Calculated Force Constant o
(mdyn/A)
1.23
2.43
2.62
1.04
2.33^
0.81
1.17
2.32
1.81^
0.91
0.86
^Assignments based on comparison to spectra of uncomplexed acids and bases and refs. 11 and 50. ^Ref. 52. ^Ref. 11.
44
Spectra for the systems Me As + BMe- and Me-Sb + BMe-•j j 3 3
were superimpositions of the spectra for the uncomplexed
reactants. The vibrational spectra for the systems Me^Sb +
BF3 and Me^Sb + B^H^ indicated that reaction had occurred,
but that the products were not simple acid base adducts.
Mass Spectra
The mass spectra of the air-stable adducts Me^P-BF-,
Me^P-BCl^, Me^P.BBr^, Me^P-BH^, Me^P.BMe^, Me^As.BCl^,
Me^As-BBr^, Me^As.BH^, Me^Sb.BCl^, and Me^Sb-BBr^ have been
observed and the major peaks with their assignments are given
in Table XIII. None of the mass spectra of halogen-
containing adducts exhibited a parent peak, but all exhibited
fragments containing an acid-base bond. The adducts contain-
ing the BH_ and BMe^ Lewis acid moieties exhibited parent
peaks, Characteristic isotopic envelopes were observed for
fragments containing boron, chlorine, or bromine atoms. Some
weak ion peaks attributable only to M. cage and MMej. ions
were observed for some of the samples,
Conductivity Data
It has recently been shown that some compounds which
would be expected to be simple Lewis acid base adducts are
actually salts formed by ligand transfer. In order to insure
that salt formation was not occurring in present study, the
conductivities of a representative set of adducts were
TABLE XIII. Mass Spectra of Complexes
45
a
+ lon
Me M'
Me M*
Me M-
Me M-
Me M*
Me M-
Me M
Me M
MeM
M'B
BX3
BX^
BX
X
"4
Me_M b
BX3
«==2
BX
B
BX^
BX
Me^P'BF^ 3 3
2
70
100
30
49
»
Me^P'BCl^ 3 3
49
11
4
11
100
100
58
49
36
Me^P'BBr., 3 3
38
2
1
100
46
8
62
Me^P'BMe^ 3 3
b
1
2
2
42
52
12
100
1
Me^P-BH^ 3 3
b
2
19
17
100
45
41
2
•u.
^Reported as % ion intensity. Observed, but less than 1% ion intensity.
46
TABLE X I I I — C o n t i n u e d
+ l o n Me^As-BCl^ Me^As-BBr^ Me^As-BH Me Sb.BCl Me Sb-BBr.
Me M-BX
Me M-BX
Me M'BX
Me M-B
Me^M-BX^ 2 2
Me M-BX
Me M
Me M
MeM
1
2
81
100
32
6
1
98
97
34
b
4
3
96
100
29
4
3
81
46
100
18
24
63
35
45
92
42
M.B
BX 23
BX 78 100 67
BX
14 19 15 100
M, 5 1 4 8 8 4
Me M 2 6 6
a b Reported as % ion intensity. Observed, but less than 1% ion intensity.
47
determined. The conductivities of the adducts Me-P-BBr-,
Me^As'BCl^, and Me^Sb-BBr^"were measured in dry CH^Cl^ under
an inert atmosphere. The very low conductivities observed
(Table XIV) in these experiments indicated that these species
remained associated in CH^Cl^ and that no salt-like species
or conductive dissociation products were present.
TABLE XIV. Conductivity Data
Adduct A- Molar Conductance^(ohm cm )
Me-,P.BBr^ 1.84 x lO"^ .3. .. .3
î^As.BCl^
i^Sb-BBr^
Me-,As.BCl-, 1.64 x 10 "
Me- Sb.BBr., 1.56 x lO""
^Measured in CH^Cl^ at 25°.
Tensiometric Titrations
Tensiometric titrations were carried out on all combin-
ations of Lewis Acids and bases at 0° using either n-nonane
or diglyme as a solvent. The results were those expected for
a 1:1 complexation reaction (Figure 5) for all systems except
the following: Me As.BF , Me As-BMe , Me^Sb.BF^, Me^Sb.BMe^,
and Me Sb.BH . The adduct Me As-BF is highly dissociated j j •j j
14a at low pressures and the tensiometric titration indicated
no observable adduct formation under the conditions of the
experiment. Similar results were obtained for the Me^As +
48
o C M
in
in
1 <—>
ro
.Q æ
ro 0) S m (U
i H
0 e •H rH i H •H
e \ ro
i H
U CQ
01 <U
i H
0 e •H
i H i H •H
e
pq
.C -P •H ^
Xi w ro Q) S
M-l 0
c 0 •H -p nj >-i 4J •H EH
U •H M 4J <U e 0
•H (0
c Q) E-i
in
<U U
t7" •H
in
00
Q)
Í3 ^ -
W U 0 O M EH (U ^
49
BMe^ and Me^Sb + BMe^ systems, indicating no reaction. The
Me^Sb + B^Hg system yielded anomalous results due to the
formation of an uncharacterized white solid and hydrogen gas.
The Me^Sb + BF^ system yielded a clear liquid which showed no
break in the tensiometric titration curve, and was therefore
not a simple adduct.
Gas-Phase Displacement Reactions
The gas-phase displacement reactions were carried out
by allowing the displacing reactant (either an acid or base)
to come into contact with a thin layer of solid complex. By
mixing boron acids with Me-P-BX- solid adducts, the following
sequence of adduct stabilities was demonstrated: Me-P'BBr->
Me-P-BH- > Me-P.BCl- > Me-P.BF > Me-P.BMe.. Similarly for
the Me-As system the order is Me-As-BBr- > Me-As.BH_ >
Me-As.BCl- and for Me-Sb, the order is Me^Sb-BCl^ > Me^-BBr^.
Through experiments involving successive displacements
of bases, the following sequences of adduct stability were
obtained: Me^P-BCl^ > Me^As-BCl^ > Me^Sb.BCl^; Me^P.BBr^ *
Me^As-BBr^ > Me^Sb-BBr^; Me^P.BH^ > Me^As.BH^; and Me^P.BF^ >
Me-.As.BF-. These sequences are in accord with the order
determined by gas-phase calorimetry.
All displacement reactions were performed at ambient
temperature. The times required for quantitative displace-
ment to occur varied widely. The displacement of BCl- from
TEXAS TECH LUttAKt
50
Me^P.BCl^ by BBr^ was very slow, with a half-life of about
24 hrs whereas the displacement of BCI3 from Me^As.BCl^ by
BBr^ was quantitative after 48 hrs. In contrast, the quan-
titative displacement of BMe^ from Me^p.BMe^ by BF3 required
only 2 hrs. No Me^As was displaced from Me^As.BBr^ by Me^P
after six days, but Me^As was displaced from Me^As-BH^ by
Me^P. The probable displacement mechanism involved the re-
action of the very small amount of adduct in the gas phase
with uncomplexed displacing reagent, rather than involving
the heterogeneous reaction between solid adduct and gas-
phase displacing reagent.
No metathesis reactions involving ligand exchange be-
tween the acid and base were observed during any of the
displacement reactions during contact periods of two weeks.
Methylation of the boron halides or halogenation of the
bases would have been readily detected via gas-phase ir
spectroscopy.
Melting Point Data
The melting points of the air-stable adducts given in
Table XV illustrate the danger of attempting to predict
thermodynamic bond stabilities from only melting points. The
correct general trend for Lewis base strengths of Me-P >
Me As > Me Sb was predicted by Holliday and Hewitt in
1953 on the basis of the melting points of the respective
51
borane adducts. The use of any other Lewis acids, such as
those used in the present study, would have led to an en-
tirely different order.
TABLE XV. Melting Point Data
Compound
Me^P'BF^
Me^P-BCl^^
Me^P'BBr^
Me^P-BMe^
Me^P-BH^^
Me^As-BCl^
Me^As-BBr^
Me^As-BH^
Me^Sb-BCl^
Me^Sb-BBr^'
Melting Pt.
139°
239°
248°
91°
101°
310°
242°
72°
269
Comment
decomp
sharp
decomp 180°
subl 50°
sharp
decomp 190°
decomp 180°
sharp
stable to 360°
decomp
Ref. 44. ^Refs. lOa, 57. Ref. lOb.
CHAPTER IV
SUMMARY AND CONCLUSIONS
Of the fifteen possible Lewis acid-Lewis base adducts
which might arise by the reaction of the bases Me^P, Me^As,
and Me^Sb with the boron acids BF3, BCI3, BBr^, BH3, and
BMe^, eleven combinations yielded one-to-one complexes, all
of which were relatively air-stable except Me^As-BF^, due
to its high dissociation vapor pressure. No reaction was
observed between BMe^ with either Me^As or Me^Sb, and Me^Sb
reacted anomalously with B^Hg and BF3. The complexes ex-
hibited "normal" adduct behavior, i.e., they were of only
1:1 stoichiometry, and exhibited no salt-like behavior. No
ligand exchange occurred. Proton nmr was an ineffectual
probe of relative adduct stabilities, while vibrational
spectroscopy and gas-phase displacement reactions yielded
results which are in basic accord with calorimetric
2 determinations.
52
REFERENCES
1. G. N. Lewis, J. Franklin Institute. 226, 293 (1938).
2. H. C. Brown, H. Bartolomay, Jr., and M. D. Taylor, J. Amer. Chem. Soc., 66, 435 (1944).
3. F. G. A. Stone and A. B. Burg, J. Amer. Chem. Soc, 16_, 386 (1954). "
4. D. W. Young, G. E. McAchran, and S. G. Shore, J. Amer. Chem. Soc, 8^, 4390 (1966).
5. See for example: K. Niedenzu and J. W. Dawson in "The Chemistry of Boron and Its Compounds," E, Muetterties, Ed. , John Wiley and Son, New York, N.Y., 1967, pp. 617-667; T. D. Coyle and F. G. A. Stone in "Progress in Boron Chemistry," Vol. I, H, Steinberg and A. L. McCluskey, Ed., Macmillan, New York, N.Y., 1964, pp. 83-160.
6. R. G. Pearson, J. Amer. Chem. Soc, 85, 3533 (1965).
7. R. S. Drago, G. C. Vogel, and T, E. Needham, J. Amer. Chem. Soc , 93 , 6014 (1971).
8. (a) E. Wiberg and W. Sutterlin, Z, Anorg. Chem., 202, 22, 31 (1931); (b) H. C. Brown and R. M. Adams, J. Amer. Chem. Soc , 6_^, 2557 (1942).
9. H. C. Brown and R. R. Holmes, J. Amer. Chem. Soc , 78, 2173 (1956).
10. (a) F. Hewitt and A. K. Holliday, J. Chem. Soc, 530 (1953); (b) M. L. Denniston and D. R. Martin, Inorg. Nucl. Chem. , 36 , 2175 (1961).
11. J. R. Durig, B. A. Hudgens, and J. D, Odom, Inorg. Chem., 12, 2306 (1974).
12. D. F. Shriver, "The Manipulation of Air Sensitive Com-pounds," McGraw-Hill Book Co., New York, N.Y., 1969.
13. G. Urry in "The Chemistry of Boron and Its Compounds," E. L. Muetterties, Ed., John Wiley and Son, New York, N.Y., 1967, pp. 325-376.
53
54
14. (a) D. C. Mente, J. L. Mills, and R. E. Mitchell, Inorg. Chem., 14, 123 (1975); (b) D. C. Mente & J. L. Mil l ~ Inorg. Chem., In Press.
15. J. L. Mills and L. C. Flukinger, J. Chem. Ed., 50, 636 (1973). —
16. (a) H. A. Skinner, Ed., "Experimental Thermochemistry," Vol. II, Interscience Publishers, New York, N.Y. (1962); (b) S. Sunner and I. Wadso, Acta Chem Scand., 13, 97 (1959). —
17. H. C. Dickenson, Bull. Bur. Standards, 11, 189 (1914).
18. H. Hibbert, Chem. Ber., 39, 160 (1906).
19. F. G. Mann, A. F. Wells, and 0. Purdie, J. Chem. Soc, 1828 (1937); F. G. Mann and A. F. Wells, J. Chem. Soc, 708 (1938).
20. L. H. Long and J. F. Sackman, Research Correspondence, S_, 523 (1955).
21. M. Halmann, Spectrochim. Acta, 16, 407 (1960).
22. R. G. Kostyanovskii, I. I. Chervin, V. V. Yakshin, and A. U. Stepanyants, Izv. Akad. Nauk, SSSR, Ser. Khim., 1629 (1967); Chem. Abstr. , 68 , 75338^ (1968).
23. P. B. Ayscough and H. J. Emeleus, J. Chem. Soc, 3381 (1954).
24. H. Siebert, Z. Anorg. Allg. Chem., 273, 161 (1953).
25. W. J. C. Dyke, W. C. Davies, and W. J. Jones, J. Chem. Soc., 463 (1930).
26. C. H. Bamford, D. L. Levi, and D. M. Newitt, J. Chem. Soc., 468 (1946).
27. F. Ostwald, Z. Anal. Chem., 197, 309 (1963).
28. W. J. Lehmann, C. O. Wilson, and I. Sharpiro, J. Chem. Phys. , 28 , 777 (1958) .
29. A. Stock and F. Zelder, Chem. Ber., 54, 531 (1921).
30. A. D. Norman and W. L. Jolly in "Inorganic Synthesis," Vol. XI, W. L. Jolly, Ed., McGraw-Hill Book Co., New York, N.Y., 1968, pp. 15-17.
55
31. R. C. Taylor and A. R. Grimes, Spectrochim. Acta, 10, 419 (1958). -^ —
32. A. Stock and E. Kuss, Chem. Ber., 47, 3113 (1914).
33. T. Wentink and V. H. Tiensuu, J. Chem. Phys., 28, 826 (1958). ^ —
34. M. Green and G. A. Martin, Trans. Far. Soc, 48, 416 (1952). —
35. D. A. Daws and G. Bottger, J. Chem. Phys., 34, 689 (1961). —
36. E. Pohland and H. Harlus, Z. Anorg. Allgem. Chem., 207, 242 (1932).
37. J. Vanderryn, J. Chem. Phys., 30, 331 (1959).
38. G. W. Mappes, S. A. Fridmann, and T. P. Fehlner, J. Phys. Chem., 74, 3307 (1970). Over ten values for the dissociation of diborane into borane units have been reported. We have chosen what appears to be the most generally accepted recent value, although the use of other values would not appreciably change our results.
39. H. C. Brown and M. Gerstein, J. Amer. Chem, Soc, 72, 2923 (1950); H. C. Brown, N. D. Taylor and M, Gerstein, J. Amer. Chem. Soc, 66, 431 (1944).
40. R. H. Harris, Ph.D. Thesis, Purdue University, Lafayette, Ind., 1952.
41. S. Sujishi, Ph.D. Thesis, Purdue University, Lafayette, Ind., 1952.
42. K. J. Alford, E. O. Bishop, P. R. Carey, and J. D. Smith, J. Chem. Soc (A) , 2574 (1971).
43. E. A. Fletcher, Ph.D. Thesis, Purdue University, Lafayette, Ind., 1952.
44. G. M. Phillips, J. S. Hunter, and L. E, Sutton, J, Chem. Soc., 146 (1945).
45. W. A. G. Graham and F. G. A. Stone, J. Inorg. Nucl. Chem., 3, 164 (1956).
56
46. W. A. G. Graham and F. G. A. Stone, Chem. Ind. (London), 319 (1956).
47. G. E. Ryschkewitsch and A. H. Cowley, J. Amer. Chem. Soc , 92 , 745 (1970) .
48. A. H. Cowley and J. L. Mills, J. Amer. Chem. Soc, 91, 2911 (1969).
49. (a) W. R. Cullen, G. B. Deacon, and J. H. S. Green, Can J. Chem. , 43 , 3193 (1965); (b) W. R. Cullen, G. B. Deacon, and J. H. S. Green, ibid., 44, 717 (1966).
50. J. R. Durig, S. Riethmiller, V. G. Kalasinsky, and J. D. Odom, Inorg. Chem., 13, 2729 (1974).
51. D. F. Shriver and B. Swanson, Inorg. Chem., 10, 1354 (1971).
52. P. S. Bryan and R. L. Kuczkowski, Inorg. Chem., 11, 553 (1972).
53. J. Goubeau and H. J. Becher, Z. Anorg. Allgem. Chem., 268, 1 (1952).
54. E. J. Rosenbaum, D. J. Rosenbaum and T. A. Ashford, J. Chem. Phys., 1_' ^54 (1959).
55. E. J. Rosenbaum and T. A. Ashford, J. Chem. Phys., 1_, 554 (1959).
56 (a) E. R. Alton, R. G. Montemayor, and R. W. Parry, Inorq. Chem., 13., 2267 (1974); (b) R. W. Parry, private communication.
57. A. B. Burg and R. I. Wagner, J. Amer. Chem. Soc, T5, 3872 (1952).
57
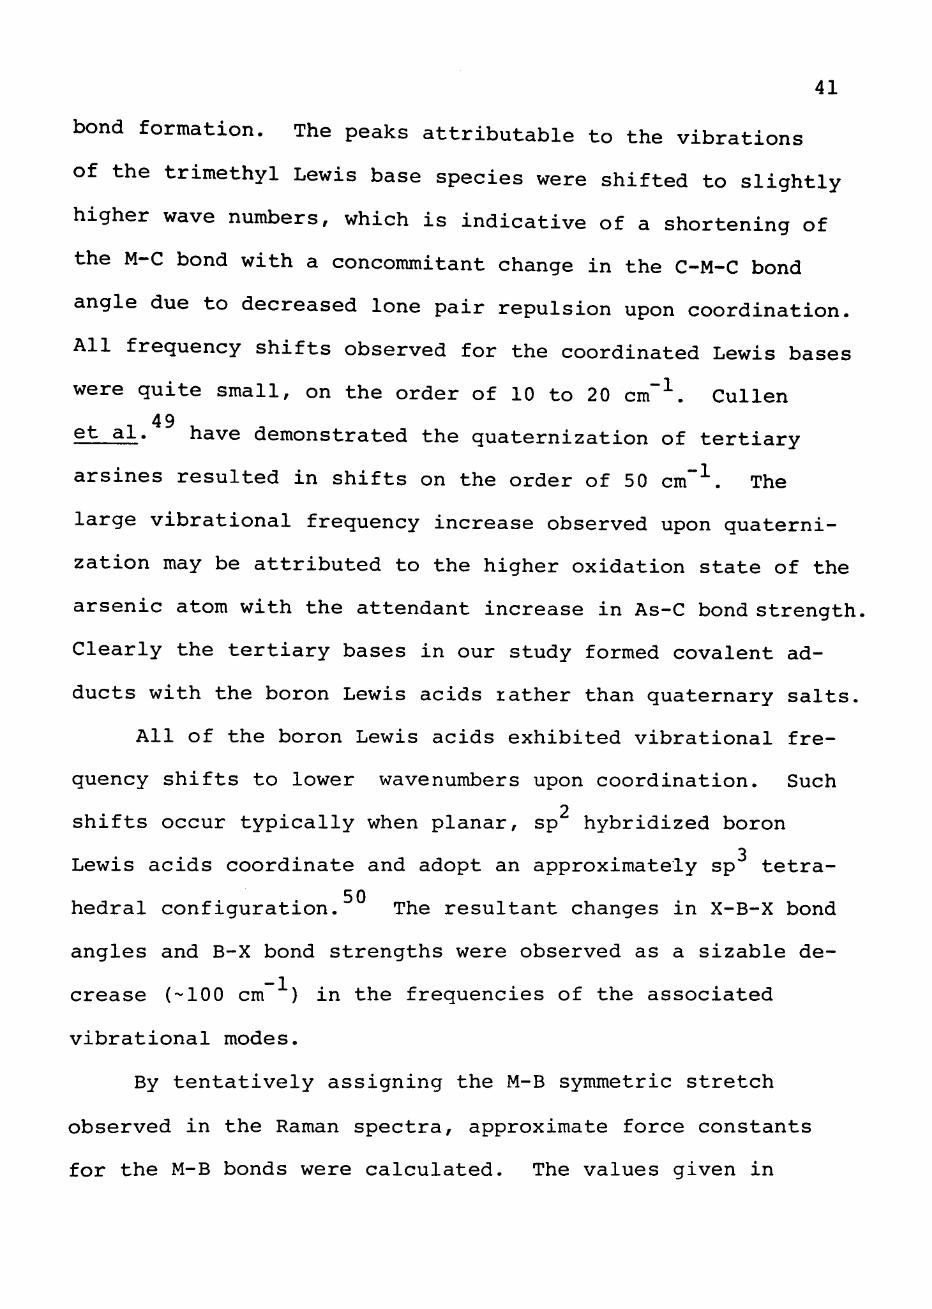
APPENDIX A: REPRESENTATIVE SPECTRA
\-<-«>««*<\JW''W- ^ y v w A r ^ UV \^fi^^>*^
l o b o cm" 1500 500
a. Raman spectrum of Me^As-BBr^. See Experimental Section for details.
58
3000 2000 1500 cm"
b.
1 0 0 0 400
Infrared spectrum of Me-As-BBr-. See Experimental Section for details.
148 94 Hz
c. Proton nmr spectrum of Me^As-BBr^ (148 Hz) plus excess Me^As (94 Hz) with internal TMS. See Experimental Section for details.
59
APPENDIX B: SUGGESTIONS FOR FURTHER INVESTIGATION
Several avenues for possible further investigation have
become apparent through the completion of this dissertation.
Structure determinations of the adducts by x-ray crystal-
lographic methods is a logical extension of this work. A
series of crystal structures of these adducts would provide
very interesting data concerning bond lengths and bond
angles and their relationship with adduct stabilities. The
substitution of various ligands for the methyl groups on
the Lewis bases would provide an interesting study of sub-
stituent effects at heavy atom centers, much in the tradi-
tion of H. C. Brown's classic work with substituted amines.
The characterization of the polymeric product resulting
from the reaction of trimethylstibine and diborane may re-
veal some novel antimony-boron polymers or perhaps some
adamantine-like cages. Finally, the vacuum-pyrolysis prod-
ucts of some or all of these adducts may have considerable
utility as dopants for use in solid state electronic
components.