1 The Real Consequences of Property Tax Compression for Oregon Public Schools Matthew Davis Andrea Vedder Presented to the Department of Economics at the University of Oregon, in partial fulfillment of the requirements for honors in Economics. Under the supervision of Professor Joe Stone June 2014 Abstract: Since Oregon’s stringent property tax reforms in the mid-1990s, tax limitations have created a complex and somewhat unpredictable levy system for local public service administrators who rely on property taxes to fund their operations. School districts, in particular, have hit the tax limitations and been forced to reckon with expected but uncollected (“compresed”) property tax revenue. This study examines the relationship between property tax compression rates and school production in Oregon, which we measure with the district-wide percentage of eighth grade students who meet or exceed state standards in the mathematics assessment. From the Oregon Departments of Education and Revenue, we’ve compiled a panel data set on 147 school districts over the six academic years from 2006-2007 to 2011-2012. We’ve created an Ordinary Least Squares model designed to control for demographic, financial, and fixed district and year effects that may affect a district or year’s overall level of student achievement, and attempt to isolate the effect that property tax compression has on district production. Our results indicate that there is a significant quadratic relationship between property tax compression rates and student achievement, such that while low levels of compression have positive effects on achievement, very high compression rates negatively affect student achievement. Simply put, our results indicate that, in a relative sense, a little compression is paradoxically a good thing for school districts, but a lot of compression is not. Acknowledgements: For helpful comments, unwaning interest, and seemingly undivided attention, we are grateful to our advisor, Professor Joe Stone.
Transcript
1
The Real Consequences of Property Tax Compression for Oregon Public Schools
Matthew Davis
Andrea Vedder
Presented to the Department of Economics at the University of Oregon, in partial fulfillment of the requirements for honors in Economics.
Under the supervision of Professor Joe Stone
June 2014 Abstract: Since Oregon’s stringent property tax reforms in the mid-1990s, tax limitations have created a complex and somewhat unpredictable levy system for local public service administrators who rely on property taxes to fund their operations. School districts, in particular, have hit the tax limitations and been forced to reckon with expected but uncollected (“compresed”) property tax revenue. This study examines the relationship between property tax compression rates and school production in Oregon, which we measure with the district-wide percentage of eighth grade students who meet or exceed state standards in the mathematics assessment. From the Oregon Departments of Education and Revenue, we’ve compiled a panel data set on 147 school districts over the six academic years from 2006-2007 to 2011-2012. We’ve created an Ordinary Least Squares model designed to control for demographic, financial, and fixed district and year effects that may affect a district or year’s overall level of student achievement, and attempt to isolate the effect that property tax compression has on district production. Our results indicate that there is a significant quadratic relationship between property tax compression rates and student achievement, such that while low levels of compression have positive effects on achievement, very high compression rates negatively affect student achievement. Simply put, our results indicate that, in a relative sense, a little compression is paradoxically a good thing for school districts, but a lot of compression is not. Acknowledgements: For helpful comments, unwaning interest, and seemingly undivided attention, we are grateful to our advisor, Professor Joe Stone.
2
Table of Contents
1. Introduction 3
1.1 A Brief Explanation of Oregon Property Tax Reform and Compression 4
1.2 Oregon Property Taxes and K-12 Education 6
1.3 The Link Between Tax Compression and Student Outcomes 7
2. Literature Review 7
3. Hypothesis and Methodology 9
3.1 Regression Equation 11
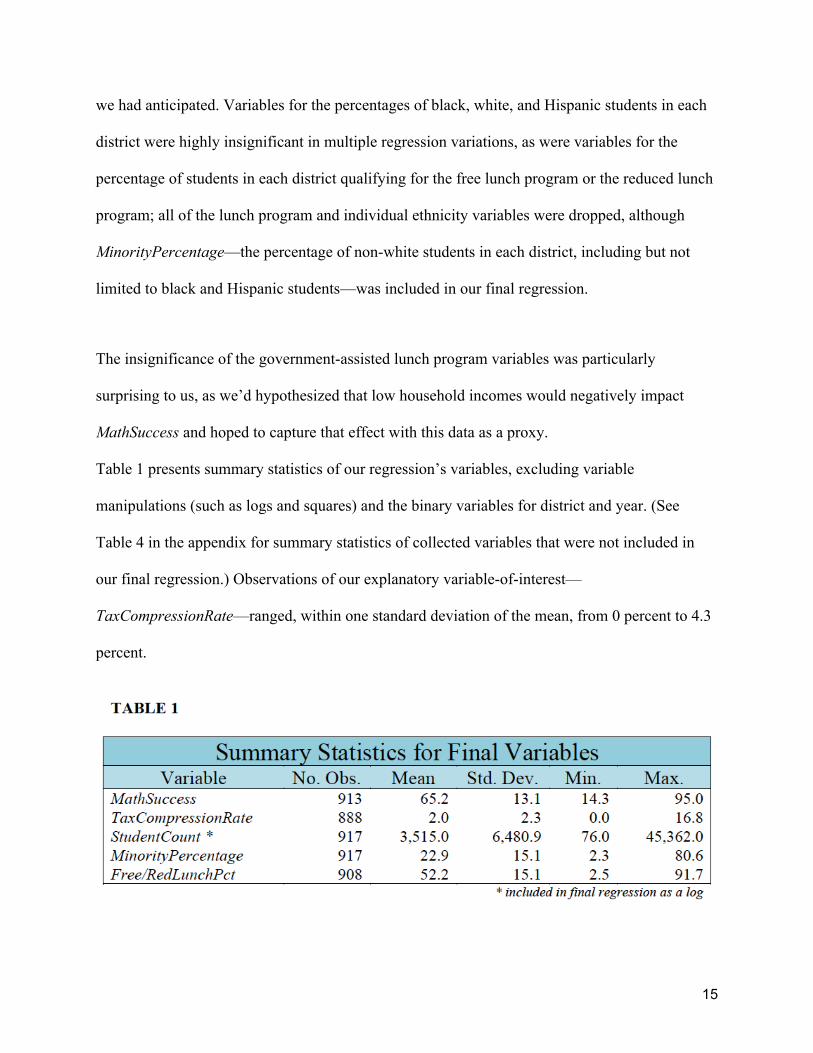
4. Data Description 12
5. Results 16
5.1 The Differences in Districts Over the “Tipping Point” 20
6. Conclusion 22
7. Appendix 24
8. Bibliography 29
3
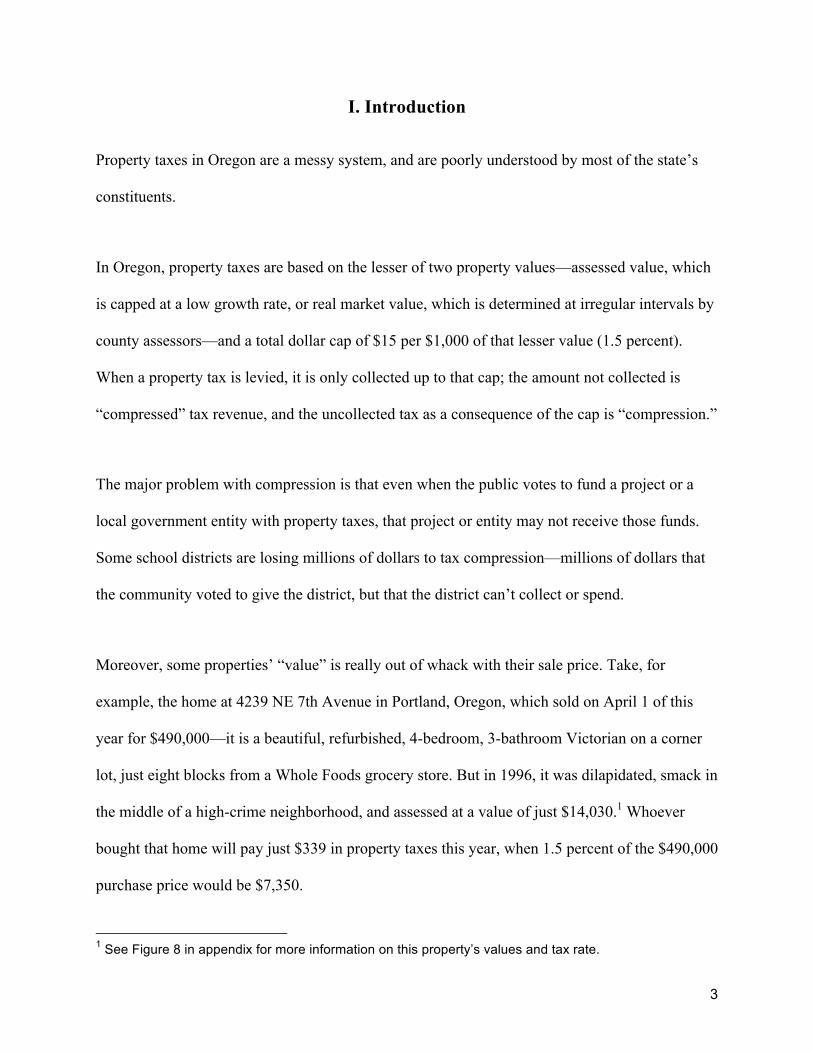
I. Introduction
Property taxes in Oregon are a messy system, and are poorly understood by most of the state’s
constituents.
In Oregon, property taxes are based on the lesser of two property values—assessed value, which
is capped at a low growth rate, or real market value, which is determined at irregular intervals by
county assessors—and a total dollar cap of $15 per $1,000 of that lesser value (1.5 percent).
When a property tax is levied, it is only collected up to that cap; the amount not collected is
“compressed” tax revenue, and the uncollected tax as a consequence of the cap is “compression.”
The major problem with compression is that even when the public votes to fund a project or a
local government entity with property taxes, that project or entity may not receive those funds.
Some school districts are losing millions of dollars to tax compression—millions of dollars that
the community voted to give the district, but that the district can’t collect or spend.
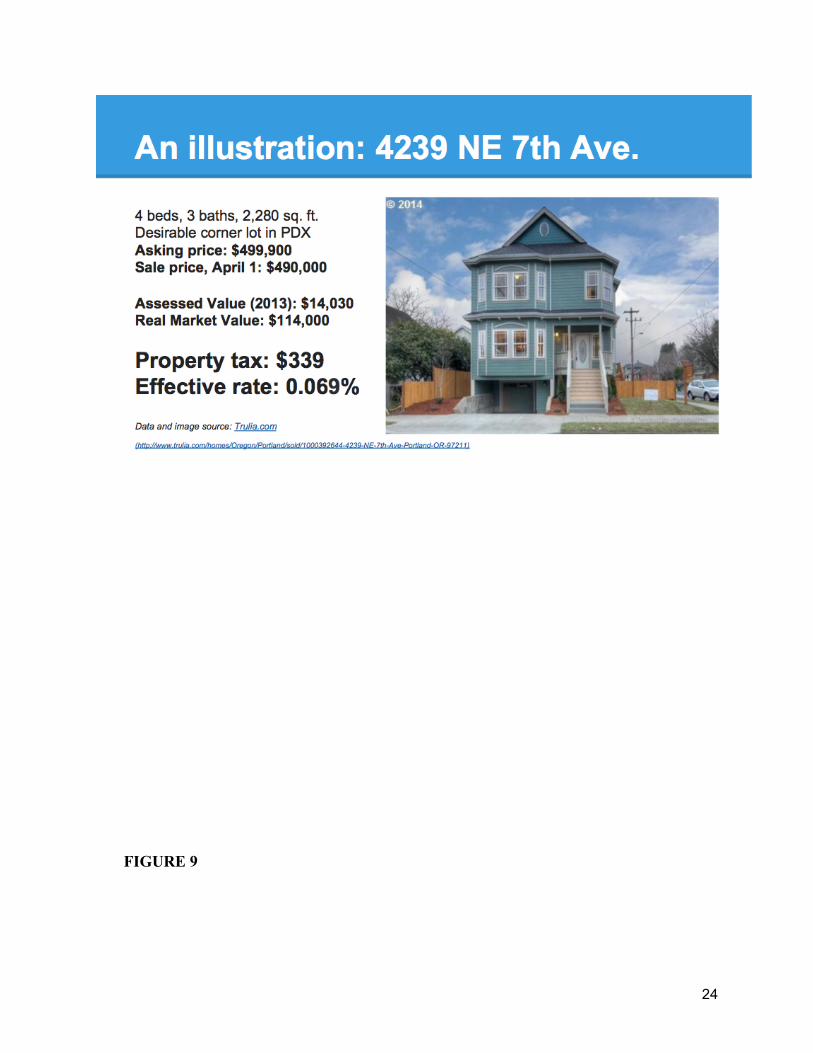
Moreover, some properties’ “value” is really out of whack with their sale price. Take, for
example, the home at 4239 NE 7th Avenue in Portland, Oregon, which sold on April 1 of this
year for $490,000—it is a beautiful, refurbished, 4-bedroom, 3-bathroom Victorian on a corner
lot, just eight blocks from a Whole Foods grocery store. But in 1996, it was dilapidated, smack in
the middle of a high-crime neighborhood, and assessed at a value of just $14,030.1 Whoever
bought that home will pay just $339 in property taxes this year, when 1.5 percent of the $490,000
purchase price would be $7,350.
1 See Figure 8 in appendix for more information on this property’s values and tax rate.
4
Another potential problem with tax compression is that a service the public has voted to fund is
not only not actually being funded to the public’s specifications, but has also been “paid for” in
the voters’ minds, and may therefore garner much less political support for future or concurrent
supplemental funding, such as from the state general fund. Consider, for example, whether you
would vote to approve a local option levy in your district for $10 million, if just two years earlier
you had voted to approve a local option levy for $25 million. Likely, you would doubt that the
district really needed the additional funds. The reality may be that they never collected all $25
million, or perhaps not even half of it.
If this is the case, and property tax compression presents a situation in which a valued and
demanded service is simultaneously underfunded and hindered from successfully securing other
public funding sources, then compression could be affecting Oregon’s public services—
including K-12 education—to a degree far beyond what the simple subtraction of collected tax
from levied tax could tell us.
1.1 A Brief Explanation of Oregon Property Tax Reform and Compression
Oregon established its property taxes in the mid-nineteenth century, and almost nothing within
this system changed until the 1990s. Prior to the changes, Oregon had a levy-based system, in
which local entities would set their own tax rates based on their needs and estimate revenue
based on the real market values of area homes. Tax rates varied depending on which taxing
district a home lay within. These taxes funded schools at a rate no greater than $15 per $1,000 of
real market value.
In the 1990s, Oregon saw a rash of statewide ballot measures aiming to radically change the
5
property tax system in Oregon.
One of the most significant of these was Measure 5, a state constitutional amendment that passed
in 1990 and was fully implemented in 1992. This measure placed limits on the amount of tax that
could be collected from a property. These limits were $5 per $1,000 of assessed value for school
districts (phased in over three years), and $10 per $1,000 of assessed value for general local
government expenses.
In 1997, Measure 50—another state constitutional amendment—further restricted the property
tax system in Oregon by establishing limits on the growth rates of taxable property value,
ostensibly to make property tax payments more predictable and to shelter homeowners from wild
fluctuations in the real estate market. Taxable property value was defined as the 1996 assessed
value of a property, plus a 3 percent annual increase; this value is referred to as a home’s
assessed value. (New homes’ assessed values are their original assessed value, plus a 3 percent
annual increase.)
Tax compression is the effect of a passed tax increase—either in the form of a permanent rate
increase or a local option levy—hitting the Measure 5 dollar-limit per $1,000 of either a
property’s Measure 50-defined assessed value or its real market value, whichever is lesser. When
tax compression occurs, only tax revenue up to each property’s limit is collected and distributed
amongst the government entities expecting property tax revenue to fund their budgets.
Local option levies—passed most often by public service districts like fire, police, and schools,
to fund building renovations or other atypical expenses—are the first in line to lose revenue to
6
tax compression. If a levy’s collected taxes for a property are reduced to zero and tax
compression is still in effect for that property, then permanent rate tax collection is reduced until
the tax cap dollar-limit is reached.
This process is complex and confusing, leaving many Oregonians unaware that funding
measures they supported on the ballot could be limited or eliminated by property tax
compression. Local government officials and school district administrators themselves may not
understand or anticipate the effects of tax compression on their revenue stream, and may not be
accounting for it in their budgets.
1.2 Oregon Property Taxes and K-12 Education
Property taxes in Oregon are essentially separated into two pools: taxes for local education, and
taxes for every other local service. The two pools are taxed at different rates, and face different
caps, with education funding being the most straightforward to measure and track.2
Before Measure 5 passed in 1990, property taxes paid for approximately 70 percent of Oregon’s
public education; by the 2011 school year, property tax revenue averaged just 30 percent of an
Oregon district’s revenue (Linhares, 2011). A cursory glance at the data shows that Oregon’s
school districts are experiencing property tax compression in greater numbers and at greater
magnitude than local governments and other local public services, which makes Oregon school
districts a prime choice for examination of the real effects of property tax compression.
2 Fee Figure 9 in appendix for an example of property tax distribution in Wasco County, Oregon.
7
1.3 The Link Between Tax Compression and Student Outcomes
This study attempts to measure the effects of property tax compression on Oregon’s education
production by regressing the rate of compressed tax (as a percentage of total tax levied) on the
percentage of eighth grade students who meet or exceed state standards on the mathematics
assessment. The primary aim of this research is to determine whether tax compression has an
effect on school outcomes that is distinct from the effects of the existence of a tax cap, or a
reduction in overall funding levels.
Our principal finding is that property tax compression does have an effect on student
achievement, significant at the 5-percent level. Tax compression positively affects student
outcomes (at a diminishing rate-of-growth) until a school district reaches a tax compression rate
threshold of 8.66 percent, after which point the positive effects of tax compression on student
achievement begin to decline as the tax compression rate continues to increase. According to our
model, the effects of tax compression remain positive until a total compression rate of 17.33
percent is reached; we predict that compression rates above 17.33 percent will negatively affect
student achievement, although no Oregon district has yet reached that threshold (the highest
compression rate in Oregon was in Morrow School District in 2012, at 16.83 percent).
II. Literature Review
Although several economic studies have looked at the link between school district funding and
student performance, and a few have examined the impact that local tax limits have on school
districts (both in terms of district funding and district-level student performance), none have
8
attempted to answer the question of whether local tax compression has an effect on student
performance.
However, there is a strong basis for the question. While much of the existing literature
examining the link between school funding and student performance finds few to no significant
effects (Hanushek, 1986, 1989, and 1997; Hoxby, 2004), research examining property tax inputs
specifically has found stronger links between tax revenue limitations and declines in student
performance (Downes and Figlio, 1998; McMillen and Singell, 2007). In particular, Downes and
Figlio (1998) find that a state’s imposition of tax or expenditure limits on local government
(including schools) significantly reduces the mean student performance in that state on
standardized math tests, and that the reduction in scores is greater for poorer district areas. The
authors use detailed data on individual students from the National Longitudinal Survey of the
High School Class of 1972 and the National Educational Longitudinal Survey to control for
demographics, and Census data to determine school district qualities, including the existence of
local tax limitations, and compare student achievement levels on standardized reading and
mathematics assessments in 1972 and 1992. They find no significant effect on reading scores,
but did find relative reductions in the mean mathematics score to the order of 5.5 to 6 percent in
states that implemented a tax limit in the 1970s or 1980s.
Both Dye, et. al. (2005) and McMillen and Singell (2007) find a negative relationship between
property tax limitations, or “caps,” and school district expenditures. McMillen and Singell
(2007) find a significant decrease in district-level per-pupil expenditures in states that adopted a
tax limit reform between 1990 and 2000, but a less-consistent relationship between class size and
the same districts, suggesting that decreases in revenue most greatly affect non-instructional
9
costs. This finding is consistent with what one might expect from a unionized school district, in
which instructional costs are nearly fixed. Dye, et. al. (2005) examine whether the revenue
impacts of capped property taxes for school districts compound over time as a result of “assessed
value” growth limits that err on the conservative side, and find that while tax caps do reduce the
growth of total school district expenditures, the effects do not seem to be any less binding in the
short-run (two to three years) than in the long-run (nine years).
Although the existence of property tax caps in a district has been linked to lower expenditures
and lower average student performance on mathematics assessments, no study that we are aware
of has attempted to measure the relationship between the amount of property tax lost to the cap
and these same outcomes. Relatively little is known about the relationships between lost—
compressed—property tax revenue and school district inputs or production. By measuring the
rates of compressed tax revenue relative to the expected total tax revenue of a district, we hope to
capture the unique effects of tax compression in the education production function—namely, the
disconnect between a community’s demand for education (the levied tax) and its true education
inputs (the collected tax).
III. Hypothesis and Methodology We believe there are unique effects captured by property tax compression, more complicated
than the simple fact of an imposed tax limitation. The fact of compression in a school district
does represent a disconnect between the district’s demand—on the part of the voters—for
education funding of a certain caliber and the district’s actual education supply, and the rate of
10
compression essentially measures the magnitude of that disconnect. It stands to reason that, at
high levels of property tax compression, we may see negative results in education production.
Is property tax compression affecting Oregon’s public school outcomes? We are testing this
question by examining the relationship between a district’s tax compression rate and its student
achievement levels, which we are measuring with the district’s percentage of eighth grade
students who meet or exceed Oregon state standards in the annual statewide mathematics
assessment. We expect to find that an increase in a district’s tax compression rate leads to a
decrease in student achievement levels.
Eighth grade mathematics assessment scores are a well-established gauge for education
production (Hanushek and Raymond, 2005; Hoxby, 2004), and may best capture the true effects
of a school district’s contribution to a student’s learning, as by age 13, students have surpassed
the period during which their performance levels in school are largely dictated by parental
involvement and guidance, but are not yet running up against the complications of high school-
level measurement, where math classes and ability levels can range from pre-algebra to college-
level integral calculus. Comparatively, reading tests are too easily susceptible to a student’s
interest and ability level developed outside of the classroom.
Controlling for demographic and financial effects that may affect a district’s overall level of
student achievement, we hope to isolate the effect that property tax compression has on district
production.
11
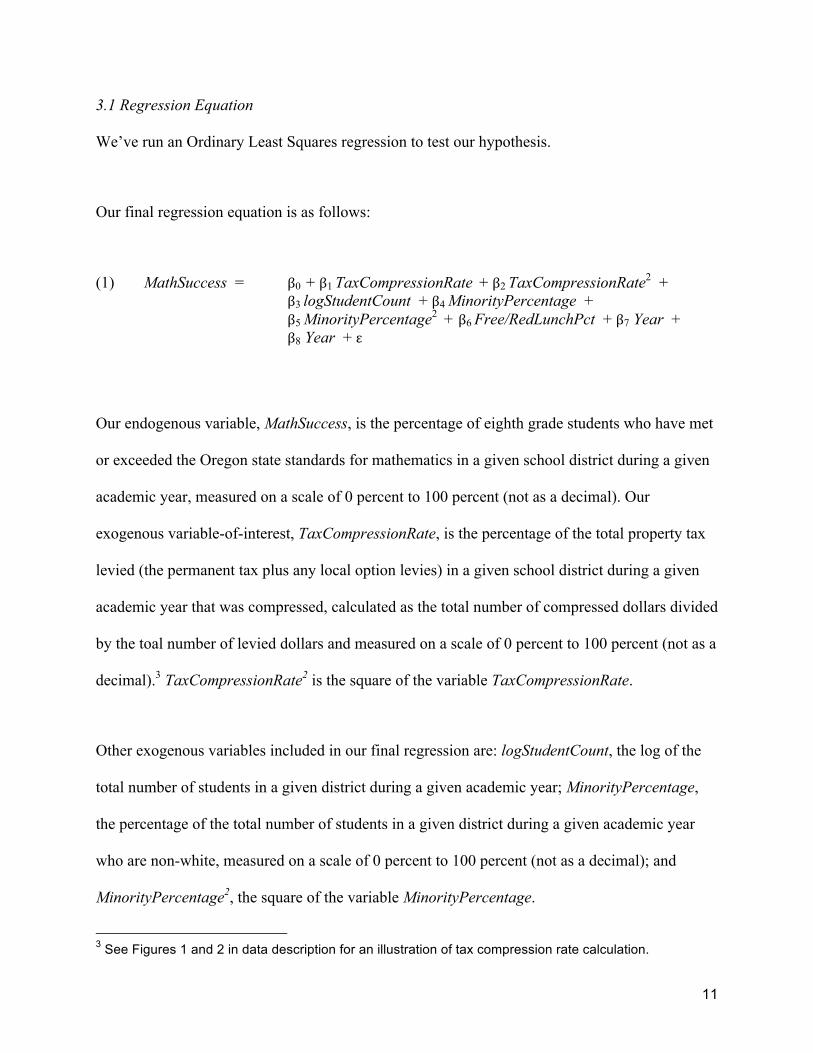
3.1 Regression Equation
We’ve run an Ordinary Least Squares regression to test our hypothesis.
and, setting Equation 3 equal to zero and using the coefficient estimates from Table 2 for β1 and
β2, solved for a TaxCompressionRate “tipping point” of 8.66 percent.
FIGURE 3
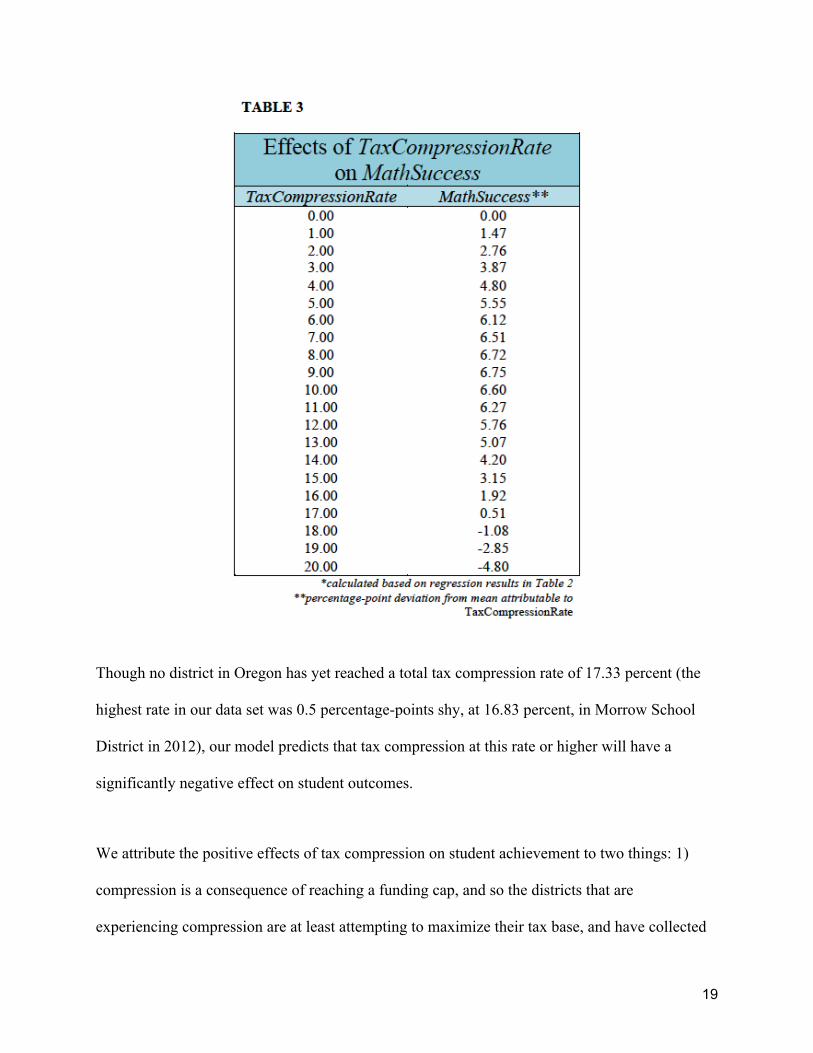
As is roughly illustrated in Figure 3 above and Table 3 below, tax compression significantly and
positively affects student outcomes (at a diminishing rate-of-increase) until a school district
reaches the 8.66-percent threshold, at which point the positive effects of tax compression on
MathSuccess begin to decline as TaxCompressionRate increases. According to our model, the
effects of tax compression remain positive until a total compression rate of 17.33 percent is
reached.
19
Though no district in Oregon has yet reached a total tax compression rate of 17.33 percent (the
highest rate in our data set was 0.5 percentage-points shy, at 16.83 percent, in Morrow School
District in 2012), our model predicts that tax compression at this rate or higher will have a
significantly negative effect on student outcomes.
We attribute the positive effects of tax compression on student achievement to two things: 1)
compression is a consequence of reaching a funding cap, and so the districts that are
experiencing compression are at least attempting to maximize their tax base, and have collected
20
significant revenue given their constraints, and 2) we suggest the possibility of a state general
fund mechanism that replaces lost property tax revenue to school districts but that
overcompensates, doling funds in excess of the compressed revenue.
The eventual negative effects of tax compression, we believe may be related to the same state
general fund mechanism, which likely tops out at a certain level of replacement funding, as well
as to budget cut constraints faced by school districts due to union contracts with teachers and
staff or, potentially, due to enormous temporary expenses such as construction costs, which—if
our sense is correct and the precise degree of tax compression is largely unanticipated by local
administrators—may have been committed to after a local option levy was approved but before
collected tax revenues fell short of projections.
5.1 The Differences in Districts Over the “Tipping Point”
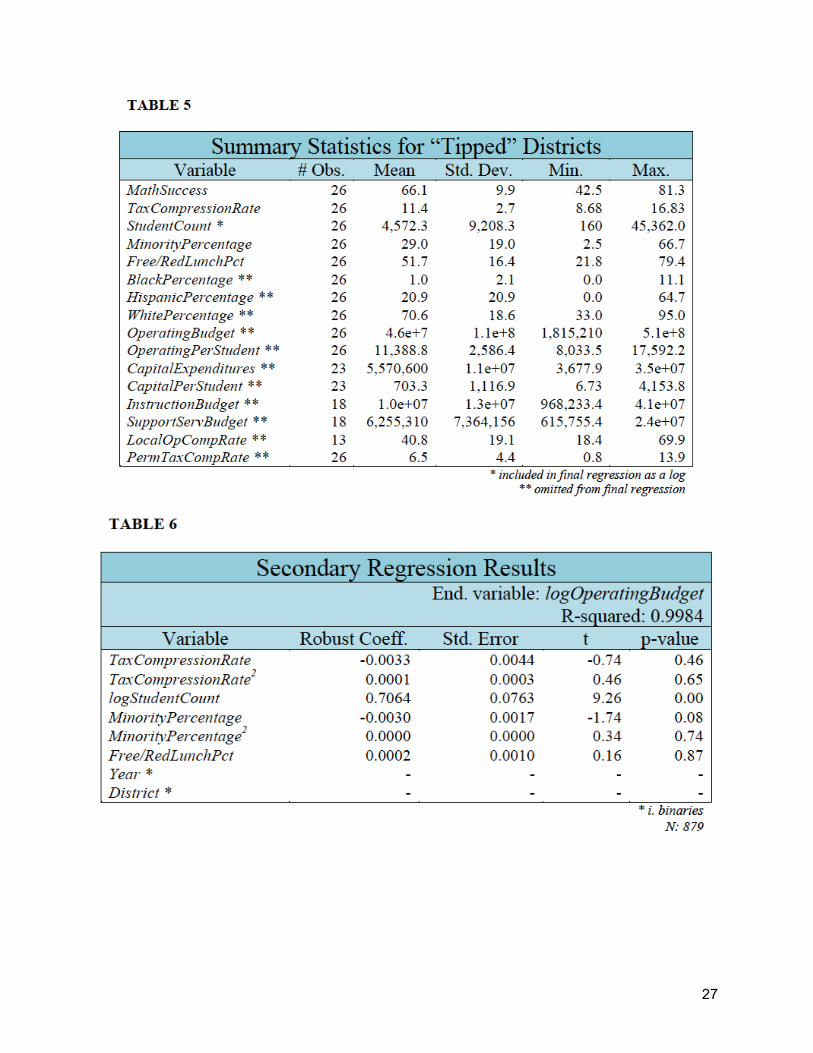
Twenty-six observations in our dataset reached the 8.66-percent threshold for total tax
compression rate; half of those observations included local option levies.4
Downes and Figlio (1998) find a stronger negative relationship between tax limits and student
outcomes in poorer school districts (specifically, districts with lower per-pupil expenditures in
the base year of their analysis), so in closer examination of the differences between districts with
high rates of compression and those low or no compression, we turned our attention primarily to
district funding levels. When comparing the per-pupil operating budgets for the two district
groups in Figures 4 and 5, we find that “tipped” districts seem to be fairly representative of the
center distribution of all districts (i.e., the means and standard deviations are comparable across
4 See Table 5 in the appendix for summary statistics of “tipped” districts.
21
the two groups). Neither the richest nor the poorest districts are included in the “tipped” group.
FIGURE 4 FIGURE 5
FIGURE 6 FIGURE 7
Looking at per-pupil capital expenditures across the two district groups, we see that “tipped”
districts are spending less: the mean and standard deviation for “tipped” districts are $703.34 and
$1,116.94, respectively, while the mean and standard deviation for all districts are $1,084.70 and
$2,748.30, respectively. Nearly 15 percent of all districts are spending more on capital
22
expenditures than the maximum amount spent by a “tipped” district; half of all districts are
spending more than the average “tipped” district.
This data seems to support the findings of McMillen and Singell (2007), in that the compression-
imposed revenue constraints of Oregon’s “tipped” districts appear to be channeled towards non-
instructional budget cuts.
VI. Conclusion This study attempts to measure the effects of property tax compression—or, tax revenue
expected but not collected due to tax caps—on Oregon’s education production by regressing the
rate of compressed tax (as a percentage of total tax levied) and school district demographic data
against the percentage of eighth grade students who meet or exceed state standards on the
mathematics assessment. The primary aim of this research is to determine whether tax
compression has an effect on school outcomes that is distinct from the effects of the existence of
a tax cap, or a reduction in overall funding levels.
The principal finding of our research is that property tax compression does have an effect on
student achievement, significant at the 5-percent level. Tax compression is positively related to
student outcomes (at a diminishing rate-of-growth) until a school district reaches a tax
compression rate threshold of 8.66 percent, a ‘tipping point where the effects of tax compression
on student achievement become non positive and begin to turn negative, as the tax compression
rate continues to increase.
23
While the results of our study establish a significant relationship between property tax
compression rates and school outcomes, further examination of the state funding mechanisms
that tax compression triggers would illuminate the counter-intuitive result that low rates of
compression have positive effects on student achievement. A more complete picture of the
constraints school districts face in making budget cuts, when presented with lower-than-expected
property tax revenue, may also contribute to the literature on tax limitations and education; our
results suggest that school districts in this position are making cuts to capital expenditures, which
seems consistent with previous findings (McMillen and Singell, 2007), but more research is
needed.
VII. Appendix
FIGURE 8
24
FIGURE 9
25
FIGURE 10
26
27
28
VIII. Bibliography
Coate and VanderHoff. 1999. ‘Public School Spending and Student Achievement: The Case of New Jersey’, Cato Journal. 19:1, 85-99. Downes and Figlio. 1998. ‘School finance reforms, tax limits, and student performance: Do reforms level-up or dumb down?’, Memo, Tufts University, Cambridge, MA. Dye, et. al. 2005. ‘Are Property Tax Limitations More Binding Over Time?’, National Tax Journal. Vol. LVIII, No. 2, 215-225. Eberts, Stone and Hollenbeck. 2004. ‘Teachers’ Unions, Outcomes and Reform Initiatives’, Teachers’ Unions and Education Policy. Henderson, et. al. eds. Elsevier Press Eberts and Stone. 2002. ‘Teacher Performance Incentives and Student Outcomes’, Journal of Human Resources. 37:4. 913-27.
29
Hanushek and Raymond. 2005. ‘Does School Accountability Lead to Improved Student Performance?’, Journal of Policy Analysis and Management, Vol. 24, No. 2, 297-327. Hanushek and Raymond. 2004. ‘The Effect of School Accountability Systems on the Level and Distribution of Student Achievement’, Journal of the European Economic Association, 2(2-3):406-415. Hodge, et. al. 2013. ‘Tax Base Erosion and Inequity From Michigan’s Assessment Growth Limit: The Case of Detroit’, CESifo WP no. 4098. Hoxby, 2004. ‘Productivity in Education: The Quintessential Upstream Industry’, Southern Economic Journal, 71(2), 209-231. Hoxby. 2001. ‘All School Finance Equalizations Are Not Created Equal’, Q. J. E. 116:4, 1189-1231. Hoxby. 1998. ‘How Much Does School Spending Depend on Family Income? The Historical Origins of the Current School Finance Dilemma’, American Economic Review. Vol. 88, No. 2, 309-314. Linhares. 2011. ‘Recent History of Oregon’s Property Tax System: With an Emphasis on Its Impact on Multnomah County Local Governments.’ Ed. Provost. Portland: Multnomah County Tax Supervising and Conservation Committee. PDF File. McMillen and Singell. “School Finance Reforms and Property Tax Limitation Measures.” School Finance Reforms and Property Tax Limitation Measures: Fiscal Decentralization and Land Policies. Ed. Ingram and Hong. 2007, Cambridge, Massachusetts. Cambridge: Lincoln Institute of Land Policy, n.d. Print. Neal and Schazenbach. 2007. ‘Left Behind by Design: Proficiency Counts and Test-Based Accounting’, NBER WP no. 13681. A Brief History of Oregon Property Taxation. Salem: Oregon Dept. of Revenue, 2009. PDF File. City Property Tax Data. Salem: League of Oregon Cities, 2013. PDF File. Oregon Property Tax Statistics, Fiscal Year 2012-2013. Salem: Oregon Dept. of Revenue, 2013. PDF File. “Public Education in Oregon.” Oregon Blue Book. Oregon Secretary of State, n.d. Web. 9 March 2014.
30
SPECIAL REPORT: Voter-Approved Tax Levies Losing More Money Than Ever Before. Salem: League of Oregon Cities, 2013. PDF File. Where The Money Goes: A Report on City Property Taxes. Salem: League of Oregon Cities, 2013. PDF File.