+ All Categories
Home > Documents > The Real Exchange Rate and Growth in Zimbabwe: Does the ...ftp.iza.org/dp8398.pdf · The Real...

The Real Exchange Rate and Growth in Zimbabwe: Does the ...ftp.iza.org/dp8398.pdf · The Real...

Date post: 08-Nov-2018
Category:
Upload: dangtuyen
View: 219 times
Download: 0 times
Share this document with a friend
28
DISCUSSION PAPER SERIES Forschungsinstitut zur Zukunft der Arbeit Institute for the Study of Labor The Real Exchange Rate and Growth in Zimbabwe: Does the Currency Regime Matter? IZA DP No. 8398 August 2014 Zuzana Brixiová Mthuli Ncube
Transcript

DI

SC

US

SI

ON

P

AP

ER

S

ER

IE

S

Forschungsinstitut zur Zukunft der ArbeitInstitute for the Study of Labor

The Real Exchange Rate and Growth in Zimbabwe: Does the Currency Regime Matter?

IZA DP No. 8398

August 2014

Zuzana BrixiováMthuli Ncube

The Real Exchange Rate and

Growth in Zimbabwe: Does the Currency Regime Matter?

Zuzana Brixiová African Development Bank

and IZA

Mthuli Ncube African Development Bank

Discussion Paper No. 8398 August 2014

IZA

P.O. Box 7240 53072 Bonn

Germany

Phone: +49-228-3894-0 Fax: +49-228-3894-180

E-mail: [email protected]

Any opinions expressed here are those of the author(s) and not those of IZA. Research published in this series may include views on policy, but the institute itself takes no institutional policy positions. The IZA research network is committed to the IZA Guiding Principles of Research Integrity. The Institute for the Study of Labor (IZA) in Bonn is a local and virtual international research center and a place of communication between science, politics and business. IZA is an independent nonprofit organization supported by Deutsche Post Foundation. The center is associated with the University of Bonn and offers a stimulating research environment through its international network, workshops and conferences, data service, project support, research visits and doctoral program. IZA engages in (i) original and internationally competitive research in all fields of labor economics, (ii) development of policy concepts, and (iii) dissemination of research results and concepts to the interested public. IZA Discussion Papers often represent preliminary work and are circulated to encourage discussion. Citation of such a paper should account for its provisional character. A revised version may be available directly from the author.

IZA Discussion Paper No. 8398 August 2014

ABSTRACT

The Real Exchange Rate and Growth in Zimbabwe: Does the Currency Regime Matter?1

Zimbabwe faces growth and external competitiveness challenges, as indicated by its low trend growth and investment, declining share in the world exports, high current account deficits, and external debt. The stock-flow approach to the equilibrium exchange rate reveals that the real exchange rate experienced periods of sizeable overvaluation, both prior to the 2008 economic collapse and under the current multicurrency regime. While overvaluation hampers GDP growth, as well as growth and employment in export sectors, we have not found that undervaluation would raise it. Replacing the multicurrency regime anchored in the US$ by the South African rand as the sole transaction currency would help reduce overvaluation and stimulate exports and growth. Under any currency regime, Zimbabwe needs to adhere to sound macroeconomic policies, avoid overspending on public wages, and create environment conducive for investment. JEL Classification: F36, F41, C22, O11 Keywords: real exchange rate misalignment, growth, employment, currency regime,

Zimbabwe Corresponding author: Zuzana Brixiova African Development Bank Group 15 Avenue du Ghana Tunis-Belvedère Tunisia E-mail: [email protected]

1 The authors thank Zorobabel Bicaba for contributions to the regression analysis and discussions. Thanks go also to Steve Kayizzi-Mugerwa, Mateus Magala, Daniel Zerfu Gurara, Basil Jones, and Erik Klok for comments and discussions. The views expressed are those of the authors and do not necessarily reflect those of the African Development Bank.

2

I. Introduction

After its economy collapsed in 2008, Zimbabwe opted for a multicurrency regime anchored in

US$.2 The objective was to stabilize the economy and establish a credible nominal anchor.3 The

replacement of the Zimbabwean dollar by the multicurrency system brought the hyperinflation and

the currency devaluation to a halt, laying foundations for economic recovery. The average annual

inflation during 2009 – 2013 was 3.3 percent, while the real GDP grew on average more than 8

percent a year. While it may be tempting to consider these outcomes a success, a closer look at the

overall economic performance reveals a number of challenges and open issues.

One of them is external competitiveness and the extent to which an overvalued currency has

contributed to the sluggish growth. Concerns about the limited external competitiveness have

prevailed for some time given the country’s declining global export shares, widening trade deficits,

and high concentration of exports to South Africa. The role of the real exchange misalignment in

the 2008 currency crisis in 2008 was also underscored (Ndlela, 2012).

This paper aims to find out whether (i) currency overvaluation prevailed under the multicurrency

regime introduced in 2008 and (ii) the overvaluation may have contributed to the Zimbabwe’s long

term weak external and growth performance. Further, some recent literature (Gala and Lucinda,

2006; Rodrik, 2008; Rapetti et al., 2012) posits that undervalued real exchange rates can stimulate

growth, and we examine if this is the case in Zimbabwe. The stock-flow approach to the real

equilibrium exchange rate reveals that Zimbabwe experienced large currency overvaluation

relative to the South African rand both in the run up to the 2008 collapse and in recent years, with

negative impact on GDP growth, exports and productive employment. We do not find a robust

evidence that currency undervaluation would boost growth.

With South Africa as the largest trading partner, Zimbabwe would benefit from implementing

internal devaluation (and in particular contain wage cost) and accelerating structural reforms to

correct for the current overvaluation of bilateral real exchange rate (RER) with South Africa.

Policymakers should also consider replacing multi-currency regime (anchored in US$) by the

South African rand. Such reform would help prevent major future RER overvaluations, reduce

transaction costs, improve price transparency, and stimulate growth and the agricultural sector.

The paper is organized as follows. After this Introduction, Section II discusses key external sector

developments. Section III estimates the equilibrium exchange rate and discusses findings. Section

IV makes the case for adopting South Africa rand. Section V concludes.

II. Growth and External Sector Performance of Zimbabwe

The weak economic performance of Zimbabwe has been analyzed from both microeconomic and

macroeconomic perspectives. In this paper, we adopt the longer term macroeconomic perspective

by examining links between the RER, productivity, net foreign liabilities and growth.

2 The real GDP declined by 14 % in 2008, after a 40 % cumulative decline in 2000 – 2007. 70 % of the population

needed food assistance in 2008. The government revenues and expenditures collapsed that year (IMF, 2009). 3 The rand was to be the reference currency, but US$ became one. Budgets are prepared in US$ and 4/5 of non-cash

transactions are carried out in US$. In cash transactions, rand is used in the south (Kramarenko et al., 2010).

3

a. Growth and its Drivers

Since mid-1990s, Zimbabwe has been one of the slow growing countries in Africa. This track

record followed a period of solid growth (about 4 percent a year on average) during the 1980s,

with the rising share of manufacturing in exports. However, in part due to drought spells, the

growth slowed to 1.9 percent a year on average during 1991 – 1996, with manufacturing

contracting by 1.7 percent a year (IMF, 2001). Following the overall policy reversal in the late

1990s, growth became negative until 2008, and accompanied by hyper-inflation and currency

crisis in 2008. During this period, the country’s productivity gap with South Africa widened.

Zimbabwe’s growth performance was also well below the Africa continent (Figure 1).

Figure 1. Real GDP Growth and Real GDP per capita in Zimbabwe and South Africa

1a. Real GDP Growth 1b. Real GDP per capita

2010200520001995199019851980

15

10

5

0

-5

-10

-15

-20

Percent

South A frica

Zimbabwe

SSA

2010200520001995199019851980

2.9

2.8

2.7

2.6

2.5

3.8

3.7

3.6

Prod Zimbabwe (log, LHS)

Prod South A frica (log, RHS)

Source: Authors’ calculations based on the AfDB database. Note: In Figure 1b real GDP per capita is measured as

log of GDP in constant 2005 $. Due to the lack of employment data, productivity is proxied as real GDP per capita.

Among sectors, mining and services contributed the most to the real output growth during 1981 –

2012 (Table 1a). In contrast, contribution of agriculture and manufacturing was very limited. With

the introduction of the multicurrency regime and stabilization of the macroeconomic situation,

growth has become more broad-based. Still, growth of manufacturing has been lagging those of

other sectors. As a result, the share of manufacturing declined steadily from 9 percent of total value

added (in constant 2005 US$) to about 7 percent in 2012.

On the demand side, growth has been driven mostly by household consumption, with negative

contribution from net exports. The contribution of gross exports was also negative for most of

1980 – 2012, but a notable turnaround occurred after 2008, with a strong revival of mining and

commodity exports (Table 1a and 1b). The household demand continues to be fueled in part driven

by public sector wages, which in 2014 are projected to amount to more than 16 percent of GDP

and almost 2/3 of budgetary outlays (IMF, 2014). Remittances fueled household expanses in the

past, but since most are sent by emigrants to South Africa, the weakened rand has eroded their

purchasing power. The share of total investment in GDP is low, hampering trend growth.

4

Table 1. Drivers of real GDP growth, 1981 – 2012

1a. Sectoral Drivers of Growth (in percent of value added in 2005 US$)

Growth Agriculture Mining Manufacturing Services

1981 - 2012 1.4 0.1 0.6 0.1 0.6

2001 - 2012 0.3 -0.3 0.8 0.0 -0.2

2009 - 2012 10.4 1.4 5.5 0.7 2.8

1b. Demand-side drivers of growth (in percent of GDP in 2005 US$)

Growth Household Government Investment Net Exports Gross Exports

1981 - 2012 2.1 2.9 0.3 0.0 -1.2 1.6

2001 - 2012 2.4 6.2 0.5 -0.1 -4.2 -4.2

2009 - 2012 10.5 14.6 2.7 0.3 -7.1 13.0

Source: Authors’ calculations based on the AfDB database.

b. Export Performance

i. High current account deficits and external debt

Zimbabwe’s trade and current account deficits deteriorated from the early to mid-2000s, with a

rapid worsening in the crisis year of 2008. The twin deficits remained very high in 2013. Trade

has been driving the current account balance outcomes, underscoring the importance of external

competitiveness. The current account deficit has been increasingly financed by short term private

loans or arrears, leading to accumulation of private external debt and exacerbating the overall

external debt and arrears challenge (Figure 2). At the same time, the reserve coverage has reach

precarious levels, covering about 2 weeks of imports of goods and services.

Figure 2. Zimbabwe: External sector indicators (% of GDP)

2a. Trade and current account deficits 2b. External debt, private and public

201320102007200420011998199519921989198619831980

0

-10

-20

-30

-40

CAB (% of GDP)

Trade Balance (% of GDP)

201220082004200019961992198819841980

120

100

80

60

40

20

0

Percent

of

GD

P

Public, multilateral

Public, bilateral

Private

Source: AfDB and IMF WEO database. Note: Negative balance in 2a indicates deficit.

5

ii. Export growth and market share

The total exports grew at high rate during the 1990s, but growth became negative since the early

2000s (Figure 3 and Muňoz, 2006). Between 2000 and 2013, volume of Zimbabwe’s exports fell

on average by 1.1 percent a year and by 15 percent cumulatively. Marked difference however

emerged between the pre-reform (2000 - 2008) and post-reform (2009 – 2013) periods (Figure 3a).

While export volumes declined in cumulative terms by almost 60 percent during the first period,

they increased by more than 80 percent in the latter. Zimbabwe’s performance boded well relative

to most regional peers, which were impacted by the global financial crisis. Export post-2008

growth reflects rebound after years of decline, with slowdown in 2012 and 2013.

Figure 3. Zimbabwe: Export Growth and Share

3a. Export Volumes (Indices, 2000 = 100) 3b. Shares in World Exports (%)

20122009200620032000

400

300

200

100

0

South Africa

Zimbabwe

Zambia

201320102007200420011998199519921989198619831980

6

5

4

3

2

0.07

0.06

0.05

0.04

0.03

0.02

0.01

Afr

ica

Zim

ba

bw

e

Africa (LHS)

Zimbabwe (RHS)

Source: Authors’ calculations based on WTO and IMF WEO databases.

As shown by the country´s low and even declining shares in global exports since 2000, Zimbabwe

has been facing external competitiveness challenges (Figure 4b). Zimbabwe’s performance in this

area contrasts that of Africa, which has shown an increase in global share of exports. Low and

declining export shares have contributed to subdued growth of the aggregate demand and the lack

of ‘productive’ jobs in the export sectors and their suppliers.

iii. Diversification of exports

Zimbabwe’s product composition of exports is more diversified than that of most other African

countries in the region and at comparable level of development (LICs). However, share of mining

in total Zimbabwe’s exports has risen while the share of manufacturing has fallen over the past ten

years, reducing the overall value added in exports. Regarding export destinations, South Africa

has accounted for a disproportionate share of Zimbabwe’s exports, reflecting geographical

closeness and long-established economic ties (Table 2).

Exports were overly concentrated in low value added primary products, with crude materials

accounting for more than 40 percent of exports during 2008 – 2012. At the same time, chemical

6

products, machinery and transport equipment accounted for more than half of imports during the

same period (Statistics Zimbabwe, 2013).4

Table 2. Merchandise Export by Sectors and Destinations in 2012 (% of total exports) 1/

Zimbabwe South Africa Mozambique Zambia

Agriculture 33.3 9.5 17.8 8.7

Fuel, mining 36.8 39.3 56.5 78.2

Manufacturing 21.1 40.2 10.3 12.1

Destination 1 South A. (68.9) EU (20) EU (40.5) Switzerland (48.9)

Destination 2 UAE (12.4) China (11.7) South A. (19.2) China (16.7)

Destination 3 Moz. (7.3) US (8.7) China (18.4) South A. (9.3)

Source: WTO database. 1/ Percent of total exports into the country of destination are in parentheses.

c. External price competitiveness

In Zimbabwe, the exchange rate regime has evolved from flexible towards fixed/multicurrency

regime, as price stabilization and credibility of the monetary policy gained priority.5

The real effective exchange rate (RER) measures the relative price levels (domestic and foreign

prices expressed in the same currency unit. In this paper, we focus on the bilateral CPI-based real

exchange rate with South Africa, which is Zimbabwe’s main trading partner. It is defined as

D

t

F

t

ttP

PeRER where te denotes $ per South African rand, F

tP is the consumer price index of South

Africa and D

tP is the consumer price index of Zimbabwe. 6 Figure 4a depicts the evolution of this

bilateral RER with South African rand and its components for the past three decades.

The real exchange rate experienced major real and nominal devaluations (and inflation-devaluation

spiral) before the 2008 collapse (Hanke and Krus, 2012). The rate appreciated by about 30 percent

between February 2011 and 2014 (Figure 4). The appreciation has occurred against the background

of Zimbabwe’s very low and even negative inflation, indicating that weakening of the rand to US$

has out-weighted the evolution of the relative prices. It occurred on the back of continued high

current account deficits and accumulation of net foreign liabilities, i.e. negative net foreign assets,

but low investment. Against such background, the real appreciations typically imply a loss of

external competitiveness, unless they are accompanied by improvements in productivity or other

fundamental such as investment (Rogoff, 2007). Still, as Muňoz (2006) underscored, in Zimbabwe

other factors such as poor governance or access to credit could limit impact of competitive RER.

4 Due to the lack of data, the discussion in this section focuses on merchandise exports, while export of services is not

analyzed. As Eichengreen and Gupta (2012) underscore, exports today increasingly encompass services, with modern

services (e.g., communication, information) being strongly impacted by the RER. 5 The latest IMF Exchange Rate Report classifies Zimbabwe as having ‘no separate legal tender’. 6 Since South Africa is Zimbabwe’s main trading partner, rand is used as the foreign currency in what follows.

7

For Zimbabwe’s policymakers, the key issue in this regard is to find out whether the real

appreciation (i) reflects misalignment (overvaluation) of the RER relative to its equilibrium value

and (ii) hampers growth and diversification of exports even under the multicurrency regime.7

Figure 4. Zimbabwe: Evolution of the Real Exchange Rate

4a. Real and nominal exchange rate, relative prices 4b. RER and NFA, Jun 2010 – Mar 2014,

1980 - 2013, annual (log) Indices, Jan 2010 = 100

201320102007200420011998199519921989198619831980

30

25

20

15

10

5

0

0

-5

-10

-15

-20

-25

EXRT

Prices (RHS)

RER

Year

Month

20142013201220112010

FebOctJunFebOctJunFebOctJunFebOctJun

1.15

1.10

1.05

1.00

0.95

0.90

0.85

0.80

-0.50

-0.75

-1.00

-1.25

-1.50

RER (LHS)

NFA (RHS)

Source: Authors’ calculations based on the Reserve Bank of Zimbabwe and IMF databases. Note: Relative prices in

Figure 1a and NFA in Figure 1b are plotted against right-hand scale.

III. Estimating the Real Exchange Rate Misalignments

Computing the real equilibrium rate helps us determine if the movements of the actual RER reflect

mostly changing fundamentals or deviations from equilibrium levels, i.e. misalignments.

a. Modeling Framework

This section utilizes the stock-flow approach to the long run equilibrium real exchange rate. The

approach incorporates both the balance-of-payment (e.g., macroeconomic imbalances) and the

Balassa-Samuelson effect (e.g., relative productivity).8 The equilibrium RER determination is

linked to the productivity differential (PROD) and to net foreign assets (NFA). This approach is

suitable for Zimbabwe, which has a large productivity gap with South Africa and the external debt

overhang. The reduced-form equation becomes (where negative sign is RER appreciation):

),(/

NFAPRODfRER (1)

In emerging market and developing economies, the productivity (PROD) increase in the home

country relative to trading partners typically leads to appreciation of the real exchange rate. In

7 Muňoz (2006) found that while depreciation of the official real exchange rate stimulated exports, parallel rate

depreciation led to increased smuggling. Among various sectors, mining was the most responsive to RER changes. 8 Faruqee (1995) first applied this approach to advanced economies and Égert et al. (2004) and Alberola and Navia

(2007) to transition economies. Brixiová, Égert and Essid (2014) utilized it for economies of North Africa.

8

countries with low international reserves such as Zimbabwe, persistent current account deficits,

which translate into the stock of net foreign liabilities, tend to generate burden on the external

account and may require RER depreciation (Annex I). However, if the targeted stock of net foreign

assets is negative, the capital inflows may lead to RER appreciation.

To confirm that the RER depends mostly on (i) the net foreign assets and (ii) productivity, we

include control variables in the empirical analysis such as trade openness and investment.

Equations (1a) and (1b) show equation (1) augmented with these control variables:

),,(//

OPENNFAPRODfRER (1a)

),,(//

INVNFAPRODfRER (1b)

Openness ( OPEN ) is the share of exports and imports in GDP. An increase in openness can

lead to either RER appreciation or depreciation, depending on changes in the trade/current

account balance. The typical interpretation is that tighter trade policy appreciates the RER in

the long run (Baffes et al., 1997);

The impact of investment as share of GDP (INV) depends on whether the investment releases

supply side constraints (and hence raise productivity) in the tradable or non-tradable sector.

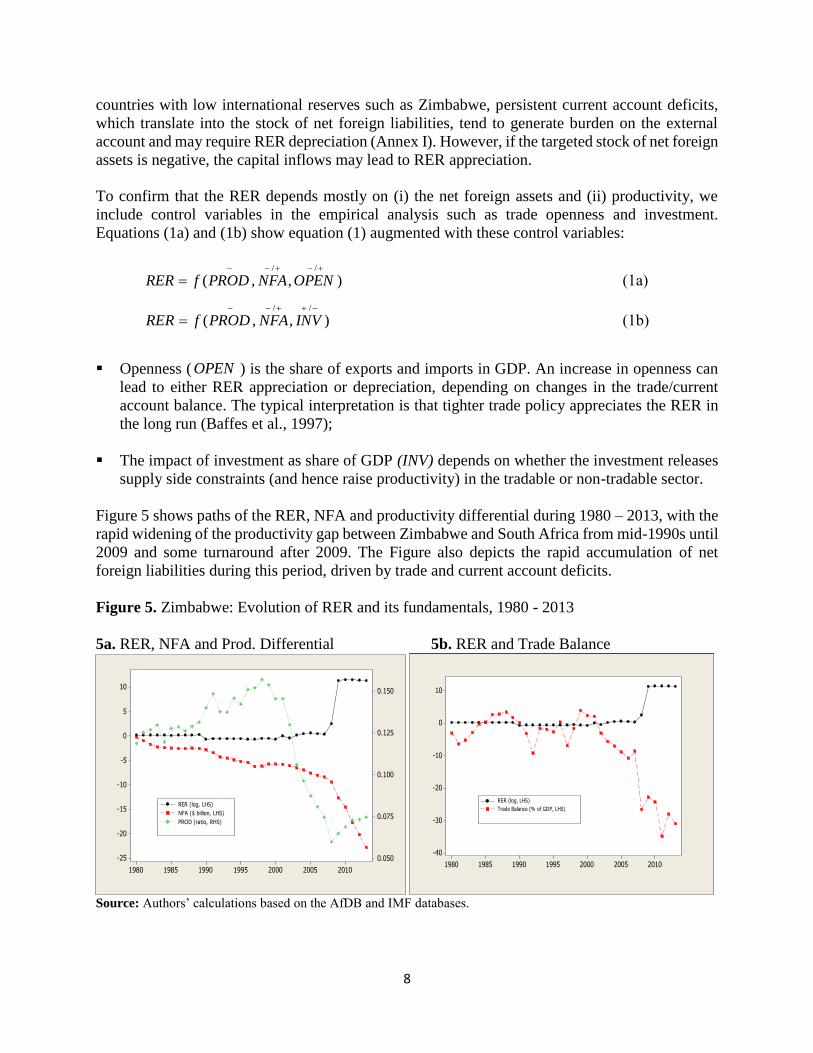
Figure 5 shows paths of the RER, NFA and productivity differential during 1980 – 2013, with the

rapid widening of the productivity gap between Zimbabwe and South Africa from mid-1990s until

2009 and some turnaround after 2009. The Figure also depicts the rapid accumulation of net

foreign liabilities during this period, driven by trade and current account deficits.

Figure 5. Zimbabwe: Evolution of RER and its fundamentals, 1980 - 2013

5a. RER, NFA and Prod. Differential 5b. RER and Trade Balance

2010200520001995199019851980

10

5

0

-5

-10

-15

-20

-25

0.150

0.125

0.100

0.075

0.050

RER (log, LHS)

NFA ($ billion, LHS)

PROD (ratio, RHS)

2010200520001995199019851980

10

0

-10

-20

-30

-40

RER (log, LHS)

Trade Balance (% of GDP, LHS)

Source: Authors’ calculations based on the AfDB and IMF databases.

9

b. Data and Methodology

The empirical analysis utilizes annual data from 1980 to 2013, obtained from databases of the

African Development Bank and IMF. Equation (1) is estimated using CPI-deflated real exchange

rate (RER). PROD is the productivity differential between Zimbabwe and South Africa, measured

as real GDP per capita. NFA is the ratio of net foreign assets to GDP. Since Zimbabwe accumulated

major external debt, this ratio is negative (i.e. represents net foreign liabilities).

First, we examine the relation between the real exchange rate and the two core variables,

productivity (PROD) and net foreign assets (NFA). To check the robustness of results we add the

openness ratio (OPEN), measured as total trade to GDP; and the investment to GDP ratio (INV).

Given that conventional unit root tests suggest that most of our variables are non-stationary in

level, we carry out cointegration analysis. The long-term coefficients are estimated using the

dynamic ordinary least square (DOLS) estimator, developed by Stock and Watson (1993), who

showed that DOLS accounts for the endogeneity of the regressors and serial correlation in the

residuals by incorporating lags and leads of the regressors in first differences:

tjti

n

i

k

kj

jiti

n

i

it XXY

,

1

,,

1

0

2

1

(2)

where k1 and k2 denote, respectively, leads and lags. Their length is determined on the basis of the

Schwarz, Akaike and Hannan-Quinn information criteria (Annex II).9

c. Estimation Results

The baseline model linking the real exchange rate (RER) to productivity (PROD) and net foreign

assets (NFA) was estimated using the dynamic OLS (DOLS) approach with one lag to one lead

(DOLS(1,1)). Additional control variables, namely openness and investment, were added to the

baseline model. The estimated results of the RER models are in Table 2a.

As a robustness check, we also use the Least Absolute Deviations (LAD) estimator to address the

potential ‘outliers’ issue.10 This method is well suited for our data, since after 2008 the RER and

some explanatory variables (NFA) exhibit high volatility. Table 2b shows the results.

The coefficient estimates for the productivity differentials are statistically significant for the

baseline model and the case with trade openness under both methods (DOLS and LAD). Under

the LAD, the coefficient is also significant in the case with investment. The coefficients are of the

expected sign, with a decrease in the productivity differential (i.e. widening productivity gap

between Zimbabwe and South Africa) implying RER depreciation.11 Our results indicate that in

the long run, productivity differential has a robust negative relationship with the RER (Table 3a).

9 Since the NFA series is I(2) process, it was de-trended. 10 Least absolute deviations (LAD) is method that seeks to minimize the influenced of outliers. This type of robust

regression is also called median regression, which has the advantage of diminishing the influence of the residuals. 11 In other emerging markets, including new EU members, productivity is a key driver of RER movements.

10

Table 3a. The long-run determinants of the Zimbabwe’s RER (DOLS)

Specification Baseline With trade openness With investment

C -15.22243*** -4.796220 -27.74584***

(3.784424) (1.447145) (6.123713)

LOGDIFF_PROD -7.210599*** -5.717963*** -11.10295***

(3.585306) (4.584548) (7.260829)

NFA -0.476500 -0.483460 0.002208

(1.082305) (1.169024) (0.004887)

LOGOPEN -1.820509***

(4.442108)

LOGINV 1.705171**

(2.249682)

AFTER2008 22.22376*** 24.46813*** 20.25245***

(12.11876) (22.13481) (18.97835)

D2001 1.312620*** 1.073231*** 1.311790***

(5.784610) (4.129982) (6.699468)

N 30 30 30

Adjusted R-squared 0.995061 0.997331 0.997500

Log likelihood -20.79798 -7.102519 -6.085697

F-statistic 465.9453 660.3460 705.1699

Prob (F-statistic) 0.000000 0.000000 0.000000 Source: Authors’ estimates. Note: Figures in brackets are standards deviations of parameters. (*), (**), (***)

indicate the degree of statistical significance at 10%, 5% and 1% respectively.

Table 3b. The long-run determinants of the Zimbabwe’s RER (LAD) Specification Baseline Trade openness Investment

C -19.93814*** -4.041354 -32.78111***

(2.974062) (0.588780) (3.753621)

LOGDIFF_PROD -9.514373** -4.828717* -12.51211***

(2.825623) (1.853604) (4.065186)

NFA -0.572599 -0.073507 0.234597

(0.989866) (0.137325) (0.287630)

LOGOPEN -1.520882**

(2.452785)

LOGINV 2.520989*

(1.835886)

AFTER2008 21.04716*** 25.64440*** 19.57730***

(9.223663) (10.61416) (10.39960)

D2001 1.385916* 0.631581 1.110357*

(1.797750) (0.867240) (1.959982)

Adjusted R-squared 0.878212 0.904245 0.890671

Sparsity 1.492896 1.056508 1.090795

Prob(Quasi-LR stat) 0.000000 0.000000 0.000000 Source: Authors’ estimates. Note: Figures in brackets are standards deviations of parameters. (*), (**), (***)

indicate the degree of statistical significance at 10%, 5% and 1% respectively.

11

The coefficient estimate for openness is significant and negative under both methods (Table 3a

and 3b). A greater openness thus leads to a real appreciation of the RER, indicating that the export

revenues and imports strengthen the domestic tradable sector more than the non-tradable sector.

In contrast, increased investment leads to RER depreciation, suggesting that it is mostly used to

release supply-side constraints in non-tradable sectors.

Factors impacting the RER were also estimated with monthly data. Specifically, the productivity

differential was proxied by (lagged) credit to the private sector (relative to credit in South Africa)

and prices of key export commodities served as controls. In this case, an increase of credit in

Zimbabwe relative to South Africa had a positive and statistically significant relation with the

RER, i.e. credit expansion led to real deprecation of the RER, indicating that credit was geared

more towards non-tradable sectors (Tables 1 and 2, Annex III).

d. Real Exchange Rate Misalignment

We calculate the misalignment in three steps. First we use data on the nominal exchange rate

between $ and South African rand as well CPI indexes for Zimbabwe and South Africa to derive

the bilateral real exchange rate:12

)/ln(lnD

t

F

ttt PPeRER (3)

Second, we regress RER on NFA , PROD , and on control variables ( INVOPEN , ). We also

introduce dummy variables for structural breaks after the land and currency reforms in 2001 and

2008. The RER misalignment (as % of the equilibrium rate) is difference between the actual real

exchange rate (RER) and the long run real equilibrium exchange rate (ERER):

t

ttt

ERER

ERERRERntmisalignme

(4)

Given our definition of the RER, when misalignment is positive, the RER is undervalued.

Conversely, when misalignment is below zero, the RER is overvalued.

In both methods (DOLS, LAD), the RER of Zimbabwe was found to be notably overvalued in the

run up to 2008 crisis (between 70 and 100 percent of the equilibrium real exchange rate during

2006–2008). The sizeable misalignment in mid 2000s was a side-product of hyperinflation which

in turn reflected heavy quasi-fiscal activities of the RBZ (Figure 6).

The currency overvaluation w.r.t. rand has re-emerged under the multicurrency regime.

Specifically, the 2013 RER overvaluation w.r.t. South African rand ranged from 58 to 73 percent

of the equilibrium real exchange rate. As with any model-based estimation, given the sensitivity

or parameters and the underlying assumptions, the results should be understood as providing

12 Until 2008, te was in terms of Zimbabwe dollars per one South Africa rand. After 2008 it was US$ per rand.

12

indication of sizeable overvaluation under the prevailing multi-currency regime relative to

alternatives rather than the specific level of the real equilibrium exchange rate.13

Figure 6. Zimbabwe: Real Exchange Rate and Its Misalignment, 1980 – 2013

6a. Actual RER and Equilibrium (DOLS) 6b. RER Misalignments (DOLS, baseline)

201320102007200420011998199519921989198619831980

30

25

20

15

10

5

0

RE

R a

nd

ER

ER

(lo

g)

RER (Actual)

ERER (baseline)

ERER (investment)

201320102007200420011998199519921989198619831980

300

200

100

0

-100

% o

f e

qu

ilib

riu

m R

ER

0

6c. Actual RER and Equilibrium (LAD) 6d. RER Misalignments (LAD, baseline)

201320102007200420011998199519921989198619831980

30

25

20

15

10

5

0

-5

Lo

g o

f R

ER

an

d E

RE

R

RER

ERER LAD (baseline)

ERER LAD (inv)

201320102007200420011998199519921989198619831980

200

150

100

50

0

-50

-100

% o

f e

qu

ilib

riu

m R

ER

0

Source: Authors’ calculations.

As a robustness check, misalignment of the actual RER from the equilibrium one was also

computed with monthly data (Annex III, Figure 1). The currency overvaluation in 2014 ranged

from 54 percent for the base scenario to 39 percent for the scenario with commodity prices as

controls, suggesting once again that the Zimbabwean bilateral RER with South Africa has been

significantly overvalued relative to its long run equilibrium value.

13 The overvaluations derived with ARDL method (Figure 3, Annex III) are close to these values of overvaluation.

13

e. Comparison of Results with the Empirical Literature

Results of other studies on the RER misalignment in Zimbabwe are summarized in Table 4. Our

findings, which point to past periods of sizeable overvaluation as well as a large overvaluation in

2013, are consistent with finding of other empirical studies on the topic.

Our estimates and the empirical literature suggest that Zimbabwe has been exposed to extended

periods of sizeable RER overvaluation. With South African as the main trading partner, the

persistent currency overvaluation has contributed not only to the weak trade balance and depleted

foreign exchange reserves but also to low growth. Further, we have not found any evidence that

undervaluation promotes growth. Hence eliminating sizeable RER misalignments – especially

overvaluation -- is thus a key priority which will require internal devaluation and structural

reforms. Further, replacing US$ with South African rand is an option to be seriously considered.

We elaborate on advantages and drawbacks of this step below.

Table 4. RER misalignment in Zimbabwe and its impact — Summary of the literature

Study & authors Methodology Results

Ndlela (2012) Behavioural equilibrium exchange rate

(BEER)

RER (using ZWE dollar relative to US$ as

nominal rate) was overvalued up to 95 % in 2003

– 2004; RER misalignment reduced GDP growth

Mohapatra (2005) Short run, partial equilibrium approach RER (real effective exchange rate) was

overvalued by about 50 – 60 % in 2004 - 2005

Masunda (2011) Fundamental equilibrium exchange

rate (FEER) /macro balance

RER misalignment (both under and

overvaluation) hampers growth

Masunda (2012)

Fundamental equilibrium exchange

rate (FEER) /macroeconomic balance

RER overvaluation was an important factor for

currency crisis (large depreciation)

IMF (2014) Macroeconomic balance approach;

external sustainability approach

RER is overvalued by 21 - 23 % relative to its

equilibrium value

IV. Misalignment and Growth

The role of the real exchange rate (e.g. the relative price of tradables to non-tradables) in growth

and the convergence of incomes of developing countries to those of developed economies remains

debated. Our paper contributes to this debate with the case of Zimbabwe, a country that

experienced several currency regimes, major misalignments, and slow economic growth.

Experiences of developing countries indicate that sizeable and protracted overvaluations are

associated with slow growth (Edwards, 1988; Ghura and Grennes, 1993). What is less clear is

whether undervaluation promotes growth (Galas and Lucinda, 2006; Rodrik, 2008; Rapetti et al.,

2012), or is neutral/hampers it (Berg and Miao, 2010; Schöder, 2013). Haddad and Pancaro (2010)

posit that since countries cannot maintain currency undervaluation indefinitely, it can be deployed

as a growth tool only in the short term. Razin and Collins (1997) find nonlinearity in relation

between RER misalignment and growth: High overvaluations are associated with lower growth,

while low to moderate overvaluations tend to be associated with higher growth. However, large

undervaluation seem to again hamper growth.

14

a. Misalignment and real GDP growth

First, we examine the misalignment – growth nexus in Zimbabwe. We utilize an empirical

growth equation based on Solow’s growth model, as in Schöder (2013):

tttttttt wgrlanddollarunderoverrgdppcgrowth lnlnln 211 (5)

where the dependent variable is real GDP growth (tgrowth ). The independent variables are the

initial real GDP per capita, (1trgdppc ) as the convergence term, the world GDP growth ( twgr ), a

dummy variable for the multicurrency regime introduced in 2008 ( tdollar ), a dummy variable for

the 2001 land reform ( tland ), and the idiosyncratic error (t ). The value of undervaluation (

tunder ) is greater than or equal to zero, while the value of overvaluation ( tover ) is less or equal to

zero. We also consider some of the RER fundamentals utilized in estimating the equilibrium RER

(NFA, investment and openness) since they are likely to impact growth.

A key difference of (5) from the approach adopted by, for example, Rodrik (2008) is allowing

currency undervaluation affect growth differently than overvaluation, that is 21 .

Alternatively, misalignment can represent both overvaluation and undervaluation:

ttttttt landdollarwgrntmisalignmergdppcgrowth lnln 1 (5a)

(5a) assumes that RER undervaluation and overvaluation have equal and opposite impacts on

growth. Under this assumption, 0 implies that undervaluation raises growth.

Our choice of growth equation (5) reflects the observation that in Zimbabwe, the relation between

misalignment and growth is non-linear (Figure 7). The real GDP growth (per capita) in Zimbabwe

is lower under more overvalued currency and higher with undervaluation. The relation is non-

linear (or piece-wise linear) with growth tapering off at higher levels of undervaluation. Overall,

currency undervaluation is not systematically related to higher growth.

The varied impacts of undervaluation and overvaluation on growth are captured by parameters 1

and 2 (Table 5a). The coefficient estimates of the impact of misalignment on growth, captured

by parameter in equation (5a). When examining misalignment only, the results would suggest

a positive impact of undervaluation on growth (Tables 1a and 1b, Annex IV). When separate

impacts of undervaluation and overvaluation on growth are considered, the regression exercise

yields a negative and statistically significant relationship between overvaluation and growth (Table

3a). Put differently, in Zimbabwe a smaller overvaluation (with RER closer to its equilibrium

value) is associated with higher growth.

Our estimates point to nonlinearity between misalignment and growth. However, we do not find

robust evidence that more undervalued currency would be associated with higher growth. While

the coefficient associated with undervaluation (2 ) is positive, it is statistically significant only in

15

the baseline but becomes insignificant when various control variables are introduced.14 In fact,

Zimbabwe experienced some of its highest growth rates when the RER was only slightly

undervalued (Figure 7).15 These results are robust to various specifications of the basic empirical

growth equation, with investment ratio, openness and net foreign liabilities as controls.

Figure 7. RER undervaluation and growth

7a. Piece-wise linear fit for overvaluation and udervaluation

3002001000-100

10

5

0

-5

-10

-15

-20

3002001000-100

Real GDP

Undervaluation (DOLS), percent of ERER

perc

ent

0

Real GDP per capita

0

undervaluation

overvaluation

7b. Nonlinear (quadratic) fit for undervaluation and undervaluation

3002001000-100

10

5

0

-5

-10

-15

-20

3002001000-100

Real GDP

Undervaluation (DOLS), percent of ERER

Perc

ent

0

Real GDP per capita

0

undervaluation

overvaluation

Source: Authors’ calculations. Note: Negative undervaluation represents overvaluation. In Figure 6a, correlation coefficient for

growth of GDP per capita and overvaluation is 0.5063 (significant at 5%). Correlation coefficient for growth of GDP and

overvaluation is 0.5375 (significant at 5%).

14 Undervaluation is insignificant also when different estimates of ERER are utilized (Annex II). 15 Annex IV presents symmetric treatment of misalignment (i.e. both undervaluation and overvaluation would hamper

growth. In this specification, misalignment is not statistically significant.

16

b. Misalignment and sectoral impacts

Second, we aim to uncover the key channels through which the real exchange rate misalignment

impacts growth. The sectoral growth models to be estimated are specified as follows:

tttttttjt wgrlanddollarunderoverrgdppcgr lnlnlnsec_ 211 (6a)

tttttttjt wgrlanddollarunderoverrgdppccgr lnlnlnsec_ 211 (6b)

where jtgr sec_ represents real growth of the sector j in period t and

jtcgr sec_ contribution of

sector j to the overall growth of GDP at t, where sectors studied are manufacturing, mining and

agriculture – the main export sectors in Zimbabwe. The other variables are as in Equation (5).

The sectoral decomposition of growth points to different impacts of RER overvaluation and

undervaluation on key export sectors: mining, manufacturing and agriculture. While overvaluation

reduces sectoral growth (with the coefficients 1 positive and statistically significant),

undervaluation coefficients 2 – are positive for manufacturing and mining but negative for

agriculture and are not statistically significant (Table 5b). Among the three sectors examined,

overvaluation impacts the most growth of the agricultural sector, which accounts for more than

half of the country’s employment. When the contribution of various sectors to GDP is taken into

account, the RER overvaluation had a high impact on growth via mining, which generated more

than 40 percent of the country’s real value added and almost 40 percent of goods exports in 2012.

Mining has high elasticity of employment to growth, indicating that slowdown of growth in this

sector leads to relatively (to employment in the sector) high job losses.16

V. Should Zimbabwe Adopt South African Rand?

The ‘optimal’ currency regime for the country has been a widely debated issue. When introduced

in February 2009, the multicurrency regime was meant to last until 2012. The regime was, with no

clear timeline for replacement. Even though the regime helped stabilize the economy from

hyperinflation and stop quasi-fiscal financing, it presents challenges. One of them is persistent real

exchange rate overvaluation illustrated above, another one is currency mismatch between wages

and other expenditures payable in dollars and foreign earnings received mostly in rand. In cash

transactions, shortages of small $ denominations have impeded trade, while South African capital

account restrictions prevented wider circulation of rand.

Reintroducing the Zimbabwe dollar, while politically appealing on the grounds of national

independence, raises concerns about credibility of macroeconomic policies, especially given the

track record associated with the previous use of this currency. Rand meets most preconditions to

be the anchor currency, (and in most aspects does so better than US$). Specifically, South Africa

is Zimbabwe’s largest trading partner, and was the destination for over 2/3 of exports in 2013; (ii)

labor mobility from Zimbabwe to South Africa is high with more than 10 percent of

16 Mining accounted for two percent of employment, but agriculture for more than half (ZimStat, 2006 and 2012).

17

Table 5a. Real GDP growth and RER under- /overvaluation, OLS

Table 5b. Growth of export sectors and RER over/undervaluation (OLS)

Source: Authors’ estimates. Note: Figures in brackets are standards deviations of parameters. (*), (**), (***)

indicate the degree of statistical significance at 10%, 5% and 1% respectively.

(1) Baseline

Model Eq. 5

(2) (1) with

Investment (3) (2) with NFL

(4) (2) with

Openness

(5) (1) with

land reform

Initial income of ZWE (log) -0.038474 -0.516290** -0.464162** -0.512462** -0.481189***

(0.132849) (0.201104) (0.167855) (0.208644) (0.155811)

Global real GDP growth -0.057428 0.065205 0.400298 0.107689 -0.055443

(0.499075) (́0.473567) (0.490335) (0.534447) (0.80763)

Multicurrency regime in 2008 0.081087** -0.061951 -0.00053 -0.058391 0.058387**

(0.035661) (0.055274) (0.065223) (0.062704) (0.025357)

Undervaluation (log) 0.078963* 0.05629 0.028346 0.053356 0.034984

(0.042569) (0.034188) (0.028415) (0.03566) (0.02952)

Overvaluation (log) 0.013276*** 0.007509*** 0.009170*** 0.007475** 0.012163***

(0.001035) (0.001466) (0.001855) (0.001434) (0.000918)

Investment ratio (log) 0.149287*** 0.123648** 0.148245***

(0.047287) (0.050655) (0.049899)

Net foreign liabilities (log) -0.078268

(0.048743)

Openness ratio (log) -0.015618

(0.072818)

Land reform in 2001 -0.108513***

(0.03549)

Constant 0.105639 1.276667** 1.201965*** 1.293983** 1.381420***

(0.37432) (0.525717) (0.426929) (0.516465) (0.446072)

Adjusted R-squared 0.393276 0.555035 0.571955 0.537695 0.595967

F-statistic 5.148462 7.652621 7.108352 6.3169 8.866913

Prob(F-statistic) 0.001917 0.000084 0.000103 0.000247 0.000026

growth contr. growth contr. growth contr.

Initial income of ZWE (log) -0.781036*** -0.05510** -0.879719*** -0.29006*** -1.106820** -0.11202*

(0.215381) (0.02141) (0.213456) (0.08087) (0.469642) (0.06288)

Global real GDP growth -0.403263 -0.03205 -1.435849* -0.4151 -2.413199 -0.171

(0.953999) (0.07418) (0.74181) (0.2802) (2.550639) 0.2179

‘Dollarization’ from 2008 on 0.043685 0.002022 0.030033 0.01434 -0.002116 0.00099

(values 1 or 0) (0.056163) (0.004626) (0.057859) (0.01748) (0.082386) 0.01359

Land reform from 2001 on -0.108105*** -0.007332** -0.087216*** -0.02903** -0.174031** -0.019803**

(values 1 or 0) (0.030614) (0.002906) (0.030526) (0.01098) (0.075871) (0.008537)

Undervaluation (log) 0.044771 0.003862 0.027582 0.01125 -0.104493 -0.00965

(0.03513) 0.003463 (0.02465) (0.01308) (0.080328) (0.01017)

Overvaluation (log) 0.008340*** 0.0005337** 0.011777*** 0.0041939*** 0.021915*** 0.0023859***

(0.000938) (0.0002581) (0.001223) (0.0009749) (0.001891) (0.004)

Constant 2.216262*** 0.15642 2.532622*** 0.8334*** 3.272830** 0.3284*

(0.620762) (0.06126) (0.610764) (0.2314) (1.339753) (0.1799)

Adjusted R-squared 0.446 0.360 0.645 0.617 0.307 0.287

F statistics 5.15 3.90 10.39 9.31 3.29 3.08

Prob. (F-statistics) 0.001 0.007 0.000 0.000 0.0159 0.021

Manufacturing Mining Agriculture

18

Zimbabwean labor force estimated to reside in South Africa; (iii) Zimbabwe could join SACU and

tap into its transfer formula which benefits poorer countries (Kramarenko et al., 2010).

To illustrate further the benefits of rand as the transaction currency, a counterfactual exercise was

carried out with rand as the anchoring currency since 2009. In this situation, the bilateral nominal

exchange rate with South Africa is equal to one and the RER is driven by the relative prices. The

counterfactual inflation rate for Zimbabwe under rand as transaction currency is derived as a

combination of the South African inflation for imports and Zimbabwe’s inflation for non-

tradables: 𝐶𝑃𝐼𝑡,𝑍𝑊𝐸𝑐𝑜𝑢𝑛𝑡𝑒𝑟𝑓𝑎𝑐𝑡𝑢𝑎𝑙

= (1 + 𝜋𝑡,𝑧𝑤𝐸𝑁 )𝛼(1 + 𝜋𝑡,𝑧𝑤𝑒

𝑁 )(1 + 𝜋𝑡,𝑆𝐴𝑇 )1−𝛼, where α=0.423 is the

share of imports from South Africa in the CPI basket. In this case, the counterfactual RER would

depreciate only marginally, in contrast to 10 percent appreciation of the actual RER since July

2011. The overvaluation would also be much lower than under the dollar as the anchor currency

and would not exceed 3 percent of the equilibrium RER (Figure 2, Annex III).

In addition to substantial benefits of moving to the rand, many of the costs of ́ dollarized´ economy,

such as the loss of independent monetary and exchange rate policy have already been incurred

with US$ as the legal tender. Further, with rand as the transaction currency, the currency risk

would be below the current levels due to reduced currency mismatch. Moreover, if rand becomes

the main medium of exchange, transaction (currency exchange) costs would fall. Interest rates on

loans would also likely fall due to reduced risk premium.

One exception to the overall suitability of South African rand for Zimbabwe’s economy has been

the limited shock synchronization between the two economies. The standard policy

recommendation for mitigating low synchronization are (i) availability of transfers (as would be

the case if Zimbabwe joins CMA) and (ii) flexibility of labor and product markets. The low

business cycle synchronization could be further offset by the high credibility of the South African

Reserve Bank in conducting monetary policy and its relevance for the region.17

Since Zimbabwe has been using the US$ for over five years, switching to South African rand

would change little – the country would still not be able to utilize monetary and exchange rate

policy. The issues related to the lack of synchronization are thus similar. From the perspective of

South Africa, given Zimbabwe size, admitting it to CMA would not constitute major cost. In fact

it could help reduce fragility and possibility of costly conflict (Ncube at al., 2013).

In sum, in the case of Zimbabwe, introducing South Africa rand could mean reaping major benefits

in terms of transaction costs, credibility of monetary policy, regional integration and last but not

least exchange rate broadly aligned with its equilibrium value. The last point, while more likely

with South African rand than $, is not automatic -- it is conditioned on Zimbabwe maintaining

appropriate macroeconomic, and especially fiscal policies. Given the absence of devaluation of

exchange rate as a policy tool, the country would need to rely more on ‘internal devaluation’

17 Further, Zimbabwe is poorly synchronized with both South Africa and US (Kramarenko et al., 2010). More

specifically, empirical evidence indicates that shocks to Zimbabwe’s output have not been correlated with those to the

US economy. Evidence on output shock correlations of Zimbabwe with South Africa is mixed – shocks appear

stronger during the relatively stable period of 1990s. Overall, correlation among GDP growth rates of economies in

Southern Africa in the past three decades has been limited (Basdevant et al., 2014).

19

through containing wage bill to maintain RER competitiveness. Putting in place an enabling

entrepreneurship framework to support competitiveness and job creation is also critical.

IV. Conclusions

This paper examined suitability of the multicurrency regime for Zimbabwe almost six years after

its introduction and the challenges this regime has brought about. The approach adopted focused

on misalignment of the real exchange rate and its implications for growth complements the existing

literature which examines the issue from the optimal currency area perspective.

More specifically, the real exchange rate misalignment in Zimbabwe was first estimated utilizing

the stock-flow approach to the real equilibrium exchange rate with both annual data for 1980 –

2013 and monthly data for January 2009 – March 2014 period, with several empirical methods.

The main finding was that the country experienced persistent periods of sizeable real exchange

rate misalignment, in particular overvaluation, both in the run up to 2008 crisis and under the

current multicurrency regime anchored in US$. The misalignment has an asymmetric impact on

growth: while overvaluation reduces growth of GDP as well as growth and employment in export

sectors, we have not found robust evidence that undervaluation would increase it. Hence in

Zimbabwe the real exchange rate does not appear to be a policy tool that could drive growth.

Regarding the current overvaluation, nominal exchange rate (e.g., external) devaluation is not

feasible under the multicurrency arrangement. Zimbabwe thus needs to rely on internal

devaluation, in particular fiscal expenditure control and management of the public wage bill, as

well structural reforms that would raise the economy’s flexibility. Creating an environment

conducive to foreign investment inflows is critical for avoiding liquidity shortages.

The multicurrency regime served Zimbabwe well for stabilizing the economy. Nevertheless, with

the weakening of the South African rand relative to the US$, correcting for currency overvaluation

and preventing in the future will be challenging. Rather than relying on internal devaluation which

is politically costly to introduce, Zimbabwe could replace the multicurrency regime, anchored in

US$, with rand as the sole transaction currency. The rand meets the criteria of the optimum

currency area better than the US$. Given the track record of South African monetary policy,

credibility of this arrangement would be also strong, provided appropriate fiscal policies are

implemented. Besides preventing reoccurrence of the past sizeable overvaluations of the RER, and

hence boosting the export and GDP growth, adopting rand would facilitate financial integration.

All these factors are key for resolving the debt issue as well as for raising growth and living

standards of the population.

20

ANNEX I. STOCK-FLOW APPROACH TO THE REAL EQUILIBRIUM EXCHANGE RATE18

The stock-flow model encompasses the balance of payments and Balassa-Samuelson approach to

the real equilibrium exchange rate. Besides productivity differentials, the RER in the long run is

driven by NFA adjustment towards its targeted position. The stock-flow approach decomposes the

RER into: (i) RER for tradables (the nominal exchange rate and the ratio of foreign and domestic

tradable prices) and (ii) the ratio of domestic to foreign relative price of non-tradables:

)***)(1())(1())*((TNTTNTTT

ppppppeq (1AI)

where q denotes the real exchange rate, e is the nominal exchange rate, *)( is the share of

tradable goods in the domestic (foreign) CPI; T

p )*(T

p is the domestic (foreign) price of

tradables, and )*(NTNT

pp is the domestic (foreign) relative price of non-tradables. The second

term in (1AI) shows changes in the RER due to different developments in prices of non-tradable

goods relative to prices of tradable goods in the home and foreign country. In this definition, an

increase (decrease) in q represents real depreciation (appreciation) of the domestic currency.

Focusing on the long-run external equilibrium (i.e. abstracting from short-term capital flows and

business cycles) the change in net foreign assets can be described as:

NFAryyTBCABNFA **)( (2AI)

where NFA is net foreign assets, TB is trade balance, *r is the world real interest rate, and CAB is

the current account balance. The first component of (2AI) is the trade account and the second is

the interest income from NFA, where the trade balance depends on the productivity differential

between the home and foreign country. Under the uncovered real interest rate parity condition

(where the difference between domestic and foreign real interest rates is the expected change in

the real exchange rate), the path of NFA towards their targeted level, DNFA , is described by:

)()(*)()( qENFANFArrNFANFANFADDD

(3AI)

where DNFA can be interpreted as capital account, r is the real interest at domestic markets and

0, . Since over the long term NFANFAD

and 0NFA in the steady state, combining

(2AI) and (3AI) yields the following long-run RER, lt

q

lt

qNFAryyTB **)( (4AI)

The RER is linked to the productivity differential yy (PROD) and to NFA:

),(/

NFAPRODfRER (5AI)

18 Faruqee (1995) first applied this approach to advanced economies and Égert et al. (2004) and Alberola and Navia

(2007) to transition economies. Brixiová, Égert and Essid (2014) utilized it for economies of North Africa.

21

ANNEX II. UNIT ROOT AND STATIONARITY TESTS

Table 1. Stationarity tests (Augmented Dickey Fuller, ADF): 1980-2013

Series LOGDIFF_PR

OD LOGGC_

GDP LOGOPEN LOGRER LOGTOT INV NFA TRADE

BALANCE

Level No trend -0.581 -2.184 -1.336 0.171 -2.035 -1.431 6.462 -0.460

Trend -1.535 -3.083 -3.819 -0.955 -2.662 -1.262 4.219 -1.696

1st difference

No trend -3.956*** -4.767*** -6.096*** -4.509*** -3.205*** -5.156*** -0.3234 -6.373***

Trend -4.000*** -4.693*** -5.908*** -4.753*** - -5.239*** -2.358 -3.830**

2nd difference

No trend - - - - - - -8.258*** -

Trend - - - - - - -8.626*** -

Table 2. Conclusion ADF test

Series

LOGDIFF_PROD

LOGGC_GDP LOGOPEN LOGRER LOGTOT

INV NFA

Level No trend Unit root Unit root Unit root Unit root Unit root Unit root Unit root Trend Unit root Unit root Unit root Unit root Unit root Unit root Unit root

1st difference No trend Stationary Stationary Stationary Stationary Stationary Stationary Unit root Trend Stationary Stationary Stationary Stationary Stationary Stationary Unit root

2nd difference No trend - - - - - Stationary

Trend - - - - - Stationary

Table 3. Stationarity tests (Philip Perron, PP): 1980-2013

Series LOGPROD LOG

GC_GDP LOGOPEN LOGRER LOGTOT INV NFA TRADE

BALANCE

Level No trend -0.551 -2.290 -1.068 -0.055 -1.671 -1.747 4.419 -0.472

Trend -1.595 -2.345 -3.891** -1.030 -2.586 -1.598 3.022 -1.659

1st difference

No trend -4.022*** -5.138*** -7.834*** -4.465*** -6.198*** -5.176*** -1.083 -6.335***

Trend -4.082** -4.982*** -7.696*** -4.852*** -6.166*** -5.251*** -2.200 -6.733***

2nd difference

No trend - - - - - - -8.257*** -

Trend - - - - - - -10.397*** -

Table 4. Conclusion Philip-Perron test

Series LOGDIFF_PROD LOGGC_GDP LOGOPEN LOGRER LOGTOT NFA

Level No trend Unit root Unit root Unit root Unit root Unit root Unit root Trend Unit root Unit root Unit root Unit root Unit root Unit root

1st difference No trend Stationary Stationary Stationary Unit root Stationary Unit root Trend Stationary Stationary Stationary Unit root Stationary Unit root

2nd difference No trend - - - Stationary - Stationary

Trend - - - Stationary - Stationary

22

ANNEX III. ESTIMATING THE EQUILIBRIUM RER WITH MONTHLY DATA

Table 1, Annex III. Determinants of ERER (monthly data): DOLS Variable B1 B2 B3

C 4.057742*** 5.169584*** 4.405097**

(0.201107) (0.953598) (1.620099)

NFA100 -0.005081 -0.036313 -0.068072

(0.049229) (0.050403) (0.057713)

LOGRELATIVE_CREDIT 0.216422*** 0.091572** 0.090169**

(0.043395) (0.040966) (0.043233)

LOGTOBACCO price -0.271217 -0.115913

(0.193035) (0.337751)

LOGCOTTON price 0.151523*** 0.159722***

(0.032803) (0.037021)

Seasonal dummies NO NO YES

Number lag/lead short run

dynamics 1 1 1

Adjusted R-squared 0.683230 0.801658 0.790838

F-statistic 22.20917 18.03328 9.579919

Prob(F-statistic) 0.000000 0.000000 0.000000

Table 2, Annex III. Determinants of ERER (monthly data): LAD Variable B1 B2 B3

C 4.020831*** 4.551734** 3.717184*

(0.318295) (1.702828) (2.114121)

NFA100 -0.018193 -0.031893 -0.107188

(0.078026) (0.106421) (0.104726)

LOGRELATIVE_CREDIT 0.221207*** 0.108168* 0.101636

(0.066149) (0.064726) (0.061815)

LOGTOBACCO price -0.141998 0.027457

(0.356221) (0.440625)

LOGCOTTON price 0.138598** 0.149759**

(0.058529) (0.058148)

Seasonal dummies NO NO YES

Number lag/lead short run dynamics 1 1 1

Adjusted Pseudo R-squared 0.431899 0.521793 0.500662

Sparsity 0.162093 0.119459 0.097756

Prob(Quasi-LR stat) 0.000000 0.000000 0.000000

Source: Authors’ calculations.

23

Figure 1, Annex III. Zimbabwe: Real Exchange Rate Misalignment, Jan 2009 – March 2014

1a. Actual RER and Equilibrium (DOLS) 1b. RER Misalignments (DOLS)

Year

Month

201420132012201120102009

JanJulJanJulJanJulJanJulJanJulJan

5.50

5.25

5.00

4.75

4.50

Log o

f R

ER

and E

RER

Actual RER

ERER_Baseline

ERER_with commodity price

Year

Month

201420132012201120102009

JanJulJanJulJanJulJanJulJanJulJan

0

-10

-20

-30

-40

-50

-60

Percent

of

ER

ER

ERER_Base

ERER_with comm. price

Source: Authors’ Calculations based on the data of the Reserve Bank of Zimbabwe.

Figure 2, Annex III. Real exchange rate misalignment under rand as transaction currency

Year

Month

201420132012201120102009

JanJulJanJulJanJulJanJulJanJulJan

1

0

-1

-2

-3

-4

-5

Perc

ent

of

ER

ER

Counter_1

Counter_2

Source: Authors’ calculations based on the data of the Reserve Bank of Zimbabwe.

24

ANNEX IV. MISALIGNMENT AND GROWTH

Table 1, AIV. Empirical evidence (OLS) on growth impacts of undervaluation in Zimbabwe

Dependent variable: Real GDP growth in Zimbabwe

Baseline model

(Eq. 5a) – (1)

(1) With inv.

Ratio – (2)

(2) With

NFL (3)

(3) With

openness –(4)

Initial income of ZWE (log) 0.028641 -0.498271** -0.083512 0.008008

(0.135551) (0.216205) (0.122029) (0.130769)

Global real GDP growth -0.153574 0.003278 0.563468 0.227089

(0.609319) (0.550886) (0.458317) (0.643961)

Multicurrency regime introduced

in 2008 (values 1 or 0) 0.082325** -0.070245 0.146693*** 0.102294**

(0.039283) (0.058764) (0.039246) (0.043118)

Undervaluation (log) 0.014051*** 0.007701*** 0.014561*** 0.013172***

(0.001554) (0.001508) (0.000976) (0.001409)

Investment ratio (log) 0.158882***

(0.047664)

Net foreign liabilities (log) -0.139006**

(0.051367)

Openness ratio (log) -0.124497

(0.102618)

Constant -0.063830 1.228889** 0.309634 0.201354

(0.389891) (0.567486) (0.351482) (0.441990)

Adjusted R-squared 0.355830 0.538460 0.497315 0.367709

F-statistic 5.419084 8.466607 7.331626 4.721924

Prob(F-statistic) 0.002322 0.000064 0.000188 0.003156

Source: Authors’ estimates. Note: Figures in brackets are standards deviations. (*), (**), (***) indicate the degree of

statistical significance at 10%, 5% and 1% respectively.

The empirical equation for estimating the relationship between undervaluation and growth in

Zimbabwe is a modified version of Rodrik (2008) and is specified in equation (5a). In Table 1b of

this Annex, we added land reform of 2001 as one of the independent variables, as a robustness

check. Coefficients on undervaluation are positive and statistically significant in all specifications

of the model. However, and as discussed in the text, the positive and statistically significant

coefficient on undervaluation (where negative undervaluation is overvaluation) needs to be

interpreted with caution and should not lead to concluding that undervaluation would encourage

growth in Zimbabwe. Dividing the misalignment variable into over- and under-valuation reveals

that only coefficient associated with overvaluation is both positive and statistically significant (i.e.,

reducing overvaluation would stimulate growth).

25

References

Alberola, E. and Navia, D. (2007), ‘Equilibrium Exchange Rates in the New EU Members:

External Imbalances vs. Real Convergence’, Banco de España Working Paper No. 0708.

Baffes, J.; O’Connell, S. A. and Elbadawi, I. A. (1997), ‘Single-Equation Estimation of the

Equilibrium Real Exchange Rate’, World Bank Policy Research Working Paper 1800.

Basdevant, O.; Jonelis, A. W. ; Mircheva, B. and Slavov, S. T. (2014), Mystery of Missing Real

Spillovers in Southern Africa: Some Facts and Possible Explanations’, IMF African Department

Paper No. 14/3.

Berg, A. and Miao, Y. (2010), ‘The Real Exchange Rate and Growth Revisited: The Washington

Consensus Strikes Back?’, IMF Working Paper WP/10/58.

Brixiová, Z.; Égert, B. and Hadj Amor Essid, T. (2014), ‘The Real Exchange Rate and External

Competitiveness in Egypt, Morocco and Tunisia’, Review of Middle East Economics and Finance,

Vol.10 (1), 25 – 51.

Edwards, S. (1988), Exchange Rate Misalignment in Developing Countries, The John Hopkins

University Press: Baltimore.

Eichengreen, B. and Gupta, P. (2012), ‘The Real Exchange Rate and Export Growth: Are Services

Different?’, NIPFP Working Paper 112.

Égert, B., A. Lahrèche-Révil and K. Lommatzsch (2004), ‘The Stock-Flow Approach to the Real

Exchange Rate of CEE Transition Economies’, Centre D’Etudes Prospectives et D’Informations

Internationales (CEPII), No. 2004 – 15.

Faruqee, H. (1995), ‘Long-Run Determinants of the Real Exchange Rate: A Stock-Flow

Perspective’, IMF Staff Papers, Vol. 42(1), pp. 80-107.

Gala, P. and Lucinda, C. R. (2006), ‘Exchange Rate Misalignment and Growth: Old and New

Econometric Evidence’, Revista Economia, Vol. 7 (4), 165 – 187.

Ghura, D. and Grennes, T. J. (1993), ‘The Real Exchange Rate and Macroeconomic Performance

in Sub-Saharan Africa’, Journal of Development Economics, Vol. 42, 155 – 174.

Haddad, M., and Pancaro, C. (2010), ‘Can Real Exchange Rate Undervaluation Boost Exports and

Growth in Developing Countries? Yes, But Not for Long’, Economic Premise No. 20, World Bank,

Washington, DC.

Hanke, S. and Krus, N. (2012), ‘World Hyperinflations’, Cato Institute Working Paper No. 8.

International Monetary Fund (2014), Zimbabwe: Article IV consultation, IMF Country Report No.

14/202.

26

International Monetary Fund (2009), ‘Zimbabwe: 2009 Article IV Consultation’, IMF Country

Report No. 09/139.

Kramarenko et al. (2010), ‘Zimbabwe: Challenges and Policy Options after Hyperinflation’, IMF

African Department Paper No. 10/3.

Masunda, S. (2012), ‘Real exchange rate misalignment and currency crisis in Zimbabwe’, Journal

of Emerging Trends in Economics and Management Services, Vol. 3(6), 923-930.

Masunda, S. (2011), ‘Real exchange rate misalignment and sectoral output in Zimbabwe’,

International Journal of Economic Research, Vol. 2 (4), 59 – 74.

Mohapatra, S. (2005), ‘Estimating the Short-Run Equilibrium Real Exchange Rate’, in Zimbabwe:

Selected Issues, IMF Country Report No. 05/359.

Muňoz, S. (2006), ‘Zimbabwe’s Export Performance: The Impact of Parallel Markets and

Governance Factors’, IMF Working Paper WP/06/28.

Ncube, M.; Jones, B. and Bicaba, Z. (2014), ‘Estimating Economic Costs of Fragility in Africa’,

African Development Bank Working Paper No. 197.

Ndlela, T. (2012), ‘Implications of real exchange rate misalignment in developing countries:

theory, empirical evidence and application to growth performance in Zimbabwe’, South African

Journal of Economics, Vol. 80 (3), 319 - 344.

Rapetti, M.; Skott, P. and Razmi, A. (2012), ‘The Real Exchange Rate and Economic Growth: Are

Developing Countries Different?’, International Review of Applied Economics, Vol. 26 (6), 735 –

753.

Razin, O. and Collins, S. (1997), ‘Real Exchange Rate Misalignments and Growth’, NBER

Working Paper No. 6174.

Rodrik, D. (2008), ‘The Real Exchange Rate and Economic Growth’, Brookings Paper on

Economic Activity, 2, ed. D. W. Elmendorf, N. G. Mankiw, and L. H. Summers, 365–412.

Washington, DC: Brookings Institution.

Rogoff, K. (2006), ‘Rethinking Exchange Rate Competitiveness’, in Global Competitiveness

Report 2005/06, World Economic Forum: Geneva.

Schöder, M. (2013), ‘Should Developing Countries Undervalue their Currencies?’, Journal of

Development Economics, Vol. 105, 140 - 151.

Zimbabwe National Statistics Office, various years, Zimbabwe Labor Force Survey, 2006 and

2012, ZimStat: Harare.


Recommended