31
The Recovery of Netherlands Geographic Information System (NLGIS-2) June 11, Harvard University Vyacheslav Tykhonov Richard Zijdeman Jerry de Vries International Institute of Social History
| Date post: | 16-Aug-2015 |
| Category: |
Technology |
| Upload: | vty |
| View: | 120 times |
| Download: | 0 times |

The Recovery of Netherlands Geographic Information System (NLGIS-2)
June 11, Harvard University
Vyacheslav Tykhonov Richard Zijdeman Jerry de VriesInternational Institute of Social History

NLGIS - Geographic Information System
General purpose of GIS
capture, store and manage dataanalyze datapresent data
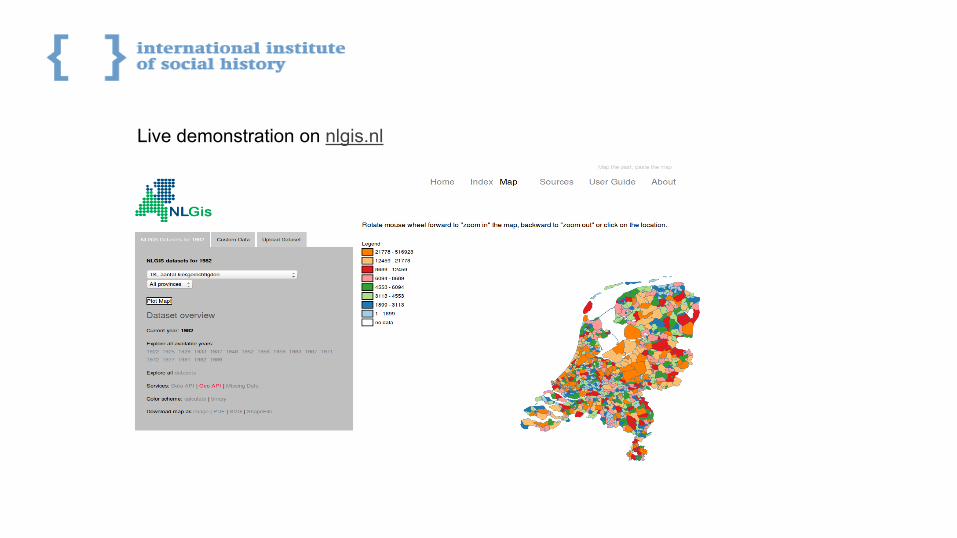
Specific purpose of NLGIS-2
make possible to plot maps as for none GIS experts as for advanced researchersshare map polygons as service to make it sustainable and stable

Dutch GIS: Past, Present, Future 1. Kaartgis / NLGIS2. HISGIS.NL (extremely detailed, but not temporal)3. NLGIS-2 (detailed and temporal)
NLGIS project officially started by Onno Boonstra in 1984. It was a time when it took a lot of hours to render even one map on the most powerful mainframes.

Initial state
When we started the recovery of the project website was already dead for a lot of years (from 2009) and it wasn’t possible see how NLGIS-1 actually used to work.
Only published maps produced by NLGIS-1 were available in old books, articles and presentations.
We’ve got only shapefiles and datasets preserved by Data Archiving and Networked Services (DANS) to do something with it.
The main question was: what’s next?

Setting up
We started to collect list of basic requirements
Data values were extracted from the codebook for Historical Database Dutch Municipalities(HDNG) and stored as CSV files
Over 200 shapefiles for each year have got verified
Preparation: standardization procedure
The list of amsterdam codes was extracted from all datasets as harmonization table and stored in file as vocabulary

NLGIS-2 basic requirements list
- the common user of the system will be historical researcher, usually without advanced technical skills
- this researcher wants a web based HGIS to allow the upload of data of his own- NLGIS should have really simple and clear design- all rendered maps should be downloadable in high resolution and should be fit in the
standard packages for documents and presentations - user should be able visualize his data on the specific provinces he will choose- NLGIS-2 engine should provide possibilities to choose categories number and colors

NLGIS, first version that got lost

NLGIS-2 team
Small but very skilled international team of dedicated professionals:
Richard Zijdeman(Netherlands)Project leader
Jerry de Vries(Netherlands)Information Analyst
Vyacheslav Tykhonov(Ukraine)Architecture, backend and frontend development

Our Development Model
NLGIS-2 used Agile software development model with strong influence of the people below:
Steve Blank - Customer Development methodologyEric Ries - The Lean StartupPeter Thiel - Zero to OneClayton Christensen - The Innovator's Dilemma
We planned to release new features every 2-3 days.

Customer Development Methodology - Step 1
The development of NLGIS-2 from the beginning to the end was data driven.Shapefiles were too heavy for geoservice so we immideately converted all files in geojson
First attempt was to plot different polygons without projection in ipython notebook:http://nbviewer.ipython.org/github/rlzijdeman/nlgis2/blob/master/maps/usecases/viewer.ipynb

Customer Development Methodology - First iteration was without projection at all

Customer Development Methodology - Step 2
Problem statementAfter first iteration we’ve discovered that we need to find right projection for all maps and compress geojson in some ‘light’ format suitable for web applications.
ActionWe made investigation on available map visualizations and libraries, learning about performance and communication protocols. Matching list of requirements with D3.js, Leaflet.js, Vincent
ConclusionReading shapefiles in real time is making system slow, we need something else to deliver polygons.
DecisionTopojson was considered as the most used communication protocol in web applications so we converted all shapefiles in topojson. Polygons size in general was compressed in 10 times.

Customer Development Methodology - Step 3
Technical decisions:● store datasets in the database according to their relational model (posgresql)● keep topojson for all polygons as one cached ‘piece’ in noSQL database with years as
keys (mongodb)● amsterdam code should be the common key both for datasets and geofiles
The architecture of the system became modular:- data should be provided by Data API (database) - map polygons should be delivered by GeoAPI (topojson)- both APIs should ‘talk the same language’ (json)- webservice for the both modules was created on the basis of python flask
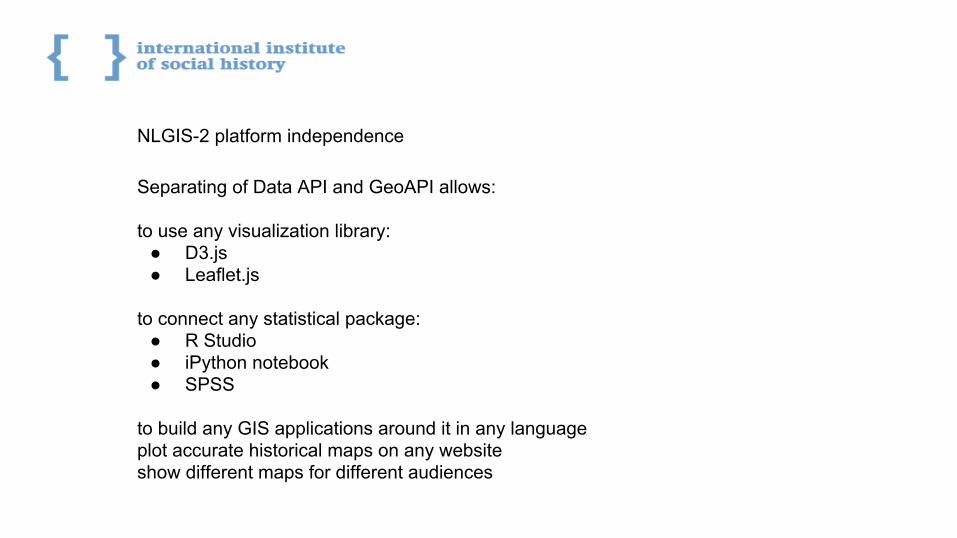
NLGIS-2 platform independence
Separating of Data API and GeoAPI allows:
to use any visualization library:● D3.js● Leaflet.js
to connect any statistical package:● R Studio● iPython notebook● SPSS
to build any GIS applications around it in any language plot accurate historical maps on any websiteshow different maps for different audiences

Customer Development Methodology - Step 4
Problem statementNow we have polygons and dataset values and it’s coming from APIs. But we need specific attributes like scales and colors, legend, categories split. What’s next?
Main questionShould attributes be merged to the map on client or server side?
The Innovator's DilemmaThe most obvious decision just to put attributes on client side but how about possibilities to download map with merged data as image?
SolutionWe’ve developed Data Processing Engine and extended Data API with attributes selected by user. Even calculated scales are there!

Data Processing Engine (DPE) specification
● can split values from any dataset in number of categories specified by researcher (8 by default)● algorithm to categorize data values in proper categories can be selected manually (percentile by
default)● can define maximum possible categories for specific dataset if there is no way to get categories
number specified by user of the system (for example, if there are 2-3 categories of data values)● data ranges should be defined to get possibility to visualize data on some chart or map in the right
scale● colors can be specified by user (Color Brewing, see http://colorbrewer2.org)● legend generated and attached to all visualizations automatically● values with missing data shown as 'no data' regions on map● all data values delivered by Data API to make the data analysis platform independent and
communicate with other systems or statistical packages

Data API
Data API provided by Data Processing Engine is the most important functionality for the well equipped digital infrastructure:
● easy way to analyze data in popular statistical packages (STATA, SPSS, Excel)● use common data science programming languages like Python, R to perform more
advanced research using external Data Science libraries● analyze data with toolboxes like Wolfram|Alpha and other Discovery Platforms (added
value for the future)● suitable for other researchers and developers to use advanced technique and data
mining tools that aren’t developed yet
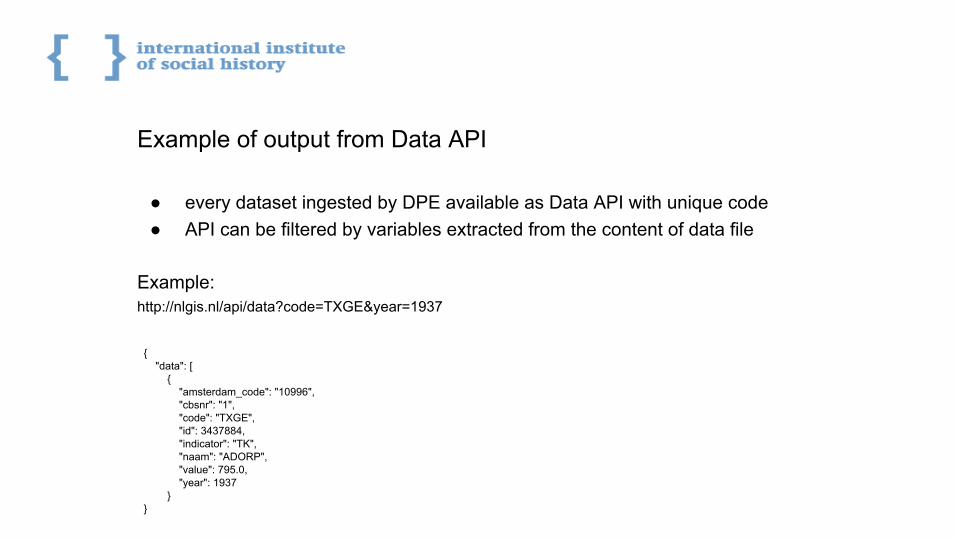
Example of output from Data API
● every dataset ingested by DPE available as Data API with unique code● API can be filtered by variables extracted from the content of data file
Example:http://nlgis.nl/api/data?code=TXGE&year=1937
{ "data": [ { "amsterdam_code": "10996", "cbsnr": "1", "code": "TXGE", "id": 3437884, "indicator": "TK", "naam": "ADORP", "value": 795.0, "year": 1937 }}

Data visualization and plotting data on historical maps
● Data Processing Engine (DPE) is the core of data visualization process and connected to geoservice by amsterdam codes
● Internally DPE is keeping data inside of memory as pandas dataframe and already prepared for any kind of analysis
● data attributes like scales and colors calculated by DPE on the fly based on the input from researcher (for example, number of categories to split data)
● visualization of datasets on historical maps will be available to plot data on maps for last 200 years but for older years DPE will use maps before 1812.

GeoAPI example
Geoservice can provide polygons for specific years on the national level rendered as topojson or geojson.GeoAPI:/api/maps?world=on&year=1962
Polygons for all locations will be delivered as topojson:arcs":[[1782,2186]]}]}},"arcs":[[[8387,6231],[0,5],[1,1],[1,-1],[2,0],[2,-1],[3,-4],[1,-3],[0,-1],[-1,-5],[0,-1],[-1,2],[0,1],[-2,2],[-3,1],[-1,0],[-1,0],[-1,3],[0,1]],[[8390,6247],[1,1],[0,1],[2,1],[1,0],[1,-2],[-1,-5],[-1,0],[-1,1],[-1,1],[-1,1],[0,1]],[[8391,6204],[0,2],[-1,1],[-1,-1],[0,1],[0,1],[1,3],[1,0],[2,-6],[0,-1],[0,-1],[0,-1],[-1,1],[-1,1]],[[8364,6093],[0,2],[2,5],[1,0],[1,-2],[-1,-6],[-1,-3],[-1,0],[-1,0],[0,1],[0,3]],[[5941,6575],[0,-1],[-1,0],[-1,1],[0,1],[-1,0],[-1,0],[-1,0],[-1,0],[0,-1],[-1,-1],[0,-2],[0,-1],[0,-2],[0,-1],[-1,-3],[-3,-2],[-4,-4],[-1,-1],[-1,0],[-2,-1],[-2,0],[-1,0],[-1,-1],[-1,-2],[-5,1],[-1,0],[-1,-1],[-1,-1],[-1,0],[-2,1],[-4,3],[-1,1],[-1,2],[-2,8],[-1,4],[-1,9],[0,1],[0,2],[0,1],[1,0],[0,-1],[0,-1],[1,-1],[0,-1],[1,0]

Dataset upload
It’s possible to upload data in 2 formats:- long format
year, amsterdam_code1811, 111501811, 111501812, 11150
- wide format (aggregated by values):year, amsterdam_code, value1811, amsterdam_code, 21812, amsterdam_code, 1
● The selection of colors implemented but reserved only for advanced users● Scales determined automatically by Data Processing Engine● Data values automatically split on categories number selected by user
NLGIS-2 audience
Now we made it simple as none GIS experts can plot their data on historical maps.
Users with no experience with GIS:● General Public● Researchers in social sciences● Journalists
Advanced users:● Developers (R, Python, etc)● Researchers in computer Science

Why do researchers asking all time for accurate historical maps?
Maps can be used in different sciences like:- Archeology- Research on social movements
(migrations, strikes, social mobility, etc)- Research on development of cities and provinces- educational purposes
The data with map will tell the story.

NLGIS as “talking” map
● One map visualization is better then 1 000 words● Must have for historical story telling if media refers to historical events● Map can show the information that other visualizations can’t do● Map is unique source of historical data to recover lost facts for scientists

Common problems of historical maps
● Standards are not clear● Boundaries changes ● Location names changes over the time● Sometimes it’s not possible to define actual boundaries ● Geographic changes not reflected for different countries● Boundaries coming from different sources can be different for the same year● Historical boundaries usually aren’t perfect and should be maintained

NLGIS-2 quality tips
● The legend is not always clear● Sometimes scales can be wrong or categories number isn’t reachable● Colors schema can be bad and not correspond to data● Historical boundaries aren’t really accurate and should be improved● At the moment there are only actual polygons from 1812 to 1997 ● Mixing up historical and modern classification of locations can cause troubles ● Missing polygons for some regions not detected but possible

Technological Singularity of NLGIS - step 1
The “dots” use case was created by Richard Zijdeman:
1. Amsterdam Code in RDF from Gemeentegeschiedenis.nl (HicSunt Leones!)2. Dutch Historical Census Data from CEDAR project 3. Plotting historical data in R from NLGIS APIs4. Old school maps from New York Library5. Interactive Plotting Christian Graul's from LeafletR

Technological singularity - step 2Old school map combined with historical map and merged with actual map of Netherlands

Summary: Zero to One
- easy access to HDNG- easy access to Boonstra maps- easy plotting facility of own and HDNG data- easy access to code through Github http://github.com/IISH/nlgis2- data driven project, rather than technology driven- can be easily recovered in the future as all datasets and geoinformation are public
available- all datasets linked to their sources and notes

Thank you!
“No subject is terrible if the story is true and if the prose is clean and honest.”
Ernest Hemingway, “Night in Paris”
Questions?
Try http://www.nlgis.nl now!