Supporting information
A Low Temperature Molten Salt Process for Aluminothermic Reduction of
Silicon Oxides to Crystalline Si for Li-ion batteries
Ning Lin, Ying Han, Jie Zhou, Kailong Zhang, Tianjun Xu, Yongchun Zhu,* and Yitai Qian*
Department of Chemistry and Hefei National Laboratory for Physical Science at Micro-
scale, University of Science and Technology of China, Hefei, Anhui 230026, (P. R. China)
Experimental section
Materials synthesis
All reagents were used without further purification. All the chemical reagents were
purchased from Sinopharm Chemical Reagent Co. Ltd. In a typical procedure, AlCl3 (8.00
g), aluminium (Al) powder (0.8 g), and high 1.0 g of high silica zeolite (SMF-400S, Shanghai
FUYU New Material Technology Co., Ltd) were mixed and loaded in a stainless steel
autoclave (volume 20 mL). The above procedure was conducted in a glove-box filled with
N2. Then, the autoclave was sealed immediately and heated in an electric stove with a
heating ramp rate of 5 oC min-1 and maintained at 200 oC or 250 oC for 10 h. After cooling
to room temperature naturally, the products were collected and washed with 0.1 M
hydrochloric acid (HCl), distilled water, and ethanol for several times. The obtained sample
was then immersed in diluted ethanol-based hydrofluoric acid (HF) solution for 3.0 min to
remove the residual silicon oxides. Finally, the product was dried in vacuum oven at 50 oC
for 1 h for further characterization. The reduction of commercial SiO2, kieselguhr, albite,
and fiberglass are carried out at 250 oC with the same weight ratio of the reagents including
metallic Al and AlCCl3. The reduction of high silica zeolite with excess metallic magnesium
(Mg) was also carried out at 200 oC. To clear observe the reaction status, the experiment
Electronic Supplementary Material (ESI) for Energy & Environmental Science.This journal is © The Royal Society of Chemistry 2015
concerning the reduction of zeolite with Al in presence of AlCl3 was also conducted in
sealed quartz tubes reactor.
Characterization
The structure and morphology of the product were characterized by X-ray diffractometer
(Philips X’ Pert Super diffract meter with Cu Kα radiation (λ=1.54178 Å)), Raman
spectrometer (Lab-RAM HR UV/VIS/NIR), X-ray photoelectron spectroscopy (XPS)
(ESCA-Lab MKII X-ray photoelectron spectrometer), scanning electron microscopy (SEM,
JEOL-JSM-6700F), and transmission electron microscopy (TEM, Hitachi H7650 and
HRTEM, JEOL 2010).
Electrochemical Measurement
The electrochemical properties of the prepared Si sample were evaluated through coin-
type cells (2016 R-type) which were assembled under an argon-filled glove box (H2O, O2
< 1 ppm). Metallic Li sheet was used as counter and reference electrode. 1 M LiPF6 in a
mixture of ethylene carbonate/dimethyl carbonate (EC/DMC; 1:1 by volume) was served
as the electrolyte (Zhuhai Smooth way Electronic Materials Co., Ltd (china)). For preparing
working electrode, the slurry mixed with as-prepared active Si material, carbon black
(super P) and sodium alginate (SA) binder in a weight ratio of 6:2:2 in water solvent was
pasted onto a Cu foil, and then dried in a vacuum oven at 80 oC for 10 h. The active material
density of each electrode was determined to be about 1.0 mg cm-2. Galvanostatic
measurements were conducted using a LAND-CT2001A instrument at room temperature
with a fixed voltage range of 0.005−1.5 V (vs. Li/Li+). Cyclic voltammetry (CV) was
performed on electrochemistry workstation (CHI660D), with a scanning rate of 0.2 mV s-1
at room temperature.
(1)
Figure S1. The (a) XRD patterns and the (b) SEM image of the commercial high silica
zeolite, the main content is aluminium silicate (Al2O3/11SiO2) (JCPDS No. 44-0003).
(2) The effect of reaction temperature on the reduction with Al in molten AlCl3 was studied,
as shown in Figure S2. It is obvious that the reaction could be initiated to generate Si
nanoparticles at 200 oC. At 250 oC, the peaks of the crystalline zeolite are disappeared
completely, implying more sufficient reduction. Meanwhile, the yield increases from 40%
at 200 oC to 75% at 250 oC, while no significant change of yield is detected at 300 oC.
Figure S2. The (a) XRD patterns of the product prepared at 200 oC, and 250 oC. The
temperature effect on the reduction process is studied by conducting the experiment at
200 oC, and 250 oC, respectively. The obtained products were washed with 0.1 M
hydrochloric acid (HCl), distilled water, and ethanol, but without the HF solution. The above
picture shows the corresponding XRD patterns.
(3)
Figure S3. (a) The schematic picture of our self-made stainless steel autoclave for
measuring the inner temperature variation. (b) The temperature change plots as a function
of time inside the electric furnace and inside the stainless steel autoclave. The
thermocouple thermometer is plugged into the stainless steel autoclave. Note that the
autoclave must be sealed tightly.
(4) We conducted the experiments in a quartz tube to observe the reaction directly. After
cooling to room temperature gradually, some crystal-like matter is condensed at the top of
the tube, which is verified as pure AlCl3 by XRD analysis.
Figure S4. The XRD pattern of the sample obtained from the top side of the quartz tube.
The main content is AlCl3.
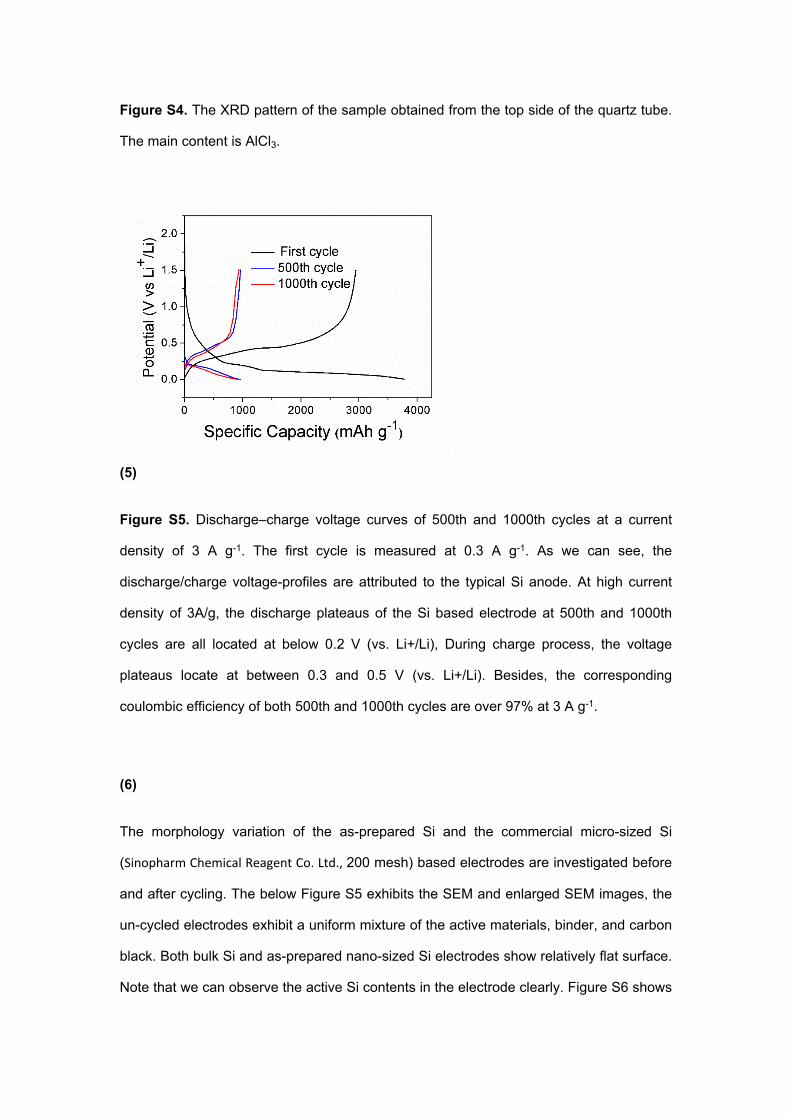
(5)
Figure S5. Discharge–charge voltage curves of 500th and 1000th cycles at a current
density of 3 A g-1. The first cycle is measured at 0.3 A g-1. As we can see, the
discharge/charge voltage-profiles are attributed to the typical Si anode. At high current
density of 3A/g, the discharge plateaus of the Si based electrode at 500th and 1000th
cycles are all located at below 0.2 V (vs. Li+/Li), During charge process, the voltage
plateaus locate at between 0.3 and 0.5 V (vs. Li+/Li). Besides, the corresponding
coulombic efficiency of both 500th and 1000th cycles are over 97% at 3 A g-1.
(6)
The morphology variation of the as-prepared Si and the commercial micro-sized Si
(Sinopharm Chemical Reagent Co. Ltd., 200 mesh) based electrodes are investigated before
and after cycling. The below Figure S5 exhibits the SEM and enlarged SEM images, the
un-cycled electrodes exhibit a uniform mixture of the active materials, binder, and carbon
black. Both bulk Si and as-prepared nano-sized Si electrodes show relatively flat surface.
Note that we can observe the active Si contents in the electrode clearly. Figure S6 shows
the cycled electrode. After 10 cycles, surface of all electrodes becomes smoother, which
may result from the formation of solid state interface membrane. Figure S6 a, b display the
SEM and enlarged SEM images of commercial bulk Si based electrode. Obviously, some
protuberance and micro-sized hole on the electrode surface is formed, which may be
caused by the huge volume change of the micro-sized bulk Si. As for as-prepared Si
nanoparticles, electrode still presents flat surface (Figure S6c). We also disclosed the inner
composition of the cycled electrode, as shown in Figure S6d. No independent Si
nanoparticles could be observed, which may be caused by two aspects. First, the
generated SEI membrane would cover on the particles. Second, it is well-accepted that the
crystalline Si would converted into amorphous phase after repeated lithiation and de-
lithiation process. After a few cycles, the origin structure may disappear, but still connect
with binder and carbon black tightly. However, the bulk Si with drastic volume variation
would loss contact with the current collector. So, it is reasonable to speculate that the
nanostructured Si could effectively suppressing the volume change, leading to enhanced
electrochemical performance.
Figure S6. The (a) SEM and enlarged SEM images of commercial bulk Si based electrode
(before cycling). The (c) SEM and enlarged SEM images of as-prepared Si nanoparticles
based electrode (before cycling).
Figure S7. The (a) SEM and enlarged SEM images of commercial bulk Si based electrode
(after 10 cycles). The (c) SEM and enlarged SEM images of as-prepared Si nanoparticles
based electrode (after 10 cycles).
(7)
Figure S8. The XRD patterns of the crud products of the reaction between Mg, AlCl3 and
high silica zeolite. The existence of AlCl3 (labeled as “☆”, JCPDS No.77-0819) is attributed
to the excess reagent, providing liquid environment. A group of dominant diffraction peaks
(labeled as “★”) in the pattern can be characterized as complex chlorides MgAl2Cl8 (JCPDS
No.78-0916) which is the main by-product. The peaks labeled as “◇”are assigned to the
orthorhombic phase AlOCl (JCPDS No. 16-0448) that is the other important by-product. It
is reasonable to speculate that both metallic Al and the molten salt AlCl3 participate the
reduction process as: 2Mg + SiO2 + 6AlCl3 → 2MgAl2Cl8 + 2AlOCl + Si.
(8)
Figure S9. The (a) XRD patterns, (b) XPS, (c) TEM images of the Si prepared through
reduction of commercial nano-sized SiO2 precursor with Al in AlCl3. The corresponding
XRD patterns (Figure S9a) and XPS plot (Figure S9b) indicate that the obtained samples
are well-crystallized Si (JCPDS 27-1402), with a small amount of amorphous SiOx. The
TEM image (Figure S9c) exhibits the Si sample consists of nano-sized particles.
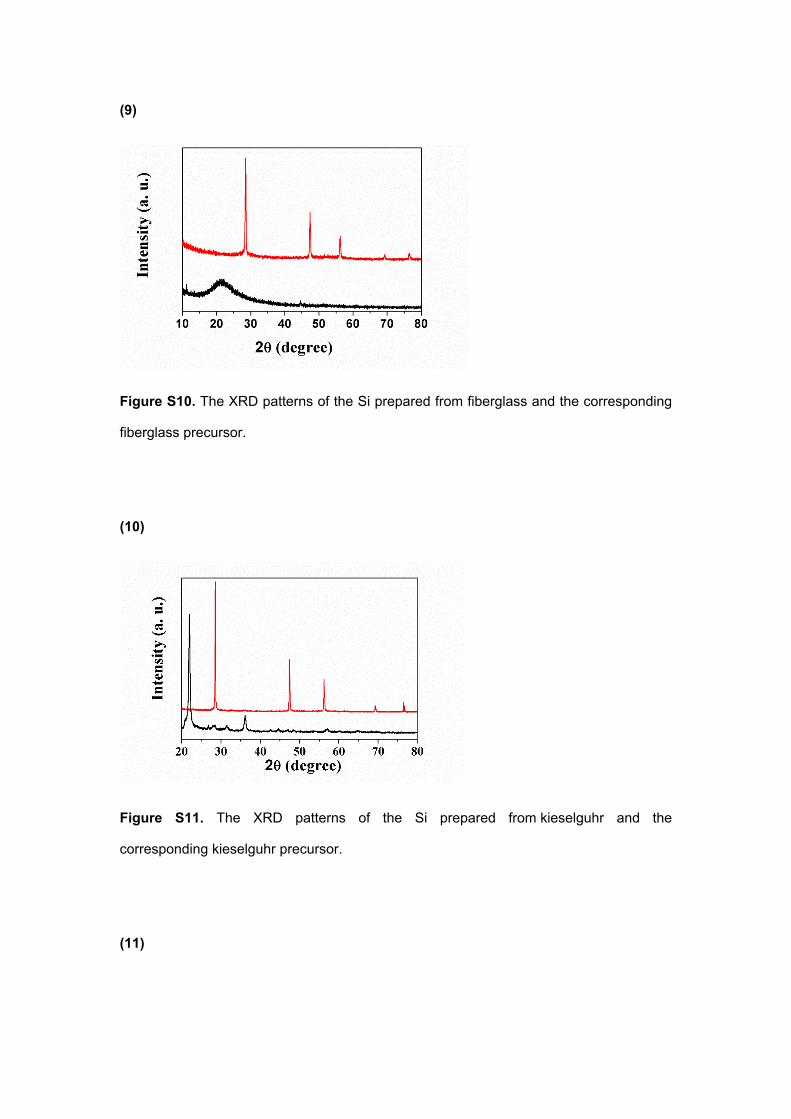
(9)
Figure S10. The XRD patterns of the Si prepared from fiberglass and the corresponding
fiberglass precursor.
(10)
Figure S11. The XRD patterns of the Si prepared from kieselguhr and the
corresponding kieselguhr precursor.
(11)
Figure S12. The XRD patterns of the Si prepared from mineral albite, and the
corresponding albite precursor.