The reference price system and socioeconomic differences in the use of low cost drugs KCE reports 126C Federaal Kenniscentrum voor de Gezondheidszorg Centre fédéral d’expertise des soins de santé Belgian Health Care Knowledge Centre 2010
Transcript
The reference price system and socioeconomic differences in the use
of low cost drugs
KCE reports 126C
Federaal Kenniscentrum voor de Gezondheidszorg Centre fédéral d’expertise des soins de santé
Belgian Health Care Knowledge Centre 2010
The Belgian Health Care Knowledge Centre
Introduction: The Belgian Health Care Knowledge Centre (KCE) is an organization of public interest, created on the 24th of December 2002 under the supervision of the Minister of Public Health and Social Affairs. KCE is in charge of conducting studies that support the political decision making on health care and health insurance.
Administrative Council
Actual Members: Pierre Gillet (President), Dirk Cuypers (Vice-president), Jo De Cock (Vice-president), Frank Van Massenhove (Vice-president), Yolande Avondtroodt, Jean-Pierre Baeyens, Ri de Ridder, Olivier De Stexhe, Johan Pauwels, Daniel Devos, Jean-Noël Godin, Floris Goyens, Jef Maes, Pascal Mertens, Marc Moens, Marco Schetgen, Patrick Verertbruggen, Michel Foulon, Myriam Hubinon, Michael Callens, Bernard Lange, Jean-Claude Praet.
Substitute Members: Rita Cuypers, Christiaan De Coster, Benoît Collin, Lambert Stamatakis, Karel Vermeyen, Katrien Kesteloot, Bart Ooghe, Frederic Lernoux, Anne Vanderstappen, Paul Palsterman, Geert Messiaen, Anne Remacle, Roland Lemeye, Annick Poncé, Pierre Smiets, Jan Bertels, Catherine Lucet, Ludo Meyers, Olivier Thonon, François Perl.
Federaal Kenniscentrum voor de gezondheidszorg - Centre fédéral d’expertise des soins de santé – Belgian Health Care Knowlegde Centre. Centre Administratif Botanique, Doorbuilding (10th floor) Boulevard du Jardin Botanique 55 B-1000 Brussels Belgium Tel: +32 [0]2 287 33 88 Fax: +32 [0]2 287 33 85 Email : [email protected] Web : http://www.kce.fgov.be
The reference price system and socioeconomic
differences in the use of low cost drugs
KCE reports vol 126C
FRANCE VRIJENS, CARINE VAN DE VOORDE, MARIA-ISABEL FARFAN-PORTET, MAÏTE LE POLAIN, OLIVIER LOHEST
Federaal Kenniscentrum voor de Gezondheidszorg Centre fédéral d’expertise des soins de santé
Belgian Health Care Knowledge Centre 2010
KCE reports 126C
Title: The reference price system and socioeconomic differences in the use of low cost drugs
Authors: France Vrijens (KCE), Carine Van de Voorde (KCE), Maria-Isabel Farfan-Portet (KCE), Maïté le Polain (KCE), Olivier Lohest (formerly KCE).
External experts: Annelies Van Linden (Domus Medica), Pieter Dylst (K.U.Leuven), Francis Arickx (NIHDI), Marc de Falleur (NIHDI), Koen Cornelis (Alliance of Christian Mutualities), Robert Vander Stichele (UGent), Virginie Peirs (Febelgen), Herman Van Eeckhout (pharma.be).
Acknowledgements: Jeannine Gailly (KCE), Stephan Devriese (KCE).
External validators: Pierre Chevalier (UCL-NIHDI), Brian Godman (Mario Negri Institute for Pharmacological Research, Milan, Italy; Division of Clinical Pharmacology, Karolinska Institute, Stockholm, Sweden; Prescribing Research Group, University of Liverpool, UK), Steven Simoens (K.U.Leuven).
Conflict of interest: Virginie Peirs was employed by Teva Pharma Belgium from 2001 until May 2009. Herman Van Eeckhout is employed by pharma.be.
Disclaimer: The external experts were consulted about a (preliminary) version of the scientific report. Subsequently, a (final) version was submitted to the validators. The validation of the report results from a consensus or a voting process between the validators. Only the KCE is responsible for errors or omissions that could persist. The policy recommendations are also under the full responsibility of the KCE.
Any partial reproduction of this document is allowed if the source is indicated. This document is available on the website of the Belgian Health Care Knowledge Centre.
How to refer to this document?
Vrijens F, Van de Voorde C, Farfan-Portet MI, le Polain M, Lohest O. The reference price system and socioeconomic differences in the use of low cost drugs. Health Services Research (HSR). Brussels: Belgian Health Care Knowledge Centre (KCE). 2010. KCE reports 126C. D/2010/10.273/20
KCE reports 126C The reference price system. i
Executive summary
INTRODUCTION AND RESEARCH QUESTIONS To control public expenditures on prescription drugs in ambulatory care, almost all European countries have opted for a reference price system (RPS). In Belgium, Reference Reimbursement System refers to the RPS. A RPS limits the reimbursement of drugs by establishing a maximum level of reimbursement for a group of pharmaceutical products. Any difference between the reference price and the price of a more costly drug has to be paid by the patient and is called the reference supplement. The reference supplement differs from co-payments on drugs because it applies to all patients uniformly (i.e. no matter their entitlement to increased reimbursement) and because it can be avoided by changing prescribing behaviour. In practice, the use of low cost drugs (those drugs which do not incur a reference supplement for the patient) depends on interactions between the prescriber, the patient and the pharmacist.
The RPS can be regarded as an example of a selective cost sharing design which is intended to provide patients with financial incentives to alter their consumption behaviour. In theory, reference pricing rests on the assumption that all patients are fully aware of the existence and the consequences of such system and that all patients will make rational choices about which drugs to use. From a social point of view, problems of financial accessibility might arise from the RPS if the weakest socioeconomic groups in society are less informed about the system, and hence are more subject to non-adherence. This report provides new evidence on this topic for Belgium.
There are three research questions:
1. How is the reference price system implemented in Belgium, and how can it be compared to reference pricing organized in some selected countries (Denmark, France, Germany, Hungary, Italy, the Netherlands, Portugal, Spain, Australia, New Zealand and British Columbia)?
2. Is there evidence of socioeconomic differences associated with the use of low cost drugs in the literature and in Belgian physician prescribing data? If so, what are these differences associated with (e.g. lack of information, attitude, expectations) and what is the impact on patient costs?
3. If such evidence is found in Belgium, what measures can be taken to avoid these differences?
ii The reference price system KCE reports 126C
RESULTS OF THE INTERNATIONAL COMPARISON ON REFERENCE PRICING
The description and comparison of the RPS in the selected countries revealed large differences in three fundamental aspects of the system: the scope of the system (which drugs are included?), the reference price (how is it fixed?), and the measures (for physicians, pharmacists and patients) taken to stimulate the use of low cost drugs.
SCOPE OF THE SYSTEM A RPS is based on the assumption that drugs grouped together in clusters are interchangeable. The definition of “interchangeability” or “equivalence” of pharmaceutical products is by far the most controversial issue in the RPS.
There are basically three types of clusters. The most restricted version of the RPS is called generic reference pricing (or Level 1 RPS), and applies to bio-equivalent pharmaceutical products: an originator and its generic (the same molecule classified under the same Anatomical Therapeutic Chemical (ATC)-5 group). A Level 1 RPS is applied in Belgium (see description below), Denmark, France, Portugal and Spain.
In a Level 2 RPS, chemically different active ingredients which are considered as pharmacologically comparable are included (typically ATC-4). Countries having a Level 2 RPS are New Zealand, Australia and the Netherlands.
In a Level 3 RPS, pharmacologically different but therapeutically equivalent products form a cluster (typically ATC-3). The RPS usually does not contain only clusters set at Level 3. In countries such as British Columbia (Canada), Germany, Italy and Hungary, clusters are set at different levels (e.g. Germany combines clusters at Level 1, 2 and 3).
Belgium
A Level 1 reference price system was implemented on June 1, 2001, and extended in July 1, 2005. The definition of the reference cluster includes all drugs having the same active ingredient (ATC-5) independent of dosage and administration routes (there are some exceptions, mainly for injectable formulations). From April 2010 onwards, the system will be enlarged by including a number of variants of the currently included active ingredient (e.g. isomers).
THE REFERENCE PRICE Once drugs are classified into clusters, a reference price is set for all drugs within each cluster. Different methods are used to calculate the reference price: the price can be set by reference to the cheapest drugs within the cluster (e.g. Australia), the average of all included drugs (e.g. The Netherlands), the average of the lowest two prices (e.g. Denmark), the most expensive generic drug in the cluster (Portugal) or by a regression model based on prices of drugs within the cluster (e.g. Germany).
Belgium
When the RPS was first introduced in 2001, the reference price was based on the originator price which was reduced with 16%. This price reduction was progressively increased to 30% (and higher for drugs in the system since more than 2 or 4 years; effective from April 2010).
Belgium is unique in applying a fixed percentage of the originator product to calculate reference prices: all other countries studied in the international comparison take into account the price of some or all generic products in the cluster.
KCE reports 126C The reference price system. iii
ADDITIONAL FINANCIAL PROTECTION FOR THE PATIENT
Not only official co-payments but also the reference supplement is included in the maximum billing system. This may seem surprising, since the price difference between the brand and the reimbursement basis is in principle an avoidable expenditure for patients. However, by setting this measure, policymakers aimed to take into account that patients are not always aware of the existence of such system.
In addition, concerned about the additional cost borne by patients, the Belgian legislator introduced a legal upper-limit on the reference supplement, effective from April 2010. This so-called ‘security margin’ aims to exclude from the reimbursement list all drugs for which the reference supplement is more than 25% of the reimbursement basis (with a maximum of €10.80). The security margin is meant to encourage pharmaceutical companies to decrease their prices and to grant patients an extra financial protection.
MEASURES FOR PRESCRIBERS All countries monitor physician prescription behaviour, and in three countries they have direct financial incentives to prescribe low cost drugs (France, Spain, Germany).
Belgium
Besides the prescription guidelines and information campaigns aimed at physicians, minimum percentages of low cost prescriptions (the so-called “quotas”) are effective since 2006. Low cost prescriptions included in the quotas are: (1) original drugs for which the reimbursement basis has been diminished because a generic alternative exists, and which have lowered their public retail price to the reimbursement basis (so that there is no reference supplement to be paid), (2) generic drugs and copies and (3) drugs prescribed under the International Common Denomination (ICD or INN: International Non-proprietary Name), even if there is no generic alternative.
Quotas are defined by specialty, and range from 9% for gynaecologists to 30% for gastroenterologists, oncologists, stomatologists and dentists. The low cost prescribing quota for general practitioners (GPs) equals 27%.
The National Agreement between Physicians and Sickness Funds for 2009-2010 includes (among other measures) the commitment to initiate the therapy for at least 80% of their patients with the least costly molecule(s) within a group of drugs belonging to the same ATC-4 or ATC-3 cluster and this for 4 groups: proton pump inhibitors, ACE inhibitors & sartans, statins and non-steroidal anti-inflammatory drugs. This is the first attempt by decision-makers to introduce the concept of therapeutic equivalence within a class of drugs.
THE NO-SWITCH MOLECULES
Recent Belgian guidelines on INN prescription recommend that for certain molecules, the treatment initiated (with an original or a generic) has to be maintained. This list includes, among others, 32 molecules with narrow therapeutic margin. For these molecules, there is very little difference between a toxic concentration and an effective concentration in the blood, which requires careful titration and patient monitoring. Because there is no European consensus on the definition or on the list of molecules, the Belgian list is inspired by American and Canadian health authorities. Oral contraceptives are also included in the no-switch list.
iv The reference price system KCE reports 126C
MEASURES FOR PHARMACISTS In all reviewed countries (except Belgium), the pharmacist has a substitution right: unless it is explicitly forbidden by the prescriber, the pharmacist can dispense a generic drug for a prescription written for the original drug. In France, pharmacists have also direct financial incentives to dispense generic drugs.
Belgium
The role of the pharmacist in dispensing a low cost drug is limited to prescriptions written in INN: in that case, the pharmacist has to dispense in priority a drug without reference supplement for the patient. Otherwise, there is no substitution right for pharmacists, although this is foreseen by the Belgian legislator (Law of August 6, 1993).
RESULTS FROM THE LITERATURE REVIEW ON THE ASSOCIATION OF REFERENCE PRICING WITH OUTCOME MEASURES
In the review of the literature on the association between the introduction of a RPS with drug use, drug prices, drug expenditures, health services use and health status mainly studies which address the impact of a therapeutic RPS were included, whereas in Belgium a generic RPS is in place. Patient health is a major cause of concern in therapeutic reference pricing while with generic reference pricing the evaluation focuses on the impact on drug prices and expenditures.
The results of this chapter are based on 4 reviews (3 systematic and 1 narrative), including a total of 23 individual papers. Only four papers analyzed the impact of reference pricing according to (socioeconomic) patient characteristics. All four papers are based on data for adults aged 65 and older living in British Columbia, which has a Level 2 RPS.
Despite the heterogeneity in approach of the studies in the 4 reviews, some general trends can be identified.
• An increase in the use of drugs priced at the reference price and a decreased use of the highest cost drugs within the cluster.
• Concerning the impact on drug prices of originator products, results are conflicting. Some studies provide evidence that the introduction of a RPS was followed by a price reduction of the originator products; others found no effect.
• Reference pricing contributed to a reduction of drugs expenditures for the third-party payer.
• A limited number of studies have assessed the impact of the implementation of a reference price system on health care utilisation. Only one study considered changes in health status (mortality) associated with the RPS. No evidence of adverse effects on mortality and on changes in health care utilization was found after the introduction of a RPS. The main limitation of these studies is that health status is measured using proxy variables (such as changes in health care utilisation).
• The use of health services after the implementation of the RPS in British Columbia did not differ according to patients’ socioeconomic characteristics. Nevertheless, after the implementation of the RPS, low income patients in British Columbia were more likely than high income patients to use the reference drug.
KCE reports 126C The reference price system. v
ANALYSIS OF BELGIAN PRESCRIPTION DATA (2008) METHODS
Source and linkage of databases
A stratified random sample of 10% of all prescribing GPs and 5% of all prescribing specialists was selected in Pharmanet 2008, a database containing all ambulatory reimbursed drug data in Belgium. For each of the selected prescribers, all patients who received a prescription from that physician were identified. All pharmaceutical products delivered in 2008 to those patients were selected from Pharmanet. Only prescriptions for adults were analyzed. Data were then linked to socioeconomic characteristics of patients (database of Intermutualistic Agency); to prescriber characteristics (NIHDI/RIZIV/INAMI database) and small area characteristics (average level of income, average level of education) of the patient’s residence neighbourhood (General Socioeconomic Survey 2001).
Aggregated statistics on the whole Pharmanet 2008 were also received from the NIHDI to describe time trends of pharmaceuticals consumption.
Selection of pharmaceutical products and statistical analysis
The analyses aimed at answering two main questions.
Cluster containing originator drugs with reference supplement
Are characteristics of patients and physicians associated with the choice between drugs which have the same active ingredient but for which an original (incurring a reference supplement for the patient) and a low cost version exists (often a generic without reference supplement)?
Socioeconomic differences in the use of low cost drugs were analysed among drug clusters in the RPS where a choice between a low cost drug (generic or original brand with a reduced price) and a brand drug exists. This sample corresponded to 1 526 084 prescriptions distributed over 66 active ingredients (over 7 ATC-1 groups).
The percentage of low cost use was described for all molecules, and logistic regression models were performed for 12 specific groups of drugs.
Use of the “least costly” molecule(s) within a class of drugs
Within a group of active ingredients classified within the same therapeutic/pharmacological/chemical cluster, which patient and physician characteristics are associated with the choice of the least costly drug(s)? This includes, but is not limited to, low cost drugs as defined by the NIHDI (drugs without a reference supplement).
We selected three classes from the 2009-2010 agreement between physicians and sickness funds: Proton Pump Inhibitors (PPIs) which reduce gastric acid production (71 315 patients), statins that lower the level of cholesterol in the blood (84 694 patients) and ACE inhibitors & sartans, two groups of pharmaceuticals that act on the renin-angiotensin system and that are mainly used in hypertension, heart failure and nephropathy (83 633 patients). In addition to these groups, dihydropyridines which are primarily used to treat hypertension (38 329 patients) were also analyzed.
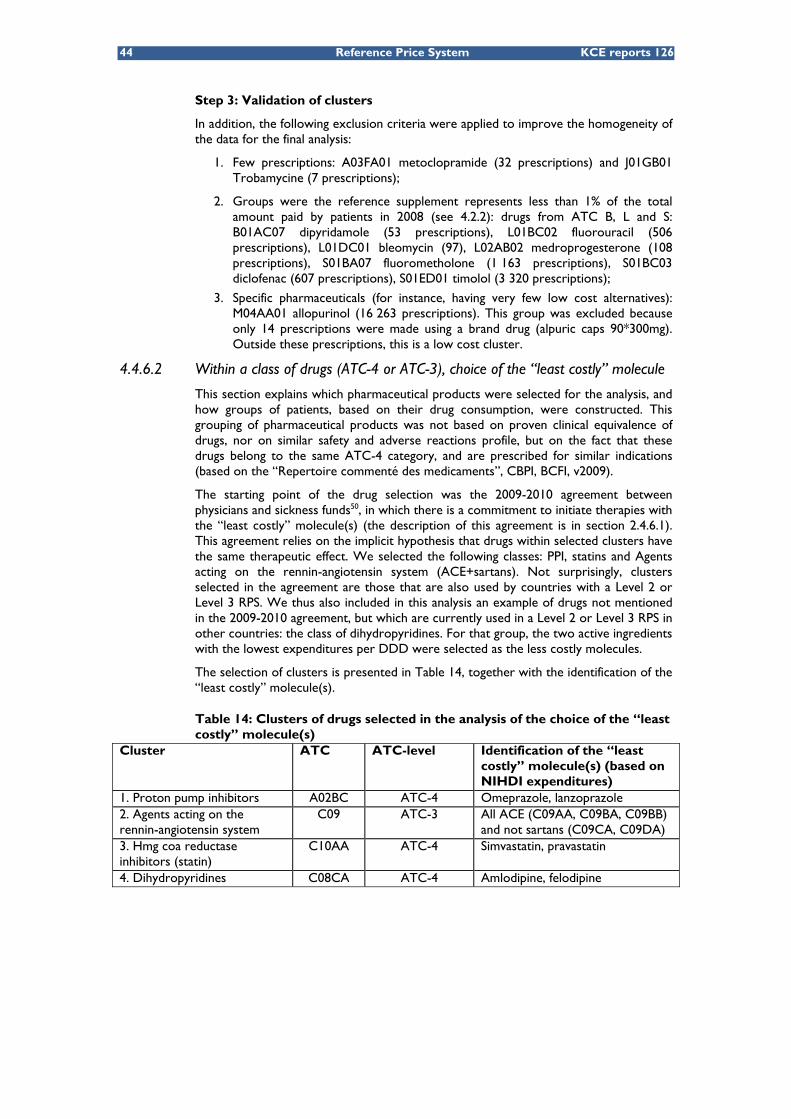
The same logistic regression models were used as in the first sample, with the use of the “least” costly molecule” (as defined by the NIHDI for 3 of the 4 groups) as the outcome variable. The “least costly” molecule(s) within a group are omeprazole and lanzoprazole for the PPIs, simvastatin and pravastatin for the statins, ACE inhibitors for the group of ACE inhibitors & sartans, amlodipine and felodipine for the group of dihydropyridines.
vi The reference price system KCE reports 126C
RESULTS
Cluster containing originator drugs with reference supplement
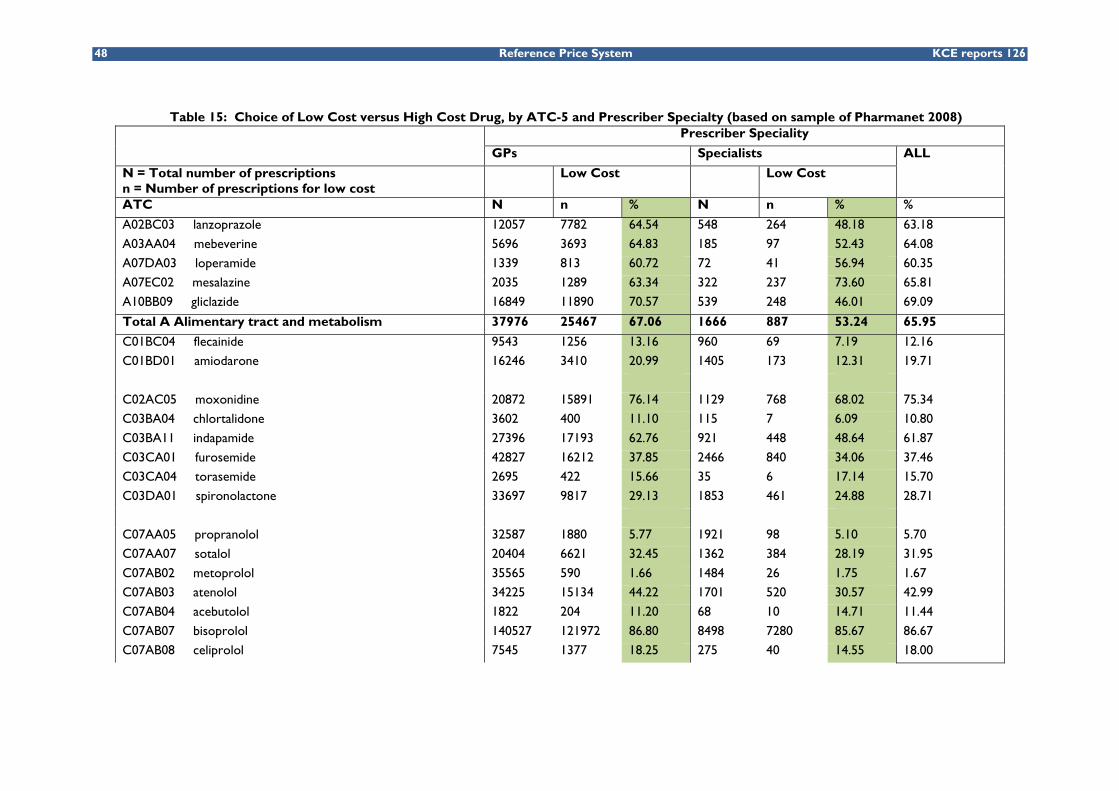
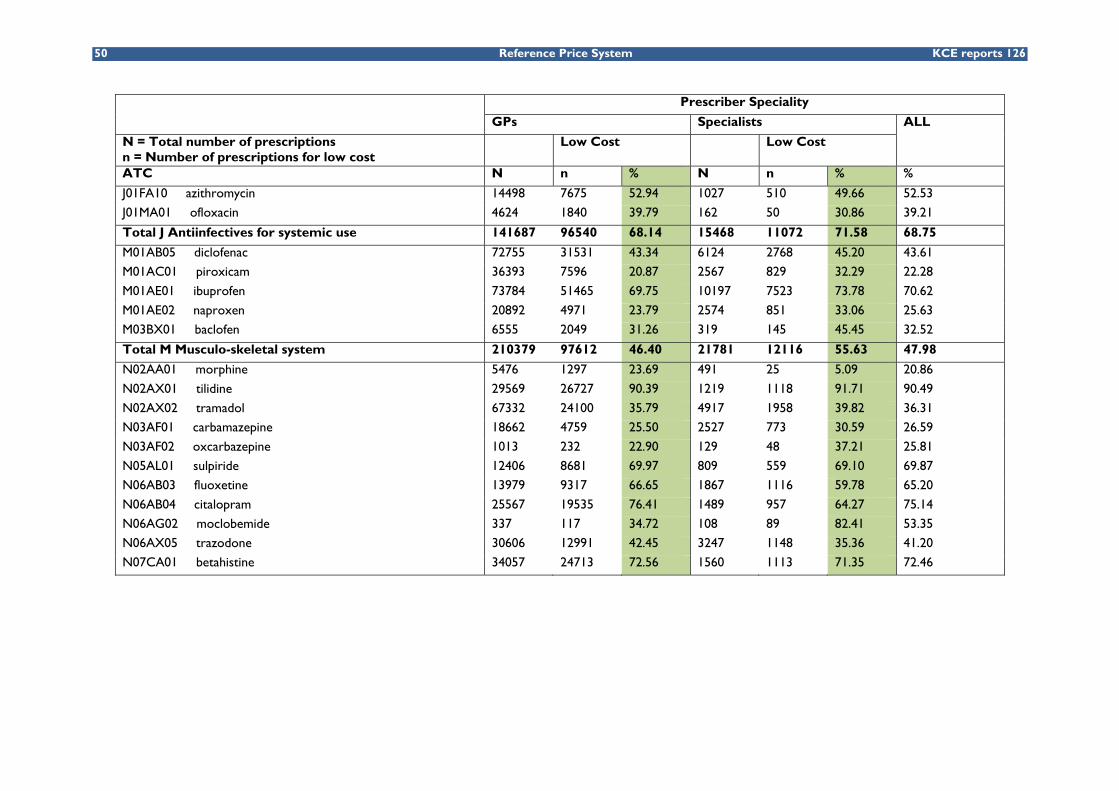
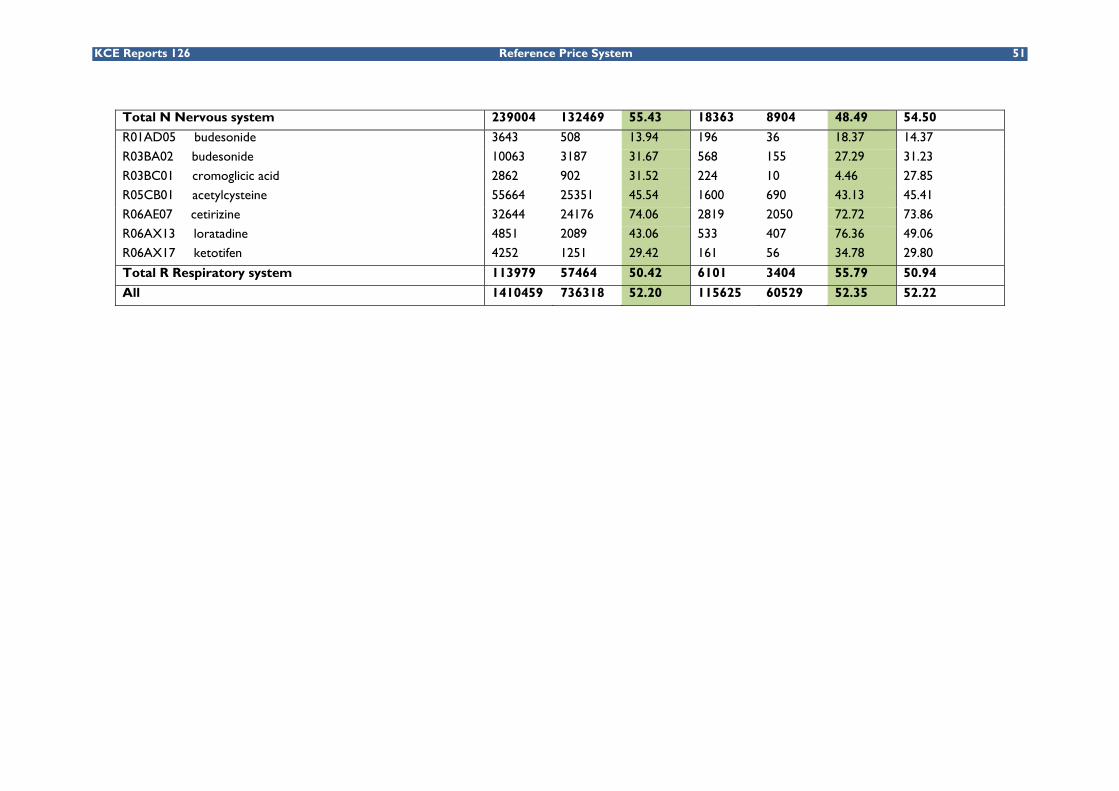
The total amount paid by patients in reference supplements in 2008 was €60.45 million which corresponded to 10.2% of total out-of-pocket payments for reimbursed pharmaceuticals (€592.41 million). Reference supplements were mostly paid for cardiovascular drugs (€20.54 million, 34% of total reference supplements), nervous system drugs (€11.44 million, 19% of total) and musculoskeletal system drugs (€10.18 million, 17% of total). The share of the reference supplement in total out-of-pocket payments was the highest in musculoskeletal system drugs and genitourinary drugs (respectively 30% and 16%).
Among the 66 molecules analyzed in our sample, 52.2% of the prescriptions were for a low cost drug. However, prescription rates of low cost alternatives differed by molecule, the two extremes being metoprolol (1.67% of low cost prescriptions) and tilidine (90.9%), and by physicians’ speciality. For instance, low cost alternatives were more prescribed by GPs than by other specialists for glicazide (76.5% and 46.01% respectively). On the contrary, the rate of prescription of low cost alternatives for roxithromycin was higher among specialists than among GPs (94.64% and 27.59% respectively). Among these molecules, those having a narrow therapeutic margin (no-switch) were less prescribed in low cost alternatives. This was the case for flecainide, amiodarone and carbamazepine. For the 66 molecules, the average reference supplement paid by patients was of €13.5. Only 5% of all patients in the sample paid more than €45 in 2008 in reference supplement.
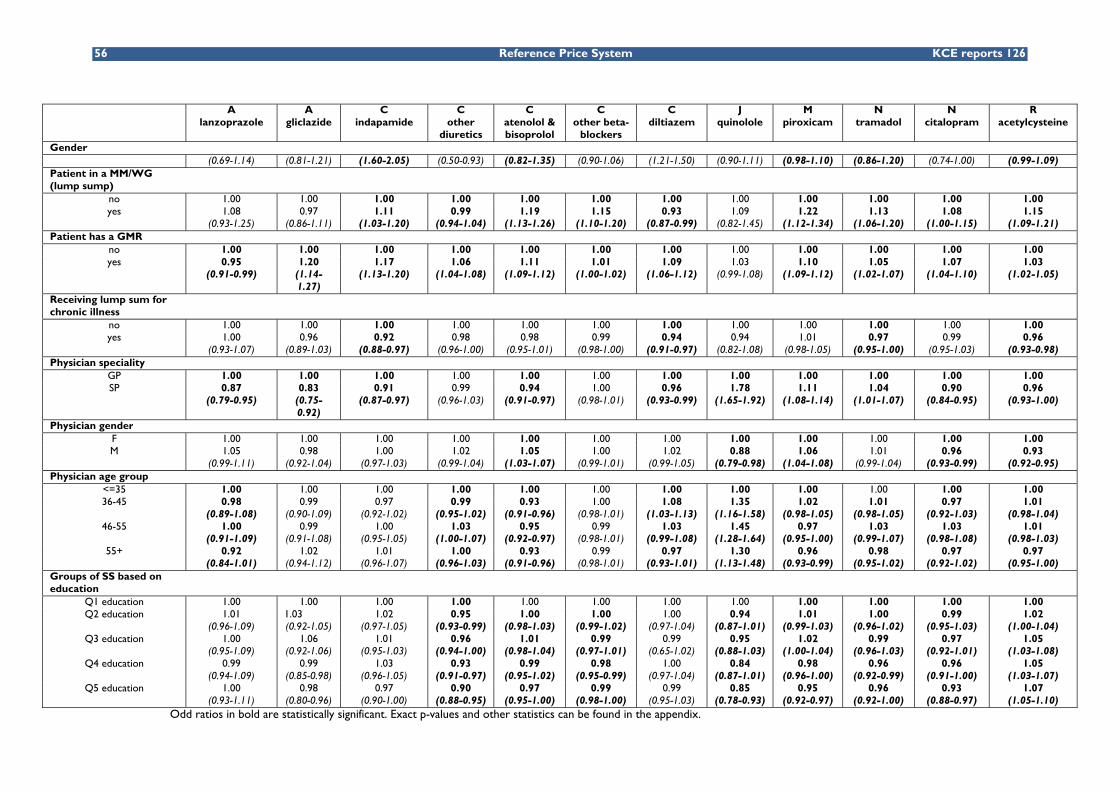
The results of the association between the use of low cost drugs and socioeconomic characteristics of patients and physicians are detailed in Table 17 of the scientific report. As results vary per drug analyzed, only main trends are described here.
• Elderly patients are slightly less likely to use a low cost alternative.
• There is no evidence that patients entitled to increased reimbursement use more originator drugs (and hence incur more out-of-pocket payments): for 7 of the 12 groups, there was no difference in the use of low cost alternatives between patients entitled and the patients not entitled to increased reimbursement. For the remaining 5 groups, there is evidence that these patients use more low cost alternatives (but differences are small: about 5% relative increase).
• There is also evidence that patients living in areas with lower education levels receive more low costs drugs (with only one exception, acetylcysteine), but effects are small.
• Having a global medical record is almost systematically associated with higher use of low cost drugs.
• The largest effects are found in those variables related to physician or practice characteristics. Patients registered in a medical house paid by lump sum received for 7 groups out of 12 more low cost alternatives. Relative differences up to 22% were observed (piroxicam). For diltiazem, another narrow therapeutic product, patients received less low cost prescriptions. For seven groups out of 12, GPs did prescribe more low cost alternatives than specialists (and for 3 groups -quinolone, piroxicam, tramadol, the reverse holds).
KCE reports 126C The reference price system. vii
Use of the “least costly” molecule(s) within a class of drugs
The percentage of patients using “least costly” molecule(s) was 72% for the PPIs, 60% for the statins, 66% for ACE inhibitors/sartans (only) and 65% for dihydropyridine derivatives.
Patient age is also associated with the use of less costly molecules: younger patients received more cheaper molecules for PPIs and ACE inhibitors/sartans. For statins and for dihydropyridine derivatives, no clear trend for the effect of age was found. However, for the 4 drug classes, elderly patients in a rest or nursing home had a higher probability of receiving the least costly molecules.
Patients entitled to increased reimbursement received more “least costly” molecules than patients not entitled. This is true for PPIs, statins and ACE inhibitors/sartans. For work status, statins are the only class for which unemployed patients receive cheaper molecules than employed patients. Education plays a moderate role, but effects are contrasted across drug classes. Patients under PPIs or under ACE inhibitors/sartans living in areas with low education levels receive less cheap molecules. The opposite is true for patients under statins. Patients entitled to a lump sum for chronic illness were also more likely to receive cheaper molecules than those not entitled. This result holds for the 4 classes of drugs.
Physician characteristics also influence the prescription of “least costly” molecules. Patients registered in a medical house paid by lump sum receive more “least costly” molecules. GPs prescribe more “least costly” molecules for PPIs and statins than specialists. The opposite is true for ACE inhibitors/sartans. For the statins and ACE inhibitors/sartans older physicians prescribe cheaper molecules, but for PPIs the reverse was found.
CONCLUSION AND DISCUSSION When evaluating the RPS from the point of view of financial accessibility of patients, a possible differential impact of the system on people with different socioeconomic background should be assessed. Empirical evidence in the international literature on this issue is scarce. This study was the first to analyse in detail how the €60 million paid on reference supplements in 2008 are distributed among the general population in Belgium. The assessment of possible unintended distributional consequences of the Belgian reference price system identified no under use of low cost drugs by less privileged socioeconomic groups; there is even a slight inverse tendency. The results are encouraging in terms of overall equity of the RPS, as defined in terms of financial accessibility, since the use of low cost alternatives is slightly higher among more disadvantaged groups. In any case, introducing a selective cost sharing measure such as the RPS should be accompanied by measures guaranteeing equal access to information on prices and therapies.
The analysis of physician characteristics revealed that age, gender and medical speciality are associated with prescription rates of low cost drugs. Part of the difference in prescribing behaviour between GPs and specialists may be due to features specific to some drugs. For example, 4 drugs with very limited prescription rates of low cost drugs have a narrow therapeutic margin (flecainide, amiodarone, carbamazepine and oxcarbazepine). For these drugs, physicians might choose not to switch to a generic version because of safety concerns. Yet, they might choose to start new therapies using generic versions.
About one third of the total amount of reference supplements in 2008 concerned the prescription of cardiovascular drugs. A possible explanation could be that physicians are reluctant to prescribe (or switch to) a generic or other low cost alternative for this type of illness because they question the comparability of therapeutic effects. A recent meta-analysis comparing clinical characteristics of generic and brand-name drugs in cardiovascular medicine revealed that, no important clinical differences between generic and brand name drugs exist. Although these results are reassuring, half of the editorials expressed a negative view on interchangeability of generic drugs.
viii The reference price system KCE reports 126C
RECOMMENDATIONS Although results are encouraging in terms of overall financial accessibility, the €60 million paid on reference supplements in 2008 is not a negligible amount. Especially in case of chronic use, the reference supplements could add up to a considerable sum. Different measures could be envisaged by decision makers to further reduce this amount:
• For prescribers:
A targeted increase of the low cost prescription quota in consultation with the National Commission Physicians-Sickness funds. These quota were set in 2005 and were not revised since then.
Further stimulate INN prescription, which insures that patients receive a low cost version of the drug, if there is one available on the market.
• For pharmacists:
Allow substitution right, unless explicitly prohibited by the prescriber, as foreseen by the Belgian legislator in 1993, and already implemented in all countries included the international comparison.
• For patients:
Increase patient’s awareness of the reference supplement, by providing at the moment that the pharmaceutical is delivered, clear information on the amount and type of supplement paid.
Recommendation linked to the structure of the system:
• Reference Price
Belgium is unique in applying a fixed percentage of the originator product to calculate reference prices. Savings for the NIHIDI and patients might be larger by setting the reference price with respect to the price of all low cost drugs within a cluster (including generic products as well as original brands that lowered their price).
Agenda for research on the scope of the RPS
• Explore a stepwise extension of the Level 1 reference price system to a Level 2 or 3 RPS, including careful monitoring of health risks and adverse effects on financial accessibility.
KCE Reports 126 Reference Price System 1
Scientific summary Table of contents
LIST OF ABRREVIATIONS ...................................................................................................... 3
1 INTRODUCTION AND RESEARCH QUESTIONS .................................................... 7 1.1 BACKGROUND ........................................................................................................................................... 7 1.2 RESEARCH QUESTIONS AND SCOPE ................................................................................................. 8 1.3 CONTENT OF THIS REPORT ................................................................................................................. 8
2 INTERNATIONAL COMPARISON OF REFERENCE PRICING ............................... 9 2.1 INTRODUCTION ........................................................................................................................................ 9 2.2 GENERAL DESCRIPTION OF THE REFERENCE PRICE SYSTEM ................................................. 10
2.2.1 Definition ......................................................................................................................................... 10 2.2.2 General characteristics of a reference price system .............................................................. 11
2.3 OVERVIEW OF THE REFERENCE PRICE SYSTEM IN A SELECTION OF 11 OECD COUNTRIES ................................................................................................................................................ 13 2.3.1 Methods ............................................................................................................................................ 13 2.3.2 Definition and scope of the cluster ............................................................................................ 14 2.3.3 The reference price level .............................................................................................................. 16 2.3.4 Measures for physicians, pharmacists and patients ................................................................. 16
2.4 DESCRIPTION OF THE BELGIAN REFERENCE PRICE SYSTEM .................................................. 18 2.4.1 Evolution of the legal basis of the RPS ....................................................................................... 19 2.4.2 Definition and scope of the cluster ............................................................................................ 21 2.4.3 The reference price level .............................................................................................................. 21 2.4.4 The security margin ....................................................................................................................... 23 2.4.5 Exemptions ...................................................................................................................................... 23 2.4.6 Measures for physicians, pharmacists and patients ................................................................. 23
3 IMPACT OF THE REFERENCE PRICE SYSTEM: A LITERATURE REVIEW ....... 28 3.1 INTRODUCTION ...................................................................................................................................... 28 3.2 METHODS ................................................................................................................................................... 28 3.3 RESULTS ....................................................................................................................................................... 29
3.3.1 Search strategy and study selection of the review studies on the impact of a RPS ......... 29 3.3.2 Association of the RPS with drug use ........................................................................................ 30 3.3.3 Association of the RPS with drug prices ................................................................................... 30 3.3.4 Association of the RPS with drug expenditures ...................................................................... 30 3.3.5 Association of the RPS with health services use and health ................................................. 31
4 RESULTS FROM THE ANALYSIS OF BELGIAN PRESCRIPTION DATA IN 2008 .......................................................................................................................................... 32
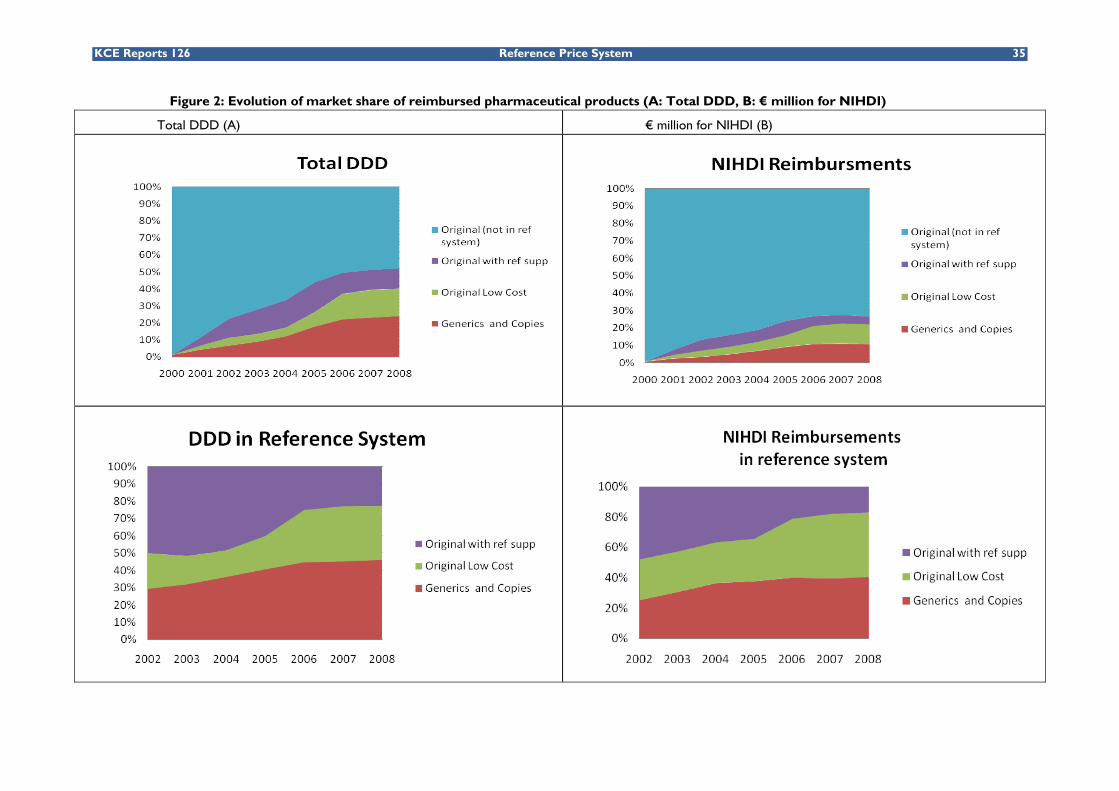
4.1 INTRODUCTION ...................................................................................................................................... 32 4.2 THE BELGIAN PHARMACEUTICAL MARKET: EVOLUTION OF MARKET SHARES AND
OUT-OF-POCKET PAYMENTS ............................................................................................................. 33 4.2.1 Evolution of market shares .......................................................................................................... 33 4.2.2 The reference supplement in 2008 ............................................................................................. 36
4.3 IMPACT OF THE REFERENCE PRICE SYSTEM IN BELGIUM: LITERATURE REVIEW ............ 39 4.3.1 Market share of low cost drugs .................................................................................................. 39 4.3.2 Expenditures for the NIHDI and for patients .......................................................................... 39 4.3.3 Potential gains from the increasing use of low cost drugs .................................................... 39 4.3.4 Strategies by pharmaceutical firms ............................................................................................. 40
4.4 METHODS ................................................................................................................................................... 40 4.4.1 Data sources ................................................................................................................................... 40 4.4.2 Time period ..................................................................................................................................... 41 4.4.3 Selection of data (sampling procedure) ..................................................................................... 41
2 Reference Price System KCE reports 126
4.4.4 Coupling procedure and authorisation from the Privacy Commission .............................. 41 4.4.5 Selection and construction of socioeconomic variables ........................................................ 41 4.4.6 Selection of patients and of pharmaceutical products ............................................................ 43 4.4.7 Statistical analyses .......................................................................................................................... 45
4.5 RESULTS ....................................................................................................................................................... 46 4.5.1 Selection of prescribers and patients ......................................................................................... 46 4.5.2 Choice between high price/low cost drugs .............................................................................. 46 4.5.3 Socioeconomic characteristics of patients or physicians and therapeutic reference pricing: evidence in the literature ............................................................................................................ 57 4.5.4 Choice of a less costly active ingredient within a class .......................................................... 58 4.5.5 Appraisal of results: barriers to low cost drugs ...................................................................... 62
5 SUMMARY, CONCLUSION AND DISCUSSION ..................................................... 63
LIST OF ABRREVIATIONS ACE Angiotensin-Converting Enzyme (inhibitors)
ATC Anatomical Therapeutic Chemical
BCFI Belgisch Centrum voor Farmacotherapeutische Informatie
CBIP Centre Belge d'Information Pharmacothérapeutique
CI Confidence Interval
CNMM Commission Nationale Médico-Mutualiste
CRM Commission de Remboursement des Médicaments
CTG Commissie Tegemoetkoming Geneesmiddelen
DDD Defined Daily Dose
DRC Drug Reimbursement Committee
EMEA European Medicines Agency
EU European Union
GEE Generalized Estimating Equations
GMR Global Medical Record
GP General Practitioner
ICD International Common Denomination
ISCED International Standard Classification of Education
IMA Intermutualistic Agency
INAMI Institut National d'Assurance Maladie et Invalidité
INN International Nonproprietary Name
MM Maison Médicale
MR Maison de repos (Rest or nursing home for the elderly)
NCAZ Nationale Commissie Arsten-Ziekenfondsen
NCPS National Convention between Physicians and Sickness funds
NIHDI National Institute for Health and Disability Insurance
NLM National Library of Medicine
NSAID Non-Steroidal Anti-Inflammatory Drug
NUTS Nomenclature of Territorial Units for Statistics
OECD Organisation for Economic Co-operation and Development
PPRI Pharmaceutical Pricing and Reimbursement Information
RD Royal Decree
RIZIV Rijksinstituut voor Ziekte- en InvaliditeitsVerzekering
RP Reference Pricing
RPS Reference Price System
SS Statistical Sector
SSRI Selective Serotonin Reuptake Inhibitor
VAT Value Added Tax
WG WijkGezondheidscentrum
WHO World Health Organization
4 Reference Price System KCE reports 126
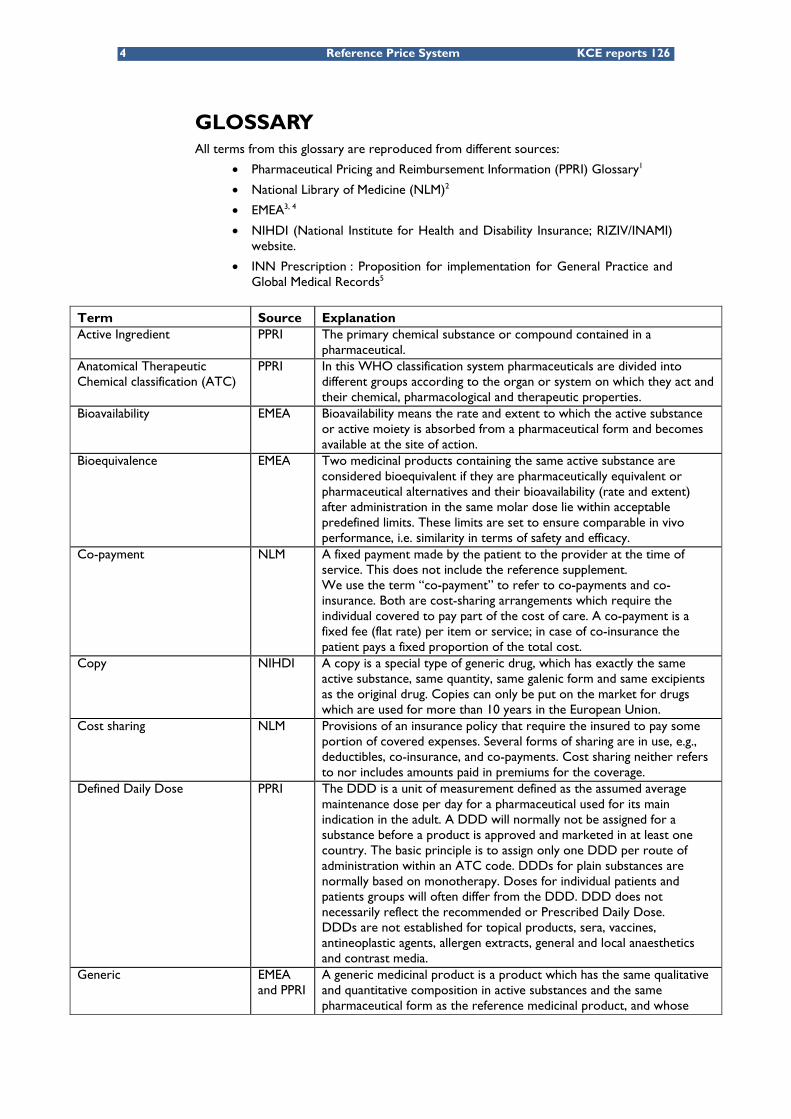
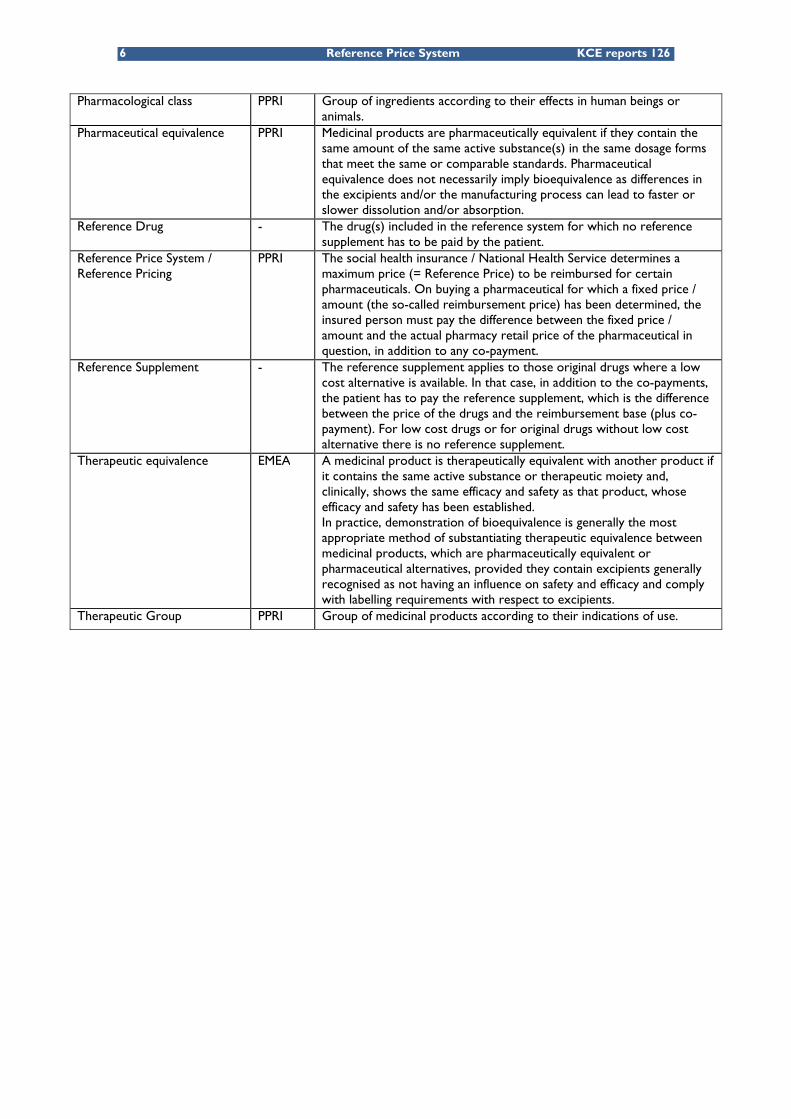
GLOSSARY All terms from this glossary are reproduced from different sources:
• Pharmaceutical Pricing and Reimbursement Information (PPRI) Glossary1
• National Library of Medicine (NLM)2
• EMEA3, 4
• NIHDI (National Institute for Health and Disability Insurance; RIZIV/INAMI) website.
• INN Prescription : Proposition for implementation for General Practice and Global Medical Records5
Term Source Explanation Active Ingredient PPRI The primary chemical substance or compound contained in a
pharmaceutical. Anatomical Therapeutic Chemical classification (ATC)
PPRI In this WHO classification system pharmaceuticals are divided into different groups according to the organ or system on which they act and their chemical, pharmacological and therapeutic properties.
Bioavailability EMEA Bioavailability means the rate and extent to which the active substance or active moiety is absorbed from a pharmaceutical form and becomes available at the site of action.
Bioequivalence EMEA Two medicinal products containing the same active substance are considered bioequivalent if they are pharmaceutically equivalent or pharmaceutical alternatives and their bioavailability (rate and extent) after administration in the same molar dose lie within acceptable predefined limits. These limits are set to ensure comparable in vivo performance, i.e. similarity in terms of safety and efficacy.
Co-payment NLM A fixed payment made by the patient to the provider at the time of service. This does not include the reference supplement. We use the term “co-payment” to refer to co-payments and co-insurance. Both are cost-sharing arrangements which require the individual covered to pay part of the cost of care. A co-payment is a fixed fee (flat rate) per item or service; in case of co-insurance the patient pays a fixed proportion of the total cost.
Copy NIHDI A copy is a special type of generic drug, which has exactly the same active substance, same quantity, same galenic form and same excipients as the original drug. Copies can only be put on the market for drugs which are used for more than 10 years in the European Union.
Cost sharing NLM Provisions of an insurance policy that require the insured to pay some portion of covered expenses. Several forms of sharing are in use, e.g., deductibles, co-insurance, and co-payments. Cost sharing neither refers to nor includes amounts paid in premiums for the coverage.
Defined Daily Dose PPRI The DDD is a unit of measurement defined as the assumed average maintenance dose per day for a pharmaceutical used for its main indication in the adult. A DDD will normally not be assigned for a substance before a product is approved and marketed in at least one country. The basic principle is to assign only one DDD per route of administration within an ATC code. DDDs for plain substances are normally based on monotherapy. Doses for individual patients and patients groups will often differ from the DDD. DDD does not necessarily reflect the recommended or Prescribed Daily Dose. DDDs are not established for topical products, sera, vaccines, antineoplastic agents, allergen extracts, general and local anaesthetics and contrast media.
Generic EMEA and PPRI
A generic medicinal product is a product which has the same qualitative and quantitative composition in active substances and the same pharmaceutical form as the reference medicinal product, and whose
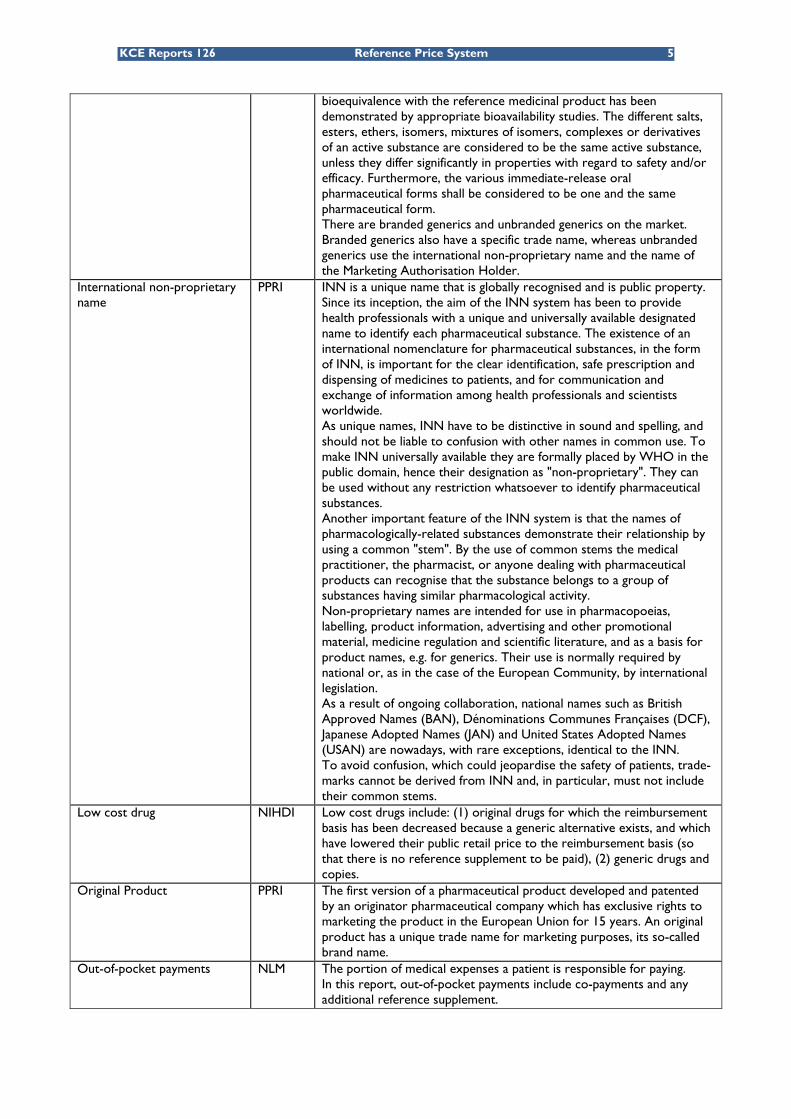
KCE Reports 126 Reference Price System 5
bioequivalence with the reference medicinal product has been demonstrated by appropriate bioavailability studies. The different salts, esters, ethers, isomers, mixtures of isomers, complexes or derivatives of an active substance are considered to be the same active substance, unless they differ significantly in properties with regard to safety and/or efficacy. Furthermore, the various immediate-release oral pharmaceutical forms shall be considered to be one and the same pharmaceutical form. There are branded generics and unbranded generics on the market. Branded generics also have a specific trade name, whereas unbranded generics use the international non-proprietary name and the name of the Marketing Authorisation Holder.
International non-proprietary name
PPRI INN is a unique name that is globally recognised and is public property. Since its inception, the aim of the INN system has been to provide health professionals with a unique and universally available designated name to identify each pharmaceutical substance. The existence of an international nomenclature for pharmaceutical substances, in the form of INN, is important for the clear identification, safe prescription and dispensing of medicines to patients, and for communication and exchange of information among health professionals and scientists worldwide. As unique names, INN have to be distinctive in sound and spelling, and should not be liable to confusion with other names in common use. To make INN universally available they are formally placed by WHO in the public domain, hence their designation as "non-proprietary". They can be used without any restriction whatsoever to identify pharmaceutical substances. Another important feature of the INN system is that the names of pharmacologically-related substances demonstrate their relationship by using a common "stem". By the use of common stems the medical practitioner, the pharmacist, or anyone dealing with pharmaceutical products can recognise that the substance belongs to a group of substances having similar pharmacological activity. Non-proprietary names are intended for use in pharmacopoeias, labelling, product information, advertising and other promotional material, medicine regulation and scientific literature, and as a basis for product names, e.g. for generics. Their use is normally required by national or, as in the case of the European Community, by international legislation. As a result of ongoing collaboration, national names such as British Approved Names (BAN), Dénominations Communes Françaises (DCF), Japanese Adopted Names (JAN) and United States Adopted Names (USAN) are nowadays, with rare exceptions, identical to the INN. To avoid confusion, which could jeopardise the safety of patients, trade-marks cannot be derived from INN and, in particular, must not include their common stems.
Low cost drug NIHDI Low cost drugs include: (1) original drugs for which the reimbursement basis has been decreased because a generic alternative exists, and which have lowered their public retail price to the reimbursement basis (so that there is no reference supplement to be paid), (2) generic drugs and copies.
Original Product PPRI The first version of a pharmaceutical product developed and patented by an originator pharmaceutical company which has exclusive rights to marketing the product in the European Union for 15 years. An original product has a unique trade name for marketing purposes, its so-called brand name.
Out-of-pocket payments NLM The portion of medical expenses a patient is responsible for paying. In this report, out-of-pocket payments include co-payments and any additional reference supplement.
6 Reference Price System KCE reports 126
Pharmacological class PPRI Group of ingredients according to their effects in human beings or animals.
Pharmaceutical equivalence PPRI Medicinal products are pharmaceutically equivalent if they contain the same amount of the same active substance(s) in the same dosage forms that meet the same or comparable standards. Pharmaceutical equivalence does not necessarily imply bioequivalence as differences in the excipients and/or the manufacturing process can lead to faster or slower dissolution and/or absorption.
Reference Drug - The drug(s) included in the reference system for which no reference supplement has to be paid by the patient.
Reference Price System / Reference Pricing
PPRI The social health insurance / National Health Service determines a maximum price (= Reference Price) to be reimbursed for certain pharmaceuticals. On buying a pharmaceutical for which a fixed price / amount (the so-called reimbursement price) has been determined, the insured person must pay the difference between the fixed price / amount and the actual pharmacy retail price of the pharmaceutical in question, in addition to any co-payment.
Reference Supplement - The reference supplement applies to those original drugs where a low cost alternative is available. In that case, in addition to the co-payments, the patient has to pay the reference supplement, which is the difference between the price of the drugs and the reimbursement base (plus co-payment). For low cost drugs or for original drugs without low cost alternative there is no reference supplement.
Therapeutic equivalence EMEA A medicinal product is therapeutically equivalent with another product if it contains the same active substance or therapeutic moiety and, clinically, shows the same efficacy and safety as that product, whose efficacy and safety has been established. In practice, demonstration of bioequivalence is generally the most appropriate method of substantiating therapeutic equivalence between medicinal products, which are pharmaceutically equivalent or pharmaceutical alternatives, provided they contain excipients generally recognised as not having an influence on safety and efficacy and comply with labelling requirements with respect to excipients.
Therapeutic Group PPRI Group of medicinal products according to their indications of use.
KCE Reports 126 Reference Price System 7
1 INTRODUCTION AND RESEARCH QUESTIONS
1.1 BACKGROUND Public expenditure for reimbursed drugs rapidly increased during the nineties in Belgium. While total spending on health care grew at an annual rate of 5.1% between 1990 and 2000, pharmaceutical expenses increased by an average of 7.5%. In 2000, pharmaceuticals accounted for 17.5% of public health care expenditure against 14.6% in 1990.6 In recent years, many budgetary measures have been taken in order to curb drug expenses for the National Institute for Health and Disability Insurance (NIHDI), the Belgian third-party payer. However, reimbursement of pharmaceuticals remains one of the main items of the Belgian health care budget. In 2008, the budget of reimbursed pharmaceuticals was €3 750.845 million, accounting for 18.12% of total reimbursements for health care services by NIHDI. In 2010, the planned budget of reimbursed pharmaceuticals is 16.2% of the total health care budget.7, 8
One of the measures to control expenditures on pharmaceuticals was the introduction of the reference price system (RPS) by the Belgian Ministry of Social Affairs on June 1, 2001. Contrary to what the term may suggest, the purpose of the RPS is not to regulate pharmaceutical prices. The RPS limits the reimbursement of drugs by establishing a maximum level of reimbursement for a group of pharmaceutical products. In a RPS, any difference between the reference price and the price of a more costly drug has to be paid by the patient, in addition to any co-payment(s). This extra patient cost is usually referred to as the “reference supplement”. Lopez-Casanovas et al. point out that the RPS aims at controlling drug expenditures for the third-party payer by 1) making consumers and physicians more sensitive to the relative prices of drugs, thus choosing low-cost alternatives and 2) stimulating price competition in pharmaceuticals markets.9
This type of regulation has been adopted by almost all European countries. However, the way in which the RPS is implemented varies across countries, especially in terms of criteria used for creating pharmaceuticals groups (based on chemical, pharmacological or therapeutic equivalence), settings for the reference price, measures for patients, physicians or pharmacists and exemptions on specific drug consumption.
In theory, reference pricing rests on the assumption that all patients are fully aware of the existence and the consequences of such system and that all patients will make rational choices about which drugs to use. In practice, the choice of drugs depends on interactions between the prescriber, the patient and the pharmacist. In the literature, patients’ non-adherence to the RPS has been linked to9: disagreement with the cost opportunity to change drugs (e.g. generic substitution), drug substitution possibilities without risk for the patient, poor physician-patient relationship, incentives for patients and physicians to choose the cheapest drugs, information provided to patients and patient demographic and socioeconomic characteristics (age, education level and income).
A RPS is a typical example of a selective cost sharing design which is intended to provide patients with monetary incentives to alter their consumption behaviour. The financial incentive and the initiative are shifted from the provider to the demand side. Such measures expose patients to the financial consequences of their choice. From a social point of view, equity problems might arise from the RPS if some socioeconomic groups, in particular the weakest groups in society (the poor and those with chronic diseases), are more affected by non-adherence (voluntarily or not). Non-adherence might affect individuals’ out-of-pocket payments, drugs utilisation and health outcomes.10
Unfortunately, few studies have directly assessed the impact on financial accessibility of reference pricing. This report provides new evidence on the distributional effects of the reference price system in Belgium. If this assessment of the current RPS in Belgium demonstrates unintended distributional effects, the study may contribute to adjustments to the current system which correct for these effects.
8 Reference Price System KCE reports 126
1.2 RESEARCH QUESTIONS AND SCOPE Three research questions were addressed in this report:
1. How is the reference price system implemented in Belgium, and how can it be compared to reference pricing organized in some selected countries (Denmark, France, Germany, Hungary, Italy, the Netherlands, Portugal, Spain, Australia, New Zealand and British Columbia)?
2. Is there evidence of socioeconomic differences associated with the use of low cost drugs in the literature and in Belgian physician prescribing data? If so, what are these differences associated with (e.g. lack of information, attitude, expectations) and what is the impact on patient costs?
3. If such evidence is found in Belgium, what measures can be taken to avoid these differences?
The scope of the study is limited to the system of reference pricing. Of course, reference pricing is closely related to and is often introduced along with other pharmaceutical pricing and reimbursement policies. For instance, although reference pricing not only aims at stimulating the prescription of generic drugs but also that of other low cost drugs, it can be catalogued as a measure which promotes the use of generic drugs. However, other policies introduced to promote the use of generic drugs, such as lower registration fees, are not considered here. Also measures such as direct price or expenditure controls or positive and negative lists are not considered, unless they are part of the reference price system.
1.3 CONTENT OF THIS REPORT This report is organised as follows.
Chapter 2 presents a general overview of the main characteristics of the reference price system, and compares it across the selected countries: Denmark, France, Germany, Hungary, Italy, Spain, The Netherlands, Portugal, Australia, New Zealand and British Columbia in Canada. The Belgian RPS is then described and compared to these countries. The broad selection of countries was made in order to offer a diversified point of view of the RPS across OECD countries. We limit our comparison to:
1. The scope of the RPS: Which drugs are included? How are they grouped?
2. The reference price: How is it fixed?
3. Are there exemptions, and how are they determined?
4. Which measures are taken for physicians, pharmacists and patients to encourage the use of low cost drugs?
Chapter 3 gives an overview of the literature on the impact of a RPS in terms of drug use, health outcomes and costs (reimbursements and out-of-pocket payments for patients). We also examine the relationship between these outcomes in function of patient characteristics (health, socioeconomic status) and physician characteristics (sex and age).
Chapter 4 presents results from the analysis of Belgian physician prescribing data in 2008.
Chapter 5 contains the conclusions, limitations and discussion of the study.
KCE Reports 126 Reference Price System 9
2 INTERNATIONAL COMPARISON OF REFERENCE PRICING
2.1 INTRODUCTION The purpose of this chapter is to describe the reference price system in twelve OECD countries (out of 30): Belgium, Denmark, France, Germany, Hungary, Italy, Spain, The Netherlands, Portugal, Australia, New Zealand and British Columbia (Canada). The selected countries provide a wide perspective on differences and similarities in the settings of the RPS. Some OECD countries with a RPS (such as Greece or Poland) were not selected because information was sparse or no validation could be performed. Some countries not belonging to the OECD have also implemented a RPS, for example South Africa 11,Taiwan 12 and some new EU member states such as Slovenia, Estonia, Latvia, Lithuania, Bulgaria and Romania.
Figure 1 presents all EU member states (+ Norway and Turkey) using a RPS.
Figure 1: The RPS in EU member states, Norway and Turkey
Source: PPRI, updated in 2009
It is interesting to note that seven EU member states did not implement (Ireland, the United Kingdom, Austria, Luxembourg, Cyprus and Malta) or abandoned (Sweden) a reference price system. Sweden abolished its reference price system in 2002 but implemented a system of obligatory generic substitution in which substitutable pharmaceuticals are clustered, and where prices not exceeding the highest price within such a group are automatically accepted for reimbursement.1 Although the United Kingdom did not implement a RPS, the Department of Health has for long fostered generic prescription measures. The combination of widespread computerized prescribing systems and the existence of incentives to pharmacists to dispense low cost drugs whenever they can has achieved most of the benefits of reference pricing by different means.13 Ireland has the intention to introduce a system of reference pricing in the course of 2010, as stated by the Minister for Health and Children.14
10 Reference Price System KCE reports 126
The general characteristics of a RPS are described in section 2.2. The description specific to each of the 11 countries is given in section 2.3. Finally, section 2.4 presents a detailed overview of the RPS in Belgium.
2.2 GENERAL DESCRIPTION OF THE REFERENCE PRICE SYSTEM
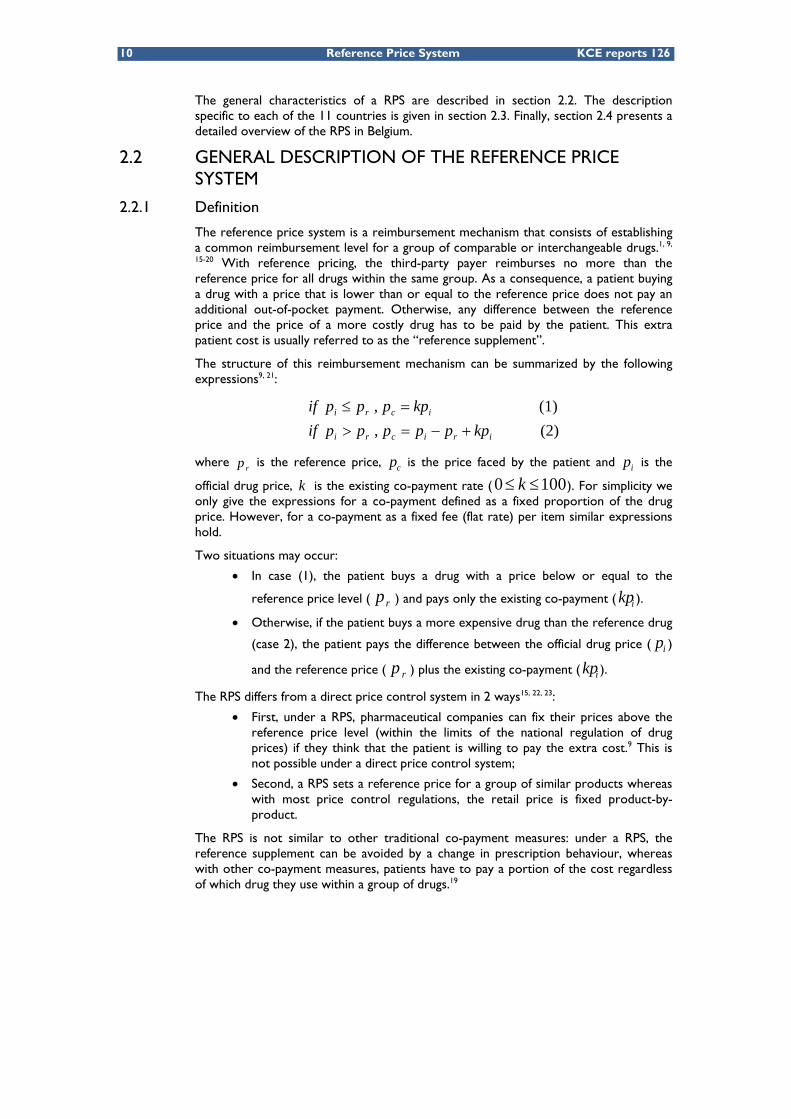
2.2.1 Definition
The reference price system is a reimbursement mechanism that consists of establishing a common reimbursement level for a group of comparable or interchangeable drugs.1, 9,
15-20 With reference pricing, the third-party payer reimburses no more than the reference price for all drugs within the same group. As a consequence, a patient buying a drug with a price that is lower than or equal to the reference price does not pay an additional out-of-pocket payment. Otherwise, any difference between the reference price and the price of a more costly drug has to be paid by the patient. This extra patient cost is usually referred to as the “reference supplement”.
The structure of this reimbursement mechanism can be summarized by the following expressions9, 21:
(2) , (1) ,
iricri
icri
kppppppifkppppif
+−=>=≤
where rp is the reference price, cp is the price faced by the patient and ip is the
official drug price, k is the existing co-payment rate ( 1000 ≤≤ k ). For simplicity we only give the expressions for a co-payment defined as a fixed proportion of the drug price. However, for a co-payment as a fixed fee (flat rate) per item similar expressions hold.
Two situations may occur:
• In case (1), the patient buys a drug with a price below or equal to the
reference price level ( rp ) and pays only the existing co-payment ( ikp ).
• Otherwise, if the patient buys a more expensive drug than the reference drug
(case 2), the patient pays the difference between the official drug price ( ip )
and the reference price ( rp ) plus the existing co-payment ( ikp ).
The RPS differs from a direct price control system in 2 ways15, 22, 23:
• First, under a RPS, pharmaceutical companies can fix their prices above the reference price level (within the limits of the national regulation of drug prices) if they think that the patient is willing to pay the extra cost.9 This is not possible under a direct price control system;
• Second, a RPS sets a reference price for a group of similar products whereas with most price control regulations, the retail price is fixed product-by-product.
The RPS is not similar to other traditional co-payment measures: under a RPS, the reference supplement can be avoided by a change in prescription behaviour, whereas with other co-payment measures, patients have to pay a portion of the cost regardless of which drug they use within a group of drugs.19
KCE Reports 126 Reference Price System 11
2.2.2 General characteristics of a reference price system
This section presents in detail four basic characteristics of any RPS:
1. The scope of the RPS: Which drugs are included? How are they grouped?
2. The reference price: How is it fixed?
3. Are there exemptions, and how are they determined?
4. Which measures are taken for physicians, pharmacists and patients to encourage the use of low cost drugs?
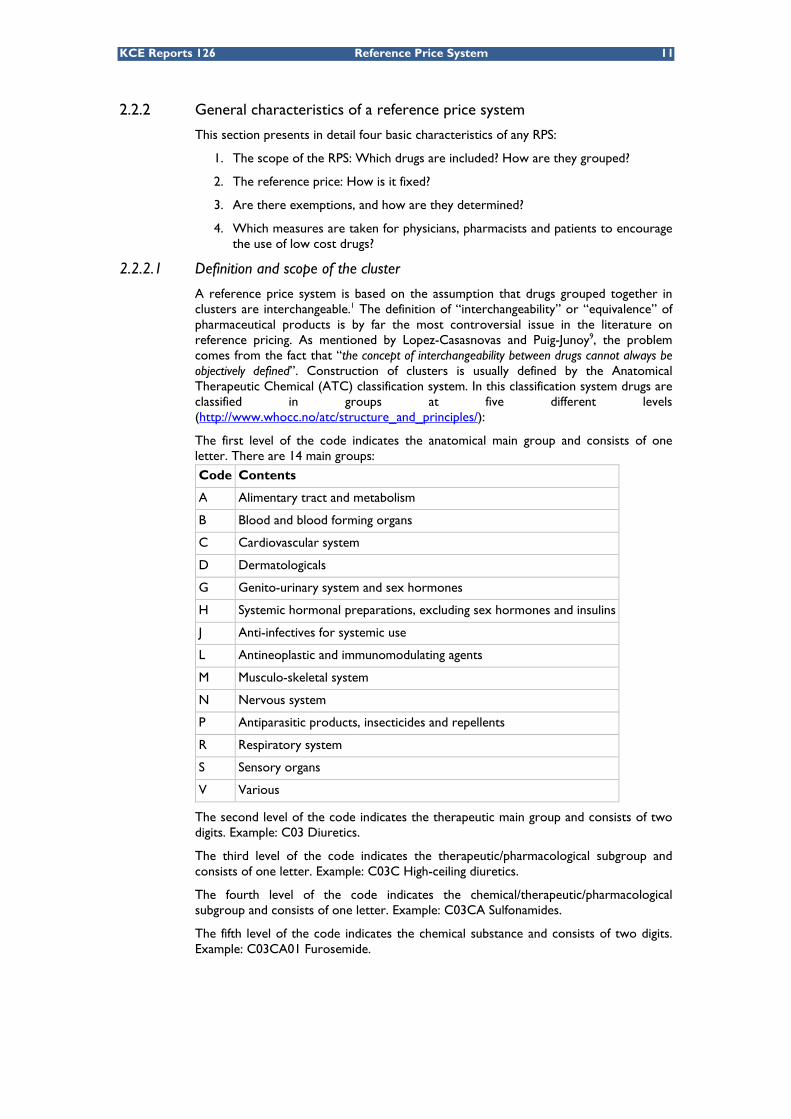
2.2.2.1 Definition and scope of the cluster
A reference price system is based on the assumption that drugs grouped together in clusters are interchangeable.1 The definition of “interchangeability” or “equivalence” of pharmaceutical products is by far the most controversial issue in the literature on reference pricing. As mentioned by Lopez-Casasnovas and Puig-Junoy9, the problem comes from the fact that “the concept of interchangeability between drugs cannot always be objectively defined”. Construction of clusters is usually defined by the Anatomical Therapeutic Chemical (ATC) classification system. In this classification system drugs are classified in groups at five different levels (http://www.whocc.no/atc/structure_and_principles/):
The first level of the code indicates the anatomical main group and consists of one letter. There are 14 main groups:
Code Contents
A Alimentary tract and metabolism
B Blood and blood forming organs
C Cardiovascular system
D Dermatologicals
G Genito-urinary system and sex hormones
H Systemic hormonal preparations, excluding sex hormones and insulins
J Anti-infectives for systemic use
L Antineoplastic and immunomodulating agents
M Musculo-skeletal system
N Nervous system
P Antiparasitic products, insecticides and repellents
R Respiratory system
S Sensory organs
V Various
The second level of the code indicates the therapeutic main group and consists of two digits. Example: C03 Diuretics.
The third level of the code indicates the therapeutic/pharmacological subgroup and consists of one letter. Example: C03C High-ceiling diuretics.
The fourth level of the code indicates the chemical/therapeutic/pharmacological subgroup and consists of one letter. Example: C03CA Sulfonamides.
The fifth level of the code indicates the chemical substance and consists of two digits. Example: C03CA01 Furosemide.
12 Reference Price System KCE reports 126
However, although the clustering is based on the ATC classification, this does not imply that all drugs with the same ATC level will be part of a cluster or group. Three types of clusters are defined for RPS. Brekke et al.24 use the following definition:
“These clusters may be narrowly or broadly defined: (i) products with the same active chemical ingredients, (ii) products with chemically related active ingredients that are pharmacologically equivalent, and (iii) products that may be neither chemically identical nor pharmacologically equivalent but have comparable therapeutic effects.”
The broader the definition of a cluster, the higher the number of drugs for which the RPS applies.
For this report and to ease the interpretation and comparison of the RPS between countries, clusters at different levels are addressed as:
• Level 1 RPS: for clusters with the same active chemical ingredients. At this level (chemical substance ATC-5) clusters can sometimes contain only pharmaceuticals with the same dosage form and using the same administration route (thus they are pharmaceutically equivalent). In general, these clusters contain off-patent original drugs and their generic substitutes. Level 1 RPS is often characterized as a “generic reference price system” or “generic referencing”.24
• Level 2 RPS: for products with chemically related active ingredients that are pharmacologically equivalent. At this level, on-patent drugs may be included or excluded and drugs usually belong to the same chemical subgroup, thus to the ATC-4 classification level.
• Level 3 RPS: At the third level, each cluster contains drugs used to treat a particular condition. In this group, drugs are not necessarily chemically identical or pharmacologically equivalent, but have a comparable therapeutic effect (ATC-3 classification level).
Level 2 and 3 are generally referred to as “therapeutic reference pricing”.24
2.2.2.2 The reference price level
Once drugs are classified into groups, a reference price level (usually a fixed maximum reimbursement price) is set out for all drugs within each cluster. Different methods are used to calculate the reference price (see section 2.4.3 for a detailed description per country). The reference price level is frequently updated by the national entitled authority. The frequency of revisions varies across countries and between groups. Usually, the updating of the reference prices is less regular in the therapeutic reference price system due to high revision costs (more administration costs, time costs for physicians and patients to remain informed) since more drugs belong to the clusters.17 These revisions may concern the reference prices as well as the reference groups.1
2.2.2.3 Exemptions
In practice, most countries introduced specific mechanisms to allow for exemptions to the RPS. For medical reasons (e.g. side-effects) patients can buy “non reference drugs” (with a higher price) without paying the reference supplement.25, 26 For instance, in British Columbia, individuals considered as "frail elderly patients" are exempted from the reference supplement.27 If the RPS is based on Level 2 or Level 3, some exemptions can also be introduced for innovative drugs in order to recognise their ‘added value’.
KCE Reports 126 Reference Price System 13
2.2.2.4 Measures for physicians, pharmacists and patients
Basically, the RPS creates a financial penalty (i.e. the reference supplement) for patients who take the original drug for which the price is not reduced. However, one peculiarity of the pharmaceutical market is that the demand for pharmaceutical specialties is not determined solely by patients but instead jointly by different agents: patients, prescribers, and to a lesser extent pharmacists. As a result, influencing the demand side requires changing those three agents’ behavior.9, 22
Measures aimed at physicians’ behaviour can take the following forms:
• Clinical practice guidelines and/or prescriptions guidelines
• Education and information methods
• Monitoring of prescribing patterns
• Establishment of prescription quotas
• In addition, financial incentives (or penalties) can be used to reinforce the behavioural changes among prescribers.
With regard to pharmacists’ behaviour, some countries have entitled them with a generic substitution right. In other words, the pharmacist is allowed to dispense a cheaper and similar reimbursable pharmaceutical than the one prescribed by the physician. Financial incentives for pharmacists aim at correcting for possible income losses relating to dispensing cheap drugs.
For patients, financial incentives (penalties) are related to the reference supplement.
For all actors mentioned above, information campaigns can also be used to reduce imperfect information on the RPS.
2.3 OVERVIEW OF THE REFERENCE PRICE SYSTEM IN A SELECTION OF 11 OECD COUNTRIES In this section, we focus on the description of the RPS in a selection of 11 countries: Denmark, France, Germany, Hungary, Italy, Portugal, Spain, The Netherlands, Australia, New Zealand and British Columbia (Canada).
Section 2.3 follows the same structure as the previous section: we first discuss the criteria used for defining groups. Next, methods for setting the reference price are described. Finally, measures for physicians, pharmacists and patients to increase adherence to the RPS are reviewed.
2.3.1 Methods
The purpose of this literature review was to identify and learn from the experience of a broad selection of countries with respect to their RPS. No systematic literature review was performed. We limited our search to internet and databases such as PubMed and Econlit using the following keywords: “reference pricing” OR “reference price” OR “reference ADJ2 price” OR “reference based price”, in combination with the name of the country. Grey literature was also included.1, 28 Finally, articles not providing information on the definition of the cluster or the reference price were not included. The most reliable and recent source of information was selected (i.e. the official sources) if any contradictory findings were encountered.1, 28
Data collected through this review was summarized for each country. Each summary was submitted to national experts for validation. All experts have updated and revised the description of their respective country. The list of national expert can be found in Appendix.
14 Reference Price System KCE reports 126
2.3.2 Definition and scope of the cluster
As mentioned in section 2.2.2.1, clusters of drugs in the reference price system are set at three levels. In addition to these first criteria, each country may add restrictions to the drugs included in the different clusters independently of the ATC classification.
The countries selected in this review were classified in three categories according to how clusters were formed:
• Countries using the Level 1 equivalence criteria were classified in the first category. Countries belonging to this category are Denmark, France, Portugal and Spain.
• In the second category, countries using Level 2 equivalence criteria were included. This was the case for New Zealand, Australia and the Netherlands.
• Clusters in the RPS can also be defined as a combination of the levels mentioned above. Countries using multi-level criteria to form clusters were included in the third category. This is the case for British Columbia, Germany, Italy and Hungary.
Table 1 summarizes the following information for the selected countries: year of introduction of the RPS, criteria for grouping drugs and the corresponding level(s) and the ATC-level used for clustering. More detailed information on all of those items can be found in Appendix.
KCE Reports 126 Reference Price System 15
Table 1 : Criteria used for setting the scope of the reference price system Country and
Year of introduction
Criteria for grouping drugs RPS Level ATC Level used for
clustering Countries with a Level 1 Reference Price System
Belgium (2001) Drugs that have the same active ingredients if there exists a generic version in this group
Level 1 ATC-5
Denmark (1993) Drugs that have the same active ingredient, form, strength
Level 1 ATC-5
France (2003) For drugs where a generic drug is available, limited to some generic drugs
Level 1 ATC-5
Portugal (2003) Drugs that have the same active ingredient, pharmaceutical form and dosage if there exists a generic version in this group
Level 1 ATC-5
Spain (2000) Drugs that have the same chemical entity, doses and administration route if there exists at least one generic drug in the same homogeneous group
Level 1 ATC-5
Countries with a Level 2 Reference Price System Australia (1990 and 1998)
Level 1: Drugs that have the same active ingredient, pharmaceutical form and dosage if a generic version is available. Level 2: Drugs that are considered to have similar levels of safety and efficacy
Level 1 (1990) and
Level 2 (1998)
ATC-4
The Netherlands (1991)
Drugs are therapeutically interchangeable (similar mechanism of action, similar route of administration, for the same age group, with no significant differences in clinical effects)
Level 2 ATC-4
New Zealand (1992)
Drugs are pooled into (sub) groups with the same or similar therapeutic effect and treating the same or similar conditions
Level 2 ATC-4
Countries with a Multilevel Reference Price System British Columbia (1994 and 1995)
Level 1: Drugs that have the same chemical entity, the same strength and dosage form Level 2: Drugs that are not chemically identical but with pharmacologically and therapeutically comparable active ingredients
Level 1 (1994) and
Level 2 (1995)
ATC-5 ATC-4
Germany (1989,1991, 1992)
Level 1: For drugs that have the same active ingredients Level 2: For drugs with therapeutically and pharmacologically comparable active ingredients Level 3: For drugs with comparable therapeutic effects
Level 1 Level 2 Level 3
ATC-5 ATC-4 ATC-3
Italy (2001,2003) Homogenous groups are defined according to several criteria. This usually corresponds to Level 2 and Level 3 clusters. Level 1 clusters can also be included
Level 1 Level 2 Level 3
ATC-5 ATC-4 ATC-3
Hungary (1993 and 2003)
Level 1: Drugs that have the same active ingredient and form Level 2: Drugs that are related
Level 1 (1993) and
Level 2 (2003)
ATC-5 ATC-4
16 Reference Price System KCE reports 126
2.3.3 The reference price level
A variety of methods exists for determining the reference price level (or reimbursement level). Usually, this is set by reference to the cheapest drug within the cluster (Australia, New Zealand, British Columbia). In some cases, the mean price (France), the average between the lowest two prices in the same class (Denmark), an econometric model (Germany) or a certain percentage over the price of the original drugs (Belgium) are also employed to set the reference price level.17, 28, 29 Table 2 gives an overview of the determinant of the reference price for each country. Countries are grouped per Level. More details are provided in Appendix.
Table 2 : Criteria for setting the reference price in the selected countries Country Determinant of reference price
Countries with a Level 1 Reference Price System Belgium Equal to a percentage (30%) below the price of the originator brand for generic
equivalent products Denmark Equal to the price of the least expensive equivalent generic drug available on the
market France Equal to the average price of generic drugs available within the group Portugal Equal to the price of the highest generic price available on the market Spain Equal to the arithmetic mean of the daily treatment cost of the three cheapest drugs
Countries with a Level 2 Reference Price System Australia Equal to the lowest drugs in each sub-group The Netherlands Equal to the weighted average price of drugs (1999 prices) New Zealand Equal to the historically lowest price in each therapeutic sub-group
Countries with a Multilevel Reference Price System British Columbia Based on the lowest drug price in the same related group Germany Based on an econometric model Italy Calculated as a “cut-off point” on the average daily cost of active substance included
in each cluster. Hungary Based on the lowest price per unit in the ATC5
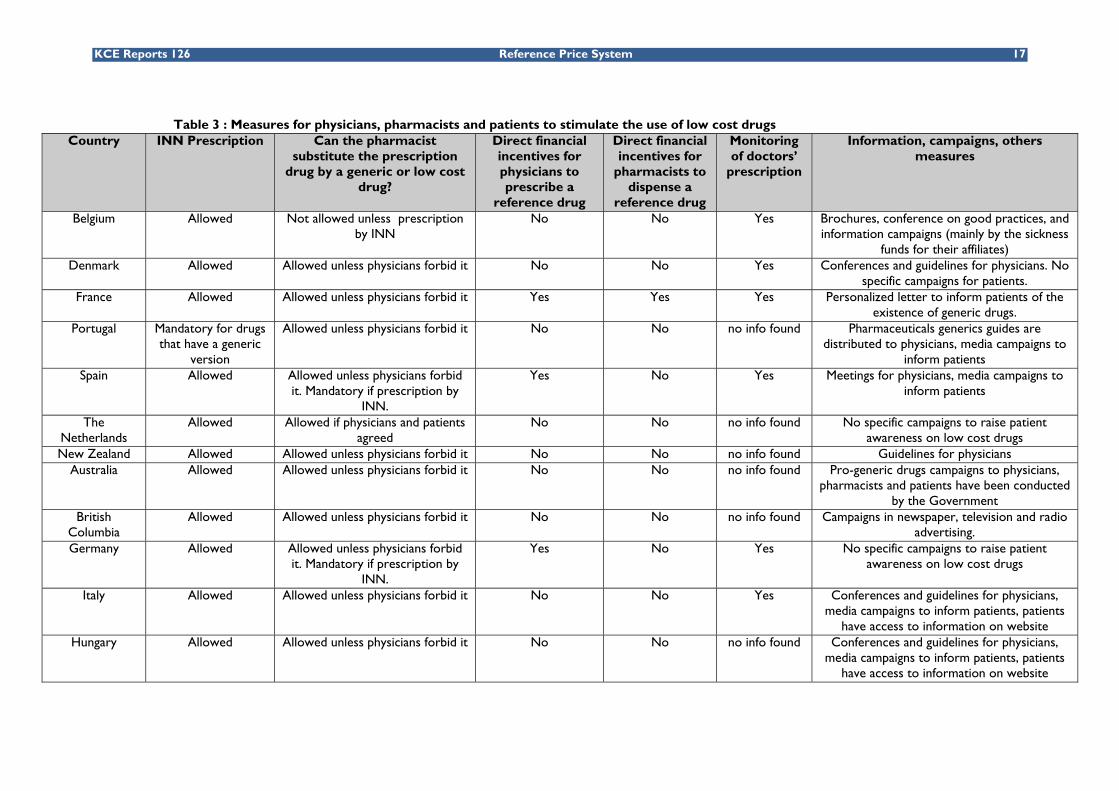
2.3.4 Measures for physicians, pharmacists and patients
Most of the countries that have put in place a RPS have also adopted a mix of measures to stimulate the demand for low cost drugs. These measures targeted on physicians, patients and pharmacists may take various forms: INN prescription, pharmacist substitution of the prescription by a generic or low cost drug, direct financial incentives for physicians to prescribe a reference drug, direct financial incentives for pharmacists to dispense a reference drug, monitoring of doctors’ prescription behaviour, information and campaigns, etc. Table 3 briefly summarizes the measures taken country by country. More details can be found in Appendix. Section 2.3.4 and the appendix are mainly based on the information published by Simoens et al. (2006)20, Vogler et al. (2008)1 and Espin et al. (2007).28
KCE Reports 126 Reference Price System 17
Table 3 : Measures for physicians, pharmacists and patients to stimulate the use of low cost drugs Country INN Prescription Can the pharmacist
substitute the prescription drug by a generic or low cost
drug?
Direct financial incentives for physicians to prescribe a
reference drug
Direct financial incentives for
pharmacists to dispense a
reference drug
Monitoring of doctors’
prescription
Information, campaigns, others measures
Belgium Allowed Not allowed unless prescription by INN
No No Yes Brochures, conference on good practices, and information campaigns (mainly by the sickness
funds for their affiliates) Denmark Allowed Allowed unless physicians forbid it No No Yes Conferences and guidelines for physicians. No
specific campaigns for patients. France Allowed Allowed unless physicians forbid it Yes Yes Yes Personalized letter to inform patients of the
existence of generic drugs. Portugal Mandatory for drugs
that have a generic version
Allowed unless physicians forbid it No No no info found Pharmaceuticals generics guides are distributed to physicians, media campaigns to
Yes No Yes Meetings for physicians, media campaigns to inform patients
The Netherlands
Allowed Allowed if physicians and patients agreed
No No no info found No specific campaigns to raise patient awareness on low cost drugs
New Zealand Allowed Allowed unless physicians forbid it No No no info found Guidelines for physicians Australia Allowed Allowed unless physicians forbid it No No no info found Pro-generic drugs campaigns to physicians,
pharmacists and patients have been conducted by the Government
British Columbia
Allowed Allowed unless physicians forbid it No No no info found Campaigns in newspaper, television and radio advertising.
Germany
Allowed Allowed unless physicians forbid it. Mandatory if prescription by
INN.
Yes No Yes No specific campaigns to raise patient awareness on low cost drugs
Italy Allowed Allowed unless physicians forbid it No No Yes Conferences and guidelines for physicians, media campaigns to inform patients, patients
have access to information on website Hungary Allowed Allowed unless physicians forbid it No No no info found Conferences and guidelines for physicians,
media campaigns to inform patients, patients have access to information on website
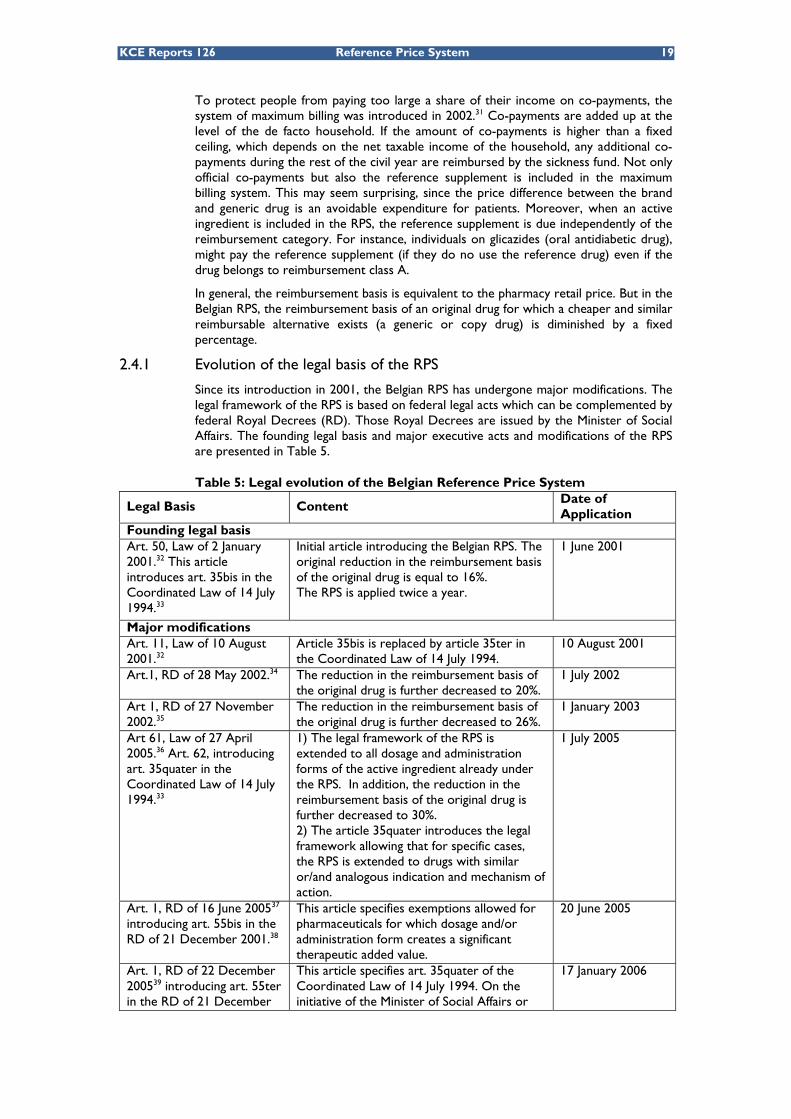
18 Reference Price System KCE reports 126
2.4 DESCRIPTION OF THE BELGIAN REFERENCE PRICE SYSTEM In Belgium, the reference price system was introduced for off-patent reimbursable drugs on June 1, 2001 by the Minister of Social Affairs. The legal bases of the Belgian RPS are articles 35ter and 35quater of the Coordinated Law of July 14, 1994 (prior article 35bisa) and articles 55bis and 55ter of the Royal Decree of December 21, 2001.
The Reference Price System, called the Reference Reimbursement System in Belgium (système de remboursement de reference/ referentieterugbetalingssysteem), has been implemented in accordance with Belgian reimbursement procedures. Pharmaceuticals reimbursement decisions are taken by the Minister of Social Affairs who is advised on these matters by the Drug Reimbursement Committee (DRC or CRM/CTG). In the case of a positive reimbursement decision, the amount of the drug cost born by the third-party payer (the NIHDI) is equal to a certain percentage of the drug reimbursement basis. Percentages are determined by the reimbursement categories (A, B, C, Cs or Cx) which vary with the severity of the diseases (A: drugs for life threatening conditions, such as diabetes; B: therapeutic drugs such as antibiotics; C: drugs acting on symptoms, such as antihistaminic; Cs: vaccines and Cx: some contraceptives). Co-payments also differ between patients with and without preferential reimbursement eligibility. Co-payment percentages are regularly adapted. Table 4 gives the percentages and ceilings applicable since July 1, 2009.
Table 4: Co-payments for ambulatory drugs Reimbursement category
Preferential reimbursement
Non-preferential reimbursement
Category A No co-payment No co-payment Category B 15% with a maximum of
€7.20 25% with a maximum of €10.80
Category B Large package size
15% with a maximum of €8.90 25% with a maximum of €13.50
Category C 50% with a maximum of €8.90 50% with a maximum of €13.50
Category Cs 60% without maximum 60% without maximum Category Cx 80% without maximum 80% without maximum
Source: RIZIV/INAMI30
a « Art 35bis: A partir du 1er avril 2001 et ensuite tous les 6 mois est fixée une nouvelle base de
remboursement pour les spécialités pharmaceutiques visées à l’article 34, alinéa 1er, 5er, c),1. pour autant que soient remboursées d’autres spécialités pharmaceutiques contenant le même principe actif, ayant la même forme d’administration et le même dosage dont la base de remboursement est ou était, au moment de l’admission, inférieure d’au moins 16% compte tenu du nombre d’unités pharmaceutiques par conditionnement. La nouvelle base de remboursement visée …est calculée sur la base d’un prix théorique ex-usine égal au prix actuel ex-usine diminué de 26,7% et majoré ensuite des marges pour la distribution et la délivrance telles qu’elles sont accordées par le ministre qui a les Affaires économiques dans ses attributions et qu’elles sont d’application aux spécialités pharmaceutiques délivrées dans les officines ouvertes au public d’une part et celles délivrées dans une pharmacie hospitalière d’autre part ainsi que du taux actuel de la TVA .
Art. 35bis. “Vanaf 1 april 2001 en vervolgens om de zes maanden wordt voor de farmaceutische specialiteiten bedoeld in artikel 34, eerste lid, 5°, c), 1, een nieuwe basis van tegemoetkoming vastgesteld voor zover er andere farmaceutische specialiteiten worden vergoed met een identiek werkzaam bestanddeel, een identieke toedieningsvorm en een identieke dosering waarvan de basis van tegemoetkoming op het ogenblik van de aanneming minstens 16 % lager ligt of lag, rekening houdend met het aantal farmaceutische eenheden per verpakking. De in het eerste lid bedoelde nieuwe basis van tegemoetkoming wordt berekend op basis van een theoretische prijs buiten bedrijf die gelijk is aan de geldende prijs buiten bedrijf verminderd met 26,7 % en vervolgens verhoogd met de marges voor de verdeling en voor de terhandstelling zoals toegekend door de minister die de Economische Zaken onder zijn bevoegdheid heeft en van toepassing op de farmaceutische specialiteiten afgeleverd in een apotheek open voor het publiek enerzijds of afgeleverd door een ziekenhuisapotheek anderzijds, alsook met de geldende BTW-voet.»
KCE Reports 126 Reference Price System 19
To protect people from paying too large a share of their income on co-payments, the system of maximum billing was introduced in 2002.31 Co-payments are added up at the level of the de facto household. If the amount of co-payments is higher than a fixed ceiling, which depends on the net taxable income of the household, any additional co-payments during the rest of the civil year are reimbursed by the sickness fund. Not only official co-payments but also the reference supplement is included in the maximum billing system. This may seem surprising, since the price difference between the brand and generic drug is an avoidable expenditure for patients. Moreover, when an active ingredient is included in the RPS, the reference supplement is due independently of the reimbursement category. For instance, individuals on glicazides (oral antidiabetic drug), might pay the reference supplement (if they do no use the reference drug) even if the drug belongs to reimbursement class A.
In general, the reimbursement basis is equivalent to the pharmacy retail price. But in the Belgian RPS, the reimbursement basis of an original drug for which a cheaper and similar reimbursable alternative exists (a generic or copy drug) is diminished by a fixed percentage.
2.4.1 Evolution of the legal basis of the RPS
Since its introduction in 2001, the Belgian RPS has undergone major modifications. The legal framework of the RPS is based on federal legal acts which can be complemented by federal Royal Decrees (RD). Those Royal Decrees are issued by the Minister of Social Affairs. The founding legal basis and major executive acts and modifications of the RPS are presented in Table 5.
Table 5: Legal evolution of the Belgian Reference Price System
Legal Basis Content Date of Application
Founding legal basis Art. 50, Law of 2 January 2001.32 This article introduces art. 35bis in the Coordinated Law of 14 July 1994.33
Initial article introducing the Belgian RPS. The original reduction in the reimbursement basis of the original drug is equal to 16%. The RPS is applied twice a year.
1 June 2001
Major modifications Art. 11, Law of 10 August 2001.32
Article 35bis is replaced by article 35ter in the Coordinated Law of 14 July 1994.
10 August 2001
Art.1, RD of 28 May 2002.34 The reduction in the reimbursement basis of the original drug is further decreased to 20%.
1 July 2002
Art 1, RD of 27 November 2002.35
The reduction in the reimbursement basis of the original drug is further decreased to 26%.
1 January 2003
Art 61, Law of 27 April 2005.36 Art. 62, introducing art. 35quater in the Coordinated Law of 14 July 1994.33
1) The legal framework of the RPS is extended to all dosage and administration forms of the active ingredient already under the RPS. In addition, the reduction in the reimbursement basis of the original drug is further decreased to 30%. 2) The article 35quater introduces the legal framework allowing that for specific cases, the RPS is extended to drugs with similar or/and analogous indication and mechanism of action.
1 July 2005
Art. 1, RD of 16 June 200537 introducing art. 55bis in the RD of 21 December 2001.38
This article specifies exemptions allowed for pharmaceuticals for which dosage and/or administration form creates a significant therapeutic added value.
20 June 2005
Art. 1, RD of 22 December 200539 introducing art. 55ter in the RD of 21 December
This article specifies art. 35quater of the Coordinated Law of 14 July 1994. On the initiative of the Minister of Social Affairs or
17 January 2006
20 Reference Price System KCE reports 126
2001.38 the DRC itself, the DRC evaluates for specific cases a list of drugs for which indications and mechanisms of action are similar or analogous to drugs already under the RPS. This procedure is allowed for off-patent pharmaceuticals and drugs for which the principal active ingredient(s) is/are salts, esters, ethers, isomers, mixture of isomers, complex or derived from the principal active ingredient(s) of the pharmaceutical.
Art. 89, Law of 27 December 2005.40
Rewrites art. 35ter. Two new paragraphs are introduced to describe how the original drug reimbursement basis changes after a similar generic is removed from the list of reimbursable pharmaceuticals.
1 January 2006
Art. 41, RD of 15 February 2007.41
This article describes the individual procedure for an exemption from the RPS application based on the recognition of a significant therapeutic added value in the original drug administration form.
1 April 2007
Art. 157, Law of 22 December 200842 and art. 100, Law of 22 December 2008.42 Art. 156, Law of 22 December 2008.42 Art. 2, RD of 14 April 2009.43
1) For pharmaceuticals in the RPS for over two years, an additional reduction in the reimbursement basis of the original drug equal to 2.5% (total reduction of 31.75%). 2) The frequency of application increases to four times a year (1 January, 1 April, 1 July and 1 October). 3) The similar and cheaper reimbursed alternative must exist and be available on the Belgian drug market (defined in contrast with art. 72bis, §1 of the Coordinated Law of 14 July 1994).
1 May 2009
Art. 34, Law of 23 December 2009.44 Art. 12, 3°, 11°-12° of the RD of 19 January 2010.45
1) Patented or off-patented drugs for which the principal active ingredient(s) is/are salts, esters, ethers, isomers, mixture of isomers, complex or derived from the principal active ingredient(s) of the pharmaceutical already in the RPS are included in the RPS ‘by full right’. 2) For pharmaceuticals in the RPS for over two years, additional reduction in the reimbursement basis of the original drug equal to 4% (total reduction of 32.8%). For pharmaceuticals in the RPS for over four years, additional reduction in the reimbursement basis of the original drug equal to 3.5% (total reduction of 35.2%). 3) New exemptions are allowed for drugs with a proven substantial added value with regard to security and/or efficacy. 4) A “security margin” is granted for the patients.
1 April 2010
KCE Reports 126 Reference Price System 21
2.4.2 Definition and scope of the cluster
In June 2001, the RPS was applied to off-patent pharmaceuticals provided that a reimbursable generic alternative existed with (1) the same active ingredient (chemical substance ATC-5); (2) the same dosage; and (3) the same administration form.
Since then, inclusion criteria were relaxed in order to enlarge the scope of the RPS. On July 1, 2005, the definition of the reference cluster was extended to include all drugs having the same active ingredient (ATC-5) independently of dosage and administration routes.36, 37
Besides that, the inclusion of the new article 35quater in the Coordinated Law of 14 July 199436 and article 55ter in the Royal Decree of 21 December 200139 has allowed since 2006 the extension of the RPS to drugs with similar or/and analogous indications and mechanisms of action in specific cases defined by the DRC. This extension is allowed for off-patent pharmaceuticals and drugs for which the principal active ingredient(s) is/are salts, esters, ethers, isomers, mixture of isomers, complex or derived from the principal active ingredient(s) of the pharmaceutical. In practice, the article has been applied to esomeprazole, the isomere of omeprazole.
Recently, the Law of 23 December 200944 has enlarged the scope of the RPS one step further. The application of the RPS to drugs for which the principal active ingredient(s) is/are salts, esters, ethers, isomers, mixture of isomers, complex or derived from the principal active ingredient(s) of a pharmaceutical already in the RPS was modified from a case-by-base (art. 35quater) to a ‘by full right’ application (art. 35ter, 2°-3°). This enlargement will be implemented from April 1, 2010 onwards.
The definition and scope of the RPS was also adapted for practical considerations. Since May 2009, the definition of the reimbursable cheaper alternative includes the requirement of ‘availability’ on the market.43 This notion aims to offer a solution to the problem that reimbursable cheaper alternatives exist but are not sufficiently available on the Belgian market.
2.4.3 The reference price level
The reference price is based on a percentage reduction in the ex-factory price of the original drug, which is then increased by the distribution and delivery margins as established by the Minister of Economic Affairs.
When the RPS was first introduced in 2001, the percentage reduction was fixed at 16%.46 This percentage reduction was progressively increased to:
• 20% on 1 July 200234;
• 26% on 1 January 200335;
• 30% on 1 July 200540;
• 31.75% for drugs included in a reference group for over two years on 1 May 2009 (applied on a quarterly basis)42;
• 32.80% for drugs included in a reference group for over two years and 35.15% for drugs included in a reference group for over four years on 1 April 2010 (applied on a quarterly basis).44
In Table 6 the working of the Belgian RPS is illustrated with an example based on a pharmaceutical from reimbursement category B, delivered in a community pharmacy for a patient without preferential reimbursement of co-payments, and included in the RPS for the first time (30% reduction in the reimbursement basis)
22 Reference Price System KCE reports 126
Table 6 : Example of the working of the RPS in Belgium Pharmacy
Retail Price
Reimbursement basis
Third-party payer (75%)
Co-payment (25%)
Reference Supplement
Original drug without generic alternative (No
RPS) €20 €20 €15 €5 €0
1st generic alternative 30% reduction
€14 €14 €10.50 €3.50 €0
2nd generic alternative €8 €8 €6 €2 €0
Original drug with generic alternative (in RPS). No price changes
€20 €14 €10.50 €3.50 €6
Source: Adapted from Febelgen.be
From April 2010 onwards, a new cost-containment measure will introduce a biannual application of a compulsory price reduction for ‘old’ drugs: drugs reimbursed for over 12 years and less than 15 years will have their ex-factory price and reimbursement basis reduced by 15% and drugs reimbursed for over 15 years will undergo a 17% reduction on January and July.
Table 7 summarizes the percentage reductions in the original drug reimbursement basis. As from April 2010, the percentage varies with the number of years in the RPS and the number of years already reimbursed.
Table 7: Total reductions in the reimbursement basis due to the RPS and compulsory reductions in ‘old’ drugs prices
Initial and additional reductions in the reimbursement basis
Co
mp
uls
ory
re
du
ctio
ns
in
‘old
’ dru
gs New in the RPS:
- 30% In the RPS for > 2 yrs: additional - 4%
In the RPS for > 4 yrs: additional -3.5%
>12 yrs and < 15 yrs: 15% 40.50% 42.88% 44.88%
>15 yrs: 17% 41.90% 44.2% 46.2% Source: Law of 23 December 200944
The fact that the reimbursement basis in the Belgian RPS is based on the price of the original drug can lead to peculiar situations, when two identical original pharmaceutical products (same compound, same formulation, same dosage) are manufactured and marketed by two (or even the same) companies, but at different prices. When generic products come on the market, they are “linked” to one (and only one) original specialty. The percentage reduction described above, and hence the reimbursement basis in the reference system, will be based on that original specialty. As an example, generic versions of losartan (available on the market in March 2010), which is currently marketed by MSD under two brand names, Cozaar and Loortan, with two different prices, will have different prices based on the fact that they are based on Cozaar or on Loortan. As the reimbursement basis is a direct percentage reduction of the original linked to the generic product, there is thus no real “reference price level” in the Belgian RPS system. Hence, if the original products are included in the reference system, the reference supplement will be different for these two original specialties.
KCE Reports 126 Reference Price System 23
With regard to the revision frequency, the reference price level was initially reviewed every six months (on 1 January and on 1 July) by the administration of the National Institute for Health and Disability Insurance (INAMI/RIZIV). Since 1 May 2009, the revision frequency of the reference price level and reference groups has increased to four times a year (on 1 January, 1 April, 1 July and 1 October).42
2.4.4 The security margin
Concerned about the additional cost borne by patients, the Belgian legislator introduced a legal upper-limit on the reference supplement (modification of §3, article 35ter of the Law of 23 December 200944) in effect on 1 April 2010. This so-called ‘security margin’ aims to exclude from the reimbursement list all drugs for which the reference supplement is more than 25% of the reimbursement basis (with a maximum of €10.80).
The security margin is meant to encourage pharmaceutical companies to decrease their prices and to grant patients a new financial protection.
2.4.5 Exemptions
As the scope of the Belgian RPS was progressively enlarged, exemptions were specified simultaneously to limit, in some cases, the reach of the extensions.
Firstly, with regard to the enlargement in July 2005 which extends the cluster definition to all pharmaceuticals with the same active ingredient, independently of dosage and administration form, two types of exemptions were allowed:
• Injectable pharmaceuticals for which the reimbursed cheaper alternative does not have the injectable form, does not enter the RPS;
• Pharmaceuticals, whose administration form is accepted to be a significant therapeutic added value compared with the cheaper alternative, can obtain an exception status by the DRC. The exemption request procedure is defined in article 55bis, §2bis of the Royal Decree of 21 December 200138 (introduced by the Royal Decree of 16 June 200537 and modified by the Royal Decree of 19 January 2010).
Secondly, with regard to the introduction of art. 35quater that entitled the DRC to specify a list of drugs with similar and/or analogous indications and mechanisms of action to drugs already in the RPS, the following exemption was specified:
• Pharmaceuticals with proven significant therapeutic added value linked with convenience of drug use, safety and/or effectiveness can obtain an exception status. This exemption request procedure is defined in article 55ter, al. 7-13 of the Royal Decree of 21 December 200138 (introduced by the Royal Decree of 22 December 2005).39
Lastly, in January 2010 drugs for which the principal active ingredient(s) is/are variants of the principal active ingredient(s) of drugs already in the RPS moved from article 35quater of the Coordinated Law (case-by-case application) to art. 35ter (‘by full right’ application). As a result of this enlargement, the above exemption request was appended in the art. 55bis, §2ter (introduced by the Royal Decree of 19 January 201045).
2.4.6 Measures for physicians, pharmacists and patients
Like in many other countries that have implemented a RPS, the Belgian Minister of Social Affairs has progressively recognized the important role of physicians’, pharmacists’ and patients’ behaviour in the demand and consumption of low cost drugs. He/she consequently introduced a set of measures for these three groups to increase the efficiency of the RPS and to boost the share of low cost drugs consumption.
24 Reference Price System KCE reports 126
2.4.6.1 Measures for physicians
Besides the prescription guidelines and information campaigns aimed at physicians, the Minister established minimum percentages of low cost drug prescriptions. These minimum percentages of low cost prescriptions (the so called “quotas”) were introduced by the Royal Decree of 17 September 200547, instituting article 73, §2 in the Coordinated Law of 14 July 1994. Quotas differ per speciality (see Table 8) and have not been updated since they were established in 2006.
Low cost drugs included in quotas are: (1) original drugs for which the reimbursement basis has been diminished because a generic alternative exists, and which have lowered their public retail price to the reimbursement basis (so that there is no reference supplement to be paid), (2) generic drugs and copies, and (3) drugs prescribed under the International Common Denomination (ICD or INN: International Nonproprietary Name). This last category has been included because, in case of INN prescription, the pharmacist has to dispense in priority a low cost drug (based on instructions issued by the NIHDI).48
Table 8: Percentage of low cost prescriptions per speciality
Speciality Quotas of low cost prescriptions
Gynaecology-obstetric Pneumology Rheumatology Paediatric Orthopaedic Neurosurgery Neurology Ophthalmology ORL Neuropsychiatry Physical medicine and rehabilitation Anaesthesiology-reanimation Plastic surgery Urology Dermatology-venereology Psychiatry Surgery Internal medicine General medicine Cardiology Gastroenterology Radiotherapy-oncology Stomatology Dentistry Others specialities
The measure of prescription quotas has been complemented with a monitoring of the physician’s prescribing pattern. Every physician received individual feedbacks on his prescribing patterns (on January 2006, July 2007, October 2008, November 2009). During the first six months (September 2005 – March 2006), physicians’ prescribing patterns were only examined with reference to the assigned quotas. Physicians who did not comply with the minimum requirement for a six-month period were observed for another six months. During this period, they were informed and trained in low cost prescribing. If no significant change was observed after the six-month monitoring period, sanctions could be imposed (in practice this has never happened). Interestingly, already in September 2006, 96.7% of GPs, 85.5% of specialists and 93.2% of dentists met their quotas of low cost prescriptions.b
b Personal Communication- NIHDI (March 2010).
KCE Reports 126 Reference Price System 25
To inform the prescribers on which drugs are included in the reference system and which drugs entail a reference supplement for the patient, the Belgian Center for Pharmacotherapeutic Information (CIBP/BCFI or Centre Belge d'Information Pharmacothérapeutique/Belgisch Centrum voor Farmacotherapeutische Informatie) maintains a web-database c and publishes yearly the “Commented Drug Directory” (Répertoire commenté des medicaments/Gecommentarieerd Geneesmiddelen Repertorium). Information on drugs and prices of pharmaceutical products can also be found in the Mememto-Pharma available on the NIHDI website.49 This booklet is published by the NIHIDI in collaboration with the CIBP/BCFI. Both tools illustrate visually the status of each pharmaceutical product by a system of colored pictograms.
1. Drugs which do not entail a reference supplement for the patient
Low cost drugs: generics, copies or originals which have lowered their price to the reimbursement basis.
Original drugs which are not in the reference system because there is no generic alternative.
2. Drugs which entail a reference supplement in addition to the co-payment
Original drugs which have not lowered their public price to the reimbursement basis.
Besides the quotas of low cost prescriptions, the Minister of Social Affairs requested the National Convention between Physicians and Sickness Funds (NCPS; “Commission nationale médico-mutualiste (CNMM)/Nationale commissie geneesheren-ziekenfondsen (NCGZ)) to formulate proposals to save €42.5 million on the reimbursement of pharmaceuticals. The agreement for 2009-201050, signed by 82.8 percent of physicians, includes (among other measures) the commitment to initiate the therapy with the “least costly” drug(s) within a group for (initially) 6 pharmaceutical groups. This measure is not restricted to drugs included in the reference price system, but is to be applied to all drugs within a particular group. The commitment is that the treatment should be initiated (by a GP or by a medical specialist) in at least 8 of 10 patients, with one of the “least costly” molecules of each group, if there is no contra-indication and if therapeutic objectives are met. The “least costly” medication (or the group of “least costly” medications) is identified by the NIHDI based on the cost for the NIHDI per DDD (for the total consumption in 2008). To take into account changes in costs over time, the list of “least costly” molecules per group is updated on a monthly basis.
The six groups are listed below, with the recommended “least costly” molecule(s) (update of November 2009):
1. Proton pump inhibitors (ATC-4: AO2BC): omeprazole and lanzoprazole are recommended.
2. ACE inhibitors and sartans (ATC-3: CO9): ACE (any of them) are recommended.
3. HMG-CoA reductase inhibitors (statins) (ATC-4 C10AA): simvastatin and pravastatin are recommended.
4. Fluconazole and itraconazole (ATC-4 J02AC) : itraconazole is recommended.
5. Nonsteroidal Anti-Inflammatory drugs (ATC-3 M01A): non coxibs are recommended.
6. SSRIs (ATC-4 N06AB): Sertaline is recommended. This class was however not included in the final text of the National Agreement.
c Available from http://www.cbip.be or http://www.bcfi.be.
26 Reference Price System KCE reports 126
A first evaluation of this measure was discussed on February 8, 2010 by the NCPS and representatives of the pharmaceutical sector, and was also made available on the website of the NIHDI.51 The objective to initiate in at least 8 of 10 patients with one of the “less costly” molecules of a group was achieved for NSAID and ACE-inhibitors and sartans. In addition, the NCPS judged that also for PPI the goal was achieved when taking into account the evolution in the cost of pantoprazole and doses used in reality, although volumes increased considerably. Moreover, it was decided to exclude ATC-4 J02AC from the agreement since the group was considered to be too heterogeneous in therapy. For statins, the target was not attained. The NCPS announced further measures to promote the prescription of the less costly molecules for statins and to reduce PPI volumes.
2.4.6.2 Measures for pharmacists
Generic substitution was introduced in 1993 (Article 34 of the Law of 6 August 1993, introducing art. 11 in the Royal Decree of 10 November 1967). However, until today the royal decree required to put the article into practice has not been adopted yet. As a result, generic substitution is still not allowed in Belgium. There is one exception permitted by art. 34 of the Pharmacists Code of Ethics that came into force on March 31, 2005 which states that “in case of emergency or duty, the pharmacist is allowed to substitute a generic without the prior approval of the physician”.
Since October 2005, a prescription in INN48 entitles the pharmacist to follow the next algorithm to dispense a drug:
1. A generic, a copy or an original drug in the reference system for which the public price has been diminished to the reimbursement basis (no reference supplement for the patient).
If point 1 is not applicable, then
2. An original drug in the reference system, but for which the public price has not been diminished to the reimbursement basis (there is a reference supplement to be paid by the patient).
If points 1 and 2 are not applicable, then
3. An original drug not in the reference system.
Pharmacists also have to flag (manually) all prescriptions written in INN, so that they can be traced in the databases.
The current remuneration system for pharmacists is intended to ensure that pharmacists are indifferent between dispensing original or generic drugs. While pharmacists are normally paid a percentage of the pharmacy retail price (31%, VAT not included), the legislator ensured that for generic drugs the profit margin of the pharmacist equals the profit margin on the associated original drug in absolute terms.52 But by triggering price competition, the RPS has indirectly contributed to the erosion of pharmacists’ remuneration.
In order the tackle the issue, the government and pharmacists’ organizations recently came to an agreement which thoroughly reforms the pharmacists’ remuneration system. The new article 35octies in the Coordinated Law of 1994 (introduced by article 228 of the Law of 25 April 2007) and the Royal Decree of 21 January 2009 are in line with the new role pharmacists are expected to play. The new remuneration system will be implemented from April 1, 2010 and consists of:
• A fixed payment per delivery (75%);
• A variable payment as a percentage of the pharmacy ex-factory price (20%);
• A complementary fixed payment (5%).
KCE Reports 126 Reference Price System 27
The fixed payment equals €3.87 and aims to remunerate the drug delivery. The variable payment or economic margin pays for the operating cost of the pharmacy. The complementary fixed payment aims to remunerate specific tasks including deliveries with INN prescription (€1.20 per delivery). By limiting the share of the economic margin in total remuneration, the new system partially disconnects the pharmacist’s profit margin from the retail price.
2.4.6.3 Measures for patients
To increase adherence among patients, the successive Ministers of Social Affairs launched public information campaigns (in 2001, 2004 and 2006). These campaigns include advertising on television, radio and in newspapers.
In addition to these national campaigns, the sickness funds have initiated their own information campaigns to inform their affiliates.
Key points
• The Reference Price System (RPS) consists of establishing a common level of reimbursement for a group (called cluster) of comparable or interchangeable drugs. In addition to the co-payment, the difference between the reimbursed price and the public price is borne by the patient (and is called the reference supplement). The definition of the clusters is the most controversial issue.
• The literature review on the RPS included 11 OECD countries. Most countries have implemented a Level 1 RPS: the cluster is made of drugs that have identical bioactive ingredients (ATC 5: original and generic drugs). Such a RPS is used in Belgium, Denmark, France, Portugal and Spain. Other countries, such as The Netherlands and New Zeeland, use a broader definition of clusters (ATC-4, therapeutic equivalence). Finally, Australia, British Columbia (Canada), Germany, Italy and Hungary have implemented a multilevel RPS, using concomitantly ATC-5, 4 or 3 to define clusters.
• The countries also use different methods to calculate the reference price. In Australia, British Columbia, Denmark and New Zealand, the reference price is set by reference to the cheapest drugs within the cluster. In Germany, the reference price is determined by an econometric method. In France and Spain, the reference price is based on the average price of generic drugs within the cluster. In Portugal, the reimbursement level is equal to the highest generic price for each group on the market. In Belgium, the reference price is fixed at a percentage of the price of the original drug.
• Various policy measures to influence the behaviour of physicians, pharmacists and patients in favour of low cost drugs have been adopted in most countries. Measures include direct financial incentives, mandatory INN prescription, generic substitution by the pharmacist, information campaigns.
BELGIUM
• In Belgium, the RPS was introduced on 1 June 2001, and applies to drugs for which a generic alternative is on the market (Level 1 RPS, ATC-5).
• At the introduction of the system, the reference price (or maximum reimbursement) was fixed at 84% of the price of the original drug. Since 2009, it is fixed at 68.5%.
• Since April 2006, physicians need to fulfil quotas for prescribing low cost drugs (defined as generics, copy or original drugs that have reduced their price to the reference price).
• Incentives for patients to use low cost drugs are limited.
28 Reference Price System KCE reports 126
3 IMPACT OF THE REFERENCE PRICE SYSTEM: A LITERATURE REVIEW
3.1 INTRODUCTION As we underlined in the previous chapter, the main objectives of a reference price system are (1) to stimulate price competition in the pharmaceuticals market, (2) to make consumers and physicians more sensitive to the relative price of drugs and (3) to control drug expenditures for the third-party payer by encouraging physicians and patients to use generic or low cost brand drugs. Since the adoption of a RPS by a long list of countries, a number of studies have tried to evaluate its effect on outcome measures such as drug use, use of hospital or physician services, patient health, cost for the third-party payer and for patients. This chapter reviews available literature to document the association of reference pricing with these outcome measures. Since the main focus of the study is to assess whether unintended distributional effects result from the RPS in Belgium, the impact of the RPS on outcomes is considered, where possible, in patient groups with different socioeconomic backgrounds.
There is a vast amount of literature on the effects of prescription drug cost sharing on access to prescription drugs, medical spending and health outcomes for vulnerable populations.10, 53 Such studies are not included in the review of this chapter, unless reference pricing is one of the systems analysed.
3.2 METHODS In order to find the relevant articles, we conducted electronic searches in Medline (access: OVID), Embase (access: Embase.com), Econlit (access: OVID) and the Cochrane Library database (Cochrane Database of Systematic Reviews) for studies published between 1988 and 2009. The search was based on a set of key words (MeSH terms and/or text words): reference pricing OR reference price OR reference prices OR reference based pricing OR reference adj2 pric$. In parallel, we also searched using the term “reference pricing” in Google. This initial process yielded 349 studies. We then screened these studies based on titles and abstracts according to some inclusion criteria. In addition to these inclusion criteria, we excluded issue briefs, comments and letters. 91 references met all of these criteria. The inclusion criteria were:
1. The term “reference pricing” or its synonyms had to be present in the abstract or the title of the study.
2. The study had to examine the effects of a reference price system on at least one of the following outcomes: drug use (prescription utilization, dispensed drug, actual use), health outcomes or costs (drug costs, co-payment for patient).
3. The study had to be based on empirical analysis (i.e. no purely theoretical analysis or simulations).
4. The study had to be published in English, Dutch or French.
After reading the full text of the remaining articles (91), 61 were rejected because not fulfilling the inclusion criteria or because they were not relevant. Hence 30 articles met all eligibility criteria. 5 additional references were identified resulting in 35 studies included in the final analysis.
Among the 35 references that met the study eligibility criteria, 4 are reviews of the literature on the impact of a RPS on one or more of the selected outcome measures. Since all individual studies (except one because published in 2009) were included in one or more of the reviews, we decided to limit the description of the results to those mentioned in the reviews. The review of the individual studies can be found in the appendix to this chapter.
KCE Reports 126 Reference Price System 29
In Chapter 4 some individual studies are described in more detail if they provide information on the association between the use of specific groups of drugs used in the analyses with Belgian data and outcome measures differentiated according to socioeconomic characteristics of patients.
3.3 RESULTS In the next sections, we give an overview of the findings of the 4 reviews. In section 3.3.1 the search strategy and study selection of the reviews is described and compared. In the following sections the key findings of the impact of the RPS are described for each outcome measure separately: drug use (section 3.3.2), drug prices (section 3.3.3), drug expenditures for the third-party payer and for patients (section 3.3.4), and patient health and health services use (section 3.3.5).
3.3.1 Search strategy and study selection of the review studies on the impact of a RPS
The 4 selected reviews of the literature on the impact of a RPS are Aaserud et al. (2006)19; Goldman et al. (2007)10, Lopez-Casasnovas et al. (2000)9 and Morgan et al. (2009)54 The number of included studies differs substantially between the four reviews: from 3 (3 studies in 4 papers) in Morgan et al. (2009) to 45 in Lopez-Casasnovas et al. (2000). Of course, the number of selected papers follows directly from the search process and inclusion and exclusion criteria for study selection of the reviews.
In the systematic review of Morgan et al. (2009) the search process was limited to English-language studies published from 1986 to 2007 that examined the effects of therapeutic reference pricing, reported on outcomes relevant to patient care and cost-effectiveness and employed quantitative study designs that included concurrent or historical comparison groups. Potentially appropriate articles were abstracted and assessed based on an adapted version of the data abstraction form of the Cochrane Effective Practice and Organisations of Care (EPOC) Group. Patient-level data had to be used in an acceptable research design. The following research designs were included: randomized controlled trials; before-and-after or pre/post studies with nonrandomized comparison groups; interrupted time series analyses with or without comparison groups and pre-post studies without comparison group. Cross-sectional or post-only designs were excluded, as well as analyses using aggregated data or regarding policies in developing countries. Searches were performed in electronic databases and grey literature, citations to and from relevant articles were traced, core journals were hand-searched and the authors’ personal libraries were searched for additional articles.
The systematic review of Aaserud et al. (2006) included 10 studies reported in 14 papers. The authors searched electronic databases and websites To be included in the review, a study had to contain an objective measure of at least one of the following outcome measures: drug use, healthcare utilisation, health outcomes and costs (expenditures). Designs included were: randomized controlled trial, non- randomized controlled trial, interrupted time series analysis, repeated measures study or controlled before-after study.
Goldman et al. (2007) performed a systematic review on the association between medication, medical utilization and spending and health and prescription drug cost sharing, with reference pricing as one of the included cost sharing measures. The search strategy and study selection criteria yielded 16 studies, based on the following study designs: time series, cross-sectional, repeated cross-sectional, longitudinal, before-and-after and randomized trial. The authors conducted electronic searches of PubMed for English-language studies published between 1985 and 2006.
The last review is a narrative review conducted in 2000 by Lopez-Casasnovas and Puig-Junoy. They reviewed the literature on reference pricing published between 1989 and 1998 and hence identified 45 studies according to their inclusion criteria. About half of the studies consisted of institutional descriptions and review of country specific reference pricing strategies. 21 empirical studies identified impacts of reference pricing, 18 of them analyzed the effects on expenditure, prices and consumption.
30 Reference Price System KCE reports 126
3.3.2 Association of the RPS with drug use
A number of studies in the 4 reviews analyzed the association of the RPS with drug use. Most of these studies conclude that the implementation of a reference price system was followed by an increase in the use of drugs priced at the reference price and by a decrease in the use of higher cost drugs within the cluster.
Goldman et al. (2007) concluded that almost all studies included in their review found large increases in the use of drugs priced at or below the reference price and the opposite effect for higher-cost drugs that require patient cost sharing (because of the RPS). Some studies examined the impact of reference pricing during the mid-1990s in British Columbia for senior citizens for 3 categories of drug treatment (nitrate drugs, ACE-inhibitors, and calcium channel blockers (CCBs). These studies are included in all 4 reviews.27, 55-57 They found that between 9% and 34% of patients switched to fully covered (reference) drugs after implementation of the RPS. The overall use of CCBs declined according to Grootendorst and colleagues, whereas Schneeweiss and colleagues came to the conclusion that this reduction was not statistically significant after controlling for pre-policy trends. With respect to the use of ACE-inhibitors, the opposite result was found.
Four studies27, 55, 57-61 reported in the review of Aaserud et al. (2006) observed an increase in reference drug use (between 60% and 196%) after the transition period following the implementation of a RPS. The use of the cost share drugs in the reference groups decreased immediately after the implementation of reference pricing system. The decrease was estimated between 19% and 42%27, 57, 60-62. The effect on the total use of drugs was smaller and not consistent among individual studies.
3.3.3 Association of the RPS with drug prices
In general, most of the studies found that the implementation of a RPS was followed by a price reduction for drugs covered by the RPS.
The review of Aaserud et al. (2006) contained 2 studies assessing the association of reference pricing with drug prices. A reduction in drug prices was found ranging from 11% to 26% for different reference drug groups. Grading the quality of the evidence showed very low quality in both studies.
In a more recent study, based on panel regression, Brekke et al. (2009)63 observed that the introduction of reference pricing in Norway led to an average price reduction of about 18% on brand names and 8% on generics.
3.3.4 Association of the RPS with drug expenditures
In general, most of the studies tend to conclude that the introduction of a RPS contributed to a reduction of drugs expenditures for the third-party payer, at least in the short term.
In Aaserud et al. (2006) a trend towards an immediate reduction in expenditures for the drug in the reference group was found (ranging from -5% to 50%), based on 4 studies.27,
55, 57, 64 The same studies were included in the review by Goldman et al. (2007).
According to the review of Aaserud et al. (2006) not enough evidence was found to determine the impact of reference pricing on patient co-payments.
KCE Reports 126 Reference Price System 31
3.3.5 Association of the RPS with health services use and health
A limited number of studies have assessed the impact of the implementation of a reference price system on health (mortality) and health care utilization. All of these studies are based on individual data. Most of them found no evidence of adverse effects on health and no evidence of a significant change in health care utilization after the introduction of a reference price system.
In Aaserud et al. (2006) no significant differences in health outcomes (mortality) and health care utilization as measured in the individual studies were found. Measures of health care utilization were emergency room visits, and hospital admissions through the emergency department, non-emergency hospital admissions and physician office visits. However, the quality of the evidence in the 4 included studies was graded as very low. Comparable results were found in the other reviews.
Key points
The review of the literature on reference pricing showed that the introduction of reference pricing:
• was followed by an increase in use of drugs priced at the reference price and by a decrease in use of the highest cost drugs within the cluster.
• was not systematically followed by a reduction in the price of the original branded drugs submitted to the RPS.
• contributed to a reduction of drugs expenditures for the third-party payer.
• had no significant impact on health or health care utilization.
All conclusions should be considered with caution given the lack of transferability of the results to the general population (many studies limited to senior citizens in British Columbia). Moreover, most of the studies focused on the short-term impacts.
32 Reference Price System KCE reports 126
4 RESULTS FROM THE ANALYSIS OF BELGIAN PRESCRIPTION DATA IN 2008
4.1 INTRODUCTION Belgian studies assessing the impact of the RPS mainly cover its effect on the market share of low cost drugs, changes in drug prices and costs for the NIHDI and for patients. Changes in health outcomes and socioeconomic differences associated with the use of low cost drugs have not been previously addressed in the case of Belgium. Moreover, these two topics are addressed in the international literature only in countries where clusters contain therapeutically interchangeable drugs.18 This may be due to the fact that for generic RP, where clusters contain the same active ingredient, interchangeability of drugs within clusters is less questioned.26 As a consequence, in this type of RPS measuring health outcomes is less relevant.18 However, in a generic RPS, the cost for patients from different socioeconomic backgrounds is still an important question from an equity point of view. From a welfare perspective, the effectiveness of generic RP is related not only to overall changes in costs for third-party payers and patients, but might also depend on the use of drugs “among different types of patients”. Indeed, patients’ behavior to changes in cost coverage for pharmaceutical products might depend on patients’ characteristics. In addition to this, there is some evidence that physicians’ characteristics can also affect patients’ adherence to the RPS.65
In this chapter, we address this issue by analyzing patients’ consumption of pharmaceuticals included in the reference price system from two different perspectives. First, for clusters containing an original brand that has not reduced its price and a low cost alternative, we examined the association between patients’ and physicians’ demographic and socioeconomic characteristics and the use of low cost drugs. Second, we explored the association between patients’ and physicians’ characteristics and the use of low cost drugs within 4 therapeutic subgroups. Two main reasons encouraged the latter analysis. On the one hand, for 2009-2010, the national agreement between physicians and sickness funds includes the commitment to initiate therapy with the “least costly” drug(s) within 5 therapeutic groups.50 Thus, the choice for a low cost drug not only includes a brand drug with the same active ingredient but also other “low cost alternatives”. On the other hand, in countries where the RPS is set at the level of therapeutic groups, studies have provided interesting information on the use of low cost drugs related to individuals’ socioeconomic characteristics (see section 4.5.3).
The remaining of Chapter 4 is structured in 5 sections. In section 4.2 some background information is provided on the Belgian pharmaceutical market for the period 2000-2008 and on the reference supplement (in 2008). Next, a brief overview of the literature on the impact of the RPS in Belgium is given (section 4.3). Section 4.4 contains the methods used for the research questions. Section 4.5 presents the results.
KCE Reports 126 Reference Price System 33
4.2 THE BELGIAN PHARMACEUTICAL MARKET: EVOLUTION OF MARKET SHARES AND OUT-OF-POCKET PAYMENTS
4.2.1 Evolution of market shares
The figures and tables in this section show the evolution of the market shares of different categories of drugs in the Belgian market for the period 2000-2008: generic, original with a low cost, original in the reference system with a supplement for the patient and original not in the reference system. All results are based on a national claims-based prescription database containing information on pharmaceutical products delivered in community pharmacies (not in hospital), called Pharmanet.
The volume of reimbursed pharmaceuticals increased from 2 797 million DDD in 2000 to 4 199 million DDD in 2008 (Table 9 and Figure 2, DDD version 2010). In 2000, the volume of generic drugs and copies represented 1.1% of the total volume of pharmaceutical products. In 2001, the year of the introduction of the RPS, the share of low cost drugs represented 6.6% of all reimbursed DDD: 4.2% for generic drugs and copies, and 2.4% for original products which lowered their price to the reimbursement basis. In 2004 and 2006, respectively one year before and one year after the introduction of the low cost quotas, the share of low cost drugs was respectively 17.2% and 37.1%. In 2008, the share of low cost drugs was 40.3%: 24.0% for generics and copies and 16.3% for low cost original drugs. 11.8% of the total volume of prescribed pharmaceuticals entailed a supplement for the patient. In 2008, the total cost of reimbursed pharmaceuticals for the third-party payer (NIHDI) was €2 610 million: 22.1% for low cost drugs and 4.5% for high cost original drugs within the reference system.
34 Reference Price System KCE reports 126
Table 9: Evolution of market share of reimbursed pharmaceutical products (A: Total DDD, B: € million for NIHDI) Total DDD (A) € million for NIHDI (B)
Figure 2: Evolution of market share of reimbursed pharmaceutical products (A: Total DDD, B: € million for NIHDI)
Total DDD (A) € million for NIHDI (B)
36 Reference Price System KCE reports 126
4.2.2 The reference supplement in 2008
In this section we provide information on the reference price system in terms of a) drugs included in the RPS; b) the reference supplement across categories; c) the reference supplement as share of total out-of-pocket payments. Results are based on Pharmanet (2008).
A total of 155 original active molecules were included in the reference price system in December 2008. For 65 (42%) of these, pharmaceutical companies decreased the public price to the level of the reimbursement basis, so that no reference supplement was to be paid by the patients. For the remaining 90 active ingredients (corresponding to 387 different pharmaceutical products), a reference supplement was due: across all those products (packages), the median reference supplement was €3.8 in 2008 (Table 10). However, important variations across groups of drugs were found. The very specific group of antineoplastic and immunodulating agents (L) had a very high reference supplement (median €17.2, maximum €288.5). A high supplement was also found in group A (Alimentary tract, median €5), group N (Nervous System, median €7.7) and group G (Genito-urinary and sex hormones, median €4.4).
Table 10: Reference supplement across ATC-1 groups in euro (€) ATC-1 N Mean Median Std
In 2008, total out-of-pocket payments for reimbursed pharmaceutical products amounted to €592.41 million of which €60.45 million in reference supplements (10.2% of total out-of-pocket payments) (Table 11 and Figure 3). Reference supplements were mostly paid for cardiovascular drugs (€20.54 million, 34% of total reference supplements), nervous system drugs (€11.44 million, 19% of total) and musculoskeletal system drugs (€10.18 million, 17% of total). The share of the reference supplement in total out-of-pocket payments was the highest in musculoskeletal system drugs and genito-urinary drugs (respectively 30% and 16%).
KCE Reports 126 Distributional effects of the Reference Price System 37
Table 11: Out-of-pocket payments (co-payments and reference supplements) in ambulatory data 2008 (€ million), by ATC-1
ATC 1
Reference Supplement Out-of-pocket Co-payment Total % of out-of-
pocket A - Alimentary tract 59.61 58.32 1.28 2.15 B - Blood and blood forming organs 25.89 25.88 0.01 0.03 C - Cardiovascular system 167.88 147.34 20.54 12.24 G - Genito-urinary 34.43 28.85 5.58 16.20 J - Anti-infective 62.49 56.14 6.34 10.15 M - Musculoskeletal system 34.05 23.87 10.18 29.89 N - Nervous system 104.22 92.78 11.44 10.98 R - Respiratory 80.29 75.48 4.81 5.99 Other 23.57 23.30 0.26 1.12 Total 592.41 531.96 60.45 10.20
Source: Pharmanet, NIHDI
Despite the fact that the reference supplement for antineoplastic and immunodulating agents (L) was very high (on a unitary basis), the share in the total amount of reference supplements was less than 1%.
38 Reference Price System KCE reports 126
Figure 3: Co-payments and reference supplements in ambulatory data 2008, by ATC-1
Source: Pharmanet, NIHDI
KCE Reports 126 Reference Price System 39
4.3 IMPACT OF THE REFERENCE PRICE SYSTEM IN BELGIUM: LITERATURE REVIEW
4.3.1 Market share of low cost drugs
Most studies on the impact of the RPS in Belgium are based on population samples from sickness funds.66-72 In general, these studies provide a descriptive analysis of the evolution of the market share of low cost drugs in terms of volume (DDD). All studies showed that the market share of low cost drugs increased from 11% in 2001 to almost 40% in 2007d. Interestingly, Benda and Thorre (2007) pointed out that the evolution of the consumption of low cost drugs increased more in certain reimbursement categories. Indeed, in reimbursement category B the market share of low cost drugs passed from 16.2% in the third quarter of 2003 to 37.7% in the last quarter of 2006. On the contrary, For drugs in category A (having no co-payments) prescription of low cost alternatives is stable (around 26,5%). In this category generic prescription is very low around (5%), thus prescription of low cost alternatives is mostly concerned by original products who aligned their prices.69. For this specific group, patients pay only the reference supplement, when applicable.
Simoens et al. used data from IMS Health Belgium (a databank covering 50% of all Belgian pharmacies). They also found that sales of generic drugs, in terms of number of packages, increased from 2.05% of the total pharmaceutical market in 2001 to 6.11% in December 2003.74 The authors argued that this increase can be partially attributed to the implementation of the RPS and to the introduction of new generic drugs.
4.3.2 Expenditures for the NIHDI and for patients
Simoens et al. (2005) underlined that total expenditures for the NIHDI for drug classes having a generic alternative decreased by €46 million between 2001 and 2002 and by €57 million between 2002 and 2003.74
Studies from different sickness funds showed that the introduction of the RPS entailed additional costs for patients due to the reference supplement. For affiliate members of the Christian sickness funds, the reference supplement accounted for €22 million in 200468, €28 million in 2005 and €26.9 million in 2006.67 Laasman et al. based their analysis on data from the Socialist sickness funds and estimated that the reference supplement accounted for almost €44 million in 200575, €42 million in 200770 and €66 million in 2008.71 Benda and Thorre pointed out that even considering this extra cost borne by patients because of the reference supplement, total co-payments decreased from €75.5 million in 2004 to €71.5 million in 2005.69 The authors argued that this reduction can be partially explained by the increasing use of low cost alternatives.
4.3.3 Potential gains from the increasing use of low cost drugs
Based on the hypothesis that individuals substitute their consumption of original brand drugs with a low cost alternative, sickness funds also provided estimates on potential budgetary savings for the NIHDI and for patients e . Using data from the Christian sickness funds, potential savings were estimated at €117 million in 2003 for the NIHDI and at €50 million for patients.66 Laasman et al. estimated that using the least expensive generic alternative would result in additional savings for the NIHDI (€91 million) and for patients (€86 million).71
d Studies based on data from the Christian sickness funds cover the period between the first trimester of
2001 and the second trimester of 2007 66, 67, 73 and from the Socialist sickness funds from October 2001 to December 2008. One study of the Independent sickness funds provides information on the use of low cost drugs between the last trimester of 2004 and the third trimester of 2006.
e We do not discuss the different methodologies used. Estimations are based on the hypothesis that a low cost alternative is used instead of a brand drug. Estimations of potential gains at a national level are based on extrapolations of the gains of affiliate members of each sickness fund.
40 Reference Price System KCE reports 126
4.3.4 Strategies by pharmaceutical firms
Diels et al. (2004) indicated that the introduction of the RPS involved greater pressure on the suppliers of original drugs. For products such as Augmentin and Clamoxyl original brands reduced their prices.66 Simoens et al. (2005) drew identical conclusions. Original brands such as Zestril dropped their prices to the level of the generic version of lisinopril.74 Yet, for some products like Zestril, the reduction in price was set hand in hand with an additional compromise: sickness fund approval for reimbursement was no longer necessary (change from chapter 4 to Chapter 1 in the conditions for reimbursement) On the other hand, some firms of original drugs have reacted to the introduction of the RPS by launching new variants of their original drugs (this is the case for Cipramil).74 Moreover, there is some evidence that for a limited number of drugs, there was an increase in the demand for drugs which were not submitted to the RPS (Augmentin retard).66 Concerning generic prices, Simoens et al. (2007) also pointed out that they tend to be higher than in other countries76.
4.4 METHODS
4.4.1 Data sources
4.4.1.1 IMA data (Pharmanet, Health Care data, Population data)
Sickness funds have individual patient data on patient characteristics, reimbursed services and pharmaceuticals delivered by pharmacists, at the detailed level of the service or the prescription. This information can be found in three databases:
1. “Pharmanet” is the database specific to pharmaceutical products delivered in community pharmacies (not in hospital).
2. The database “Health Care” contains all other reimbursed acts and pharmaceutical products. Information on patients with a global medical record (GMR), on patients residing in a rest or nursing home for the elderly (MR), on patients enrolled in a “medical house” (maison médicale-MM, wijkgezondsheidcentrum-WG) paid per lump sum is available in this database.
3. The “Population” database contains information on the demographic and socioeconomic profile of each of the sickness funds members.
These data are collected and made available by the IMA (Intermutualistic Agency). IMA is a non-profit institution with all Belgian sickness funds as its members.
4.4.1.2 NIHDI data on characteristics of prescribers
The NIHDI owns a database with the characteristics of all health care providers in Belgium. This database contains information such as their year of birth, sex, professional address, their qualification code (the specialty), their date of diploma, and whether they accede to the agreements between representatives of the sickness funds and of the organizations of physicians (physicians who accede to the agreements have to adhere to the fee schedule as determined in the nomenclature).
4.4.1.3 Characteristics by Statistical Sector
Municipalities (FR=Commune; NL=Gemeente) in Belgium, represent the smallest unit in the official classification of territorial units for statistics (NUTS).77 However, information on several socioeconomic variables is available at a smaller geographical unit: the statistical sector (SS). Statistical sectors divide municipalities into homogeneous entities according to 4 criteria; they reflect similar “neighbourhoods” in terms of socioeconomic, urban and morphological characteristics. Approximately 20 000 statistical sectors exist in Belgium. Many variables describing each statistical sector are available: yearly fiscal data (based on the tax income reported by inhabitants of each SS) and all data included in the last “Socio-Economic Survey” performed in 2001 (database owned by the Federal Public Service Economy).78
In this project, information on the income and educational level by SS was used.
KCE Reports 126 Reference Price System 41
4.4.2 Time period
The study uses data from the following time periods:
• Pharmaceutical products delivered in 2008 (Pharmanet, IMA)
• Socioeconomic characteristics of patients: December 2008 (Population, IMA)
• Some patient characteristics (GMR, MR, MM/WG): in 2007 (Health Care, IMA) because at the start of the project, these data were not yet complete for the year 2008.
• Provider characteristics: in 2008 (NIHDI)
• Fiscal data per SS: income in 2005
• Education data per SS: in 2001
4.4.3 Selection of data (sampling procedure)
A two-step sampling procedure was performed.
Step 1: Selection of the sample of prescribers
A stratified random sample of 10% of all prescribing GPs and 5% of all prescribing specialists was selected in Pharmanet, 2008. The stratification factor was a grouping of the speciality: GP, cardiologist, gynaecologist, etc. To exclude occasional prescribers (physicians without a practice but who can prescribe for themselves and relatives), prescribers with less than 200 prescriptions in 2008 were not included in the sample (100 prescriptions per semester is the lower limit used by the NIHDI to include a prescriber in the feedback on low cost drugs). Dentists were not included in the study.
Step 2: Selection of the sample of patients
For each of the prescribers selected in step 1, all patients who received a prescription from that physician were identified. Next, all pharmaceutical products delivered in 2008 (in ambulatory setting) to those patients were selected from Pharmanet.
4.4.4 Coupling procedure and authorisation from the Privacy Commission
Two coupling procedures were necessary in this project:
1/ coupling of the information contained in the NIHDI database “Health care provider characteristics” to the prescriber identifier in the Pharmanet database;
2/ coupling of the identifier of each patient’s statistical sector to the information in the database “Information per SS”.
These linkages of data at the individual patient level have been approved by the Privacy Commission. The authorisation can be accessed at http://www.ksz-bcss.fgov.be/nl/bcss/page/content/websites/belgium/security/security_06/security_06_01.html.
4.4.5 Selection and construction of socioeconomic variables
The explanatory variables analyzed in this study have been grouped into 6 main categories:
1. Demographic variables
• Age and gender. Information on the exact year of birth for all individuals is available in the IMA dataset. For the purpose of the analysis a categorical variable regrouping individuals in 4 age groups was created (18 to 44; 45 to 64; 65 to 74; 75 and more).
• Flag for patients in a rest or nursing home for the elderly
2. Socioeconomic variables
42 Reference Price System KCE reports 126
Socioeconomic variables at the patient level were constructed using the IMA database which contains a wide range of information on patients’ characteristics. Those variables are:
• Entitlement to increased reimbursement of co-payments
• Work status
The economic activity variable provides information on individuals’ employment status. It makes a distinction between students, unemployed (different categories), working (different categories), invalid (=incapacity for work>1 year), registered in the National Register, pensioners and handicapped. Children are not classified because not selected in this study.
Patients are categorized as follows:
Not working:
• Children above the age of 18 + students higher education
• Pensioners
• Unemployed (3 categories)
• Invalids + handicapped
• Registered in National Register79
Working
• Blue collar
• White collar
• Public sector
• Self-employed
1. Variables indicating choices of patients in the health care system. These variables are:
• Patient is in a MM/WG (lump sum). Patients inscribed in a MM/WG not financed by a lump sum but with fee-for-service cannot be identified in the database. The same is true of patients treated in a group practice (“pratique de groupe/groepspraktijk”).
• Patient has a GMR
2. Morbidity variables
• Patient entitled to lump sum for chronic illness.
3. GP demographic variables
• Age and gender. Information on the age for all GPs is found in the NIHDI dataset. For the purpose of the analysis a categorical variable regrouping individuals in 4 age groups was created (25 to 34; 35 to 44; 45 to 54; 55 and more).
4. Small area information variables
Area level information is used because the dataset does not include information on individual income and education level. The geographical unit used was the statistical sector.
• The median taxable income of the SS of the patient, divided in 5 groups (Table 12).
KCE Reports 126 Reference Price System 43
Table 12: Lower and upper limits in € to define income quintiles (based on SS median income) Quintile Lower limit Upper limit
• The education level of the SS of the patient was aggregated using the International Standard Classification of Education (ISCED).80 We used the share of individuals having attained post-secondary education (ISCED 4 and 5) over the total population aged 18 years or more.
Table 13: Education quintiles Quintile Minimum Maximum
4.4.6 Selection of patients and of pharmaceutical products
The analyses aim at answering the following questions:
1. Are characteristics of patients and physicians associated with the choice between drugs which have the same active ingredient but for which an original (incurring an additional cost for the patient) and a low cost version exists (often a generic without reference supplement)?
2. Within a group of active ingredients classified within the same therapeutic/pharmacological/chemical cluster, which patient and physician characteristics are associated with the choice of the “least costly” drug(s)? This includes, but is not limited to, low cost drugs as defined by the NIHDI (drugs without a reference supplement).
For these two questions, only adult patients were selected in the analysis. Three reasons underlie this choice. First, the majority of the drugs selected in the analysis are indicated for adults (and are given exceptionally to children for very specific indications). Second, some socioeconomic characteristics are defined only for adults (working status is the most important one) and are not defined for children. Third, and most importantly, children do not make decisions on the use of low cost drugs.
Two different samples were used to answer the above questions. We briefly explain how the samples were obtained and the validation procedure.
4.4.6.1 For the same active ingredient, choice between drugs with and without a reference supplement
We selected clusters in the RPS where a choice between a low cost drug (generic or original brand that reduced its price) and a brand drug exists. The cluster selection was made in several steps:
Step 1: From the baseline data to drugs in the RPS
In the initial sample selection all pharmaceuticals were included. In this specific analysis, we included only drugs within the reference price system.
Step 2: Excluding clusters (ATC5) containing only low cost drugs
All clusters containing only low cost drugs were excluded from the analysis.
44 Reference Price System KCE reports 126
Step 3: Validation of clusters
In addition, the following exclusion criteria were applied to improve the homogeneity of the data for the final analysis:
1. Few prescriptions: A03FA01 metoclopramide (32 prescriptions) and J01GB01 Trobamycine (7 prescriptions);
2. Groups were the reference supplement represents less than 1% of the total amount paid by patients in 2008 (see 4.2.2): drugs from ATC B, L and S: B01AC07 dipyridamole (53 prescriptions), L01BC02 fluorouracil (506 prescriptions), L01DC01 bleomycin (97), L02AB02 medroprogesterone (108 prescriptions), S01BA07 fluorometholone (1 163 prescriptions), S01BC03 diclofenac (607 prescriptions), S01ED01 timolol (3 320 prescriptions);
3. Specific pharmaceuticals (for instance, having very few low cost alternatives): M04AA01 allopurinol (16 263 prescriptions). This group was excluded because only 14 prescriptions were made using a brand drug (alpuric caps 90*300mg). Outside these prescriptions, this is a low cost cluster.
4.4.6.2 Within a class of drugs (ATC-4 or ATC-3), choice of the “least costly” molecule
This section explains which pharmaceutical products were selected for the analysis, and how groups of patients, based on their drug consumption, were constructed. This grouping of pharmaceutical products was not based on proven clinical equivalence of drugs, nor on similar safety and adverse reactions profile, but on the fact that these drugs belong to the same ATC-4 category, and are prescribed for similar indications (based on the “Repertoire commenté des medicaments”, CBPI, BCFI, v2009).
The starting point of the drug selection was the 2009-2010 agreement between physicians and sickness funds50, in which there is a commitment to initiate therapies with the “least costly” molecule(s) (the description of this agreement is in section 2.4.6.1). This agreement relies on the implicit hypothesis that drugs within selected clusters have the same therapeutic effect. We selected the following classes: PPI, statins and Agents acting on the rennin-angiotensin system (ACE+sartans). Not surprisingly, clusters selected in the agreement are those that are also used by countries with a Level 2 or Level 3 RPS. We thus also included in this analysis an example of drugs not mentioned in the 2009-2010 agreement, but which are currently used in a Level 2 or Level 3 RPS in other countries: the class of dihydropyridines. For that group, the two active ingredients with the lowest expenditures per DDD were selected as the less costly molecules.
The selection of clusters is presented in Table 14, together with the identification of the “least costly” molecule(s).
Table 14: Clusters of drugs selected in the analysis of the choice of the “least costly” molecule(s)
Cluster ATC ATC-level Identification of the “least costly” molecule(s) (based on NIHDI expenditures)
1. Proton pump inhibitors A02BC ATC-4 Omeprazole, lanzoprazole 2. Agents acting on the rennin-angiotensin system
C09 ATC-3 All ACE (C09AA, C09BA, C09BB) and not sartans (C09CA, C09DA)
4.4.7.1 Analysis of the choice between a high cost original and a low cost alternative
For each of the drugs clusters selected in this analysis, the percentage of low costs prescriptions was computed separately for GPs and specialists (across all specialities). For the computation of the overall rate of low cost prescriptions (i.e. for GPs and specialists), a weighted average was used, using double weight for specialists to account for the difference in the sampling ratios (10% for GPs and 5% for specialists).
Logistic regression models were used to assess associations between patients’ and physicians’ characteristics and the probability of a prescription of a low cost drug. As patients usually receive more than one prescription over the year, the method of Generalized Estimating Equations (GEE) was used to adjust the variance of each parameter estimate for the clustering of prescriptions within patients. As this method does not allow adjusting for more than one level of clustering, variance estimates for physicians’ characteristics, as well as those of small area characteristics might be underestimated.
All factors, but one, described in the previous section (4.4.5) were included in the final model, whether statistically significant or not. This choice was made to allow proper comparisons of effects across all drugs analyzed. Odds ratios and 95%CI were derived from these regression models. P-values presented are those of the effect of the factor as a whole (i.e. testing if there is any difference between all levels of the factor), and not p-values from pairwise comparisons (testing each level of the factor to a reference category).
Analysis of the model robustness revealed collinearity problems between the two small area characteristics: income and education. In our sample, correlation between these two factors equalled 0.6. Sensitivity analyses revealed that the education level was more discriminatory than the income level, and thus only the education level of each patient’s small area was used in the final models.
The association of low cost prescription and explanatory factors was not performed separately for all drugs clusters (because it would make the interpretation very difficult), nor were all those clusters pooled to perform one global analysis (because the results would be a mix of different, probably conflicting, effects). Instead, we chose to select a list of 12 clusters across 7 ATC-1 groups, and we analyzed these 12 clusters in detail. Most used molecules within a class, or very specific molecules (for instance mostly prescribed by GPs or by specialists, or not recommended for INN prescription) were thus chosen for further analysis.
4.4.7.2 Analysis of the less costly molecule(s) within a class of drugs
For this second analysis, the unit of the analysis was the patient and not the prescription. This observation unit better reflects the therapeutic choice of each prescriber, because different active ingredients within a class may require a very different number of prescriptions to achieve a similar therapeutic effect. Patients having received different active ingredients from the same class of drugs are not included in the analysis for the same reason. Because the unit of analysis was the patient, each patient was assigned to one prescriber only, namely the one who prescribed him/her the highest number of prescriptions. This was done separately for each type of drug class.
All market share information (in DDD) and expenditures (for NIHDI and for patients per DDD) in 2008 are based on the total Pharmanet data. All distributions of patients across active ingredients within a class and all regression results are based on our sample of Pharmanet data.
The same logistic model as mentioned above was used to assess which patient, physician and small area information is associated with the choice of the less costly molecule(s) within a class of drugs.
46 Reference Price System KCE reports 126
4.5 RESULTS
4.5.1 Selection of prescribers and patients
A total of 1 299 prescribers (having prescribed at least 200 prescriptions in 2008) were selected for this study: 826 GPs (random sample of 10% of all prescribers) and 730 specialists (stratified sample of 5% of all prescribers). All data are based on pharmaceuticals consumption in 2008.
For these 1 299 prescribers all prescriptions for their adult patients were selected in the sample. This corresponds to a total of 670 252 adult patients, and a total of 5 505 493 prescriptions.
4.5.2 Choice between high price/low cost drugs
4.5.2.1 Descriptive results per ATC-5 and prescriber specialty
A total of 1 526 084 prescriptions distributed in 7 ATC-1 groups were included in the analysis. Table 15 presents the percentage of low cost prescriptions by ATC-5 and prescriber specialty. This corresponds to 66 different active ingredients, distributed over 7 ATC-1 groups.
Drugs in Group ATC A-Alimentary tract and metabolism
Only 5 active ingredients in the ATC group A had an original drug with a reference supplement. In these 5 active ingredients, prescription of low cost drugs amounted to 67.1% of GPs prescriptions and 53.2% of specialists prescriptions.
Among these molecules, the most prescribed ingredient is gliclazide, an oral antidiabetic drug, which belong to reimbursement class A. Hence, patients receiving the original version of glicazide have to pay the reference supplement but no co-payment. 70.6% of prescriptions by GPs and 46% by specialists was a low cost version of glicazide.
The second most prescribed ingredient in this class is a PPI (A02BC): lanzoprazole (A02BC03). This is the only proton pomp inhibitor which has an original molecule that has not aligned its price. 64.5% of GPs prescriptions and 48.2% of specialists prescriptions were low cost.
Drugs in Group ATC C-Cardiovascular system
23 active ingredients had original versions that did not align their prices. Prescription of low cost alternatives was very low for flecainide (C01BC04) (13% by GPs and 7.2% by specialists) and amiodarone (C01BD01) (21.0% by GPs and 12.3% by specialists). Both molecules have a narrow therapeutic margin which might explain the low prescription rates of low cost alternatives.5
Among the group of diuretics (C03BA, C03CA), large differences in prescription of low cost drugs exist: from 11.1% for chlortalidone to 62.7% for indapamide by GPs. The same pattern was found for specialists.
In the class of beta-blockers (C07), a reference supplement is due for 9 active ingredients. Among these, bisoprolol is the most prescribed (plain or in association with diuretics), with high low cost prescription rates: 86.8% of prescriptions by GPs and 85.7% by specialsits (for biosoprolol plain).
For calcium channel antaganosist (C08), the most prescribed molecule (amlodipine) has reduced its price to the reimbursement basis. Felodipine and diltiazem have low rates of low cost prescriptions, which is not the case for nifedipine.
Captopril is the only ACE (C09) which may entail a reference supplement for the patient. Prescriptions of low cost drugs are high (80%).
In the class of fibrates, two active molecules incur a reference supplement. Prescriptions of low cost drugs are low (31% for fenofibrate and 17% for cipofribate).
KCE Reports 126 Reference Price System 47
Drugs in Group ATC G-Genito-urinary system and sex hormones
Only 4 active ingredients of this class might induce payment of the reference supplement. The complexity of the composition of these medications, made them classified as “no switch” drugs in recent Belgium guidelines. 5,f
This implies that from a clinical perspective, once individuals start out on a specific brand name they should not change to an alternative.5
Drugs in Group ATC J-Anti-infective for systemic use
10 active ingredients belong to class. The most prescribed of the group are amoxicillin and enzyme inhibitor. Prescriptions of low cost drugs are high: 83% (82.4% of GP prescriptions, 87% of specialist prescriptions). The high cost original brand in this group has a specific formula (Augmentin Retard) for which there is no generic alternative.
A reference supplement is due for all drugs from the quinolone group (J01FA ).
Drugs in Group ATC M-Musculo-skeletal system
Five active ingredients of ATC class M are included in the selection. They all can be acquired over-the-counter, except for piroxicam which has a low rate of prescription of low cost alternative (20.9% for GPs and 32.3% for specialist prescriptions).
For the ATC M-group as a whole, 46% of GP prescriptions and 55.6% of specialist prescriptions are low cost.
Drugs in Group ATC N-Nervous system
A total of 11 active ingredients belong to this group. Tramadol is the most prescribed painkiller within the group. Prescription rates of low cost alternatives are low: 36% of GP prescriptions and 40% of specialist prescriptions.
Two antileptics (N03) have very low rates of prescriptions of low cost alternatives. This might be due to the fact that carbamazepine has a narrow therapeutic margin.
Prescription rates of low cost alternatives among the groups of antidepressants (N06) vary from 75% for citalopram to 41.8% for trazodone. The most prescribed molecules are citalopram and trazodone. Betahistine is a particular drug as it is prescribed mostly for dizziness.
Drugs in Group ATC R-Respiratory system
Most drugs in this group are prescribed over-the-counter. We found 7 active ingredients in this category having an expensive original brand. The most prescribed is acetylcysteine, which has a low prescription rate of low cost drugs (45%). Cetirizine has a high prescription rate of low cost (74%) and can also be received over-the-counter.
f Nevertheless, switches from original to cheaper alternatives are possible, as there is no compulsory
power in the proposed attribution to the category "no-switch". Some companies have not applied for reimbursement (to be free to fix the price), others have for limited reimbursement (Cx) and for reimbursement for women under 21 (J). For those medications it is recommended to the pharmacist and the prescriber to assure continuity in the delivery of these drugs (Personal communication – Dr. Vander Stichele).
48 Reference Price System KCE reports 126
Table 15: Choice of Low Cost versus High Cost Drug, by ATC-5 and Prescriber Specialty (based on sample of Pharmanet 2008) Prescriber Speciality
GPs Specialists ALL
N = Total number of prescriptions n = Number of prescriptions for low cost
Total R Respiratory system 113979 57464 50.42 6101 3404 55.79 50.94
All 1410459 736318 52.20 115625 60529 52.35 52.22
52 Reference Price System KCE reports 126
4.5.2.2 Selection of molecules in the regression analysis
Among the 66 groups having a high cost brand, we selected 12 groups to analyze the association between the use of low cost alternatives and patients’ and physicians’ socioeconomic characteristics. All drugs having a narrow therapeutic margin, recognized as “no switch”5 or having few prescriptions were excluded from the analysis. Choice of molecules was validated by an expert and is summarized hereafter.
Drugs in Group ATC A-Alimentary tract and metabolism
In this group the two most prescribed molecules, gliclazide and lanzoprazole, were chosen.
Drugs in Group ATC C-Cardiovascular system
Among the group of diuretics (C03BA, C03CA), the most prescribed molecule was analyzed in one group (indapamide) and all other diuretics were taken together as a separate group (chlortalidone, furosemide, torasemide and spironolactone). In the class of beta-blockers (C07), the two most prescribed molecules, bisoprolol and atenolol, were analyzed as one group. Other beta-blockers were analyzed together in a separate group (propranolol, sotalol, metroprolol, acebutol and celiprolol). For calcium channel antaganosist (C08), only diltiazem was analyzed as it was the most prescribed molecule.
Drugs in Group ATC J-Anti-infective for systemic use
Only drugs from the quinolone group (J01FA) were analyzed.
Drugs in Group ATC M-Musculo-skeletal system
All drugs in group M can be received over-the-counter. The only exception is piroxicam. For this reason only this molecule was analyzed.
Drugs in Group ATC N-Nervous system
Tramadol was selected for analysis since it is the most prescribed molecule in this group. Also citalopram was analyzed as it is the most prescribed antidepressant.
Drugs in Group ATC R-Respiratory system
The most prescribed molecule, acetylcysteine, was analyzed.
Table 16 presents data on the reference supplement paid by patients in 2008. Mean reference supplement paid in 2008 for patients in our sample equaled €13.5. Among the molecules selected for the analysis, the mean reference supplement was smaller (€11.5), but for patients using lanzoprazole, diltiazem and ditalopram the mean reference supplement was more than €30.
KCE Reports 126 Distributional effects of the Reference Price System 53
Table 16: Reference supplements paid by patients in 2008 for selected molecules
Results are presented in Table 17 in a “transversal way”. The association between patient and prescriber characteristics and the probability of a low cost drug prescription is not investigated group by group but by characteristic for all 12 groups together. We tried to identify similarities and differences in the use of low cost drugs relating to patients’ and physicians’ characteristics. Only statistically significant results are mentioned hereafter.
Patient demographic and socioeconomic characteristics
Gender differences in the use of low cost drugs were statistically significant in 7 groups (lanzoprazole, indapamide, other diuretics, diltiazem, piroxicam, citalopram and acetylcysteine). Except for lanzoprazole and other diuretics (chlortalidone, furosemide, torasemide and spironolactone), men had a higher probability than women of receiving a low cost drug prescription.
Compared to patients aged 18 to 44 years, older individuals were less likely to use low cost alternatives among 5 groups of drugs (indapamide, diltiazem, piroxicam tramadol and acetylcysteine). Only for altenolol and bisoprolol, older individuals had a higher probability of using low cost drugs.
Residing in a rest or nursing home for the elderly was associated with a higher use of low cost alternatives for lanzoprazole, other diuretics and citalopram. On the contrary, for quinilone and acetylcysteine, the opposite result was found.
Among 5 drug groups, patients entitled to increased reimbursement of co-payments were more likely to use a low cost alternative (indapamide, atenolol, piroxicam, citalopram and acetylcysteine).
Work status was associated to the use of a low cost alternative for indapamide, altenolol and bisoprolol, piroxicam, tramadol, citalopram and acetylcysteine. It can be concluded that unemployed individuals (especially full-time unemployed) are more likely to use low cost alternatives than individuals in employment (see the Appendix for more details).
Compared to more healthy individuals, patients receiving a lump sum for being chronically ill are less likely to use a low cost alternative for indapamide, diltiazem, tramadol and acetylcysteine. For all other drugs groups, this variable was not statistically significant.
54 Reference Price System KCE reports 126
Patient choice: MM and GMR
Interestingly, the two variables reflecting the choice of patients in the health care system were associated with a higher probability of using low cost alternatives in several groups of drugs. Patients enrolled in a “medical house” (MM) financed by lump sum payments, are more likely to receive low cost alternatives in 7 groups: indapamide, atenolol & bisoprolol, other beta-blockers, piroxicam, tramadol, citalopram and acetylcysteine. Also, patients holding a global medical record (GMR) were more likely to use low cost alternatives in 11 out of 12 groups (except for lanzoprazole).
Physician characteristics
Specialists were less likely to prescribe a low cost alternative than GPs, except for quinolone and tramadol.
Physician gender plays a role in prescribing behavior in 5 groups. Compared to female physicians, male doctors prescribe more low cost alternatives for altenolol & bisoprolol, piroxicam and less low cost alternatives for quinolone, citalopram and acetylcysteine.
Physician age was also associated with prescribing behavior. Compared to younger doctors (less than 35 years) those aged more than 55 were less likely to prescribe low cost drugs. This result was statistically significant in 8 groups (lanzoprazole, other diuretics, atenolol & bisoprolol, diltiazem, piroxicam, tramadol, citalopram and acetylcysteine). This tendency was less clear-cut when comparing prescribing behavior of low cost drugs by younger doctors with that of physicians in other age groups (36-45 and 46-55). Only for quinolone and diltiazem younger physicians were less likely to prescribe low cost alternatives.
Education by SS
Patients living in small areas with low education levels were more likely to use low cost alternatives for 7 types of drugs: other diuretics (chlortalidone, furosemide, torasemide and spironolactone), atenolol & bisoprolol, other beta-blockers (propanolol, sotalol, metroprolol, acebutol and celiprolol), quinolone, piroxicam, tramadol and citalopram. Only for acetylcysteine the opposite result was found: individuals living in more educated areas were more likely to use a low cost alternative.
KCE Reports 126 Reference Price System 55
Table 17: Patient and physician characteristics and use of low cost drugs: analysis for 12 molecules A
Odd ratios in bold are statistically significant. Exact p-values and other statistics can be found in the appendix.
KCE Reports 126 Reference Price System 57
4.5.3 Socioeconomic characteristics of patients or physicians and therapeutic reference pricing: evidence in the literature
Of the studies that considered the impact of the RPS on adherence to the system, health outcomes or the use of health services, only 4 studies were found that also treated a possible differentiated effect according to certain patient characteristics.27, 57, 61,
81 These studies are all based on data for adults aged 65 and older living in British Columbia (Canada). It is important to mention that British Columbia implemented a RPS based on therapeutic equivalence of drugs within clusters (Level 2 – see Chapter 2). In the same way, although there is a vast literature on factors influencing physicians’ awareness of cost for patients82, only one study was found that considered how physician characteristics can affect patients’ adherence to the RPS.65 This study is also based on data from British Columbia. Hereafter, we provide more details on the results from these studies.
Hazlet et al. (2002)81 investigated the effect of the introduction of a reference pricing policy for histamine2 (H2RA) receptor antagonist and proton pomp inhibitors (PPI) on the use of health services by senior citizens. After controlling for patients’ socioeconomic characteristics, they found no effect of the introduction of the RPS on the use of health services.
Two studies assessed whether patient characteristics were associated with a differentiated impact of the RPS on health outcomes27 and the use of health services61 for angiotensin-converting enzyme inhibitors (ACE). Schneeweiss et al. (2002)27 found that compared to high income patients, those on low and middle income were more likely to switch to the less expensive drug (the reference drug) or to switch from the expensive ACE drug (having a reference supplement ) to another antihypertensive therapy. However, the authors also mentioned that before and after the introduction of the RPS stopping any antihypertensive treatment was more likely for low income patients. The probability of stopping treatment was not higher after the implementation of the RPS. The second study explored the impact of the RPS on the use of health services for individuals receiving an ACE therapy. The study controls for patient socioeconomic characteristics. The authors found no association between patient characteristics and the impact of the RPS on physician visits, hospitalization, admission to long-term facilities and mortality.
Schneeweiss et al. (2003)57 analyzed the use of dihydropyridine calcium channel blockers (CCB) and the use of health services after the introduction of the RPS. They found that low-income patients had on average a higher probability to switch to the no-cost dihydropyridine CCB (reference drug) or to switch from the expensive CCB drug (having a reference supplement) to another antihypertensive therapy (nitrates). Patient characteristics were found not to be associated to the impact of the RPS on physician visits, hospitalization and admission to long-term facilities.
Finally, one study65 investigated the effect of physician gender on changes in prescribing patterns of angiotensin-converting enzyme (ACE) inhibitors after the introduction of reference pricing for prescription drugs in British Columbia. The authors found that patients of female physicians were more likely to remain on cost-sharing ACE inhibitors with an exemption. The authors argued that this difference might be related to the fact that female physicians are more responsive to their patients’ requests.
58 Reference Price System KCE reports 126
4.5.4 Choice of the “least costly” molecule(s) within a class
4.5.4.1 Expenditures per DDD and market share for all active ingredients within the 4 selected classes
Table 18 gives the expenditures per DDD (total, NIHDI, patient) and the market share for each active ingredient belonging to the classes included in the analysis: PPI, statins, ACE and sartans, and dihydropyridines derivatives. The lines in green indicate the “least costly” molecule(s), as identified by the NIHDI for the three first groups, and based on the two active ingredients with lowest expenditures for the last group.
Proton pump inhibitors (PPI)
There are 5 different active ingredients in the therapeutic class of proton pump inhibitors (ATC-4 A02BC): omeprazole, pantoprazole, lanzoprazole, rabeprazole and esomeprazole.
On average the cost for one PPI DDD was €0.84 in 2008: €0.64 for the NIHDI and €0.20 for the patient. In 2008, three out of 5 PPI were included in the reference price system: omeprazole, lanzoprazole and esomeprazole. Omeprazole and lanzoprazole are the cheapest active ingredient molecules per DDD (€0.58 and €0.74 per DDD), and comprise 77.3% of the market share. Esomeprazole (€1.32 per DDD, 7.6% of market share) had no generic version available, but was nevertheless included in the RPS due to its nature of isomere of omeprazole (see section 2.4.2). This is a very special case of a low cost original without a generic alternative. In 2008, there was no low cost alternative for pantoprazole (€1.88 per DDD, 14.1% of market share) and rabeprazole (€1.94 per DDD, 1.0% of market share). This situation changed in March 2009, as a generic and also low cost original drug are now available for pantoprazole.
Statins
There are 5 different active ingredients in the therapeutic class ATC-4 C10AA: simvastatin, pravastatin, fluvastatin, atorvastatin and rosuvastatin.
For the two molecules in the reference system, simvastatin (€0.29 per DDD) and pravastatin (€0.50 per DDD), low cost alternatives included generic and low cost original products. For fluvastatin (€0.72 per DDD), rosuvastatin (€0.81 per DDD) and atorvastatin (€1.28 per DDD), there was no low cost alternative.
Agents acting on the renin-angiotensin system
Agents acting on the renin-angiotensin system (ATC-C9) include angiotensin conversion inhibitors (ACI) and angiotensin ii antagonists (sartans).
The subgroup of angiotensin conversion inhibitors (ATC C09AA) includes 9 active ingredients. For enalapril, lisinopril, perindopril, ramipril and quinapril, all products have a low cost alternative (either generic or low cost original). For cilazapril and fosinopril, there is no low cost alternative. For captopril, there is a low cost generic alternative.
The subgroup C09BA includes combinations of ACE and diuretics (6 combinations), the subgroup C09BB includes combinations of ACE and calcium channel blockers.
Angiotensin ii antagonists are included in subgroup C09CA, and in C09DA in combination with diuretics. None of the angiotensin ii antagonists has a low cost alternative.
The total cost per DDD is €0.32 for ACE and €0.67 for sartans.
Dihydropyridines derivatives
All calcium antagonists are classified under ATC-2 “C08 Calcium channel blockers”. This class has three main subgroups: dihydropyridines derivatives (ATC C08CA), verapamil (ATC C08DA) and diltiazem (ATC C08DB). This selection focuses on the class of dihydropyridines derivatives, which includes 11 active ingredients (01 amlodipine to 13 lercanidipine). Among the selection of 11 active ingredients, 3 have a low cost alternative: amlodipine, felodipine and nifedipine.
KCE Reports 126 Reference Price System 59
Table 18: Expenditures per DDD, market share and less costly molecules for 4 classes of drugs (2008)
Within Reference
Original Expenditure per DDD
Market Share
ATC5 Name system Low Cost
NIHDI
Out-of-pocket
Total DDD 2008 (%)
A02BC Proton pump inhibitors
A02BC01 omeprazole yes yes 0.44 0.14 0.58 72.31
A02BC03 lanzoprazole yes no 0.52 0.22 0.74 4.97
A02BC05 esomeprazole yes yes 1.02 0.30 1.32 7.60
A02BC02 pantoprazole no - 1.47 0.41 1.88 14.11
A02BC04 rabeprazole no - 1.10 0.84 1.94 1.01
All 0.64 0.20 0.84 100.00
C10AA ‐ Hmg coa reductase inhibitors (statin)
C10AA01 simvastatin yes yes 0.23 0.07 0.29 42.14
C10AA03 pravastatin yes yes 0.40 0.11 0.50 10.93
C10AA04 fluvastatin no - 0.57 0.15 0.72 1.92
C10AA07 rosuvastatin no - 0.66 0.15 0.81 18.85
C10AA05 atorvastatin no - 1.09 0.19 1.28 26.16
All 0.56 0.12 0.68 100.00
C09 Agents acting on the renin‐angiotensin system
C09AA02 enalapril yes yes 0.10 0.03 0.13 2.30
C09AA05 ramipril yes mixed 0.13 0.04 0.16 15.27
C09AA03 lisinopril yes yes 0.16 0.04 0.20 17.08
C09BA02 enalapril and diuretics
yes yes 0.20 0.06 0.26 0.51
C09AA06 quinapril yes yes 0.20 0.06 0.26 2.55
C09AA08 cilazapril no - 0.27 0.08 0.34 0.36
C09AA01 captopril yes no 0.26 0.09 0.35 1.98
C09BA03 lisinopril and diuretics
yes yes 0.34 0.10 0.44 3.74
C09BA06 quinapril and diuretics
yes yes 0.35 0.10 0.45 0.39
C09BA05 ramipril and diuretics
yes yes 0.39 0.11 0.50 0.20
C09AA04 perindopril yes yes 0.40 0.11 0.51 15.30
C09AA07 benazepril no - 0.42 0.12 0.54 0.00
C09BB05 ramipril and felodipine
no - 0.42 0.12 0.55 0.54
C09AA09 fosinopril no - 0.55 0.16 0.71 0.12
C09BA04 perindopril and diuretics
no - 0.70 0.21 0.90 2.71
C09BA08 cilazapril and diuretics
no - 0.75 0.22 0.97 0.06
subtotal ACE 0.25 0.07 0.32 63.14
C09CA06 candesartan no 0.35 0.07 0.41 3.82
C09CA07 telmisartan no 0.43 0.07 0.50 3.39
60 Reference Price System KCE reports 126
C09CA03 valsartan no 0.43 0.07 0.51 4.48
C09CA08 olmesartan no 0.42 0.09 0.52 2.80
C09CA04 irbesartan no 0.48 0.08 0.56 4.91
C09DA08 olmesartan medoxomil and diuretics
no 0.53 0.13 0.66 0.62
C09CA01 losartan no 0.59 0.09 0.68 4.62
C09CA02 eprosartan no 0.56 0.13 0.69 1.35
C09DA02 eprosartan and diuretics
no 0.58 0.13 0.70 0.44
C09DA06 candesartan and diuretics
no 0.68 0.13 0.81 1.41
C09DA01 losartan and diuretics
no 0.82 0.13 0.95 2.25
C09DA03 valsartan and diuretics
no 0.83 0.14 0.96 2.08
C09DA07 telmisartan and diuretics
no 0.86 0.13 0.99 1.29
C09DA04 irbesartan and diuretics
no 0.90 0.13 1.03 2.76
C09DB01 valsartan and amlodipine
no 0.98 0.14 1.11 0.65
subtotal sartan 0.57 0.10 0.67 36.86
C08CA Dihydropyridine derivatives
C08CA01 amlodipine yes yes 0.21 0.06 0.27 65.4
C08CA02 felodipine yes no 0.20 0.09 0.29 3.9
C08CA05 nifedipine yes mixed 0.30 0.12 0.42 8.0
C08CA12 barnidipine no 0.39 0.11 0.51 9.2
C08CA13 lercanidipine no 0.41 0.12 0.53 10.0
C08CA03 isradipine no 0.54 0.15 0.70 1.0
C08CA09 lacidipine no 0.55 0.15 0.70 1.1
C08CA08 nitrendipine no 0.65 0.18 0.83 0.1
C08CA04 nicardipine no 0.69 0.19 0.88 0.1
C08CA07 nisoldipine no 0.86 0.24 1.09 1.1
All 0.27 0.08 0.35 100.0
4.5.4.2 Percent of patients using the “least costly” molecule(s) within a class of drugs
The share of patients by active ingredient within the four classes of drugs is presented in appendix. The text below summarizes the information.
PPI
A total of 71 315 patients were included in the sample. The two cheapest molecules were prescribed to 72% of those patients: 67.2% with omeprazole and 4.8% with lanzoprazole.
Statins
A total of 84 694 patients were included in the sample. The two cheapest molecules were prescribed to 59.6% of those patients: 49.6% with simvastatin and 10% with pravastatin.
KCE Reports 126 Reference Price System 61
Agents acting on the renin-angiotensin system
A total of 83 633 patients were included in the sample. The cheapest molecules, i.e. the ACEs, were prescribed to 65.7% of the included patients: 74.5% for patients treated by specialists and 64.7% for patients treated by GPs.
Dihydropyridine derivatives
A total of 38 329 patients were included in the sample. The cheapest molecules, i.e. amlodipine and felodipine, were prescribed to 65.1% of them..
4.5.4.3 Socioeconomic characteristics associated with the use of the “least costly” molecule(s)
As mentioned in section 4.5.3, some studies have analyzed the impact of the RPS on several outcome measures according to patient and physician socioeconomic characteristics. In this section, the same approach was used to analyze the RPS in Belgium. The results of the analysis of the association of patient and physician characteristics are summarized below and are detailed in appendix.
Demographic patient characteristics influence the odds of receiving the “least costly” molecule: for PPI and statins, female patients have a larger probability of receiving the “least costly” molecule(s) than male patients, but the opposite holds for ACE/sartans and dihydropyridine derivatives. Age is also associated with the use of the “least costly” molecules: younger patients received more the “least costly” molecule(s) for PPI and ACE/sartans. For statins and for dihydropyridine derivatives, there is no clear trend for the effect of age. However, for the 4 drug classes, elderly patients in a rest or nursing home are more likely to receive the “least costly” molecules.
As far as socioeconomic characteristics are concerned, patients entitled to increased reimbursement of co-payments have a higher probability of receiving the “least costly molecule(s) than patients who are not entitled. This is true for PPI, statins and ACE/sartans. For work status, statins are the only class for which unemployed patients are more likely to receive the “least costly” molecule(s) than employed patients.
For the two variables reflecting the choice of patients in the health care system, one reveals a high difference in the use of the “least costly”molecule: patients enrolled in a “medical house” financed by lump sum payments received more the “least costly” molecule(s) than other patients, for the 4 classes of drugs. There is no association between holding a global medical record and the use of the “least costly” molecule, except for ACE/sartans (rates are lower for patients with a GMR).
Morbidity variables show that patients receiving a lump sum for chronic illness also receive more the “least costly” molecule(s) than those who do not receive these lump sums. This result holds for the 4 classes of drugs.
Physician characteristics also influence the prescription of the “least costly” molecule(s). GPs prescribe more the “least costly” molecule(s) for PPI and statins. The reverse is true for ACE/sartans. For dihydropyridine derivatives there is no association with specialty. Physician gender and age are also associated with the prescription of the “least costly” molecule(s), but there are no consistent patterns across the 4 groups: for the statins and ACE/sartans, older physicians prescribe less the “least costly” molecule(s). The reverse is true for PPI.
Education plays a moderate role, but effects are contrasted across drug classes. Patients under PPI or under ACE/sartans living in small areas with low education levels are less likely to receive the “least costly” molecule(s). The opposite is true for patients under statins. For the class of dihydropyridine derivatives no clear pattern was observed.
62 Reference Price System KCE reports 126
4.5.5 Appraisal of results: barriers to low cost drugs
An obvious question which arises from the results of the analysis of the Belgian RPS is why physicians prescribe high cost drugs when cheaper alternatives are available. Especially in a system of generic reference pricing with narrowly defined clusters potential differences in clinical effectiveness of high and low cost drugs can be regarded as negligible. To get some idea about the underlying factors associated with prescribing behaviour in Belgium, and more specific with the choice of high or low cost drugs, we searched for surveys on this topic.
A number of surveys have been carried out in Belgium on the perception of generic drugs and the role of the pharmacist. The most recent survey (including a “mystery shopping” in pharmacies) was organized in 2009 by CRIOC/OIVO (Centre de Recherche et d'Information des Organisations de Consommateurs/Onderzoeks- en Informatiecentrum van de Verbruikersorganisaties) at the request of the Socialist sickness funds. The survey included 325 consumer interviews and 32 visits to a pharmacy. The main objective of the survey was to measure the barriers on the use of low cost drugs by patients and pharmacists (French speaking). The results of the survey suggest that 90% of consumers are aware of the existence of low cost drugs and even tend to overestimate the price differential (estimated on average at 60%). Results also show that there is a high level of trust (or is it docility?) in the relationship prescriber-patient: only 40% of consumers asked their physician to prescribe a low cost drug, and only 15% asked to modify a high cost prescription into a low cost one. Also a clear role of the pharmacist came out of the survey: low cost drugs were simply not visible to the consumer, while high cost drugs were. Low cost drugs were proposed spontaneously by the pharmacist in only 3% of the cases (this was tested with an over-the-counter painkiller). When the consumer explicitly asked for a low cost drug, this was refused by 9% of the pharmacists.
A survey on the “perception of generic drugs by Belgian GPs” was organized by Febelgen in 2009 among 120 GPs (French- and Dutch-speaking equally represented). This survey showed that 90% of the GPs have positive perceptions about generic drugs. Reasons to prescribe an original drug include that the price of the original is the same as the price of the generic alternative (43%), that the patient explicitly asked for an original drug (29%), a certain reticence on quality (21%), or because it concerns very specific therapeutic indications (such as anti-epileptic or anti-depressive agents, 19%). The survey also revealed that 60% of GPs are reticent to generic drugs if they are considered as being a “Narrow Therapeutic Index Drug”, defined as drugs for which the difference between the active dose and the toxic (or lethal) dose is minimal, and for which the concentration of the drug in the blood is critical. There is no regulatory consensus across countries about which drugs belong to this category. Finally, 30% of the GPs are concerned about differences in the excipients increasing the risk of adverse events (such as allergies), despite strict European regulations on the use of only well-defined, known excipients in the formulation of medicines.
Another study was done by Test-Achat/Test-Aankoop in 2009 in 148 pharmacies, to assess the way INN prescriptions are handled by pharmacists. The study showed that the majority of pharmacists comply with their legal obligation to deliver a low cost drug (without reference supplement for the patient), but that only 12% of pharmacists deliver the cheapest drug.
KCE Reports 126 Reference Price System 63
5 SUMMARY, CONCLUSION AND DISCUSSION This study shows that almost all European countries use the reference price system as a mode of reimbursement of ambulatory pharmaceuticals. The modalities are however different. The Belgian RPS, started in 2001, is different from other countries on two points. First, the way the reference price level is calculated depends only on the price of the originator product, on which a certain percentage reduction applies. In all other countries reviewed, the price of the generic drugs is somehow taken into account. An analysis of the impact on the price of pharmaceuticals of this choice was beyond the scope of the study, but a recent MORSE report (Monitoring Of Reimbursement Significant Expenses) from the NIHDI showed that the price of original off-patent drugs was on the average of the European Union, and much higher than prices in the Netherlands.83 The second point on which the system differs is the limited role attributed to pharmacists in Belgium. The pharmacist has to dispense a low cost medication only when prescriptions are written in INN. This is the case for 3% of the prescriptions.84 Compared to the UK rate of 80%, one can say that there is room for improvement. In all countries reviewed, the pharmacist has a substitution right. The way pharmacists are remunerated (per item or based on a percent of the price) is also an important factor determining prescription of low-cost alternatives. It is difficult to assess whether the new remuneration system (effective from April 2010) will have an impact on the use of generic medicines.
The Belgian RPS is a generic reference pricing. Basically, all countries have opted for a generic RPS, although some of them have gone one step further by extending for some groups the clusters to pharmacologically equivalent drugs (for instance all statins are included in one cluster). Two countries, Germany and Italy, even include in clusters drugs not pharmacologically equivalent but having a similar therapeutic effect. Beside the fact that this system generates further savings for the third-party payer, limiting reimbursement to the cheapest drug in the cluster raises questions about the real impact on patient health, about possible shifts in prescriptions from reference drugs to drugs outside reference groups and about possible reactions of drugs companies (withdrawal from the market). The results from our literature review on the impact of RPS tend to show no negative impact on patient health. However, caution is needed as assessing the impact of a RPS on outcome measures is challenging since the implementation of a RPS is normally not a stand-alone policy measure. Most of the time the introduction of reference pricing is just one of a series of measures to contain costs or to steer patients to cheaper or clinically more effective drugs based on guidelines, which makes it difficult to isolate statistically the impact of the RP system. In Belgium, guidelines on the use of simvastatin changed concurrently with the introduction of low cost statins. Most of the studies included in the reviews were for senior citizens in British Columbia. But results found in one country are not necessarily transferable to other settings.
Moreover, the impact of a RPS depends to a large extent on the particular design parameters of the system. The large majority of papers deals with the impact of a therapeutic RPS, whereas in Belgium a generic RPS is in place. Whereas with therapeutic reference pricing patient health is a major cause of concern, with generic reference pricing the impact on drug prices and expenditures are the driving factors for evaluation.
A total of 155 original molecules (ATC-5) on the Belgian market were included in the reference price system in December 2008 (on a total of 732 on the market). For 65 of these molecules (42% of the molecules in the RPS) pharmaceutical companies decreased the public price to the level of the reimbursement basis, so that no reference supplement was to be paid by patients. For the remaining 90 molecules, a reference supplement was due: across all different packages, the median reference supplement was €3.8 per package in 2008.
64 Reference Price System KCE reports 126
In 2008, total out-of-pocket payments for reimbursed pharmaceutical products amounted to €592.41 million of which €60.45 million in reference supplements (10.2% of total out-of-pocket payments). Reference supplements were mostly paid for cardiovascular drugs (€20.54 million, 34% of total reference supplements), nervous system drugs (€11.44 million, 19% of total) and musculoskeletal system drugs (€10.18 million, 17% of total). The share of the reference supplement in total out-of-pocket payments was the highest in musculoskeletal system drugs and genitor-urinary drugs (respectively 30% and 16%).
About one third of the total amount of reference supplements (€60 million in 2008) was caused by the prescription of cardiovascular drugs. A possible explanation could be that physicians are reluctant to prescribe (or switch to) a generic or other low cost alternative for this type of illness because they question the comparability of therapeutic effects. Although it is beyond the scope of this study to elaborate on the interchangeability of generic or other low cost drugs, we briefly summarize the main results of a recent meta-analysis comparing clinical characteristics of generic and brand-name drugs in cardiovascular medicine. The review analyzed all studies published between 1984 and 2008 and also reviewed the content of editorials published on this topic during the same time period. A total of 43 editorials were identified, 23 (53%) expressed a negative view of interchangeability of generic drugs, 12 (28%) encouraged substitution and the remaining 8 did not reach a conclusion. In contrast, evidence from the systematic review of published studies revealed no important clinical differences between generic and brand name drugs used in the treatment of cardiovascular disease.
Reference price systems are usually evaluated in terms of financial gains (or losses) for the third-party payer and for patients. As far as the Belgian pharmaceutical market is concerned, reimbursement from NIHDI for ambulatory drugs included in the reference price accounted for €295 million for original products which lowered their prices and €117 million for original drugs which did not lower their price (2008). The latter group of drugs induces a supplement paid by the patient that amounted to a total of €60 million in 2008. This amount represents 10% of total out-of-pocket payments for reimbursed drugs. In other words, if the prescriber had chosen for a low cost alternative instead of the original brand name, 10% of the patients’ out-of-pocket payments could have been avoided.
Several surveys have been performed in Belgium to study reasons for the use of original drugs versus generic drugs for GPs, patients and pharmacists. Results of those surveys show that the perception of generic drugs among GPs is positive, but that the reasons why they do not prescribe it are varied: price reasons (when the original is at the same price as the generic alternative), because specifically asked by patients, certain reticence on quality, or because it concerns very specific therapeutic indications. Drugs with a narrow therapeutic margin are also a subject of concern for them, as shown in these surveys and in our analysis of 4 drugs with narrow therapeutic margin (flecainide, amiodarone, carbamazepine and oxcarbazepine) and with very limited low cost rates. From patients’ perspective, even though they are aware of the existence of generic drugs, and even though they overestimate the price differential, they are very prudent to ask their prescriber to change the prescription. As far as the role of the pharmacist is concerned, they comply to their legal obligation to dispense low cost drugs when prescription is in INN, but they are absolutely not promoters of generic alternatives: generic OTC products are not put in evidence (visible) in the pharmacy, and they do not propose them spontaneously.
KCE Reports 126 Reference Price System 65
When evaluating the system form the point of view of financial accessibility, a possible differential impact of the system on people with different socioeconomic background should be assessed. Empirical evidence in the international literature on this issue is however very scarce. The assessment in the study of possible unintended distributional consequences of the Belgian reference price system identified no systematic differences in the use of low cost drugs and hence in the reference supplement against less privileged socioeconomic groups. The results are encouraging in terms of overall equity of the RPS since the use of low cost alternatives is higher among more disadvantaged groups. In any case, to avoid inequities among patients, introducing a selective cost sharing measure should be accompanied by measures guaranteeing equal access to information on prices and therapies.
This study has some strengths and limitations. Strengths of the study include the large sample available from recent pharmaceutical consumption (more than 1.5 million prescriptions), and the two linkages at the level of the patient and prescriber that could be performed. However, the availability of socio-economic variables in the database of the sickness funds is rather limited; especially the lack of information on education at the individual level is a drawback. This constraint was partially set off by the use of two characteristics available at the level of the place of residence of the patient: the median income and the median education level.
Although results are encouraging in terms of overall financial accessibility, the €60 million paid on reference supplements in 2008 is not a negligible amount. Especially in case of chronic use, the reference supplements could add up to a considerable sum. Different measures, detailed in the recommendations, could be envisaged by decision makers to further reduce this amount.
66 Reference Price System KCE reports 126
6 BIBLIOGRAPHY 1. Vogler S, Habl C, Leopold C, Rosian-Schikuta I, de Joncheere K, Thomsen TL. PPRI Report.
Gesundheit Österreich GmbH; 2008.
2. Technology NICoHSRaHC: National Library of Medicine;c October 2009 [cited December 2009]. Glossary of Frequently Encountered Terms in Health Economics. Available from: http://www.nlm.nih.gov/nichsr/edu/healthecon/glossary.html
3. European Medicines Agency. Guideline on the investigation of bioequivalence. London: EMEA; 2008. Available from: http://www.ema.europa.eu/pdfs/human/qwp/140198enrev1.pdf
4. European Medicines Agency. Note for guidance on the investigation of bioavailability and bioequivalence. London: EMEA; 2000. Available from: http://www.ema.europa.eu/pdfs/human/qwp/140198en.pdf
5. Vander Stichele R, Bogaert M. Prescriptions en DCI: Propositions pour l'implémentation pratique dans la pratique médicale et dans le dossier médical électronique. Brussels: BCFI/CBIP and FAGG/AFMPS; 2010 03-10.
6. Corens D. Health System Review: Belgium. Health Systems in Transition. 2007;9(2):1-172
7. INAMI/RIZIV Brussel [cited January 2010.]. Budget de l'assurance soins de santé et indemnités/Begroting van de verzekering voor geneeskundige verzorging en uitkeringen. Available from: http://www.inami.fgov.be/information/fr/accounting/budgets/index.htm
8. INAMI/RIZIV Brussel [cited January 2010]. Statistiques de l'INAMI/Statistieken van het RIZIV. Available from: http://www.inami.fgov.be/information/nl/statistics/
9. Lopez-Casasnovas G, Puig-Junoy J. Review of the literature on reference pricing. Health Policy. 2000;54(2):87-123.
10. Goldman DP, Joyce GF, Zheng Y. Prescription drug cost sharing: associations with medication and medical utilization and spending and health. JAMA. 2007;298(1):61-9.
11. Rothberg AD, Blignault J, Serfontein CB, Valodia B, Eekhout S, Pels LM. Experience of a medicines reference-pricing model. SAMJ, S. 2004;Suid-Afrikaanse Tydskrif Vir Geneeskunde. 94(3):183-8.
12. Lee Y-C, Yang M-C, Huang Y-T, Liu C-H, Chen S-B. Impacts of cost containment strategies on pharmaceutical expenditures of the National Health Insurance in Taiwan, 1996-2003. Pharmacoeconomics. 2006;24(9):891-902.
13. Bridgehead International Ltd. London: Bridehead International Ltd [cited January 2010]. Reference Pricing. Available from: http://www.bridgehead.com/page/23/reference-pricing.htm
14. Department of Health Dublin [cited January 2010]. Statement by the Minister for Health and Children. Available from: http://www.dohc.ie/press/releases/2009/20090806.html
15. Dickson M, Redwood H. Pharmaceutical reference prices. How do they work in practice? Pharmacoeconomics. 1998;14(5):471-9.
16. Narine L, Senathirajah M, Smith T. Evaluating reference-based pricing: initial findings and prospects.[see comment]. CMAJ. 1999;161(3):286-8.
17. Danzon PM, Ketcham JD. Reference pricing of pharmaceuticals for Medicare: evidence from Germany, The Netherlands, and New Zealand. Frontiers in Health Policy Research. 2004;7:1-54.
18. Puig-Junoy J. What is required to evaluate the impact of pharmaceutical reference pricing? Applied Health Economics & Health Policy. 2005;4(2):87-98.
19. Aaserud M, Dahlgren AT, Kosters JP, Oxman AD, Ramsay C, Sturm H. Pharmaceutical policies: effects of reference pricing, other pricing, and purchasing policies. Cochrane Database of Systematic Reviews. 2006;2(2):CD005979.
20. Simoens S, De Coster S. Sustaining generic medicines markets in Europe. Journal of Generic Medicines. 2006;3(4):257-68.
21. Miraldo M. Reference pricing and firms' pricing strategies. J Health Econ. 2009;28(1):176-97.
22. Kanavos P, Reinhardt U. Reference pricing for drugs: is it compatible with U.S. health care? Health affairs (Project Hope). 2003;22(3):16-30.
23. Schneeweiss S. Reference drug programs: Effectiveness and policy implications. Health Policy. 2007;81(1):17-28.
KCE Reports 126 Reference Price System 67
24. Brekke KR, Konigbauer I, Straume OR. Reference pricing of pharmaceuticals. J Health Econ. 2007;26(3):613-42.
25. Ioannides-Demos LL, Ibrahim JE, McNeil JJ. Reference-based pricing schemes: effect on pharmaceutical expenditure, resource utilisation and health outcomes. Pharmacoeconomics. 2002;20(9):577-91.
26. Huttin C. Experiences with reference pricing. International Journal of Risk and Safety in Medicine. 2002;15(1-2):85-91.
27. Schneeweiss S, Walker AM, Glynn FJ, Maclure M, Dormuth C, Soumerai SB. Outcomes of reference pricing for angiotensin-converting-enzyme inhibitors. N Engl J Med. 2002;346(11):822-9.
28. Espin J, Rovira J. Analysis of differences and commonalities in pricing and reimbursement systems in Europe. Brussels: European Commission; 2007 June
29. Petkantchin V. Les effets économiques de la politique des "prix de référence" des médicaments en Allemagne. Bruxelles: Institut Economique Molinari; 2006. Cahier de recherche
30. RIZIV/INAMI Brussel [cited January 2010]. Terugbetaling geneesmiddelen. Available from: http://www.riziv.fgov.be/drug/nl/drugs/general-information/refunding/index.htm
31. Schokkaert E, Guillaume J, Lecluyse A, Avalosse H, Cornelis K, De Graeve D, et al. Effects of the Maximum Billing system on health care consumption and financial access to health care - supplement. Equity and Patient Behaviour (EPB). Bruxelles: Belgian Health Care Knowledge Centre (KCE); 2008 2008-07-01. KCE reports 80S (D/2008/10.273/37)
32. Wet houdende maatregelen inzake gezondheidszorg, B.S. 1 september 2001.
33. Wet betreffende de verplichte verzekering voor geneeskundige verzorging en uitkeringen, gecoördineerd op 14 juli 1994, B.S. 27 augustus 1994.
34. Koninklijk besluit tot wijziging van het koninklijk besluit van 21 december 2001 tot vaststelling van de procedures, termijnen en voorwaarden inzake de tegemoetkoming van de verplichte verzekering voor geneeskundige verzorging en uitkeringenin de kosten van farmaceutische specialiteiten, B.S. 31 mei 2002.
35. Koninklijk besluit tot wijziging van het koninklijk besluit van 21 december 2001 tot vaststelling van de procedures, termijnen en voorwaarden inzake de tegemoetkoming van de verplichte verzekering voor geneeskundige verzorging en uitkeringen in de kosten van farmaceutische specialiteiten, B.S. 30 november 2002.
36. Wet betreffende de beheersing van de begroting van de gezondheidszorg en houdende diverse bepalingen inzake gezondheid, B.S. 20 mei 2005.
37. Koninklijk besluit tot wijziging van het koninklijk besluit van 21 december 2001 tot vaststelling van de procedures, termijnen en voorwaarden inzake de tegemoetkoming van de verplichte verzekering voor geneeskundige verzorging en uitkeringen in de kosten van farmaceutische specialiteiten, B.S. 20 juni 2005.
38. Koninklijk besluit tot vaststelling van de procedures, termijnen en voorwaarden inzake de tegemoetkoming van de verplichte verzekering voor geneeskundige verzorging en uitkeringen in de kosten van farmaceutische specialiteiten, B.S. 29 december 2001.
39. Koninklijk besluit tot wijziging van het koninklijk besluit van 21 december 2001 tot vaststelling van de procedures, termijnen en voorwaarden inzake de tegemoetkoming van de verplichte verzekering voor geneeskundige verzorging en uitkeringen in de kosten van farmaceutische specialiteiten, B.S. 17 januari 2006.
40. Wet houdende diverse bepalingen, B.S. 30 december 2005.
41. Koninklijk besluit tot wijziging van het koninklijk besluit van 21 december 2001 tot vaststelling van de procedures, termijnen en voorwaarden inzake de tegemoetkoming van de verplichte verzekering voor geneeskundige verzorging en uitkeringen in de kosten van farmaceutische specialiteiten, B.S. 05 maart 2007.
42. Wet houdende diverse bepalingen (I), B.S. 29 december 2008.
43. Koninklijk besluit tot wijziging van het koninklijk besluit van 3 juli 1996 tot uitvoering van de wet betreffende de verplichte verzekering voor geneeskundige verzorging en uitkeringen, gecoördineerd op 14 juli 1994, B.S. 17 april 2009.
44. Programmawet, B.S. 30 december 2009.
68 Reference Price System KCE reports 126
45. Koninklijk besluit tot wijziging van het koninklijk besluit van 21 december 2001 tot vaststelling van de procedures, termijnen en voorwaarden inzake de tegemoetkoming van de verplichte verzekering voor geneeskundige verzorging en uitkeringen in de kosten van farmaceutische specialiteiten, B.S. 25 januari 2010.
46. Wet houdende sociale, budgettaire en andere bepalingen, B.S. 03 januari 2001.
47. Koninklijk besluit tot wijziging van het artikel 73, § 2, van de wet betreffende de verplichte verzekering voor geneeskundige verzorging en uitkeringen gecoördineerd op 14 juli 1994, B.S. 27 september 2005.
48. Soins de Santé/Geneeskundige verzorging. Prescription en dénomination commune internationale (DCI) - Indiquer les récipés DCI /Voorschrijven op stofnaam (VOS) – Flaggen van recipes. Brussels: INAMI/RIZIV; 2006. Available from: http://www.inami.fgov.be/care/fr/other/pharmacists/general-information/circulars/pdf/circulardci.pdf
49. INAMI-CBIP. Mémento-Pharma. Coût des médicaments: Guide Brussels: INAMI-CBIP; 2008.
50. Akkoord geneesheren - ziekenfondsen 2009-2010, B.S. 19 januari 2009.
51. RIZIV/INAMI Brussel [cited Februari 2010]. Nationaal akkoord NCGZ - evaluatie punt 6. Available from: http://www.riziv.fgov.be/care/nl/doctors/general-information/agreements/2009-2010/pdf/point6.pdf
52. SPF Economie/FOD Economie Brussels [cited January 2010]. Médicaments à usage humain/ Geneesmiddelen voor menselijk gebruik. Available from: http://statbel.fgov.be/fr/entreprises/reglementation_de_marche/Prix_reglementes/Geneesmiddelen/index.jsp
53. Lexchin J, Grootendorst P. Effects of prescription drug user fees on drug and health services use and on health status in vulnerable populations: a systematic review of the evidence. Int J Health Serv. 2004;34(1):101-22.
54. Morgan S, Hanley G, Greyson D. Comparison of tiered formularies and reference pricing policies: a systematic review. Open Medicine. 2009;3(3):131-9.
55. Grootendorst PV, Dolovich LR, O'Brien BJ, Holbrook AM, Levy AR. Impact of reference-based pricing of nitrates on the use and costs of anti-anginal drugs. Canadian Medical Association Journal. 2001;165(8):1011-9.
56. Schneeweiss S, Soumerai SB, Glynn RJ, Maclure M, Dormuth C, Walker AM. Impact of reference-based pricing for angiotensin-converting enzyme inhibitors on drug utilization.[see comment]. CMAJ. 2002;166(6):737-45.
57. Schneeweiss S, Soumerai SB, Maclure M, Dormuth C, Walker AM, Glynn RJ. Clinical and economic consequences of reference pricing for dihydropyridine calcium channel blockers. Clin Pharmacol Ther. 2003;74(4):388-400.
58. Grootendorst PV, Dolovich LR, Holbrook AM, Levy AR, O'Brien BJ. The Impact of Reference Pricing of Cardiovascular Drugs on Health Care Costs and Health Outcomes: Evidence from British Columbia--Volume II: Technical Report. McMaster University, Social and Economic Dimensions of an Aging Population Research Papers. p 165 pages. 2002. Available from: http://socserv2.socsci.mcmaster.ca/~sedap/p/sedap71.pdf
59. Grootendorst PV, Dolovich LR, Holbrook AM, Levy AR, O'Brien BJ. The Impact of Reference Pricing of Cardiovascular Drugs on Health Care Costs and Health Outcomes: Evidence from British Columbia--Volume I: Summary. McMaster University, Social and Economic Dimensions of an Aging Population Research Papers. p 30 pages. 2002. Available from: http://socserv2.socsci.mcmaster.ca/~sedap/p/sedap70.pdf
60. McManus P, Birkett DJ, Dudley J, Stevens A. Impact of the Minimum Pricing Policy and introduction of brand (generic) substitution into the Pharmaceutical Benefits Scheme in Australia. Pharmacoepidemiol Drug Saf. 2001;10(4):295-300.
61. Schneeweiss S, Soumerai SB, Glynn RJ, Maclure M, Dormuth C, Walker AM. Impact of reference-based pricing for angiotensin-converting enzyme inhibitors on drug utilization. Canadian Medical Association Journal. 2002;166(6):737-45.
62. Narine L, Senathirajah M, Smith T. An Assessment of the Impact of Reference-Based Pricing Policies on the H2 Antagonist Market in British Columbia, Canada. Journal of Research in Pharmaceutical Economics. 2001;11(1):63-78.
KCE Reports 126 Reference Price System 69
63. Brekke K, Grasdal A, Holmas T. Regulation and pricing of pharmaceuticals: Reference pricing or price cap regulation? European Economic Review. 2009;53(2):170.
64. Marshall JK, Grootendorst PV, O'Brien BJ, Dolovich LR, Holbrook AM, Levy AR. Impact of reference-based pricing for histamine-2 receptor antagonists and restricted access for proton pump inhibitors in British Columbia.[see comment]. CMAJ. 2002;166(13):1655-62.
65. Duetz MS, Schneeweiss S, Maclure M, Abel T, Glynn RJ, Soumerai SB. Physician gender and changes in drug prescribing after the implementation of reference pricing in British Columbia. Clin Ther. 2003;25(1):273-84.
66. Diels J. Vers des prescriptions qui tiendraient (davantage) compte du coût des médicaments? Les médicaments génériques dans un cadre plus large. Bruxelles: 2004. Alliance nationale des Mutualités chrétiennes
67. Cornelis K. L’influence des mesures prises dans le secteur des spécialités pharmaceutiques ambulatoires remboursables, sur l’évolution des dépenses et des volumes. Bruxelles: Mutualités Chretiennes; 2007. MC 230
68. Cornelis K. L'évolution des dépenses de soins de santé en Belgique. Une dynamique entre la maîtrise des dépenses publiques et la protection financière du patient. Bruxelles: Mutualité Chrétienne; 2006. Dossier thématique MC
69. Benda J, Thorre K. Evaluation économique de la consommation des médicaments 2003-2006. Mutualités Libres; 2007.
70. Laasman J-M, Lange B. Impacts financiers du remboursement de référence. Une actualisation. Bruxelles: 2008 Mai 8.
71. Laasman J-M, Lange B. Impacts financiers du remboursement de référence. Une actualisation. Bruxelles: 2009 Septembre.
72. De Gauquier K, Boutsen M, Hendrickx A, Laasman J-M, Lange B, Joeri G. Impacts financiers du remboursement de référence. Bruxelles: 2003 Septembre.
73. Boersma C, Atthobari J, Gansevoort RT, de Jong-Van den Berg LTW, de Jong PE, de Zeeuw D, et al. Pharmacoeconomics of angiotensin II antagonists in type 2 diabetic patients with nephropathy: implications for decision making. Pharmacoeconomics. 2006;24(6):523-35.
74. Simoens S, De Bruyn K, Bogaert M, Laekeman G. Pharmaceutical policy regarding generic drugs in Belgium. Pharmacoeconomics. 2005;23(8):755-66.
75. Laasman J-M, Lange B. Impacts financiers du remboursement de référence. Une actualisation. Bruxelles: 2006.
76. Simoens S. International comparison of generic medicine prices. Curr Med Res Opin. 2007;23(11):2647-54.
77. Regulation (EC) 1059/2003 of 26 May 2003 on the establishment of a common classification of territorial units for statistics (NUTS). Official Journal of the European Communities 21/06/2003. Available from: http://eur-lex.europa.eu/LexUriServ/LexUriServ.do?uri=OJ:L:2003:154:0001:0041:EN:PDF
78. SPF Economie/FOD Economie. Carrefour de l'Economie. In: SPF Economie, P.M.E., Classes moyennes & Energie; 2003. p. 20.
79. RIZIV/INAMI Brussel [cited December 2009]. Bewijsmodaliteiten voor de inschrijving in de hoedanigheid van ingeschrevene in het Rijksregister, bedoeld bij artikel 32, eerste lid, 15° van de gecoördineerde wet van 14 juli 1994. Available from: http://www.riziv.fgov.be/insurer/nl/circulars/administrative-control/inscription/pdf/inscription.pdf
80. Unesco. International Standard Classification of Education (ISCED) -1997 Unesco; 2006.
81. Hazlet TK, Blough DK. Health services utilization with reference drug pricing of histamine(2) receptor antagonists in British Columbia elderly.[see comment]. Med Care. 2002;40(8):640-9.
82. Allan GM, Lexchin J, Wiebe N. Physician awareness of drug cost: a systematic review. PLoS Med. 2007;4(9):e283.
83. INAMI/RIZIV. Monitoring Of Reimbursement Significant Expenses M.O.R.S.E. Semi-annual report 2008 (2) data 2nd semester 2008. Brussels: 2010.
84. INAMI/RIZIV. Info Spot. La prescription en DCI. In; 2008.
This page is left intentionally blank.
Legal depot : D/2010/10.273/20
KCE reports
33 Effects and costs of pneumococcal conjugate vaccination of Belgian children. D/2006/10.273/54. 34 Trastuzumab in Early Stage Breast Cancer. D/2006/10.273/25. 36 Pharmacological and surgical treatment of obesity. Residential care for severely obese children
in Belgium. D/2006/10.273/30. 37 Magnetic Resonance Imaging. D/2006/10.273/34. 38 Cervical Cancer Screening and Human Papillomavirus (HPV) Testing D/2006/10.273/37. 40 Functional status of the patient: a potential tool for the reimbursement of physiotherapy in
Belgium? D/2006/10.273/53. 47 Medication use in rest and nursing homes in Belgium. D/2006/10.273/70. 48 Chronic low back pain. D/2006/10.273.71. 49 Antiviral agents in seasonal and pandemic influenza. Literature study and development of
practice guidelines. D/2006/10.273/67. 54 Cost-effectiveness analysis of rotavirus vaccination of Belgian infants D/2007/10.273/11. 59 Laboratory tests in general practice D/2007/10.273/26. 60 Pulmonary Function Tests in Adults D/2007/10.273/29. 64 HPV Vaccination for the Prevention of Cervical Cancer in Belgium: Health Technology
Assessment. D/2007/10.273/43. 65 Organisation and financing of genetic testing in Belgium. D/2007/10.273/46. 66. Health Technology Assessment: Drug-Eluting Stents in Belgium. D/2007/10.273/49. 70. Comparative study of hospital accreditation programs in Europe. D/2008/10.273/03 71. Guidance for the use of ophthalmic tests in clinical practice. D/200810.273/06. 72. Physician workforce supply in Belgium. Current situation and challenges. D/2008/10.273/09. 74 Hyperbaric Oxygen Therapy: a Rapid Assessment. D/2008/10.273/15. 76. Quality improvement in general practice in Belgium: status quo or quo vadis?
D/2008/10.273/20 82. 64-Slice computed tomography imaging of coronary arteries in patients suspected for coronary
artery disease. D/2008/10.273/42 83. International comparison of reimbursement principles and legal aspects of plastic surgery.
D/200810.273/45 87. Consumption of physiotherapy and physical and rehabilitation medicine in Belgium.
D/2008/10.273/56 90. Making general practice attractive: encouraging GP attraction and retention D/2008/10.273/66. 91 Hearing aids in Belgium: health technology assessment. D/2008/10.273/69. 92. Nosocomial Infections in Belgium, part I: national prevalence study. D/2008/10.273/72. 93. Detection of adverse events in administrative databases. D/2008/10.273/75. 95. Percutaneous heart valve implantation in congenital and degenerative valve disease. A rapid
Health Technology Assessment. D/2008/10.273/81 100. Threshold values for cost-effectiveness in health care. D/2008/10.273/96 102. Nosocomial Infections in Belgium: Part II, Impact on Mortality and Costs. D/2009/10.273/03 103 Mental health care reforms: evaluation research of ‘therapeutic projects’ - first intermediate
report. D/2009/10.273/06. 104. Robot-assisted surgery: health technology assessment. D/2009/10.273/09 108. Tiotropium in the Treatment of Chronic Obstructive Pulmonary Disease: Health Technology
Assessment. D/2009/10.273/20 109. The value of EEG and evoked potentials in clinical practice. D/2009/10.273/23 111. Pharmaceutical and non-pharmaceutical interventions for Alzheimer’s Disease, a rapid
assessment. D/2009/10.273/29 112. Policies for Orphan Diseases and Orphan Drugs. D/2009/10.273/32. 113. The volume of surgical interventions and its impact on the outcome: feasibility study based on
Belgian data 114. Endobronchial valves in the treatment of severe pulmonary emphysema. A rapid Health
Technology Assessment. D/2009/10.273/39 115. Organisation of palliative care in Belgium. D/2009/10.273/42 116. Interspinous implants and pedicle screws for dynamic stabilization of lumbar spine: Rapid
assessment. D/2009/10.273/46
117. Use of point-of care devices in patients with oral anticoagulation: a Health Technology Assessment. D/2009/10.273/49.
118. Advantages, disadvantages and feasibility of the introduction of ‘Pay for Quality’ programmes in Belgium. D/2009/10.273/52.
119. Non-specific neck pain: diagnosis and treatment. D/2009/10.273/56. 121. Feasibility study of the introduction of an all-inclusive case-based hospital financing system in
Belgium. D/2010/10.273/03 122. Financing of home nursing in Belgium. D/2010/10.273/07 123. Mental health care reforms: evaluation research of ‘therapeutic projects’ - second intermediate
report. D/2010/10.273/10 124. Organisation and financing of chronic dialysis in Belgium. D/2010/10.273/13 125. Impact of academic detailing on primary care physicians. D/2010/10.273/16 126. The reference price system and socioeconomic differences in the use of low cost drugs.
D/2010/10.273/20. This list only includes those KCE reports for which a full English version is available. However, all KCE reports are available with a French or Dutch executive summary and often contain a scientific summary in English.