GOVERNMENT OF NORTHERN IRELAND. The Registrar-Generars Annual Report for 1938 Containing General Abstracts of Births, Deaths, and Marriages Registered in Northern Ireland during the Year Presented to Parliament pursuant to Statute Ordered, by the House of Gommons, to be printed 16th May, 1939 BELFAST PUBLISHED BY HIS MAJESTY'S STATIONERY OFFICE ON BEHALF OF THE GOVERNMENT OF NORTHERN IRELAND To be purchased directly from H.M. Stationery Office at the following addresses: 80 CHICHESTER STREET, BELFAST ; York House, Kingsway, London, W.C.2 ; 120 George Street, Edinburgh 2 ; 26 York Street, Manchester 1 ; 1 St. Andrew's Crescent, Cardiff ; or through any bookseller 1939. Price 2s. 6d. net. H.C. 471.
Transcript
GOVERNMENT OF NORTHERN IRELAND.
The Registrar-Generars Annual Report for 1938
Containing General Abstracts of Births, Deaths, and Marriages
Registered in Northern Ireland during the Year
Presented to Parl iament pursuant to Statute
Ordered, by the House of Gommons, to be printed 16th May, 1939
BELFAST PUBLISHED BY HIS MAJESTY'S STATIONERY OFFICE
ON BEHALF OF THE GOVERNMENT OF NORTHERN IRELAND
To be purchased directly from H.M. Stationery Office a t the following addresses: 80 CHICHESTER STREET, BELFAST ;
York House, Kingsway, London, W.C.2 ; 120 George Street, Edinburgh 2 ; 26 York Street, Manchester 1 ; 1 St. Andrew's Crescent, Cardiff ;
or through any bookseller 1939.
Price 2s. 6d. net. H.C. 471.
GENERAL REGISTER OFFICE,
FERMANAGH HOUSE,
ORMEAU AVENUE,
BELFAST.
May, 1939.
To the Right Honourable J. M. Andrews, Minister of Finance for Northern Ireland.
SIR,
I have the honour to submit the Seventeenth Annual Report on the Births, Deaths, and Marriages registered in Northern Ireland, together with Abstracts of the particulars of such registrations. The Report relates to the year ended 31st December, 1938. The Abstracts have been prepared for presentation to Parliament, pursuant to the provisions of statutes governing the registration system. The Report gives information regarding the administration of the Registration, etc.. Acts, and draws attention to the salient features of the vital statistics contained in the Abstracts ; figures relating to previous years are included for purposes of comparison. Information is also given relating to vaccination, notifications of infectious diseases, migration, and the weather.
I beg to acknowledge the valuable assistance rendered by Dr. McCloy, Chief Medical Officer of the Ministry of Home Affairs, who advises this office in regard to medical matters. I also desire to record my appreciation of the courtesy shown by the Registrars-General of England and Wales, Scotland, and Eire, in furnishing information relating to the areas under their respective administrations.
I have the honour to be. Sir,
Your most obedient Servant,
W. A. CARSON,
Registrar-General of Births, Deaths, and Marriages for Northern Ireland.
TABLE OF CONTENTS
REPORT
I - ADMINISTRATION.
10.
Introductory-Local Organisation Licensers of Marriages . Buildings licensed or registered
for Marriages State of Registration Inspection Prosecutions Legitimacy Act (N.L), 1928 Adoption of Children Act (N.I.)
1929 . . . . Searches and Certificates
II - STATISTICS.
(1) Summary of Registration. 1. Introductory . 2. Marriages, Births,
Deaths registered 3. Vaccinations
and
(2) Marriages. 1. Number and Rate . 2. Method of Celebration 3. Civil Conditions 4. Marriages in each Quarter 5. Marriages of Minors 6. Signatures by " Mark "
(3) Births. 1. Number and Rate 2. Proportion of Males to Fe
males . . . . 3. Births in each Quarter 4. Multiple Births 5. County and Urban and
Rural Birth Rates
ige
5 5 5
6 6 7 7 7
8 8
8
9 9
10 10 13 13 13 13
13
15 15 16
16
I I - STATISTICS {continued).
(4) Deaths. 1. 2. 3. 4. 5. 6.
7.
8. 9.
10. 11. 12. 13. 14. 15. 16. 17. 18. 19. 20. 21.
Number and Rate . Deaths in each Quarter Deaths in Institutions Comparison of Mortality Ages at Death
Page
16 16 16 18 19
Proportion of Deaths from the Principal Causes 19
Deaths from the Principal Epidemic Diseases .
Influenza Tuberculosis Cancer Cerebral Haemorrhage, etc. Heart Disease Bronchitis Pneumonia Pregnancy and Childbirth Deaths from Violence
20 20 23 26 27 27 27 27 27 32
Ill-defined Causes of Death 32 Uncertified Deaths . Inquests . Infant Mortality Mortality among Illegiti
mate Children .
(5) Population .
(6) Migration
(7) The Weather
33 33 34
34
40
40
41
ABSTRACTS
I . Marriages registered in each of the Counties, showing Method of Celebration . . . 4 6
I I . Marriages registered in each of the Counties, showing the number registered in each quarter of the year, the Civil Condition of the Persons married, and the number of Minors . . . . 4 6
I I I . Births and Deaths by Counties and Poor Law Unions of Registration, and of Allocation, distinguishing the Sexes . 47
IV. Births in each of the Counties, showing the number in each quarter of the year, distinguishing Males and Females 49
V. Deaths in each of the Counties, showing the number in each quarter of the year, distinguishing Males and Females . 49
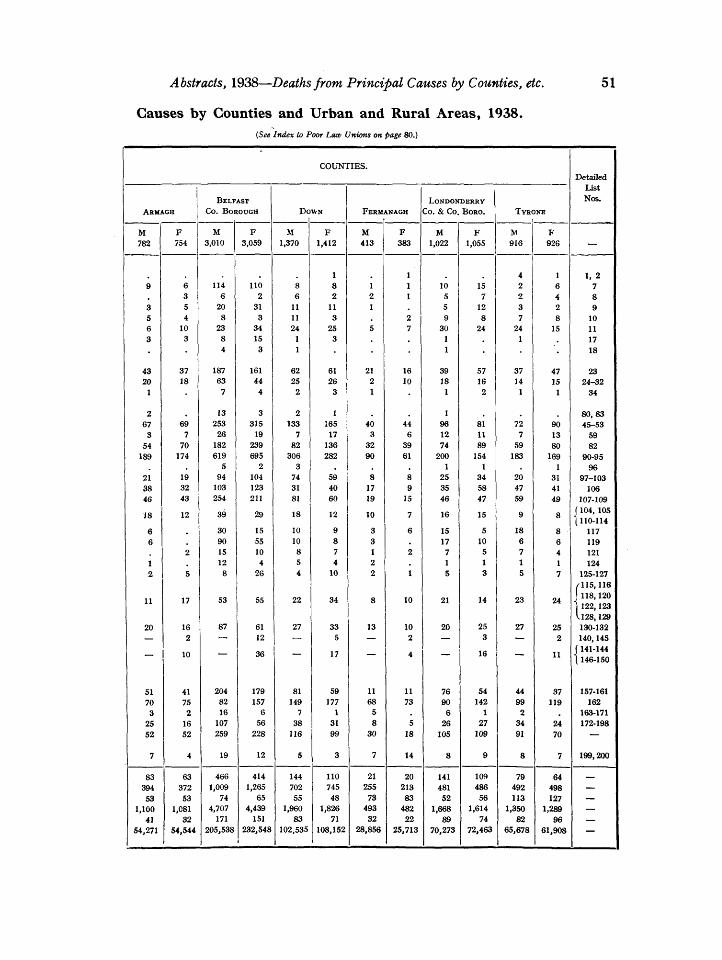
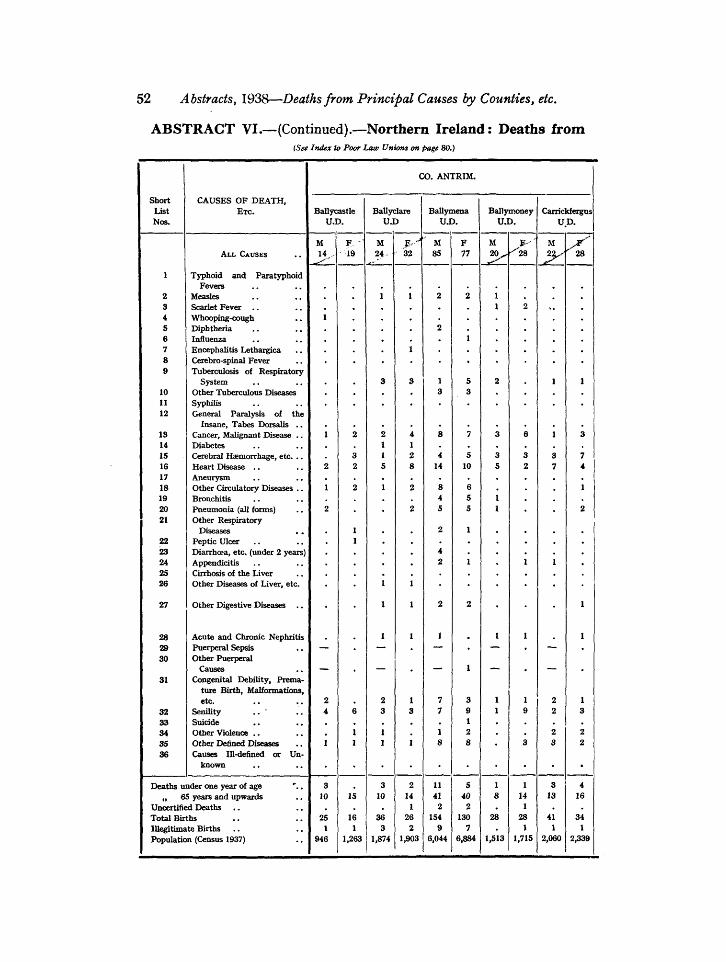
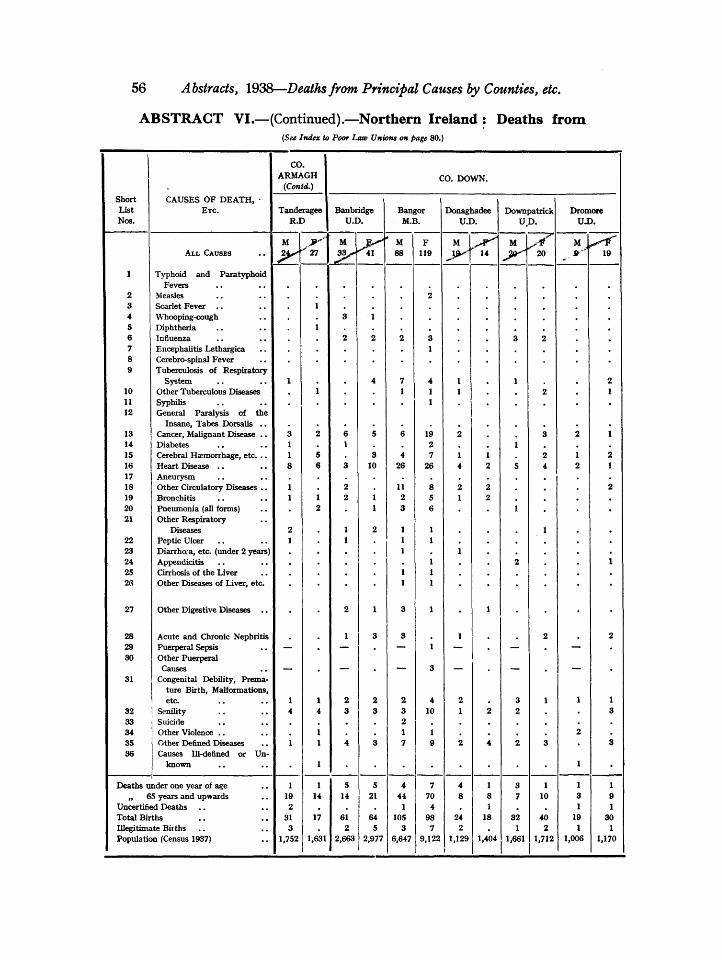
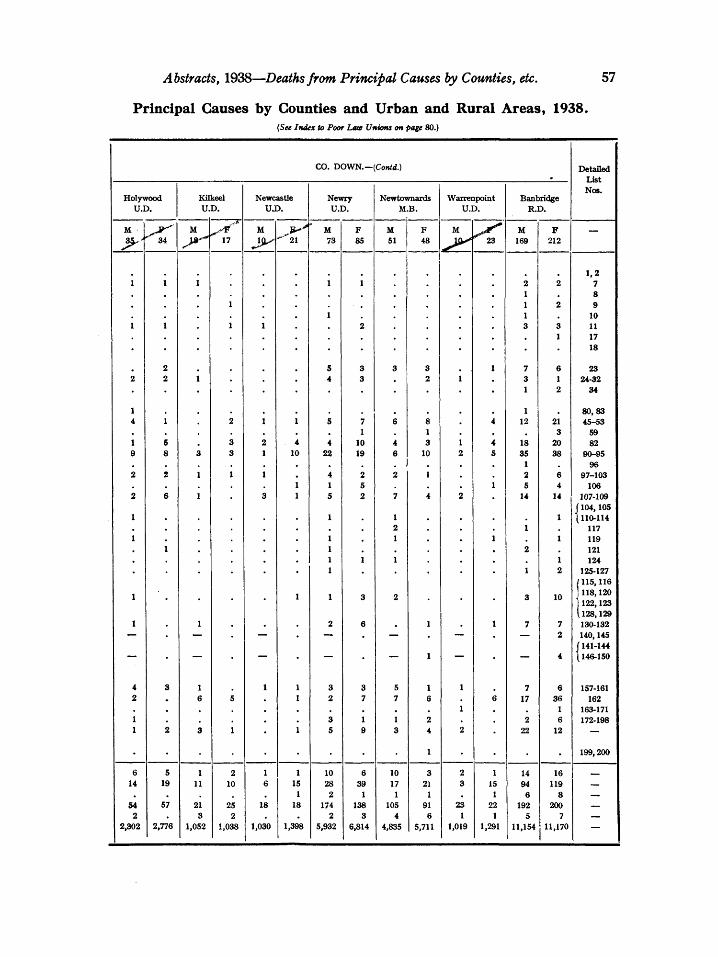
VI. Deaths from the Principal Causes in Counties and Urban and Rural Areas, distinguishing Males and Females . . 50
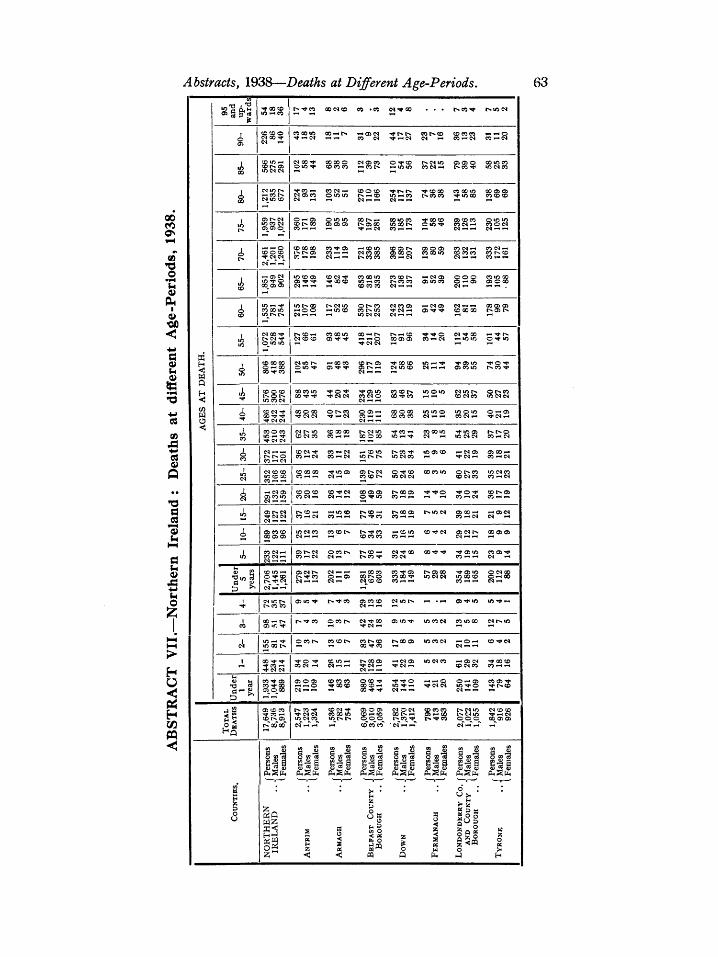
VII . Deaths of Males and Females at different Age-Periods in each of the Counties . . 63
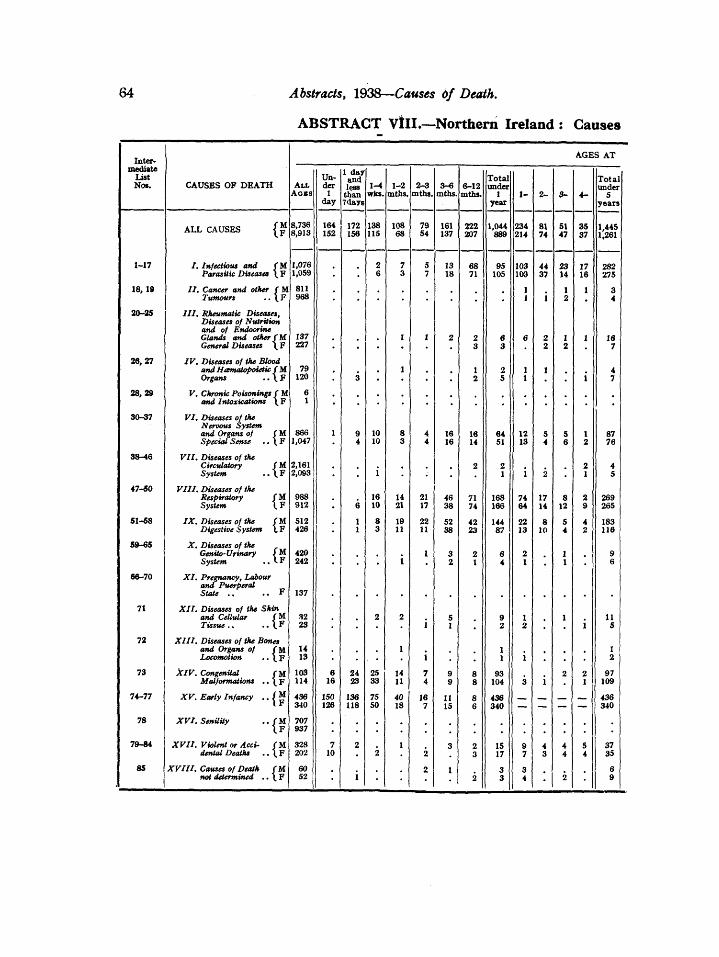
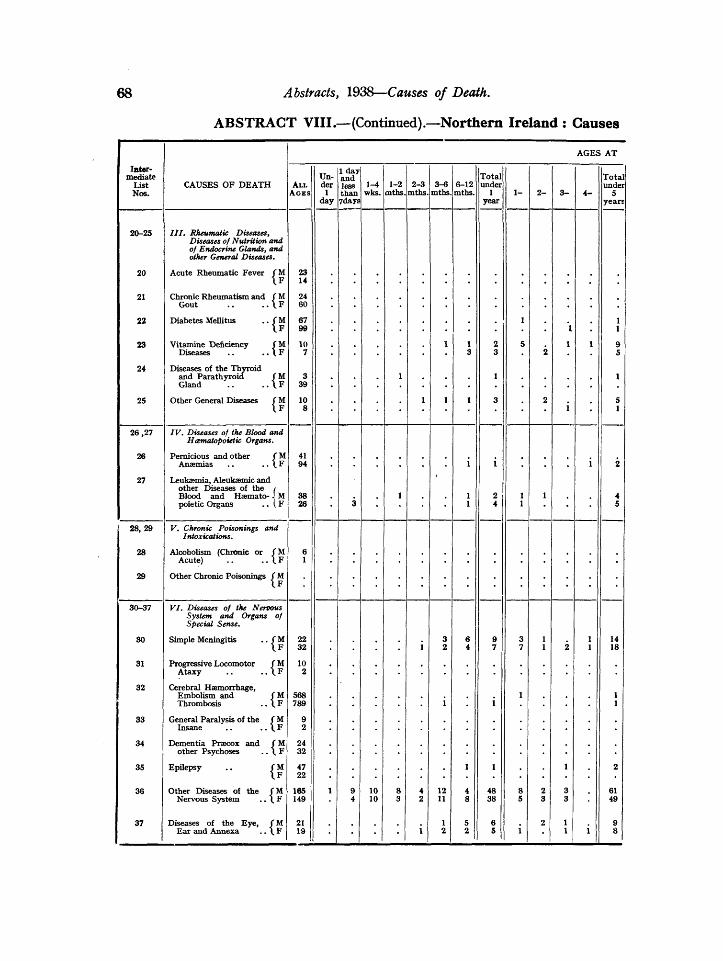
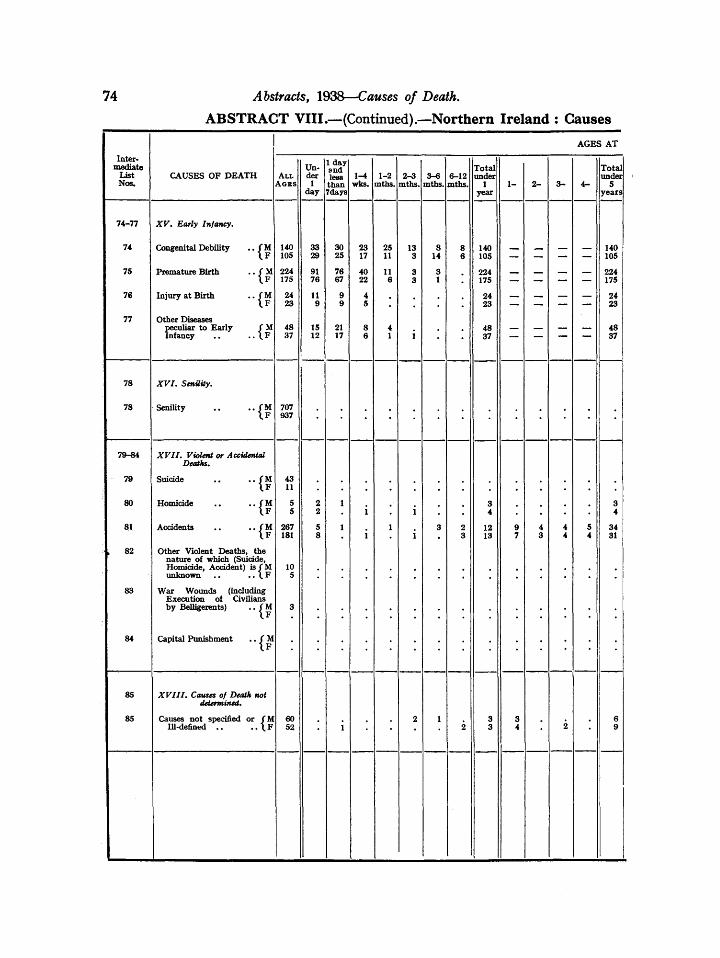
VII I . Deaths by causes of Males and Females a t different Age-Periods . . . . 6 4
IX. Uncertified Deaths by Causes, Ages, and Sex . . . 7 6
Table of Contents.
ABSTRACTS—continued.
Page X. Deaths in Institutions 1929-1938 77 XI . Population of Northern Ireland
at each of the ten Censuses, 1841-1937 . . . 7 7
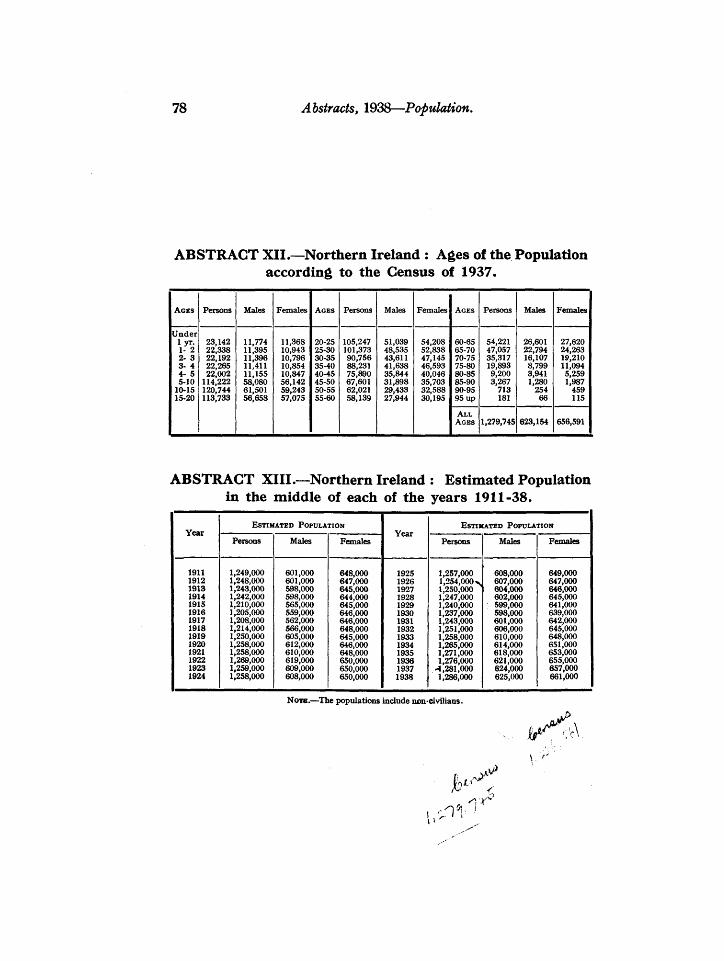
XII. Population of Northern Ireland by Sexes and Ages according to the Census of 1937 . . 78
X I I I . Population of Northern Ireland estimated to the middle of each of the years 1911-38 .
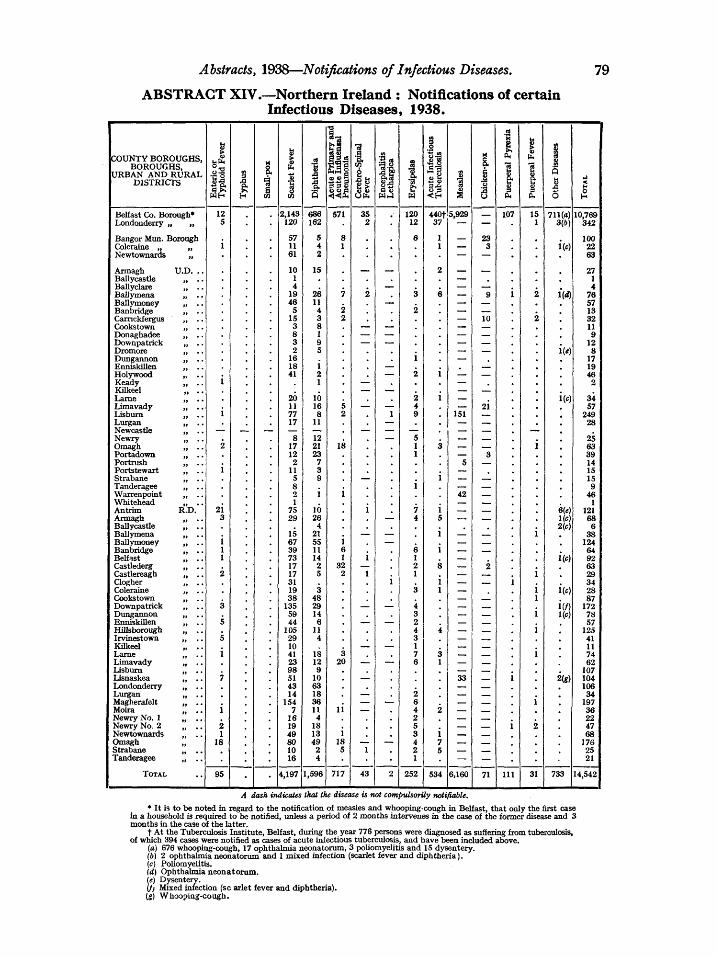
XIV. Notifications of certain Infectious Diseases, 1938
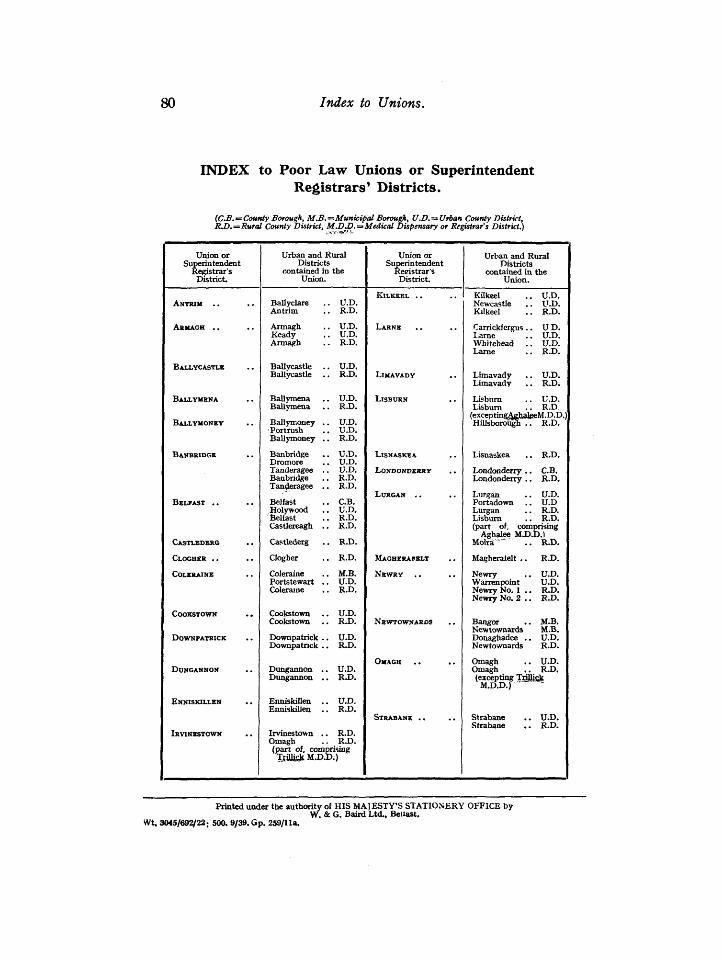
Index to Poor Law Unions or Superintendent Registrars' Districts
DIAGRAMS
Page
78
79
80
Comparative Birth and Marriage Rates . . . . 1 4
I I . Comparative Death Rates . 17
I I I . Mortality from the Principal Causes . . . . 2 1
IV. Death Rates from Tuberculosis for aggregates of Urban and Rural Areas . . . 2 5
V. Deaths of Infants under one year of age . , ' . . 3 5
VI. Birth and Infant Mortality Rates for aggregates of Urban and Rural Areas . . . 3 9
Annual Report of the Registrar-General for Northern Ireland
REPORT SECTION I.—ADMINISTRATION.
1. Introductory.—The administrative functions of the office of the Registrar-General comprise the registration of births, deaths, marriages, vaccinations, and adoptions, and the provision or supervision of machinery for dealing with prehminaries to marriages other than those according to the rites of the Roman CathoHc Church. An outline of the arrangements in force for the discharge of these functions was included in the Report for 1934. Certain aspects of the work incidental to their discharge are dealt with in the following paragraphs.
2. Local Organisation.—^The staff of local officers engaged in registration consists of—
27 Registrars of Marriages other than Roman Catholic ; 27 Superintendent Registrars of Births, Deaths, and Roman
Catholic Marriages ; and
179 Registrars of Births, Deaths, and Roman Catholic Marriages. Each of these officers appoints an Assistant or Deputy.
The numbers of appointments made to fill vacancies occurring amongst these officers in 1936, 1937, and 1938, were as follows :—
APPOINTMENTS 1936
Registrars of Marriages Deputy Registrars of Marriages Superintendent Registrars of Births, etc. Assistant Superintendent Registrars of Births, etc. Registrars of Births, etc. Assistant Registrars of Births, etc.
TOTAL
3 2 1 4 9
38
57
1937
3 2 3 6
28
42
1938
1 2
4 38
45
3. Licensers of Marriages.—The Bishops of the Church of Ireland, and the Presbyteries in the case of the Presbyterian Churches, are authorised to appoint persons to issue Hcences for marriages. Each person so appointed is under bond to the Registrar-General for the due discharge of his duties.
The number of Licensers of the Church of Ireland holding office at the end of the year 1938 was 70, the number of appointments made during the year being 6. The corresponding figures for 1937 were 70 and 3 respectively.
6 Report~~l938.
Licensers of the Presbyterian Churches holding office at the end of 1938 numbered 138, the number of appointments made during the year being 25. The corresponding figures for 1937 were 120 and 5 respectively. The increase in these figures for 1938 is due to a decision by the Reformed Presbyterian Church to exercise the power given to Presbyteries to appoint Ministers to grant licences for marriage.
4. Buildings licensed or registered for Marriages.—The numbers of places of worship (other than those belonging to the Roman Catholic Church) in which marriages could be solemnised, as at the 31st December in each of the years 1936, 1937, and 1938, were as follows :—
DEKOMINATrON
Church of Ireland , , Presbyterian Methodist Others . .
TOTAL , .
1936
378 463 138 204
1,183
1937 1938
379 463 139 212
1,193
380 499 141 181
1,201
The increase in 1938 in the number of Presbyterian Churches and the decrease under the heading " Others " in the above table is chiefly due to the transfer from the latter heading to the former of the places of worship belonging to the Reformed Presbyterian Church.
5. State of Registration.—^The measures adopted in recent years for the particulars of births notified under the Notification of Births Act, 1907, to be furnished to Registrars in the two County Boroughs and in the other urban areas in which the Act operates has continued to be of value in securing the registration of a number of births which had not been registered within the prescribed period of 6 weeks. In connection with the registration of deaths, returns of burials made to Registrars by Clerks of Burial Boards and Cemetery Companies have been of considerable assistance. As has been explained in earlier Reports, however, these measures are only of a subsidiary nature, and Registrars, particularly in rural areas, are largely dependent upon their general knowledge of local events as a basis for securing that registration is effected.
Births and deaths not registered within a year of their occurrence can be recorded only with the authority of the Registrar General. During 1938 such authority was granted for the registration of 256 births, as compared with 205 in 1937, and 188 in 1936. The registration of 22 deaths was authorised, the numbers for the years 1937 and 1936 being 20 and 17 respectively.
Report—1938. 7
In connection with lists furnished to the General Register Office by the Ministry of Labour of the deaths of persons who had been in receipt of pensions paid by that Ministry, it was found after comparison with the death records that 50, out of a total of 6,356 deaths reported in 1938, had not been registered.
The co,mparison mentioned in the preceding paragraph included the question of the accuracy of the ages given at the registration of the deaths of the persons named in the lists, the age as accepted after investigation for pension purposes being taken as correct. The comparison for 1938 revealed 380 cases in which the age as given in the death entry was ten years or more below the true age, and in these cases steps were taken to have declarations made by qualified informants, and the death entries amended by the substitution of the true age for that originally given. The number of death entries similarly dealt with for 1937 was 386, It is not possible to have this correction procedure completed in time for the extraction of the death statistics from the entries, and corrections are not enforced in the numerous cases in which the understatement of age is less than ten years. Moreover, the comparison itself can be made only in respect of less than half of the total number of deaths. The statistics of deaths by ages in these reports are, therefore, to some extent affected by understatements of age in the death entries.
6. Inspection.—^For several reasons it was found necessary to utilise the services of the Inspector at headquarters for other duties during a large portion of the year, and the ordinary inspection of local registration offices was therefore suspended, A number of visits were paid to Registrars, Clergymen and others in connection with cases requiring special treatment,
7. Prosecutions.—Seven prosecutions for breaches of the Registration Acts were instituted during the year. Two arose out of failure to register births, one concerned an unregistered death, and three were consequent upon the tendering of false information for insertion in Registers of Births and Deaths. The seventh case was one in which the year of birth had been altered in a certified copy of an entry of birth. One of the prosecutions for failure to register births was withdrawn on the party concerned paying costs, registration having been effected subsequent to the issue of the summons. In the other six cases the defendants were convicted and fined,
8. Legitimacy Act (N.I.), 1928.—Under this Act an illegitimate child whose parents have married is, subject to certain conditions, legitimated, and the Registrar-General is empowered to authorise the re-registration of the birth. During 1938 the re-registration of the births of 118 children was authorised under the Act, the figures for 1937 and 1936 being 117 and 102 respectively.
8 Report^l938.
9. Adoption of Children Act (N.I.)» 1929.—A Register of Children adopted under the provisions of this Act is kept in the General Register Office, to which the Adoption Orders made by the Courts are communicated. A certified copy of an entry in this register is evidence of adoption, and is glso evidence of the date of birth, if that date is recorded in the entry. The children whose adoptions were recorded in the Adopted Children Register during 1938 numbered 217, the figures for 1937 and 1936 being 143 and 146 respectively,
10. Searches and Certificates.—The original records of births, deaths, and marriages registered in Northern Ireland are, in general, in the custody of local registration officers, who issue annually therefrom many thousands of certificates. The Head Office copies of these records for the years prior to 1922 are still in the hands of the Registrar-General, Dublin. An indication of the extent to which Government Departments and the public have utilised the facilities for searching in the indexes and obtaining certificates from records in the General Register Office for Northern Ireland (including the Adopted Children Register) is afforded by the following table :—
1. Introductory.—^The figures contained in this Report may be regarded as final, and as superseding the provisional figures already published for the year 1938 in the Registrar-General's weekly and quarterly returns. Reference may here be made to the " Registrar-General's Review of Vital Statistics of Northern Ireland and Life Tables (1926)," pubhshed in September, 1931. This Review contains comprehensive statistics derived from registration records and the results of the Census of 1926.
The value of the statistical information concerning deaths contained in the Registrar-General's Annual Reports and other pubUcations is to a large extent dependent on the degree of care and accuracy with which the members of the medical profession enter the
Report—193S. 9
required particulars on the form of medical certificate of the cause of death. The particulars so given are incorporated in the death entries, and thus in every case in which a person had been attended in his or her last illness by a medical practitioner, the medical certificate given by the latter forms the basis upon which the cause of death is classified.
In the case of the death of a person who had not been medically attended in his or her last iUness, and no inquest had been held, the cause of death is entered in the register from such information as the informant of the death can supply to the Registrar. (See para. 18 page 33, as to uncertified deaths.)
For the purpose of the Registrar-General's Annual Reports the classifications adopted are the Intermediate and Short Lists shown in the " Manual of the International List of Causes of Death, as adapted for use in England and Wales, Scotland, and Northern Ireland," pubhshed by H.M. Stationery Ofi&ce.
Abstract VIII shows the deaths classified under the headings of the Intermediate List (sUghtly ampHfied in the case of tuberculosis), while the causes shown in Abstracts VI and IX, and certain of the tables in the text, are in accordance with the Short List. The Detailed List numbers have also been given in Abstracts VI and VIII for purpose of reference.
In general in the tables and abstracts, dots (.) are used to indicate none, and dashes (—) are used to indicate that information cannot or is not intended to be given.
Abstract III shows the numbers of births and deaths registered in and allocated to each County and Poor Law Union of Northern Ireland. Otherwise throughout the Report, births and deaths have been allocated to the district of normal residence, births having been assigned to the districts containing the normal residence of the parents, and deaths to the districts containing the normal residence of the deceased persons.
2. Marriages, Births, and Deaths Registered.—The results of the year's registration show decreases in the marriage and death rates, and an increase in the birth rate. The decrease in the death rate is noteworthy, the rate for the year being the lowest recorded for Northern Ireland as a separate administrative unit.
3. Vaccinations.—As returned by the Registrars, the Successful Primary Vaccinations during the year numbered 19,798, the number of births registered during the year being 25,742. The number of Successful Primary Vaccinations is thus about 77 per cent, of the total number of births registered as compared with 80 per cent, in 1937.
10 Report—1938.
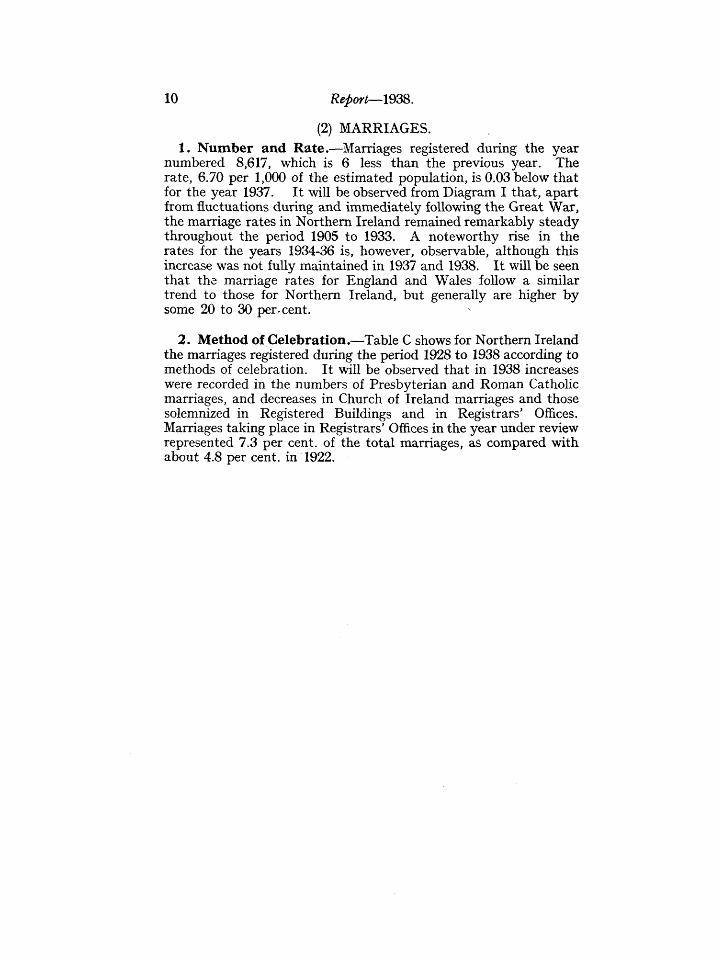
(2) MARRIAGES. 1. Number and Rate.—Marriages registered during the year
numbered 8,617, which is 6 less than the previous year. The rate, 6.70 per 1,000 of the estimated population, is 0.03 below that for the year 1937. It wiU be observed from Diagram I that, apart from fluctuations during and immediately following the Great War, the marriage rates in Northern Ireland remained remarkably steady throughout the period 1905 to 1933. A noteworthy rise in the rates for the years 1934-36 is, however, observable, although this increase was not fully maintained in 1937 and 1938. It wiU be seen that the marriage rates for England and Wales follow a similar trend to those for Northern Ireland, but generally are higher by some 20 to 30 per-cent.
2. Method of Celebration.—Table C shows for Northern Ireland the marriages registered during the period 1928 to 1938 according to methods of celebration. It wiU be observed that in 1938 increases were recorded in the numbers of Presbyterian and Roman Catholic marriages, and decreases in Church of Ireland marriages and those solemnized in Registered Buildings and in Registrars' Offices. Marriages taking place in Registrars' Offices in the year under review represented 7.3 per cent, of the total marriages, as compared with about 4.8 per cent, in 1922.
Report-^193S. 11
TABLE A—Northern Ireland : Births, and Deaths, 1901 Averages.
Population, Marriages, 1938, with Quinquennial
YEAR
1901 1902 1903 1904 1905
1901-05
1906 1907 1908 1909 1910
1906-10
1911 1912 1913 1914 1915
1911-15
1916 1917 1918 1919 1920
1916-20
1921 1922 1923 1924 1925
1921-25
1926 1927 1928 1929 1930
1926-30
1931 1932 1933 1934 1935
1931-35
1936 1937 1938
• Estimated mid-year
Population
1,237,000 1,238,000 1,239,000 1,241,000 1,242,000
1,239,000
1,243,000 1,244,000 1,245,000 1,247,000 1,248,000
1,245,000
1,249,000 1,248,000 1,243,000 1,242,000 1,210,000
1,238,000
1,205,000 1,208,000 1,214,000 1,250,000 1,258,000
1,227,000
1,258,000 1,269,000 1,259,000 1,258,000 1,257,000
1,260,000
1,254,000 1,250,000 1,247,000 1,240,000 1,237,000
1,246,000
1,243,000 1,251,000 1,258,000 1,265,000 1,271,000
1,25S,000
1,276,000 1,281,000 1,286,000
Marriages
7,416 7,679 7,388 7,312 7,463
7,452
7,513 7,406 7,219 7,211 7,354
7,341
7,590 7,469 7,244 7,502 7,872
7,535
7,038 6,872 7,797 9,992 9,550
8,250
8,121 8,072 7,974 7,514 7,682
7,873
7,228 7,175 7,264 7,426 7,547
7,328
7,369 6,959 7,630 8,230 8,844
7,806
9,144 8,623 8,617
Births, including
Illegitimates
30,782 30,707 31,290 31,550 31,405
31,147
31,389 30,969 30,600 30,640 30,219
30,763
30,407 30,301 29,880 29,704 28,082
29,675
26,623 24,949 26,212 27,496 32,521
27,560
29,710 29,531 30,097 28,496 27,686
29,104
28,162 26,676 25,963 25,410 25,879
26,418
25,673 25,107 24,601 25,365 24,742
25,098
25,909 25,412 25,742
Illegitimate Births
1,169 1,169 1,168 1,191 1,235
1,186
1,232 1,167 1,179 1,243 1,247
1,214
1,293 1,300 1,278 1,344 1,264
1,296
1,188 1,151 1,217 1,238 1,494
1,258
1,271 1,255 1,344 1,225 1,147
1^48
1,250 1,262 1,192 1,216 1,326
1^49
1,275 1,268 1,237 1,309 1,207
1,259
1,199 1,183 1,150
Deaths
23,954 23,171 23,096 23,536 22,949
23,341
23,039 23,754 23,133 22,275 22,576
22,955
21,326 21,698 22,510 21,671 22,438
21,929
20,764 21,011 25,013 22,836 21,017
22,128
19,301 19,795 18,790 20,299 19,784
19,594
18,827 18,216 18,004 19,822 17,148
18,403
18,049 17,812 18,154 17,521 18,592
18,026
18,429 19,282 17,649
Deaths of Infants
tmder 1 year of Age
3,453 3,365 3,268 3,458 3,345
3,378
3,291 3,070 3,376 3,105 3,251
3,219
3,034 2,914 3,184 3,020 2,997
3,030
2,356 2,419 2,638 2,621
.3,068
2,620
2,575 2,280 2,302 2,411 2,391
2,392
2,390 2,074 2,022 2,174 1,754
2,083
1,885 2,084 1,960 1,767 2,136
1,966
1,992 1,969 1,933
h ^-7
* See Abstract XIII.
/7.i>7 hr?7
12 Report—-1938.
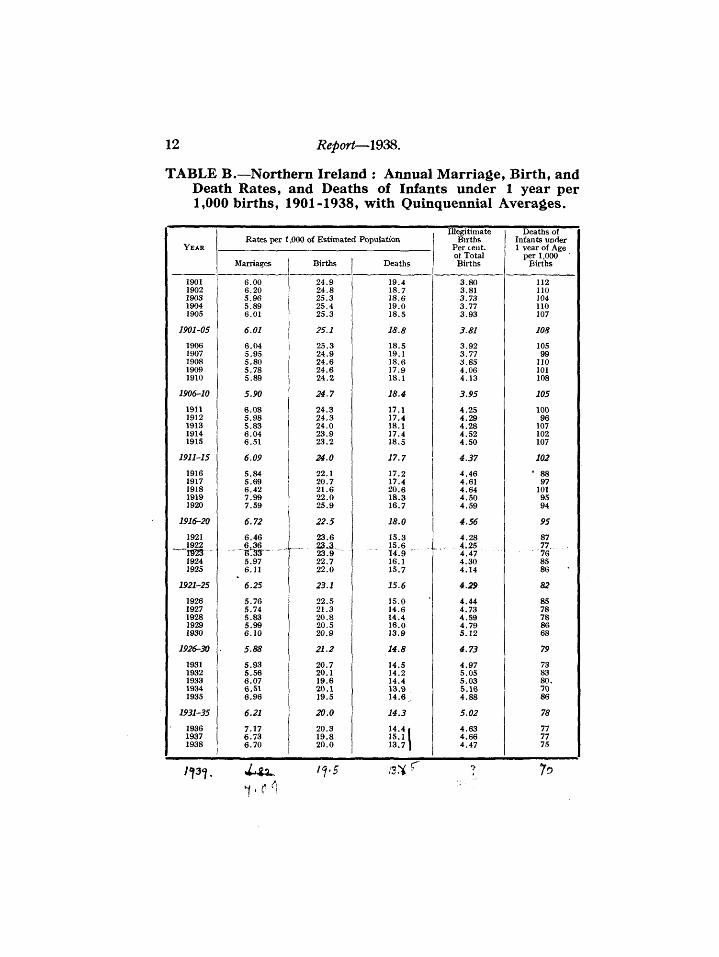
TABLE B.—Northern Ireland : Annual Marriage, Birth, and Death Rates, and Deaths of Infants under 1 year per 1,000 births, 1901-1938, with Ouinquennial Averages.
YEAR
1901 1902 1903 1904 1905
1901-05
1906 1907 1908 1909 1910
1906-10
1911 1912 1913 1914 1915
1911-15
1916 1917 1918 1919 1920
1916-20
1921 1922 152S 1924 1925
1921-25
1926 1927 1928 1929 1930
1926-30
1931 1932 1933 1934 1935
1931-35
1936 1937 1938
Rates per 1
Marriages
6.00 6.20 5.96 5.89 6.01
6.01
6.04 5.95 5.80 5.78 5.89
5.90
6.08 5.98 5.83 6.04 6.51
6.09
5.84 5.69 6.42 7.99 7.59
6.72
6.46 6 .36
- ^ B : ^ — 5.97 6.11 6.25
5.76 5.74 5.83 5.99 6.10
5.88
5.93 5.56 6.07 6.51 6.96
6.21
7.17 6 .73 6.70
,000 of Estimated Population
Births
24.9 24.8 25 .3 25.4 25.3
25.1
25.3 24.9 24.6 24.6 24 .2
24.7
24.3 24 ,3 24.0 23.9 23 .2
24.0
22.1 20.7 21.6 22 .0 25 .9
22.5
23.6 23 .3 . 23 .9 22.7 22 .0
23.1
22.5 21.3 20.8 20.5 20.9
21.2
20.7 20.1 19.6 20 .1 19.5
20.0
20.3 19.8 20 .0
Deaths
19.4 18.7 18.6 19.0 18.5
18.8
18.5 19.1 18.6 17.9 18.1
18.4
17.1 17.4 18.1 17.4 18.5
17.7
17.2 17.4 20.6 18.3 16.7
18.0
15.3 15.6 14 .9 16.1 15.7
15.6
15.0 14.6 14.4 16.0 13.9
14.8
14.5 14.2 14.4 V3.9 1 4 . 6 ,
14.3
14.4 1 15.1 1 1 3 . 7 ]
Illegitimate Births
Per cent. ot Total Births
3.80 3.81 3 .73 3.77 3 .93
3.81
3.92 3.77 3 .85 4.06 4.13
3.95
4.25 4.29 4 .28 4 .52 4 .50
4.37
4.46 4.61 4.64 4 .50 4 .59
4.56
4.28 . 4.25
4.47 4 .30 4.14
4.29
4.44 4.73 4 .59 4 .79 5 .12
4.73
4.97 5.05 5 .03 5.16 4 .88
5.02
4.63 4.66 4.47
Deaths of Infants under 1 vear of Age
per 1.000 Births
112 110 104 110 107
108
105 99
110 101 108
105
100 96
107 102 107
102
' 88 97
101 95 94
95
87 77,
•96 85 86
82
85 78 78 86 68
79
73 83 80. 70 86
78
77 77 75
'1^1- IV5 13% r lo
Report~1938. 13
TABLE C.—Northern Ireland : Marriages Registered, according to Methods of Celebration, 1928-1938.
3. Civil Conditions.—Of the total marriages, 91.9 per cent, were of bachelors and spinsters, 5.4 per cent, were of widowers and spinsters, 1.3 per cent, were of bachelors and widows, and 1.4 per cent, were of widowers and widows. Of the men married, 6.8 per cent, were widowers and 2.7 per cent, of the women married were widows ; in 8 out of every 100 marriages, one or both of the contracting parties had been married before. It should be noted that for the purpose of these calculations, divorced men and women who marry are included with bachelors and spinsters respectively. The marriages of divorced persons are shown bfelow Abstract II.
4. Marriages in each Quarter.—As in previous years, the marriages taking place in the third quarter were the highest proportion, 30.4 per cent, of the total for 1938 being registered in this quarter. In the second quarter 26.0 per cent, were recorded, and in the fourth, 25.1 per cent. As is almost invariably the case, the first quarter showed the lowest proportion, with only 18.5 per cent, of the total for the year.
5. Marriages of Minors.—Of the males married during the year, 3.2 per cent, were under the age of 21 years, which percentage is 0.6 higher than that of the previous year; and of the females, 13.8 per cent, were under 21, as compared with 12.4 per cent, in 1937.
6. Signatures by ** Mark."—Of the 17,234 persons married 84 men and 45 women, or 0.7 per cent, of the persons married, signed the registers or certificates by " mark," as compared with 2.1 per cent, in 1922.
(3) BIRTHS. 1. Number and Rate.—^The births registered during the year
numbered 25,742, an increase of 330 as compared with the previous year. The birth rate was 20.0 per 1,000 of the estimated population, being 0.2 above the rate for the previous year. An examination of Diagram I reveals that the birth rate in Northern Ireland has, in
14
Diagram I.—Birth and Marriage rates in Northern Ireland and England and Wales, 1905—1938.
1905 1910 1915 1920 1925
YEARS
1930 1935 1940
Repori—1938. 15
general, fallen over the past thirty years, except during the period of the war years and those immediately following, when extreme fluctuations in the rate took place. This diagram also shows a somewhat similar trend in the birth rates for England and Wales except that the general decline in the latter rates is very much greater. Illegitimate births numbered 1,150, a decrease of 33 as compared with the number recorded for 1937 ; the proportion to total births (4.47 per cent.) being slightly below that for the previous year. In England and Wales, Scotland and Eire, the illegitimate births as percentages of the total births were 4.19, 6.15 and 3.30, respectively, for the year 1938.
TABLE D.—Northern Ireland : Births Registered and Percentage of Illegitimate Births, 1928-38.
2. Proportion of Males to Females.—The proportion of male births to every 1,000 female births in 1938 was 1,052. The corresponding proportions for each of the years 1933-38 were 1,058, 1,079, 1,068, 1,051 and 1,049, respectively.
3. Births in each Quarter.—Of the total births registered, 24.4 per cent, were in the first quarter of the year, 26.8 per cent, in the second, 25.3 per cent, in the third, and 23.5 per cent, in the fourth.
TABLE E.—^Northern Ireland : County and Urban and Rural Birth Rates, 1934-38.
AREA.
NORTHERN IRELAND
County Antrim County Armagh Belfast County Borough County Down Coimty Fennanagh . . County Lcmdonderry (exc. C.B.) Londonderry County Borough . . County Tyrone
Aggregate of Urban Areas Aggregate of Rural Areas
All Births per 1,000 of Population.*
1934
20.1
18.9 19.9 20.7 17.8 17.7 20.4 25.4 19.8
21.1 18.4
1935
19.5
18.4 19.S 20 .2 17.8 17.1 19.5 24 .8 19.2
20 .5 18.0
1936
20 .3
18.8 20 .4 21.1 18.5 17.8 21 .4 26.9 20.0
21.5 18.8
1937
19.8
18.0 19.9 20.9 17.7 18.3 21 .5 25.7 20.0
21.0 18.6
1938
20 .0
18.9 20 .0 20 .8 18.0 17.9 21 .3 26.4 20.7
21.1 19.0
* According to Census of 1937, except for Northern Ireland, where the estimated population at the middle of each year has been used, and for Belfast County Borough for 1938, where the estimated population at the beginning of the year has been used.
16 Report—1938.
4. Multiple Births.—Of the 25,742 children whose births were registered during the year, 25,114 were born singly, 622 children were twins, and 6 children were triplets. Still-births not being registered in Northern Ireland, a birth of one live child and one still-bom child is regarded as a single birth, a birth of two live children and one still-bom child as a twin birth, and so on.
5. County and Urban and Rural Birth Rates.—Table E shows the birth rate experienced in each County and County Borough in Northern Ireland during the year and for the four preceding years, and also the rates for the aggregates of Urban and Rural Areas covering the same periods. From this it will be seen that, in 1938, Londonderry County Borough again experienced the highest birth rate and Co. Fermanagh the lowest. The rate for the aggregate of Urban Areas exceeded that for the Rural Areas. Diagram VI shows the birth rates for aggregates of Urban and Rural Areas over the period 1924 to 1938.
(4) DEATHS. 1. Number and Rate.—The deaths registered during the year
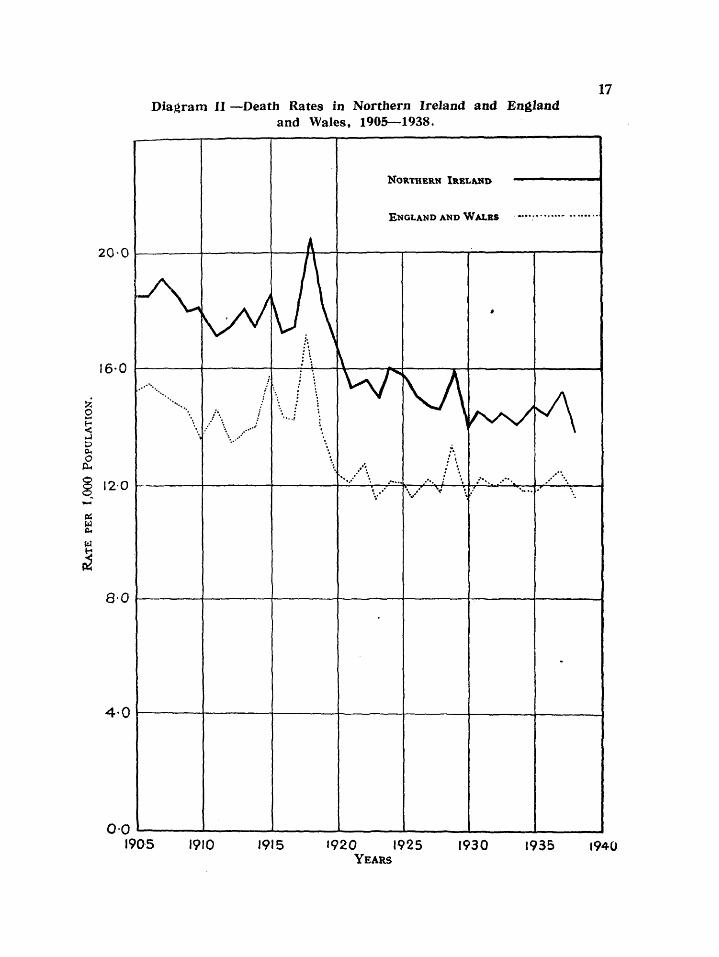
numbered 17,649, a decrease of 1,633 as compared with the previous year. The death rate was 13.7 per 1,000 of the estimated population, being 1.4 below the rate for 1937. From Table A it will be seen that, with the exception of the years 1930 and 1934, the number of deaths is the lowest recorded since the beginning of the present century. Diagram II shows that the Northern Ireland and England and Wales death rates have each followed a general downward trend over the period 1905 to 1938, and that the England and Wales rates, over the past decade, have been some 15 per cent, lower than the Northern Ireland rates.
Of the total deaths, 8,736 were of males and 8,913 were of females, the equivalent annual death rates being 14.0 and 13.5 per 1,000 of the male and female estimated populations respectively.
2. Deaths in each Quarter.—The deaths registered in the four quarters of the year give equivalent annual death rates of 16.0, 13.3, 11.8, and 13.7 in the March, June, September, and December quarters respectively,
3. Deaths in Institutions.—The numbers of deaths occurring in institutions in each of the years 1929-38 are shown in Abstract X. 29.6 per cent, of the deaths registered in 1938 took place in institutions (2.6 per cent, in pubUc mental hospitals, 13.1 per cent, in poor law institutions, 4.7 per cent, in district hospitals, and 9.2 per cent, in other hospitals and infirmaries), and the remaining 70.4 per cent, occurred " at their own homes, etc." The percentage of deaths taking place in institutions has risen from 17.0 in 1924 to 29.6 in 1938. These figures may be regarded as an index to the increasing tendency of the people to resort to institutions in cases of serious illness. The numbers of deaths taking place in District Hospitals.
17 Diagram II —Death Rates in Northern Ireland and England
and Wales, 1905—1938.
o <
eu o
20-0
16-0
120
80
4-0
QO
\
j
.
\J\ A
\ A : \
V * ;
«
•'' '••
-
1905 1910 1915 «920 1925 YEARS
1930 1935 t940
18 Report—1938.
which have increased from 276 in 1924 to 832 in 1938, are, no doubt, also affected by this tendency, but here the increase is mainly to be attributed to the increased number of these institutions which have replaced Poor Law Institutions.
4. Comparison of Mortality.—The most convenient index of mortality for comparative purposes for populations, the age and sex distributions of which do not vary to any material extent, is the crude death rate—that is the number of deaths per 1,000 of the total population. Mortality, however, being highest in infancy and old age, and generally higher in the male than in the female sex, one population, as compared with another, may be much more favourably constituted as regards age and sex, and Jhe real difference_in mortality between them is consequently obscured when crude rates are
"compared. DeatTi rates which embody corrections for variations in "age and sex distribution of the population are generally termed standardised death rates. Such rates are given in Table F, and they may be defined as the death rates that would emerge if the mortality rates of the communities in question at various ages and sexes were to prevail in a population selected as being of standard age and sex distribution. The standard population selected for the purpose of calculating these standardised rates is the population of England and Wales in 1901, and since this is the standard population used by the Registrar-General for England and Wales, the standardised death rates for that country and Northern Ireland are comparable, though to some extent comparison is affected by numerous understatements of age in death entries in Northern Ireland registers (see Sec. I, para. 5).
The method of calculating the standardised rates is fully described in the Annual Reports of the Registrar-General, England and Wales, for the years l 9 l l (pages xxvii to xxxi) and 1913 (page xx).
TABLE F.—Northern Ireland : England and Wales : Standardised and Crude Death Rates, 1926-38.
From Table F it will be seen that the crude death rates are, in general, reduced to a greater extent by standardisation in the case of Northern Ireland than in the case of England and Wales. This is, of course, to be expected, since the proportion of children and aged persons is appreciably higher in Northern Ireland, Perhaps the most noticeable feature of the comparison of standardised rates is the relatively high rates for females in Northern Ireland, these rates being on an average in the years 1926-38 about 94 per cent, of the males rates, whereas the corresponding ratio for the England and Wales rates is only about 80 per cent.
5. Ages at Death.—Attention has been drawn in Section I of this Report to the numerous understatements of the ages of deceased persons made to Registrars for entry in the death registers. I t is therefore necessary to regard statistics relating to deaths by age-periods with some reserve. '
During the year 1938, according to the ages registered, 15.3 per cent, of the total deaths were of children under 5 years of age, 47.2 per cent, were of persons aged 65 and upwards, and 36.7 per cent, were of persons aged 70 and upwards. There were 54 deaths of persons (18 males and 36 females) aged 95 years and upwards.
Among the deaths registered were 6 of persons whose ages at death were returned as 100 years or upwards ; all of these deaths were of females, of whom 4 were given as aged 100, 1 as 104, and 1 as 105. In the absence of complete pubUc records for remote periods, verification of the ages of very old persons is seldom possible.
The ages in detail of the persons whose deaths were registered during the year are given by sexes and counties in Abstract VII.
6. Proportion of Deaths from the Principal Causes.—Table G shows the deaths from the principal causes as proportions per 1,000 of the total deaths in certain age groups. I t will be seen from this table that , for all ages taken together, heart disease bears the greatest proportion to the total deaths, which is the usual experience ; and that the deaths from this cause occur mainly among persons of fairly advanced ages. The proportions were high also for cancer, senility, cerebral haemorrhage, tuberculosis, pneumonia, congenital debility, etc., and bronchitis.
The mortality from 10 of the principal causes of death during the year is shown in Diagram I I I .
At ages under one year, apart from congenital debihty, etc., the highest proportions of deaths were caused by pneumonia, diarrhoea and enteritis, measles, whooping cough, and bronchitis.
20 Report—I9m.
Between the ages of one and ten the highest proportions were caused by the common infectious diseases, pneumonia, tuberculosis (the deaths from which are mainly due to tuberculosis of the central nervous system), diseases of the digestive system, and violence. It is noteworthy that violence is usually prominent as a cause of death at these ages, and particularly at the ages between five and ten, most of such deaths being due to burns, scalds, and motor accidents.
Between the ages of ten and thirty-five, tuberculosis (principally of the respiratory system) caused by far the largest proportion of deaths.
From age thirty-five onwards, heart disease, senility, cancer, cerebral haemorrhage, tuberculosis, pneumonia, bronchitis, diseases of the digestive and circulatory systems, and nephritis were responsible for the largest proportions of the total mortaHty.
Tables H and J show for each of the principal causes the numbers of deaths and the death rates for each year since 1929, together with corresponding particulars for Eire in respect of the year 1938.
7. Deaths from the Principal Epidemic Diseases.—In comparison with the numbers recorded for the previous year, there was a marked increase in the number of deaths from measles (due to an epidemic in Belfast during the first quarter of the year) and shght increases in the numbers of deaths from scarlet fever and diphtheria. Deaths from typhoid and paratyphoid fevers, whooping-cough, influenza, and diarrhceal diseases of children under two years of age show, however, marked decreases.
The notifications of certain infectious diseases for each County Borough, Municipal Borough, and Urban and Rural District in Northern Ireland for the year 1938 are shown in Abstract XIV,
8. Influenza.—The deaths from influenza during the year numbered 258, giving a rate of 0.20 per 1,000 of the population, compared with a rate of 0.90 for the year 1937. Mortality from this disease was highest in the fourth quarter of the year, instead of in the first quarter as is usually the case.
Diagram III.—Northern Ireland : Mortality from Principal Causes, 1938.
CAUSES OF D E A T H PERCENTAGE
OF TOTAL DEATHS
NUMBER OF DEATHS
1,000 2,000 3,000
MEASLES 1 . 8
NEPHRITIS (ACUTE AND CHRONIC) 2 . 3
BRONCHITIS . . 3 . 7
CONGENITAL DISEASES 5 . 6
PNEUMONIA . . 5 . 8
TUBERCULOSIS 6 . 7
CEREBRAL HAEMORRHAGE 7 . 7
OLD AGE 9 . 3
CANCER 9 . 6
HEART DISEASE 20 . 5
to
TABLE G.—Northern Ireland : Proportion of Deaths from the Principal Causes per 1,000 of the total Deaths at certain Age-Periods, 1938.
Typhoid and Paratyphoid Fevers . . Measles Scarlet Fever Whooping-cough Diphtheria Influenza Encephalitis Lethargica . . Cerebro-spinal Fever Tuberculosis of Respiratory System Other Tuberculous Diseases Syphilis General Paralysis of the Insane,
Tabes DorsaUs Cancer, Malignant Disease Diabetes Cerebral Haemorrhage, etc. Hear t Disease . . Aneurysm Other Circulatory Diseases Bronchitis Pneumonia (all forms) Other Respiratory Diseases Peptic Ulcer Diarrhoea, etc. (under 2 years) Appendicitis Cirrhosis of the Liver Other Diseases of Liver, etc. Other Digestive Diseases Acute and Chronic Nephritis Puerperal Sepsis Other Puerperal Causes . . Congenital Debility, Premature Birth,
Malformations, etc. Senility Suicide Other Violence . . Other Defined Diseases . . Causes Ill-defined or Unknown . .
A L L CAUSES
*A11 Ages
18 3 6 4
15 2 1
49 18
1
1 96
9 77
205 1
35 37 58 13 8
13 5 2 6
20 23
2 6
56 93
3 27 81
6
1,000
- 1
42 1
29 2 7
2 1
12 4
i
2 28
132 12
102 1
2 15 2
503
16 81
3
1,000
1-
247 21 65 31 13
4 10 68
8 3 1 4 1 3
14 225
19
37 6
3 41 4
12
52 96 12
1,000
5 -
4 107 77 17 99 17
4 17
129
13 9
30
4 4
86 9
30
60 17
13
103 142
9
1,000
10-
16 32
64 5 5
79 122
11 16
5 148
5
16 58 11
37
21 16
16
95 222
1,000
1 5 -
2 4 5
9 18 5 6
370 91
4
2 13 22 11 76
2 2 6
52 9 7
18
6 15 15 4
31
4
7 65
115 4
1,000
AGS
2 5 -
1 3
4 8
14
325 55
1
1 26 13 15
111
6 4
46 11 17
15 1 4
17 33 22 77
3
12 47
105 3
1,000
3 5 -
1 2 3
i 16 12
185 29
2
5 110
4 28
137 2
15 14 67 17 22
13 1
12 22 43 13 35
15 37
127 10
1,000
4 5 -
1 1
2 14 2
80 20
4
5 177
9 67
216 2
36 31 62 13 19
10 4 7
20 48
1
1
7 25
107 9
1,000
5 5 -
— 10 2
— 33 10
1
3 191
16 93
266 2
48 32 47 18 16
4 5
10 25 37
2 4
21 92 12
1,000
6 5 -
—
19 1
7 1
— 131
14 125 314
— 57 53 32 12 7
i 2 6
22 26
72 1
19 69
9
1,000
7 5 -
18
i 1
— 71
6 116 263
— 46 52 25
8 3
i 1 5
11 16
288
— 20 48
1,000
85 and over
20
33 4
84 176
37 50 20 12
1
3 11
1
493
29 26
1,000
K5 to
o
C£)
Report—1938. 23
TABLE H.—Northern Ireland : Number of Deaths from the Principal Causes, 1929-38.
System Other Tuberculous Diseases Syphilis General Paralysis of the
Insane, Tabes Dorsalis Cancer, Malignant Disease Diabetes Cerebral Haemorrhage, etc. Heart Disease . . Aneurysm Other Circulatory Diseases Bronchitis Pneumonia (all forms) Other Respiratory Diseases Peptic Ulcer Diarrhoea, etc. (under 2 yrs.) Appendicitis Cirrhosis of the l i ver Other Diseases of Liver, etc. Other Digestive Diseases Acute and Chronic Nephritis Puerperal Sepsis Other Puerperal Causes Congenital Debility, Prema
ture Birth, Malformations, etc.
Senility Suicide Other Violence . . Other Defined Diseases . . Causes Ill-defined or Un
known
ALL CAUSES
Uncertified Deaths
1929
42 191 40
250 74
1,335 37
6
1,219 392
24
50 1,469
115 1,337 2,782
16 351
1,348 1,486
333 144 251
89 30 73
467 480
37 88
944 2,153
71 452
1,500
146
19,822
1,803
1930
29 54 25
175 73
255 42 9
1,180 411
24
49 1,477
121 1,243 2,845
13 372 946 959 275 142 208
86 28 86
435 500 39 98
889 1,939
61 448
1,480
132
17,148
1,487
1931
15 208 34 84 61
575 48 9
1,130 396
17
29 1,564
120 1,303 3,062
12 422 946
1,123 291 164 219
96 39 69
412 505
43 89
855 1,951
63 470
1,484
141
18,049
1,450
1932
16 63 24
257 62
455 31 14
1,047 368
26
48 1,566
136 1,388 3,012
15 444 893
1,180 296 147 308
91 34 90
401 423
39 95
974 1,770
71 443
1,439
146
17,812
1,414
1933
25 106 48
163 114 872
35 14
1,076 385
17
46 1,528
124 1,300 2,995
19 420 946
1,178 349 158 292 107 26 82
374 485
41 92
881 1,699
70 511
1,455
121
18,154
1,197
1 1934
17 102 53
100 114 339
46 6
1,071 364
24
38 1,649
155 1,389 3,075
18 449 817 997 265 132 194 125 41 96
375 470
55 104
983 1,726
66 524
1,409
133
17,521
1,170
1935
41 420 135 70
155 416
36 12
1,023 327
27
36 1,602
129 1,395 3,315
13 436 849
1,277 280 149 364 123 22 97
363 465
55 81
930 1,762
51 513
1,492
131
18,592
1,113
1936
21 22 90
133 129 273
42 6
999 316
31
40 1,664
131 1,376 3,635
11 557 806
1,046 283 151 318 104 31 94
374 503
58 99
1,026 1,854
51 532
1,498
125
18,429
1,174
1937
26 28 32
146 69
1,148 51 13
972 279
30
32 1,668
147 1,396 3,700
17 544 860
1,087 296 162 267
92 31 86
351 448
31 96
1,037 1,850
67 539
1,560
124
19,282
1,223
1938
7 308
49 110
76 258
39 12
889 309
25
23 1,700
166 1,357 3,618
15 621 650
1,026 224 144 226
85 34
102 347 410
31 106
993 1,644
54 476
1,423
112
17,649
951
Eire 1938
46 102 81
180 314 702
27 55
2,498 718 — — 3,703 270
2,274 7,786 J865 1,839 2,287
623 341 563 190 52
164 850
1,119 46
188
1,899 5,570
97 860
3 192
540
40,041
6,401
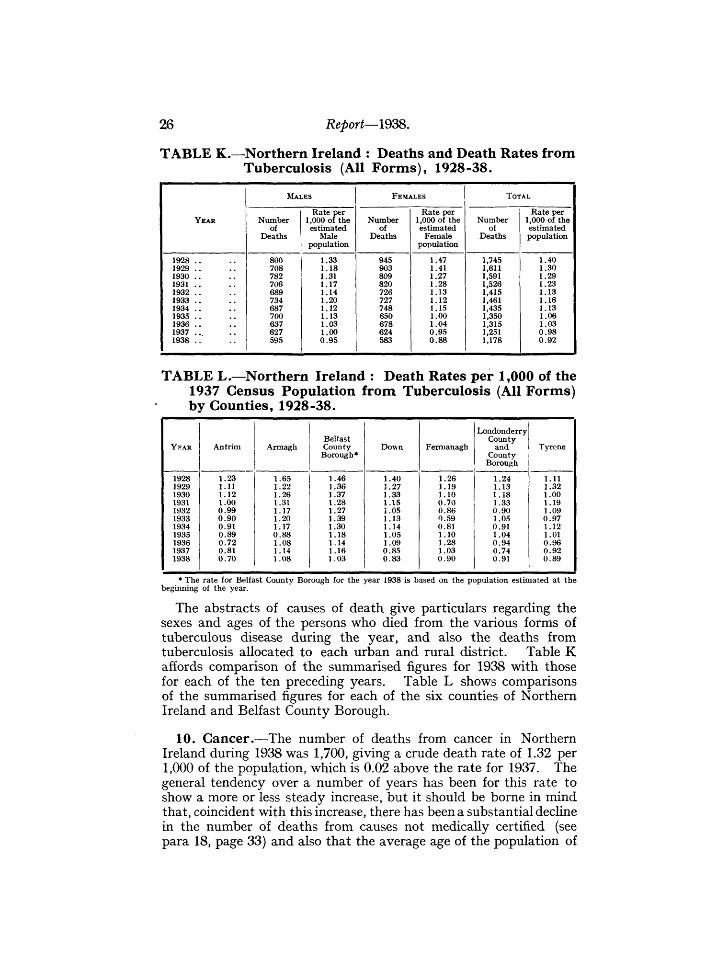
9. Tuberculosis.—The death rate from this cause of 0.92 per 1,000 of the population is 0.06 below the rate for 1937. Thus the general downward trend of the death rate is continued, and in the year under review is the lowest recorded since Northern Ireland became a separate administrative unit in 1922. The crude death rate in Northern Ireland from this disease in 1938, whilst lower than that for Eire, is still higher than the corresponding rates for England and Wales, and Scotland.
From Table G it will be seen that tuberculous diseases have caused 461 deaths in every 1,000 between the ages of 15 and 25, and 380 per 1,000 between 25 and 35. Further, from Abstract VIII it appears that almost one-half of the deaths from all forms of tuberculous disease during 1938 occurred between the ages of 15 and 35.
24 Report—1938.
Tuberculosis is in general much more prevalent in the cities and towns than in the country districts. In 1938 the rate per 1,000 of the population for all urban areas was 1.02 and for rural areas 0.81. The rates in 1937 were 1.15 and 0.78, respectively.
Diagram IV illustrates the general improvement in the death rates from tuberculosis since 1924 in both Urban and Rural Areas. It also shows that the rural rates for pulmonary tuberculosis are consistently below the urban rates, this, of course, being in part due to the younger age distribution of the urban population.
Tuberculosis of the respiratory system accounted for 74 per cent, of the total deaths from tuberculosis.
TABLE J.—Northern Ireland : Death Rates per 100,000 of Estimated Population from the Principal Causes, and Uncertified Deaths as a percentage of Total Deaths, 1929-38.
System Other Tuberculous Diseases Syphilis . . General Paralysis of the
Insane, Tabes Dorsalis Cancer, Malignant Disease Diabetes Cerebral Haemorrhage, etc. Heart Disease . . Aneurysm Other Circulatory Diseases Bronchitis Pneumonia (all forms) Other Respiratory Diseases Peptic Ulcer Diarrhoea, etc. (imder 2 yrs.) Apjiendicitis Cirrhosis of the Liver Other Diseases of Liver, etc. Other Digestive Diseases Acute and Chronic Nephritis Puerperal Sepsis Other Puerperal Causes Congenital Debility, Prema-:
ture Birth, Malformations, etc
Senility Suicide other Violence . . Other Defined Diseases . . Causes Ill-defined or Un-
kno^im . .
ALL CAUSES
Percentage of Uncertified Deaths
1929
3 .4 15.4 3 .2
20.2 6 .0
107.7 3 .0 0 .5
98 .3 31 .6
1.9
4 .0 118.5
9 .3 107.8 224.4
1.3 28.3
108.7 119.8 26.9 11.6 20 .2
7.2 2 .4 5 .9
37.7 38.7
3 .0 7.1
76.1 173.6
5 .7 36.5
121.0
11.8
1598.5
9.1
1930 1931
2 .3 1.2 4 .4
. 2 . 0 14.1 5.9
20.6 3 .4 0 .7
95.4 33 .2
1.9
4 .0 119.4
9 .8 100.5 230.0
1.1 30.1 76.5 77.5 22 .2 11.5 16.8 7.0 2 . 3 7.0
35 .2 40.4
3 . 2 7 .9
71.9 156.8
4 .9 3 6 . 2
119.6
10.7
1386.3
8 .7
16.7 2.7 6 .8 4 .9
46 .3 3 .9 0 .7
90 .9 31 .9
1.4
2 .3 125.8
9.7 104.8 246.3
1.0 34.0 76.1 90 .3 23.4 13.2 17.6 7.7 3.1 5 .6
33.1 40.6
3 .5 7.2
68 .8 157.0
5.1 37 .8
119.4
11 .3
1452.1
8 .0
1932
1.3 5 .0 1.9
20.5 5 .0
36.4 2 .5 1.1
83.7 29.4
2.1
3 . 8 125.2
10.9 111.0 240.8
1.2 35.5 71.4 94 .3 23.7 11 .8 24 .6
7 .3 2.7 7 .2
32.1 33 .8
3.1 7 .6
77.9 141.5
5.7 35.4
115.0
11.7
1423.8
7 .9
1933
2.0 8 .4 3 . 8
13.0 9.1
69 .3 2 .8 1.1
85.5 30 .6
1.4
3 .7 121.5
9.9 103.3 238.1
1.5 33.4 75.2 93 .6 27.7 12.6 23 .2
8.5 2.1 6.5
29.7 38.6
3 . 3 7 .3
70.0 135.1
5 .6 40.6
115.7
9 . 6
1443.1
6 .6
1934
1 3 8.1 4 .2 7 .9 9 .0
26.8 3 .6 0.5
84.7 28.8
1.9
3 .0 130.4
12.3 109.8 243.1
1.4 35.5 64.6 78.8 20.9 10.4 15.3 9.9 3 .2 7 .6
29 .6 37 .2
4 .3 8 .2
77 .7 136.4
5 .2 41 .4
111.4
10.5
1385.1
6 .7
1935
3 . 2 33 .0 10.6 5.5
12.2 32.7
2 .8 0 .9
80.5 25.7
2.1
2 .8 126.0
10.1 109.8 260.8
1.0 34 .3 66.8
100.5 22.0 11.7 28.6
9.7 1.7 7 .6
28.6 36.6
4 .3 6.4
73 .2 138.6
4 .0 40.4
117.4
10.3
1462.8
6 .0
1936
1.6 1.7 7.1
10.4 10.1 21.4
3 . 3 0 .5
78 .3 24 .8
2 .4
3.1 130.4
10.3 107.8 284.9
0 .9 43.7 63 .2 82.0 22 .2 11.8 24.9
8 .2 2 .4 7.4
29 .3 39.4
4 .5 7 .8
80.4 145.3
4 .0 41.7
117.4
9 . 8
1444.3
6 .4
1937
2 .0 2 .2 2 .5
11.4 5.4
89.6 4 .0 1.0
75 .9 21.8 2 .3
2 .5 130.2
11.5 109.0 288.8
1.3 42.5 67.1 84.9 23.1 12.6 20 .8
7 .2 2.4 6.7
27.4 35.0
2 .4 7 .5
81 .0 144.4
5 .2 42.1
121.8
9 .7
1505.2
6 .3
1938
0 .5 23.9
3 .8 8.6 5.9
20.1 3 .0 0.9
67.6 24.0
1.9
1.8 132.2
12.9 105.5 281.3
1.2 48 .3 50.5 79.8 17.4 11.2 17.6 6.6 2 .6 7 .9
27.0 31.9
2 .4 8 .2
77.2 127.8
4.2 37.0
110.6
8 .7
1372.0
5 .4
Eire 1938
1.6 3 .5 2.7 6.1
10.7 23.9
0 .9 1.9
85.1 24.4
— — 126.1 9 .2
77 .4 265.1 } 2 9 . 4
62.6 77.9 21 .2 11.6 19 .2 6.4 1.8 5.6
28.9 38.1
1.6 6 .4
64.7 189.6
3 . 3 29 .3
108.7
18.4
1363.3
16.0
25
Diagram IV.—Northern Ireland : Death rates from Tuberculosis for aggregates of Urban and Rural Areas, 1924—1938.
o H • < •-)
O
W
o. m H < Pi
1-20
0-60
0-00
. - " \
\ \ \ \ \
" - - . J ^
^ - > . V N
^ ^ : ^
PULM
_ PULMC
s \
OiHE
"'—* OTHEF
ONARY (URI
NARY (RUR
< FORMS(U
FORMS(Rt
5AN)
N N,
(BANl
V
RAL) ^>^-
\ \ N
V''
^
1924 1926 1928 1930 1932 1934 i936 1935 YEARS
26 Report—1938.
TABLE K.—Northern Ireland : Deaths and Death Rates from Tuberculosis (All Forms) , 1928-38.
* The rate for Belfast County Borough for the year 1938 is based on the population estimated at the beginning of the year.
The abstracts of causes of death give particulars regarding the sexes and ages of the persons who died from the various forms of tuberculous disease during the year, and also the deaths from tuberculosis allocated to each urban and rural district. Table K affords comparison of the summarised figures for 1938 with those for each of the ten preceding years. Table L shows comparisons of the summarised figures for each of the six counties of Northern Ireland and Belfast County Borough.
10. Cancer.—The number of deaths from cancer in Northern Ireland during 1938 was 1,700, giving a crude death rate of 1.32 per 1,000 of the population, which is 0.02 above the rate for 1937. The general tendency over a number of years has been for this rate to show a more or less steady increase, but it should be borne in mind that, coincident with this increase, there has been a substantial decline in the number of deaths from causes not medically certified (see para 18, page 33) and also that the average age of the population of
Report—1938. 27
Northern Ireland is increasing. Either or both of these factors may contribute to an increased death rate from cancer—the former by attributing to cancer, deaths which in the absence of medical opinion might have been ascribed to other causes, and the latter because cancer is a disease of middle and old age.
The death rates from cancer among males and females in 1938 were 1.25 and 1.39 per 1,000 respectively ; the male rate thus being 90 per cent, of the female rate, as against 92 per cent, in 1937.
The most frequent sites of fatal cancer among males during the year were stomach, 200 ; intestines, 122 ; prostate, 59 ; rectum, 49 ; lung, 48 ; and liver and gall-bladder, 42. Among females the most frequent sites were stomach, 159 ; breast, 157 ; uterus, 125 ; intestines, 123 ; liver and gall-bladder, 56 ; and rectum, 38.
Table M gives particulars regarding sex, age, and sites of fatal cancer during the year 1938, while particulars for the years 1929 to 1938 regarding sex and parts affected, of persons whose deaths were attributed to cancer, appear in Table N.
11. Cerebral Haemorrhage, etc.—The deaths assigned to this heading numbered 1,357, giving a rate of 1.05 per 1,000 of the population. This rate is 0.04 below that for 1937.
12. Heart Disease.—The deaths from the various forms of heart disease during the year numbered 3,618, the rate per 1,000 of the population being 2.81, which is 0.08 below that for the previous year. I t will be observed from Table J that the death rate from this disease has been more or less steadily increasing over the past decade. As in the case of cancer, this may be partly accounted for by the increasing average age of the population of Northern Ireland, and by the diminishing number of deaths from causes not medically certified. In the latter connection, it may be noted that there has been a substantial decrease in the death rate for senility,
13. Bronchitis.—The deaths from bronchitis during the year numbered 650, giving a rate of 0.51 per 1,000 of the population, which is 0.16 below the rate for 1937.
14. Pneumonia.—There were 1,026 deaths from pneumonia during 1938, the rate per 1,000 of the population being 0.80, compared with a rate of 0.85 per 1,000 in 1937.
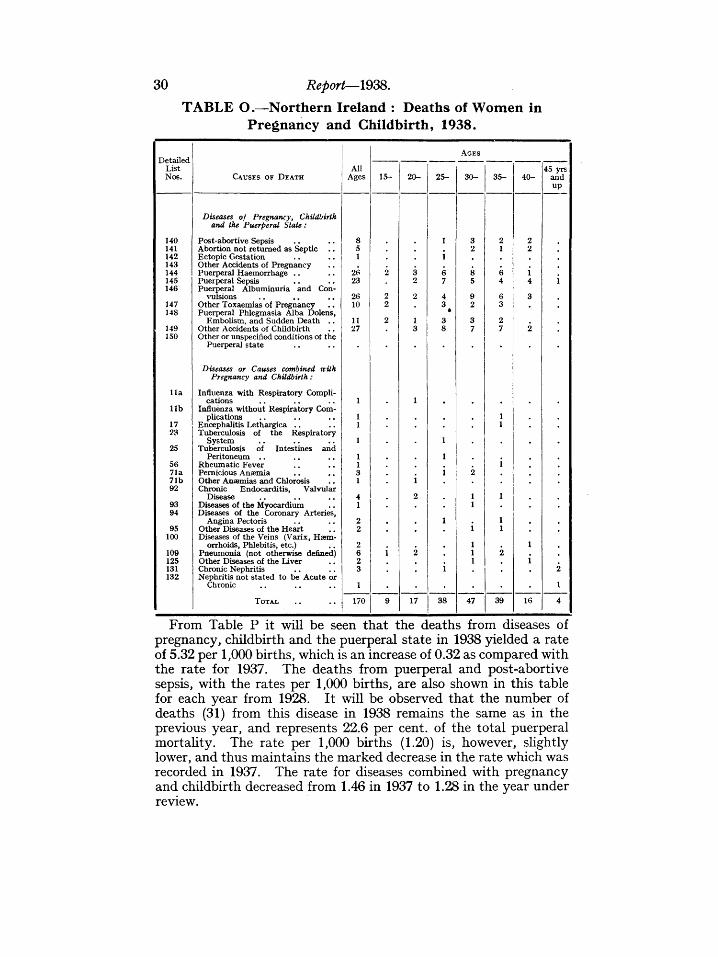
15. Pregnancy and Childbirth.—The mortaUty of women during pregnancy and childbirth is classified under two headings, namely—(1) diseases of pregnancy, childbirth and the puerperal state, and (2) diseases or causes combined with pregnancy and childbirth. The causes of death shown in Table O are those to which the various deaths were assigned.
28 / ^ y Report—193S. TABLE M.—Northern Ireland: Deaths from Cancer by Sex, Age,
TABLE O.—Northern Ireland : Deaths of Women in Pregnancy and Childbirth, 1938.
Detailed List Nos.
140 141 142 143 144 145 146
147 148
149 150
11a
l i b
17 23
25
56 71a 71b 92
93 94
95 100
109 125 131 132
CAUSES OF DEATH
Diseases of Pregnancy, Childbirth and the Puerperal State :
Post-abortive Sepsis Abortion not returned as Septic . . Ectopic Gestation Other Accidents of Pregnancy Puerperal Haemorrhage . . Puerperal Sepsis Puerperal Albuminuria and Con-
NTilsions Other Toxaemias of Pregnancy Puerperal Phlegmasia Alba Dolens,
Embolism, and Sudden Death . . Other Accidents of Childbirth Other or unspecified conditions ot the
Puerperal state
Diseases or Causes combined tiith Pregnancy and Childbirth :
Influenza with Respiratory Complications
Influenza without Respiratory Complications
Encephalitis Lethargica . . Tuberculosis of the Respiratory
System Tuberculosis of Intestines and
Peritoneum . . Rheumatic Fever Pernicious Anaemia other AnsBmias and Chlorosis Chronic Endocarditis, Valvular
Disease Diseases of the Myocardium Diseases of the Coronary Arteries,
Angina Pectoris Other Diseases of the Heart Diseases of the Veins (Varix, Hasm-
orrhoids. Phlebitis, etc.) Pneumonia (not otherwise defined) Other Diseases of the Liver Chronic Nephritis Nephritis not stated to be Acute or
Chronic
TOTAL
All Ages
8 5 1
26 23
26 10
11 27
1
1 1
1
1 1 3 1
4 1
2 2
2 6 2 3
1
170
15-
2
2 2
2
9
20 -
3 2
2
1 3
1
i 2
2
17
2 5 -
1
i 6 7
4 3
* 3 8
1
1
i
1
i
38
AGES
30-
3 2
8 5
9 2
3 7
47
3 5 -
2 1
6 4
6 3
2 7
1 1
1
1
1 1
2
39
40 -
2 2
i 4
3
2
1
i
16
45 yrs and up
i
2
1
4
From Table P it will be seen that the deaths from diseases of pregnancy, childbirth and the puerperal state in 1938 yielded a rate of 5.32 per 1,000 births, which is an increase of 0.32 as compared with the rate for 1937. The deaths from puerperal and post-abortive sepsis, with the rates per 1,000 births, are also shown in this table for each year from 1928. It will be observed that the number of deaths (31) from this disease in 1938 remains the same as in the previous year, and represents 22.6 per cent, of the total puerperal mortality. The rate per 1,000 births (1.20) is, however, sHghtly lower, and thus maintains the marked decrease in the rate which was recorded in 1937. The rate for diseases combined with pregnancy and childbirth decreased from 1.46 in 1937 to 1.28 in the year under review.
Report—1938. 31
TABLE P.—Northern Ireland : Deaths of Women in Pregnancy and Childbirth, 1928-38.
TABLE 0.—Northern Ireland : d e a t h s of Women m Pregnancy and Childbirth by Counties and County Boroughs for 1938, and (in italics) for the average of the five years 1933-1937.
AREA
N O R T H E R N / I R E L A N D \
A L L URBAN AREAS i
A L L RURAL AREAS i
Belfast Co. Borough*
Londonderry Co. / Borough \
Antrim . . <
Armagh . . i
Down . . <
Fermanagh <
Londonderry (exc.f County Borough)\
Tyrone . . <
Total Deaths
Puerperal and P o s t -Abor t ive
Sepsis
31 48
16 28
15 20
12 19
1
5 8
2 4
5 9
2 2
3 2
2 4
Other Puerperal Diseases
106 94
60 53
46 41
36 32
3 4
12 16
10 9
17 14
4 2
13 8
11 9
Total Puerperal Diseases
137 142
76 81
61 61
48 51
3 5
17 24
12 13
22 23
6 4
16 10
13 13
Total Births
25,742 25,206
14,351 14,093
11,391 11,112
9,146 8,979
1,262 1,212
3,733 3,660
2,181 2,144
3,786 3,770
975 965
2,020 1,961
2,639 2,514
Death Rate per 1,000 Births
Puerperal and Post-Abortive
Sepsis
1.20 1.90
1.11 1.99
1.32 1.80
1.31 2.12
0.83
1.34 2.19
0.92 1.87
1.32 2.39
2.05 2.07
1.48 1.02
0.76 1.59
Other Puerperal Diseases
4 .12 3.73
4.18 3.76
4.04 3.69
3.94 3.56
2 .38 3.30
3.21 4.37
4 .58 4.20
4.49 3.71
4 .10 2.07
6.44 4.08
4.17 3.58
Total Puerperal Diseases
5.32 5.63
5.29 5.75
5.36 5.49
5.25 5.68
2.38 4.13
4.55 6.56
5.50 6.07
5.81 6.10
6.15 4.14
7.92 5.10
4 .93 5.17
Table Q shows the number of deaths from puerperal diseases, distinguishing puerperal and post-abortive sepsis, with corresponding rates experienced in each County and County Borough in Northern Ireland for the year 1938 and for the average of the years 1933 to
32 Report—1938.
1937. From this it will be seen that the rates for all puerperal diseases generally show some improvement on the average annual rates for the preceding five years.
16. Deaths from Violence.—The number of deaths ascribed to violence during the year was 530 (328 males and 202 females), which is a decrease of 76 on the number registered for 1937, and is equivalent to 3.0 per cent, of the total deaths registered. Of these 530 deaths, 10 were attributed to homicide, 54 to suicide, and 448 to accidental causes.
In some cases in which inquests have been held to inquire into the cause of death, the verdict is not sufficiently exphcit to determine whether the death was due to murder, manslaughter, or to accidental causes, and steps are taken to obtain additional information from the Ministry of Home Affairs regarding aU homicidal deaths that are dealt with by the Courts of Law.
In the following table cases in which coroners returned " open verdicts " are included under the head " Other Violent Deaths," but it is possible that a number of them were due to suicide. Among the 18 deaths so returned there were 11 cases (6 males and 5 females) in which the coroners returned a verdict of " found drowned ".
Of the 64 deaths from burns and scalds, 22 were of children under 5 years of age.
TABLE R.—Northern Ireland
CAUSES OF DEATH
Homicide. Infanticide (172) Manslaughter (in 173-
175) Murder (in 173-175) . . Justifiable Homicide
(in 173-175)
Suicide (163-171)
Accidental Causes. Bums and Scalds (181) Drowning (183) Fall (in 186) Firearms (184) Mechanical Suffocation
(182) . . Poison and Poisonous
Gases (177-179) . . Vehicles— Motor
(in 186) Other „
Other Accidental Causes
ether Violent Deaths. (195-198)..
TOTAL DEATHS FROM ViOLEVCE
Total
1
4 2
51
82 29
155 5
10
17
125 21 62
19
583
1936
Males
1
3 2
40
26 21 54
5
6
10
98 15 40
16
337
Females
1
11
56 8
101
4
7
27 6
22
3
246
: Deaths from Violence, 1936-38.
Total
4
2 2
67
87 35
154 6
10
11
114 28 64
22
606
1937
Males
2
1 2
49
40 30 78
6
6
5
77 21 49
14
380
Females
2
1
18
47 5
76
4
6
37 7
15
8
226
Total
7
3
54
64 27
158 2
9
14
101 22 51
18
530
1938
Males
3
2
43
26 23 72
2
6
9
76 17 36
13
328
Females
4
1
11
38 4
86
3
5
25 5
15
5
202
17. Ill-defined Causes of Death.—^The deaths allocated to this heading during the year numbered 112 as against 124 in 1937.
Report—1938, 33
Inquiries were sent to medical practitioners and coroners requesting further information as to 704 deaths, which appeared to have been indefinitely certified, representing 4.0 per cent, of the total deaths registered, and 683 replies were received, 586. containing such useful additional particulars as enabled those cases to be classified more precisely.
18. Uncertified Deaths.—The deaths registered as uncertified, i.e., those in which there was neither a medical attendant during the last illness nor an inquest held by a coroner, numbered 951, representing 5.4 per cent, of the total deaths registered. I t will be seen from Table J that the percentage of uncertified deaths has been falHng more or less steadily during the past ten years, the figure for 1938 being the lowest on record. In 1922 uncertified deaths represented 12.7 per cent, of the total deaths.
Of the total uncertified deaths, 79.3 per cent, occurred in rural areas and 20.7 per cent, in urban areas.
Deaths of persons aged 65 years and upwards represented 69.2 per cent, of the uncertified cases, and deaths of infants under 1 year of age 11.1 per cent.
The causes of death, ages, and sex of the persons whose deaths were registered as uncertified are given in Abstract IX.
19. Inquests.—The circumstances of 935 deaths were considered by the coroners in 1938. Inquests were held in 505 of these cases, which represents one inquest for every 35 deaths registered. In 1937 the inquests numbered 551.
In Table S the number of cases referred to coroners in which inquests were considered unnecessary may be understated, as coroners may not always formally notify the Registrars of such cases. Consequently the number of cases not referred to coroners may be correspondingly overstated.
TABLE S.—Northern Ire land; Uncertified Deaths and Inquests, 1938.
COUNTIES
NORTHERN IRELAND
ANTRIM ARMAGH BELFAST CO. BOROUGH . . DOWN FERMANAGH LONDONDERRY CO. AND
Co. BOROUGH TYRONE
TOTAL DEATHS REGISTERED
17,649
2,547 1,536 6,069 2,782
796
2,077 1,842
Certified
By Medical Practitioners
Not referred
to Coroners.
16,009
2,296 1,356 5,713 2,590
616
1,903 1,535
Referred to Coroners: Inquests
considered unnecessary.
184
68 34 16 16
5
24 21
By Coroners
505
84 40
201 73 19
42 46
Uncertified
Not referred
to Coroners
705
74 80 19 71
152
93 216
Referred to Coroners: Inquests
considered unnecessary
246
25 26
120 32
4
15 24
34 Report—1938.
20. Infant Mortality.—Deaths of infants under 1 year of age numbered 1,933, or 75 per 1,000 births registered, as compared with 77 per 1,000 in 1937.
Diagram V shows the deaths of infants at various ages under 1 year for the period 1934 to 1938.
Of the 1,933 deaths of infants under 1 year of age, 1,044 were of males and 889 of females, the former number being equivalent to 79 per 1,000 births of males and the latter to 71 per 1,000 births of females. The corresponding rates for 1937 were 83 and 71 respectively.
The infant mortahty rate for the aggregate of the Urban Districts of Northern Ireland in 1938 was 87 per 1,000 births, and the rate for the aggregate of the Rural Districts was 60 per 1,000, the corresponding rates for 1937 being 87 and 66 respectively.
In 1938 and 1937 the rates for deaths of infants under 1 year of age were 53 and 58 per 1,000 births, respectively, for England and Wales ; 70 and 80 for Scotland ; and 67 and 73 for Eire.
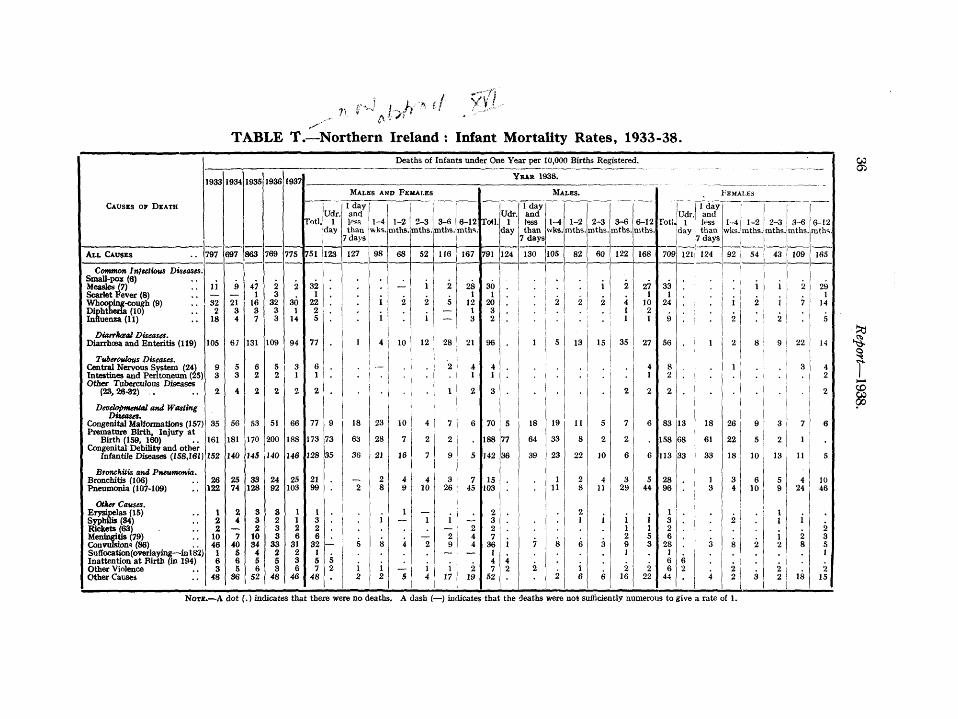
Table T gives the infant mortality rates for Northern Ireland for each of the six years 1933-38, by causes of death, and, for the last of these years, by sexes and age-periods. Reference to Table B will show that, apart from comparatively small annual variations, the infant mortality rate in Northern Ireland has exhibited a downward tendency since 1901.
Table U compares the infant mortaUty rates for the aggregate of the urban areas with those for the aggregate of the rural areas of Northern Ireland. The differences usually found between urban and rural rates and between male and female rates are marked, the urban rates being, in general, appreciably in excess of the corresponding rural rates.
Diagram VI shows the Urban and Rural infant mortality rates for the period 1924 to 1938. It will be seen that the Urban rate is consistently above and fluctuates more than the Rural rate. The diagram also shows the Urban and Rural birth rates for the same period.
The infant mortaUty rate for Belfast County Borough for 1938 was 96. The corresponding rates for each of the years 1933 to 1937 were 101, 81, 112, 101, and 94, respectively.
Abstract VI gives the number of infant deaths, together with the number of births, for each urban and rural district of Northern Ireland.
21 . Mortality among Illegitimate Children.—Deaths of illegitimate children under 1 year of age numbered 171 in 1938, which is equivalent to a rate of 149 per 1,000 of the illegitimate births
35 Diagram V.—Northern Ireland : Deaths of Infants at Ages under
1 Year, 1934—1938.
2.5C0
2,000
en
H <
Q
§ 1,500
PQ
:z
AGE AT DEATH—
6 Months and under 1 Year
1 Month ,, , , 6 Months
1 Week „ „ 1 Month
1 Day ,. . , 1 Week
Under I Day . . t..
1,000
t -
500
1935
1936
•.••••"•.•:;.j l^ :v ;v^
1937
tmW'friif
1938
2.500
2.000
CO
<
Q
1,500 o
-1
H
1,000
500
TABLE T.—Northern Ireland : Infant Mortality Rates, 1933-38. n ^-Vi'>^
Diarrhceal Diseases, Diarrhoea and Enteritis (119)
Tuberculous Diseases. Central Nervous Svstem (24) Intestines and Peritoneum (25) Other Tuberculous Diseases
(23,28-82) .
Developmental and Wasting Diieases.
Congenital Malformations (157) Premature Birth, Injury at
Birth (159, 160) Congenital Debility and other
Infantile Diseases (158,161)
Bronchitis and Pneumonia. Bronchitis (106) Pneumonia (107-109)
Other Causes. Erysipelas (15) Syphfl^ (34) Rickets (63) Meningitis (79) Convulsions (86) Suffocation(ov«rIaying—inl 82] Inattention at Birth (in 194) Other Violence Other Causes
1933
797
11
— 32 2
18
105
9 3
2
35
161
152
26 122
1 2 2
10 46
1 6 3
48
1934
697
9
— 21 3 4
67
5 3
4
56
181
140
25 74
2 4
— 7 40
5 6 5
36
1935
863
47 1
16 3 7
131
6 2
2
53
170
145
33 128
3 3 2
10 34
4 5 6
52
1936
769
2 3
32 3 3
109
5 2
2
51
200
140
24 92
3 2 3 3
33 2 5 3
48
1937
775
2
30 1
14
94
3 1
2
66
188
14a
25 103
1 1 2 6
31 2 3 6
46
1 Udr.
Totl. 1 day
751 123
1 -_ 32
1 22
2 5
77
6 1
2
77
173
128
21 99
1 3 2 6
32 1 5 7
48
9
73
35
— 5 2
Deaths of Infants under One Year per
MALES AND FEMAJ.ES
1 day and iPSS than
7 days
127
1
18
63
36
—• 2
5
1 2
1-4 wks.
98
i i
4
— .
23
28
21
2 8
i 8
i 2
1-2 mths.
68
— 2
10
. •
10
7
16
4 9
1
— 4
— 5
2-3 mths.
52
1
2
i
12
.
.
4
2
7
4 10
— 1
— 2
i 4
3-6 mths.
116
2
5
— —
28
2
1
7
2
9
3 26
i — 2 9
— i 17
0,000 Births Registered.
YiAn 1»38.
6-12 mths.
167
28 1
12 1 3
21
4 1
2
6
5
7 45
— 2 4 4
— 2
19
To«l.
791
Udr. 1
day
124
30 1
20 3 2
96
4 1
j
' •
70
188
142
15 103
2 3 2 7
36 1 4 7
52
5
77
36
1
4 2
1 day and less than
7 days
130
[
1
18
64
39
7
2
MALES.
1-4 1-2 wks. mths.
105 82
. i 1
2 2 . I
5
19
33
23
1 11
8
2
13
. •
11
8
22
2 8
2 1
6
i 6
2-3 mths.
60
i 2
15
.
5
2
10
4 11
i 3
6
3-6 mths.
122
2
4 1 1
35
'. 2
7
2
6
3 29
i 1 2 9 1
2 16
6-12 niths.
168
27 1
10 2 1
27
4 1
2
6
6
5 44
i 1 5 3
2 22
Toti.
709
33 1
24
9
56
8 2
2
83
158
113
28 96
1 3 2 6
28 1 6 6
44
Udr. 1
day
121
*
13
68
33
6 2
1 day and less than
7 days
124
.
1
•
18
61
33
1 3
3
4
" E .MALES
1-t wks.
92
i 2
2
1
26
22
18
3 4
2
.
. 8
2 2
1-2 mths.
54
1
2
8
9
5
10
6 10
2
3
2-3 mths.
43
1
i 2
9
.
3
2
13
5 9
1 1
i 2
2 2
3-6 mths.
109
2
7
22
6-12 mths.
165
29 1
14
5
14
1 3 1 4 • 1 2
7
1
11
4 24
i 2 8
18
2
6
5
10 46
2 3 5 1
2 15
03 on
T SP
NOTE.—^A dot (.) indicates that there were no deaths, A dash (—) indicates that the deaths were not sufficiently numerous to give a rate of 1.
!» 'MM. ^l>l7a(/ x^
TABLE U.—Infant Mortality Rates for the Aggregates of Urban and of Rural Areas in Northern Ireland, 1933-38.
DEATH
ALL URBAN AREAS
Common Infectious Diseases
Diarrhceal Diseases Tuberculous
Diseases Developmental and
Wasting Diseases Bronchitis and
Pneumonia Other Causes
ALL CAUSES . .
ALL RURAL AREAS
Common Infectious Diseases
Diarrhneal Diseases Tuberculous
Diseases Developmental and
Wasting Diseases Bronchitis and
Pneumonia Other Causes
ALL CAUSES
Ift W
60 159
18
361
191 145
933
67 40
10
334
96 85
331
1934
1 1935
1
48 99
13
396
124 107
786
26 27
10
851
67 99
581
94 205
10
398
204 134
1,045
48 38
10
331
107 98
631
1936
47 164
10
426
138 114
899
39 39
7
345
86 86
802
1937
32 137
8
431
149 113
868
68 40
5
360
102 79
655
Deaths of Infants under One Year per
MALES AND FEMALES
Totl
82 107
10
403
152 114
868
35 38
9
346
82 94
603
Undr 1
day
131
7
138
97
7
104
1 day and less than
7 days
123
2 8
132
2
110
2 8
121
1-4 wks.
b
71
10 10
97
4 3
1
71
9 12
100
1-2 mths.
1 13
36
16 10
76
4 7
28
9 11
59
2-3 mths.
5 15
14
15 9
59
2 8
12
12 9
43
3-6 mths
8 45
1
18
34 33
139
10 8
4
16
25 25
87
6-12 mths.
68 29
9
11
74 36
228
15 11
4
12
25 23
90
Totl
74 136
11
428
141 121
911
31 47
3
366
88 102
637
Undr. 1
day
1 day and less
than 7da5^
1
i
133
7
140
99
5
104
127
8
135
2
114
9
125
10,000 Births Registered.
Y E A R 1938.
MALES.
\-4 wks
7
78
13 8
106
3 3
73
10 12
102
1-2 mths.
18
42
11 15
85
5 7
40
10 16
78
2-3 mths
4 19
18
15 8
63
2 10
17
14 12
55
3-6 mths.
9 55
1
18
35 35
154
5 9
2
12
28 26
81
6-12 mtbs.
61 36
9
13
67 40
228
16 16
2
10
26 23
92
iot l Undr.
1 day
89 80
9
37V
163 107
823
39 28
14
326
76 85
568
1 day and less than
7da5^
128
7
136
118
4 7
130
1
94
9
103
2
105
4 7
118
FEN ALES.
1
1-4 wks.
3
64
7 13
87
5 2
2
69
7 12
98
1-2 mths.
9
29
22 6
66
4 7
16
7 5
39
2-3 mths.
6 12
10
16 10
53
2 5
7
11 5
30
3-6 mths
6 33
19
33 32
123
14 7
7
20
21 23
93
6-12 mths.
76 22
9
9
81 32
228
14 5
5
14
25 23
87
<J0
^ * The diseasesi ncluded under the headings in this column are given in Table T.
TABLE v.—Northern Ireland : Mortality among Illegitimate Children, 1933-38.
Diarrhcecd Diseases. Diarrhoea and Enteritis (119)
Tuberculous Diseases. Central Nervous System (24) Intestines and Peritoneum (25) Other Tuberculous Diseases (23, 26—32)
Developmental and Wasting Diseases. Congenital Malformations (157) Premature Birth, Injury a t Birth (159, 160) . . Congenital Debility and other Infantile Diseases
0 her Causes. Erysipelas (15) Syphilis (34) Rickets (63) Meningitis (79) Convulsion's (86) . . Suffocation (overlayuig—in 182) Inat tent ion a t Birth (in 194):—
Desertion Other
Other Violence Other Causes
ALL CAUSES . .
Rate per 10,000 Illegitimate Births Registered
1933
16
24
24
299
8 8
32 275
380
32 113
16
57 8
73 32
8 73
1,479
1934
8
3i 8
145
15 15
53 344
267
31 145
31
15 53 8
76 31 38 53
1,367
1935
50
8
8
331
8
33 331
290
75 141
17 17
75
91 8
33 99
1.616
1 1 1936
8 67
8
284
25
50 350
392
42 117
8
8
S8
75 42
8 75
1,618
1937
34
34
127
8 8
85 287
414
8 85
17 17 34
25 25 59 76
1,344
1938
, 78
9
9
209
9
69 313
287
9 200
9 9
61
69 35 61 52
1,487
Under i 1
year |
i
9 1 . 1 1 1
i 1
24
1 1
i' 8 1'
36 i)
33 |:
, 1 i'
23 1
' 1 ! 1
7 i
1 8 1 4 ji 7 1' 6 i;
171 |i
Numbers of Deaths Registered *n 1938 at Ages—
Under 1
day
5
5
8 4 4
• 23
j 1 day 1 1 and 1-4 jJess than weeks 1 7 days |
i . 1
1 • i
i
. i i 1
1 3 ! 3
17 7 1
4 ! !0
1
i 1 i
1 i
- ' • • • 1 1 1 : 1 i •
29 23
1-2 months
•
1
1 5
3
1 3
1
1
•
18
2-3 months
4
.
1 1
3
4
17
3-6 months
1
13
1
4
1
^
30
1 6-12
months
8
•
6
1
• •
10
1
2
28
^ ^ ^
so
39!
Diagram VI.—Northern Ireland : Birth and Infant Mortality Rates for aggregates of Urban and Rural Areas, 1924— l93iJ
^ r> H < _) ^ a. o C
o s
^ o
« S H « m 1 1
H
<5 T H K
fiQ
X H OS
aa o o o •— en w cu CEi <•
V 20C
_
Q A D 1/5 UJ o < < t / ) X
< W Q j w
< 100 Cti
^ t ->-i < (-X
o S H Z
<
0 I 1924
40 Report—1938.
registered, as compared with a rate of 134 for the previous year. The corresponding rates for legitimate children in 1938 and 1937 were 72 and 75 per 1,000 respectively.
Of the 171 deaths of illegitimate children under 1 year of age, 102 or 60 per cent, occurred in " Institutions of all Kinds, including nursing and rescue homes."
Table V shows the deaths of illegitimate children by the principal causes and for age-periods in 1938, together with the mortality rates among illegitimate children for each of the years 1933-38. Most of these rates are considerably in excess of the corresponding rates for all children ; particularly the rates for diarrhoea and enteritis, premature birth and injury at birth, congenital debility, etc., pneumonia, and inattention at birth. It should, however, be noted that the rates for some of the causes are based on very small numbers of deaths.
(5) POPULATION.
The estimated population of Northern Ireland in the middle of 1938 was 1,286,000. This estimate is based on the population as ascertained at the Census taken on 28th February, 1937, and the numbers of births and deaths registered between that date and 30th June, 1938, adjustments being made for migration to and from non-European countries, and for the movement of workpeople between Great Britain and Northern Ireland. Particulars of migration to European countries (including Eire) are not recorded, and no adjustment on this account is, therefore, possible.
Abstract XI I I shows the population of Northern Ireland as estimated at the middle of each of the years 1911-1938. For each year following the last recorded Census the estimated population is calculated in the manner described above for the year 1938. When the next Census figures become available they are used to adjust the estimated populations for the intercensal years. The estimates for the years 1911 to 1936 have_been adjusted in this way, and the rates in this Report for the country as a whole have been based on these estimates. As regards divisions of the country, no estimates have been made, the 1937 Census figures being used for all rates shown for these areas, except for Belfast County Borough, in which case an estimate of the population as at the beginning of 1938 has been used. This estimate is 440,500.
(6) MIGRATION.
The returns of migration used for the purposes of the above population estimates are those published by the Board of Trade, London, which give the numbers of British migrants between Northern Ireland and non-European countries. According to these
Report^l938. 41
returns, the total number of British emigrants from Northern Ireland to countries outside of Europe during the year 1938 was 844 and the British immigrants into Northern Ireland from those countries numbered 1,102. Thus, during the year 1938, there was a net movement of 258 persons into Northern Ireland. The balance of migration movement has been in an inward direction since 1931, but it has been almost negligible during the past five years. I t should be noted that the figures available do not include movements between different parts of the British Isles. Table W gives particulars of migration from 1927 onwards.
TABLE W.—Migration : Northern Ireland and Non-European Countries, 1927-38
Reports on the weather experienced in Northern Ireland during each month of the year 1938, as furnished by the Director of the Meteorological Office, London, are published in the Quarterly Returns of Births, Deaths, and Marriages for that year. Table X shows for the inland stations of Armagh and Aldergrove, and the coastal station of Donaghadee, the Average Air Temperature, Rainfall, and Sunshine in 1938.
The year 1938 was unusually wet, mild and rather dull. The general rainfall expressed as a percentage of the average for the period 1881-1915 was 116, the percentages at individual stations ranging from 99 at Limavady to 130 at Londonderry (Creggan Reservoir).
Among noteworthy features of the weather were the magnificent display of aurora observed on the evening of Ianu"afyr^''^nr,**TTl^ exceptionaTmilariess of March and of the greater part of November, the serious drought of February to April, the unusual excess of rainfall in October, and the notably cold spell from December 18th to 25th.
The weather of January was very unsettled, rather mild and excessively wet ; strong winds or gales occurred frequently between the 9th and 31st. The excessive rainfall was general and sunshine
42 Report—1938.
was markedly deficient ; at Aldergrove it was the dullest January since records were begun in 1927, and at Armagh the daily mean sunshine was only 57 per cent, of the average. February was distinguished by a general deficiency of rainfall; it was also mild, with variable sunshine. March was exceptionally mild, the deviation of the mean temperature from the average being 7.0°F. in an upward direction at both Armagh and Donaghadee ; at Armagh the mean temperature was by far the highest for March since before 1871. There was a marked and almost general deficiency of rainfall, whilst sunshine was deficient on the whole. The weather of April was exceptionally dry, unusually sunny and rather mild. The general rainfall was only 12 per cent, of the average for the period 1881-1915. The excessive sunshine was also noteworthy ; it was easily the sunniest month of the year. At Armagh the percentage of the average was 130 and at Aldergrove it was the sunniest April since records were started in 1927. In contrast May was dull, rather cool and wet on the whole. Although the total sunshine of the month was deficient, the first eight days were unusually sunny ; the mean daily sunshine for this period was 10.6 at Newtownards and Aldergrove and 11.0 at Hillsborough. June was very unsettled, excessively wet and markedly dull. It was the dullest June at Aldergrove since records began in 1927. The general rainfall was 169 per cent, of the average for the period 1881-1915. A wind speed of 77 m.p.h. was registered in a gust at Aldergrove on the 27th. July was dull, cool, and unusually wet ; the general rainfall was 158 per cent, of the average for 1881-1915. In contrast to the first two summer months, the weather of August was dry and sunny. Mean temperature was not very different from the average ; the first 12 days were warm and subsequently it became cooler, whilst the last few days were decidedly cool. September was dull and rather warm with a variable distribution of rainfall. The general rainfall was 103 per cent, of the average for 1881-1915 ; an excess occurred in Counties Antrim and Down and a deficiency elsewhere. October was exceedingly wet, the general rainfall being 208 per cent, of the average for 1881-1915. It was also rather mild, with sunshine about or very slightly in excess of the average. The gale on the 4th was very severe ; a wind speed of 82 m.p.h. was registered in a gust at Aldergrove. November was unusually mild ; but it was also unsettled, windy, notably wet and dull on the whole. The first nineteen days formed a period of exceptional mildness ; subsequently the weather became colder, and mean temperature for the week ending the 26th was appreciably below the average. The weather of December was remarkable for a severely cold spell from the 18th to 25th. This month was sunny but somewhat wet on the whole.
Report—1938. 43
TABLE X.—Northern Ireland : Average Air Temperature, Rainfall, and Sunshine obtained from Readings taken at the Stations of Armagh, Donaghadee and Alder grove,
1938.
ARMAGH.
MONTH
January February March April May June Ju ly August September October November December
ABSTRACT I.—Northern Ireland : Method of Celebration of Marriages Registered, 1938.
COUNTIES.
N O R T H E R N IRELAND
ANTRIM ARMAGH BELFAST CO. BOROUGH D O W N FERMANAGH LONDONDERRY C O . AND
CO. BOROUGH T Y R O N E
o •<
S at
<
H
8,617
1,333 701
3,341 1,356
292
884 710
Church of Ireland
6
a S 2 ^ CQ
2,203
295 229 885 338
95
184 177
P S
1 <
167
7 1
144 12
3
i 1 s ^ ^
7
4 1 1
J_
Presbyterian.
a 8
m
2,497
615 93
875 528
5
229 152
a o 3
t/5
P3
37
8 2
19 3
2 3
d
o
O
ai
2,422
237 285 660 346 147
400 347
Registered Buildings.
V
m
631
82 46
379 43 28
6
l-l
en
CQ
14
3 1 7 2 1
33 : . 20 ; .
o as o i2
631
86 43
364 80 15
36 7
a
h
6
1 2 3
1 ^
2
2 i
ABSTRACT II.—Northern Ireland : Marriages Registered in each Quarter, Civil Condition of Persons Married and
Number of Minors, 1938.
COUNTIES.
N O R T H E R N IRELAND
ANTRIM ARMAGH BELFAST C O . BOROUGH D O W N FERMANAGH LONDONDERRY Co. AND
Co. BOROUGH j TYRONE
Total Marriages Registered in the
Quarter ended the last day of
j , ,
t ^
4 ^
1,590
238 138 540 243
78
180 173
a 3
2,243
366 179 863 384
74
.a
S
to
2,618
390 216
v
e o Q
2,166
339 168
1,036 : 902 413 : 316
74 ( 66
1941 272 1831 217
238 137
a-s
a 7,924
l,242fl 634
3,041i 1,264a
261
830 652/
between
._. 2 S
a
no 136 10
•3
3,n Q V
» a .at/;
^ 464
66c 44
4S(;i 188 13b' 68 4 25
S 41 14 1 32
CARRIAGES
•
• 3
a .n ^
Sn3
is 119
12 13 64 11 2
5 12
Of
1
2
o •a
is 1
583
78 j 57
252 79 , 27 ;
46 i 44
5 -a :; 229
25 23
112 24
6
13 26
1
1 Of
not of ! Full Age i
1 j
_• , S
-5 1 -^
280 : i , 19o '
37 i 177 ! 25 i 86
135 1 54! 1 44 165 '
2 : 21 j
25 1 119 1 12 1 SI j
(a) Including 2 Divorces and Spinsters. (b) „ 1 Divorce and Widow (c) id) (e) if)
1 Widower and Divorcee. 2 Bachelors and Divorcees, 4 Divorces and Spinsters and 1 Divorc^ and DivorCi's 2 Divorces and Widows. 1 Bachelor and Divorcee.
A bstracts, 1938—Births and Deaths as registered and as allocated. 47
ABSTRACT III.—Northern Ireland : Births and Deaths by Counties and Poor Law Unions, as Registered and as Allocated according to Normal Residence, 1938.
(See Index to Poor Law Unions on page 80.
COUNTIES AND
POOR L A W UNIONS.
N O R T H E R N IRELAND
COUNTIES.
ANTRIM
ARMAGH
BELFAST CO. BOROUGH
D O W N
FERMANAGH
LONDONDERRY C O . AND CO. BOROUGH
TYRONE
POOR LAW UNIONS.
ANTRIM
ARMAGH
BALLYCASTLE
BALLYMENA . .
BALLVMONEY
BANBRIDGE . .
BELFAST
CASTLEDERG
POPULATION 1937
(Census).
JM IF fM l,F
fM
fM
(M
/ M IF
1M (F
JM ( F
/M IF
fM IF fM
fM
fM
IF
1,279,745 623,154 656,591
96,003 101,263
54,271 54,544
205,538 232,548
102,535 108,152
28,856 25,713
70,273 72,463
65,678 61,908
14,266 13,983
19,863 18,831
5,649 5.531
22,307 23,093
12,854 13,302
17,094 17,549
220,105 248,180
5,106 4,699
B I R T H S (including
Illegitimate Births).
Registered in
Area.
25,742 13,196 12,546
1,840 1,741
1,127 1,088
5,036 4,746
1,764 1,669
486 478
1,677 1,627
1,266 1,197
227 235
354 352
114 104
i 447
1 439
251 255
1 296 310
'\ 5,243 1 4,932
1 107 ; 113
Allocated to
Area.
25,742 13,196 12,546
1,918 1,815
1,100 1,081
4,707 4,439
1,960 1,826
493 482
1,668 1,614
1,350 1,289
239 247
368 358
116 117
438 446
282 266
318 326
4,998 4,692
111 116
DEATHS.
Registered in
Area.
17,649 8,736 8,913
1,221 1,306
802 781
3,054 3,105
1,376 1,408
399 364
994 1,043
890 906
196 203
279 282
72 88
267 277
175 190
238 291
3,208 3,248
59 66
Allocated to
Area.
17,649 8,736 8,913
1,223 1,324
782 754
3,010 3,059
1,370 1,412
413 383
1,022 1,055
916 926
182 190
270 263
71 89
289 291
182 204
249 304
3,185 3,218
68 69
E X C E S S OF
BIRTHS OVER
D E A T H S * (Corrected for Transfers).
8,093 4,460 3,633
695 491
318 327
1,697 1,380
590 414
80 99
646 559
434 363
57 57
98 95
45 28
149 155
100 62
69 22
1,813 1,474
43
* A minus sign {—) before the numbers in this cohimn denotes that the i'.irths were fewer than the r">eath& to the extent stated
48 Abstracts, 1938—Births and Deaths as registered and as allocated.
ABSTRACT III.—(Continued)—Northern Ireland : Births and Deaths by Counties and Poor Law Unions, as Registered and as Allocated according to Normal Residence,
1938.
(See Index to Poor Law Unions on page 80.
COUNTIES AND
POOR LAW UNIONS.
POOR LAW UNIONS (Continued).
CLOGHER
COLERAINE . .
COOKSTOWN . .
DOWNPATRICK
DUNGANNON
ENNISKILLEN
IRVINESTOWN
KiLKEEL
LARNE
LiMAVADY . .
LISBURN
LiSNASKEA
LONDONDERRY
LURGAN
MAGHERAFELT
NEWRY
NEWTOWNARDS
OMAGH
STRABANE . .
POPULATION 1937
(Census).
(M IF
J'M
IF
IF
[^ JM IF
JM
IF / M IF
IM
iF IM IF
JM
IF JM (F
:^ / M IF
IM IF
JM
iF I M
IF JM IF I M
IF 1 JM
IF
6,111 5,463
14,876 15,713
9,849 9,169
16,817 16,176
14,451 14,013
11,531 10,425
8,571 7,405
8,642 8,836
17,503 19,391
8,928 8,442
25,186 27,422
10,509 9,347
30,441 33,243
25,132 27,184
16,028 15,065
26,139 26,321
26,790 30,708
16,999 15,766
11,407 11,334
BIRTHS (including
Illegitimate Births).
Registered in
Area.
86 108
343 331
200 171
304 289
301 272
222 216
119 125
163 153
336 3 U
197 193
423 384
174 160
847 814
546 567
290 289
574 484
489 429
313 285
230 225
Allocated to
Area.
96 120
325 316
212 205
323 302
330 279
191 197
135 135
170 163
362 321
195 196
477 427
196 173
836 800
528 558
312 302
571 494
495 444
329 299
243 247
DEATHS.
Regis- 1 tered in
Area. ,
85 56
192 227
119 102
261 219
194 218
161 169
108 99
113 113
214 227
115 116
406 404
147 114
425 480
338 341
262 220
366 359
320 358
288 292
128 154
Allocated to
Area.
101 62
197 240
150 127
235 198
203 228
141 162
127 113
132 127
218 233
120 124
296 346
162 126
413 451
364 356
292 240
376 364
336 366
227 251
150 171
EXCESS | OF 1
BIRTHS i OVER
DEATHS* (Corrected for Transfers).
—5 58
128 76
62 78
88 104
127 51
50 35
8 22
38 36
144 88
75 72
181 81
34 47
423 349
164 202
20 62
195 130
159 78
102 48
93 76
*A minus sign (—) before the numbers in this column denotes that the Births were fewer than the Deaths to the extent stated.
ABSTRACT IV.—Northern Ireland : Births in each of the Four Quarters, 1938. (exclusive of still-born).
COUNTIES.
NORTHERN IRELAND
ANTRIM
ARMAGH
BELFAST CO. BOROUGH
DOWN
FERMANAGH
LONDONDERRY CO. AND CO. BOROUGH . .
TYRONE
PERSONS.
TotaL
25,742
3,733 2,181 9,146 3,786
975 3,282 2,639
Quarter ended the last day of
March.
6,285
854 539
2,252 951 233 791 665
June.
6,902
1,099 576
2,522 963 261 822 659
Sept.
6,515
964 589
2,256 928 254 887 637
Dec.
6,040
MALES.
Total.
13,196
816 1,918 477 ; 1,100
2,116 4,707 944 1,960 227 493 782 1,668 678 1,350
Quarter ended the last day of
March.
3,173
441 277
1,135 492
96 391 341
June.
3,557
563 291
1,301 498 136 413 355
Sept.
3,330
485 286
1,162 509 134 455 299
Dec.
3,136
429 246
1,109 461 127 409 355
FEMALES.
Total.
12,546
1,815 1,081 4,439 1,826
482 1,614 1,289
Quarter ended the last day of
March.
3,112
413 262
1,117 459 137 400 324
June.
3,345
536 285
1,221 465 125 409 304
Sept.
3,185
479 303
1,094 419 120 432 338
Dec.
2,904
387 231
1,007 483 100 373 323
ABSTRACT V.—Northern Ireland : Deaths in each of the Four Quarters, 1938.
COUNTIES.
NORTHERN IRELAND
ANTRIM
ARMAGH
BELFAST CO. BOROUGH
DOWN
FERMANAGH
LONDONDERRY CO. AND CO. BOROUGH . .
TYRONE
PERSONS.
Total.
17,649
2,547 1,536 6,069 2,782
796 2,077 1,842
Quarter ended the last day of
March.
5,153
706 407
1,912 785 226 586 531
June.
4,282
612 405
1,437 718 192 500 418
Sept.
3,798
562 351
1,196 594 180 482 433
Dec.
4,416
667 373
1,524 685 198 509 460
MALES.
Total.
8,736
1,223 782
3,010 1,370
413 1,022
916
Quarter ended the last day of
March.
2,560
337 197 946 392 119 290 279
June.
2,165
302 219 758 355
95 247 189
Sept.
1,869
269 169 605 286
93 233 214
Dec.
2,142
315 197 701 337 106 252 234
FEMALES,
Total.
8,913
1,324 754
3,059 1,412
383 1,055
926
Quarter ended the last day of
March.
2,593
369 210 966 393 107 296 252
June.
2,117
310 186 679 363
97 253 229
Sept.
1,929
293 182 591 308
87 249 219
Dec.
2,274
352 176 823 348
92 257 226
SO
I to & Co
I. b ;& Si Co
CO
50 Abstracts, 1938—Deaths from Principal Causes by Counties, etc.
ABSTRACT VI.—Northern Ireland : Deaths from Principal
Diseases Peptic Ulcer Diarrhoea, etc. (under 2 years) Appendicitis Cirrhosis of the Liver Other Diseases of Liver, etc.
Other Digestive Diseases
Acute and Chronic Nephritis Puerperal Sepsis Other Puerperal
Causes Congenital Debility, Prema
ture Birth, Malformations, etc.
Senility Suicide Other Violence . . Other Defined Diseases Causes Ill-defined or Un
known
ider one year of age ) years and upwards d Deaths hs te Births a (Census 1937)
NORTHERN IRELAND.
M 8,736
4 150 25 48 42
128 17 9
437 158
14
19 783
67 568
1,853 11
297 302 556
130 94
143 48 24 35
168
212
—
—
539 707
43 285 760
60
1,044 4,001
461 13,196
603 623,154
F 8,913
3 158 24 62 34
130 22
3
432 151
11
4 917
99 789
1.765 4
324 348 470
94 50 83 37 10 67
179
198 31
106
454 937
11 191 663
52
889 4,328
490 12,546
547 656,591
NORTHERN IRELAND.
TOTAL
URBAN AREAS.
M 4,503
1 137
8 29 15 47 10
5
265 96
8
17 384
41 268 927
6 162 157 347
67 46
112 23 17 14
85
124
—
—
323 172
23 154 385
28
676 1,614
102 7,422
285 317,230
F 4,751
135 6
41 11 58 18 3
248 82
7
3 475
38 384
1,014 4
178 194 294
49 19 66 20
6 37
88
102 16
60
265 329
9 96
378
18
570 2,068
95 6,929
247 362,405
TOTAL
RURAL AREAS.
M 4,233
3 13 17 19 27 81
7 4
172 62
6
2 399
26 300 926
5 135 145 209
63 48 31 25
7 21
83
88
—
—
216 535
20 131 375
32
368 2,387
359 5,774
318 305,924
F 4,162
3 23 18 21 23 72 4
184 69
4
1 442
61 405 751
146 154 176-
45 31 17 17 4
30
91
96 15
46
189 608
2 95
285
34
319 2,260
395 5,617
300 294,186
COUNTIES,
ANTRIM.
M 1,223
6 4 5 2
16 3 3
48 16
1
1 122
9 85
266 2
55 31 51
20 12 11 10 2 9
30
18
—
—
72 149
4 47
107
6
110 668
41 1,918
105 96,003
F 1,324
12 5 1 6
15 1
53 22
1
153 26
136 230
69 45 45
11 7 4 7
15
25
28 5
12
73 194
1 32 87
3
109 749
58 1,815
101 101,263
NOTE—The numbers given in the first column of this abstract are those of the Short International List whilst the last column shows the numbers in the Detailed International List.
Abstracts, 1938—Deaths from Principal Causes by Counties, etc.
Causes by Counties and Urban and Rural Areas, 1938.
51
{See Index to Poor Law Unions on page 80.)
ARMAGH
M 782
9
3 5 6 3
43 20
1
2 67
3 54
189
21 38 46
18
6 6
1 2
11
20
— -
51 70
3 25 52
7
83 394 53
1,100 41
54,271
F 754
6 3 5 4
10 3
37 18
69 7
70 174
19 32 43
12
2
5
17
16 2
10
41 75
2 16 52
4
63 372
53 1,081
32 54,544
'
BELFAST
Co. BOROUGH
M 3,010
114 6
20 8
23 8 4
187 63
7
13 253
26 182 619
5 94
103 254
39
30 90 15 12 8
53
87
— —
204 82 16
107 259
19
466 1,009
74 4,707
171 205,538
F 3,059
110 2
31 3
34 15 3
161 44
4
3 315
19 239 695
2 104 123 211
29
15 55 10 4
26
55
61 12
36
179 157
6 56
228
12
414 1,265
65 4,439
151 232,548
Do
M 1,370
8 6
11 11 24
1 1
62 25
2
2 133
7 82
306 3
74 31 81
18
10 10
8 5 4
22
27
— —
81 149
7 38
116
5
144 702 55
1.960 83
102,535
COUNTIES.
WN
F 1,412
1 8 2
11 3
25 3
61 26
3
I 165
17 136 282
59 40 60
12
9 8 7 4
10
34
33 5
17
59 177
1 31 99
3
110 745
48 1,826
71 108,152
FERMANAGH
M 413
1 2 1
5
.
21 2 1
40 3
32 90
8 17 19
10
3 3 1 2 2
8
13
— —
11 68
5 8
30
7
21 255
73 493
32 28,856
F 383
1 1 1
2 7
16 10
44 6
39 61
8 9
15
7
6
2
1
10
10 2
4
11 73
5 18
14
20 213 83
482 22
25,713
LONDONDERRY
Co. & Co. BoRO.
M 1,022
10 5 5 9
30 1 1
39 18
1
1 96 12 74
200 1
25 35 46
16
15 17
7 1 5
21
20
— -
76 90
6 26
105
8
141 481
52 1,668
89 70,273
F 1,055
15 7
12 8
24
57 16 2
81 11 89
154 1
34 58 47
15
5 10
5 1 3
14
25 3
16
54 142
1 27
109
9
109 486
56 1.614
74 72,463
TYRC
W 916
4 2 2 3 7
24 1
37 14
1
72 7
59 183
20 47 59
9
18 6 7 1 5
23
27
— —
44 99
2 34 91
8
79 492 113
1,350 82
65,678
)NE
F 926
1 6 4 2 8
15
47 IS
1
90 13 80
169 1
31 41 49
8
8 6 4 1 7
24
25 2
11
37 119
24 70
7
64 498 127
1,289 9&
61,908
Detailed List Nos.
—
1. 2 7 8 9
10 11 17 18
23 24-32
34
8 0 . 8 3 45-53
59 82
90-95 96
97-103 106
107-109 f 104, 105 [110-114
117 119 121 124
125-127 /115 ,116
J 118,120 1 122,123 V128,129 130-132 140,145
1141-144 1146-150
157-161 162
163-171 172-198
— 199,200
— — — —
~
52 Abstracts, 1938—Deaths from Principal Causes by Counties, etc.
ABSTRACT VI.—(Continued).—Northern Ireland: Deaths from
System . . Other Tuberculous Diseases . . Syphilis General Parals^sis of the Insane,
Tabes Dorsalis Cancer, Malignant Disease Diabetes Cerebral Haemorrhage, etc. Heart Disease Aneurysm . . Other Circulatory Diseases Bronchitis . . Pneumonia (all forms) Other Respiratory Diseases . . Peptic Ulcer Diarrhoea, etc funder 2 years) Appendicitis Cirrhosis of the Liver Other Diseases of Liver, etc . . Other Digestive Diseases Acute and Chronic Nephritis . . Puerperal Sepsis Other Puerperal Causes Congenital Debility, Prematnre
Birth, Malformations, etc . . Senility Suifide Other Violence Other Defined Diseases Causes HJ-defined or Unknown
ALL CAUSES . .
All Ages
M
1
i 10 1
3
8 1
38 105
4 18 3 9 I
3 — — 33
147
2 30 43
461
F
4
3 1
11
4 1
7 3
45 60
3 14 7 2 6 1
4
35 211
1 27 40
490
M
i 1 2
— — 33
2 8 1
50
-I
F
2
i 2
35
i 11 2
56
M
i 1
— —
3 1
6
-F
1
3
,
1
2
1
9
5-
M
— —
1
1
P
2 1
3
10-
M
— —
, . 1
1
F
•
15-
M
— —
3
5
.
:
s 1
s
25-
P M
. 1 1
) 1
— —
2
5
F
1
1
35-
M
1 2
_
3
6
F
1
2
1 3
i
2
1
11
45-
M
2 8
2 7
20
F
4 5
1 1
i
3 4
19
55-
M
2
1
1
4 23
1
I
— —
2 14
49
F
1
2
6 13
1 1 1
i
^
2 13
42
65-
M
5
4 1
n 50
2 6
3
2
34
5 17
140
F
6
2 2
17 19
1 7 1 I 3
37
3 17
116
75-
M
I
1
2
17 19
2 7 1 2 1
i — —
76
2
132
F
3
1 I
16 17
3 1 1
. , , ,
116 ^ 4
163
85 and
M
2 3
3
37
1
46
F
I 2
57
61
CO
5 I
CO
Abstracts, 1938—Population. 77
ABSTRACT X.—Northern Ireland : Deaths in Institutions, 1929-38.
Number of Deaths in—
Public Mental Hospitals . .
Poor Law Institutions
District Hospitals*
Other Hospitals and Infirmaries
Own Homes, etc.
Total Deaths
Percentage of Deaths in Institutions
1929
450
1,991
327
1,263
15,791
19,822
20 .3
1930
398
1,764
309
1,251
13,426
17,148
21.7
1931
340
1,928
345
1,422
14,014
18,049
22.4
1932
400
2,017
430
1,332
13,633
17,812
23.5
1933
434
1,979
688
1,484
13,569
18,154
25.3
1934
435
1,908
652
1,537
12,989
17,521
25.9
1935
461
2,167
772
1,612
13,580
18,592
27.0
1936
481
2,220
834
1,586
13,308
18,429
27.8
1937
487
2,388
812
1,605
13,990
19,282
27.4
1938
456
2,317
832
1,625
12,419
17,649
29 . 6
• These buildings were originally poor law institutions, and were converted into district hospitals. Both private patients and patients who are wholly or partly a charge on the poor rate are received.
ABSTRACT XI.—Northern Ireland : Population (including Non-civilians and Merchant Seamen on Shore and in Port) at
each of the ten Censuses, 1841-1937.
YEAR
1841
1851
1861
1871
1881
1891
1901
1911
1926
1937
PERSONS
Number
1,648,945
1,442,517
1,396,453
1,359,190
1,304,816
1,236,056
1,236,952
1,250,531
1,256,561
1,279,745
Percentage of
Population of Ireland
20.1
21.9
24.1
25.1
25 .2
26 .3
27.7
2S.5
29.7
30,1
MALES
Number
799,711
697,842
667,935
647,285
620,839
590,352
589,955
602,539
608,088
623,154
Percentage of Male
Population of Ireland
19.8
21.7
23.5
24.5
24.5
25.5
26 .8
27.5
28.8
29.1
FEMALES
Nimiber
849,234
744,675
728,518
711,905
683,977
645,704
646,997
647,992
648.473
656,591
Perrentage ot Female Population of Ireland
20.4
22 .2
24.6
25.7
25.9
27.1
28 .6
29.5
30 .7
31 .2
78 Abstracts, 1938—Population.
ABSTRACT XII.—Northern Ireland : Ages of the Population according to the Census of 1937.
A dash indicates that the disease is not compulsorUy notifiable. * It is to be noted in regard to the notification of measles and whooping-cough in Belfast, that only the first case
in a household is required to be notified, unless a period of 2 months intervenes in the case of the fonner disease and 3 months in the case of the latter.
t At the Tuberculosis Institute, Belfast, during the year 776 persons were diagnosed as sufiering from tuberculosis, of which 394 cases were notified as cases of acute infectious tuberculosis, and have been included above.
(a) 676 whooping-cough, 17 ophthalmia neonatorum, 3 poliomyelitis and 15 dysentery. (6) 2 ophthalmia neonatorum and 1 mixed infection (scarlet fever and diphtheria). (c) PoUomyelitis. (d) Ophthalmia neonatorum. le) Dysentery. {// Mixed infection (sc arlet fever and diphtheria). (g) Whooping-cough.
80 Index to Unions.
INDEX to Poor Law Unions or Superintendent Registrars* Districts.
(C-B.^s County Borough, M.B.—Municipal Borough, U.D. = Urban County District, RJ).=Rural County District, M.DJD.=Medical Dispensary or Registrar's District.)