+ All Categories
Home > Documents > The Reign of Word-of-Mouth (WOM) · to online reviews for enlightenment or turn to their peers for...

The Reign of Word-of-Mouth (WOM) · to online reviews for enlightenment or turn to their peers for...

Date post: 09-Aug-2020
Category:
Upload: others
View: 2 times
Download: 0 times
Share this document with a friend
65
Running head: EFFECT OF VARIANCE AND VALENCE ON PURCHASE INTENTION Erasmus School of Economics MSc Economics and Business Master’s Thesis The Reign of Word-of-Mouth (WOM): The effect of review variance and valence on consumers’ purchase intention Hassan Gasle Student Number: 474954 Topic: eWOM and purchase intention Supervisor: Arash Yazdiha Co-reader: M.G. de Jong Submission Date: August 30, 2018
Transcript

Running head: EFFECT OF VARIANCE AND VALENCE ON PURCHASE INTENTION

Erasmus School of Economics

MSc Economics and Business

Master’s Thesis

The Reign of Word-of-Mouth (WOM):

The effect of review variance and valence on consumers’ purchase intention

Hassan Gasle

Student Number: 474954

Topic: eWOM and purchase intention

Supervisor: Arash Yazdiha

Co-reader: M.G. de Jong

Submission Date: August 30, 2018

2

ABSTRACT

Traditional word-of-mouth (WOM) has long been an important driver for consumer behavior,

and its digital counterpart eWOM has brought forth many new dimensions of WOM in the form

of online reviews. This research assesses the influence of review elements such as variance

(defined in this study as reviewer consensus) and valence on purchase intention for experience

goods (restaurant visits). Ample literature has investigated the effects addressed in this paper, yet

findings are largely ambiguous and unclear. Results of this study reveal statistically significant

effects for valence on purchase intention but none for variance. Furthermore, this study finds that

there is a statistically significant interaction effect between variance and valence on purchase

intention. Though additional research is required to reach more conclusive results, findings of this

paper could serve to enhance marketing strategies with regard to online reviews and business

performance of restaurants.

Keywords: WOM, eWOM, online reviews, variance, valence, purchase intention, experience

goods

3

TABLE OF CONTENTS 1. Introduction .................................................................................................................................................................................... 4

2. Academic Relevance ...................................................................................................................................................................... 5

3. Managerial Relevance .................................................................................................................................................................... 6

4. Theoretical Framework – Literature Review .................................................................................................................................. 7

4.1 WOM and eWOM ................................................................................................................................................................... 7

4.2 Search Goods versus Experience Goods.................................................................................................................................. 8

4.3 Review Variance ..................................................................................................................................................................... 9

4.4 Review Valence ..................................................................................................................................................................... 11

4.5 Interaction Effect: Variance and Valence .............................................................................................................................. 12

5. Conceptual Framework ................................................................................................................................................................ 14

6. Methodology – Data Collection ................................................................................................................................................... 15

6.1 Research Design .................................................................................................................................................................... 15

6.2 Survey Design ....................................................................................................................................................................... 15

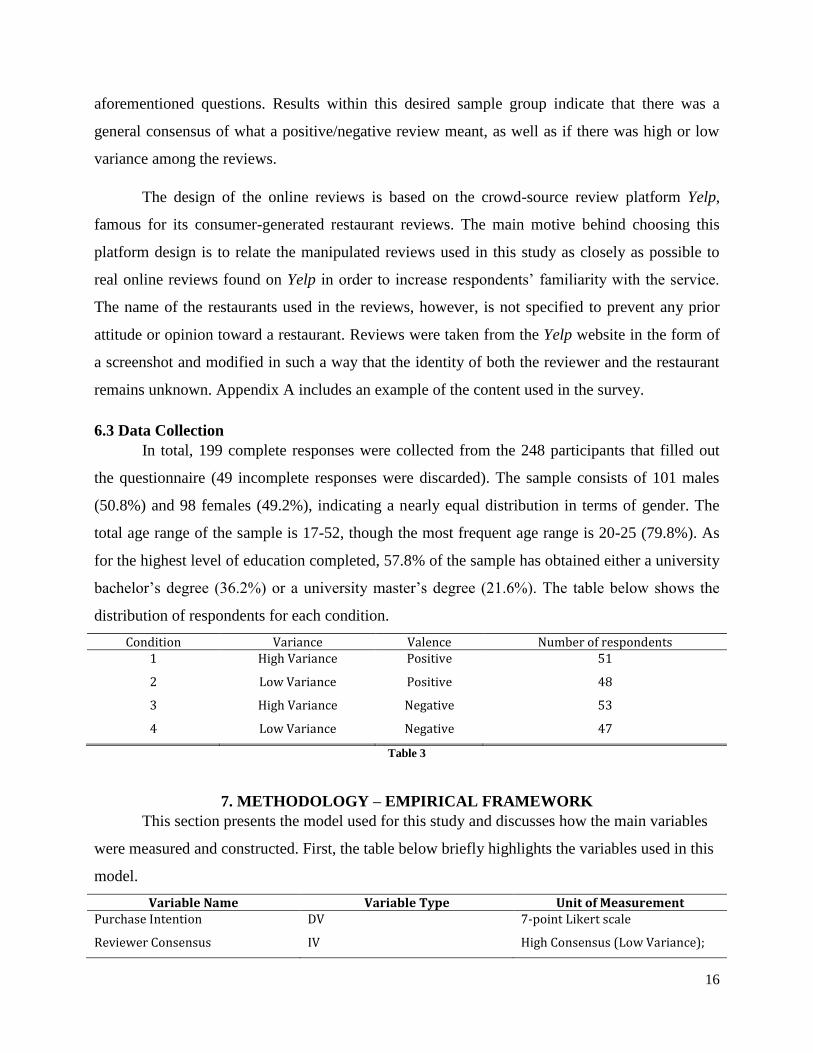
6.3 Data Collection ...................................................................................................................................................................... 16

7. Methodology – Empirical Framework.......................................................................................................................................... 16

7.1 Pre-Analysis Tests ................................................................................................................................................................. 17

7.1.1 Scale Items and Operationalization ................................................................................................................................ 17

7.1.2 Construct Validity (Reliability and Factor Analysis) ..................................................................................................... 18

7.1.3 Manipulation Check (Independent Samples t-Tests) ..................................................................................................... 19

7.1.4 Dichotomization ............................................................................................................................................................ 19

8. Results .......................................................................................................................................................................................... 20

8.1 Direct Effects: Reviewer Consensus and Valence ................................................................................................................. 20

8.2 Direct Effects and Interaction Effects: Reviewer Consensus * Valence ................................................................................ 21

8.2.1 Simple Main Effects ...................................................................................................................................................... 22

8.3 Full Model – Inclusion of Control Variables ......................................................................................................................... 22

9. Discussion and Implications ......................................................................................................................................................... 23

10. Limitations and Future Research Avenues ................................................................................................................................. 27

11. Conclusion .................................................................................................................................................................................. 28

12. References .................................................................................................................................................................................. 29

Appendix A – Survey Content Example .......................................................................................................................................... 35

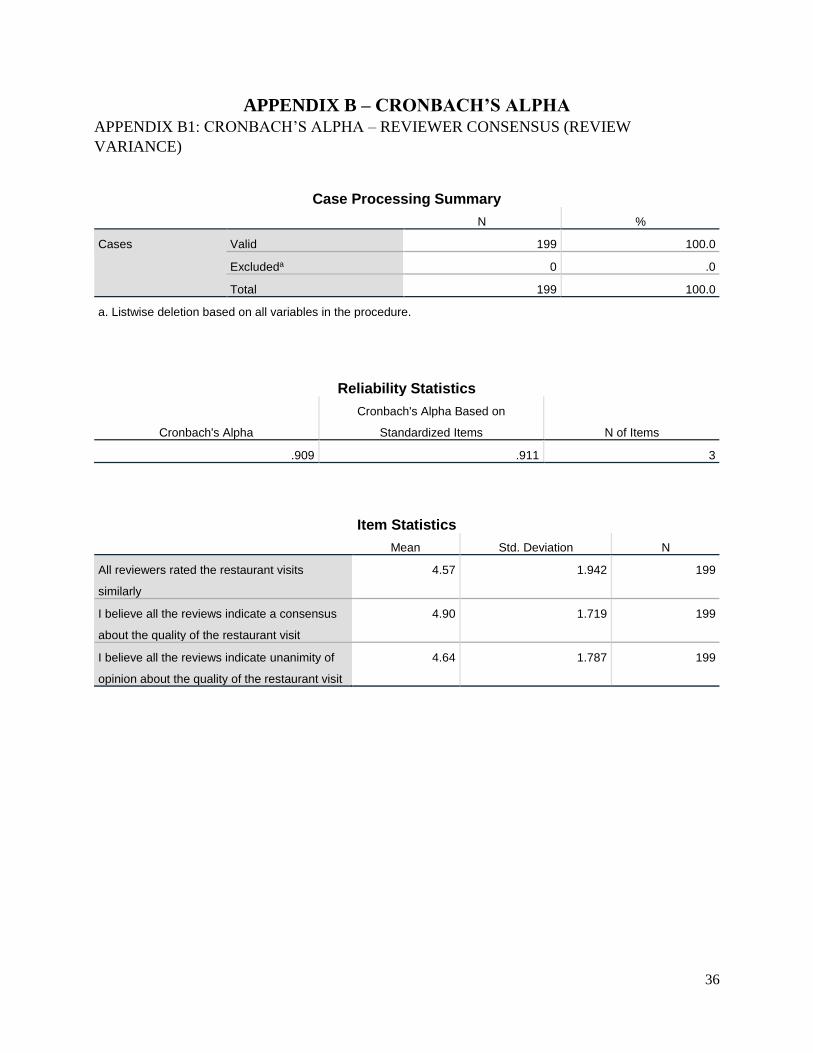
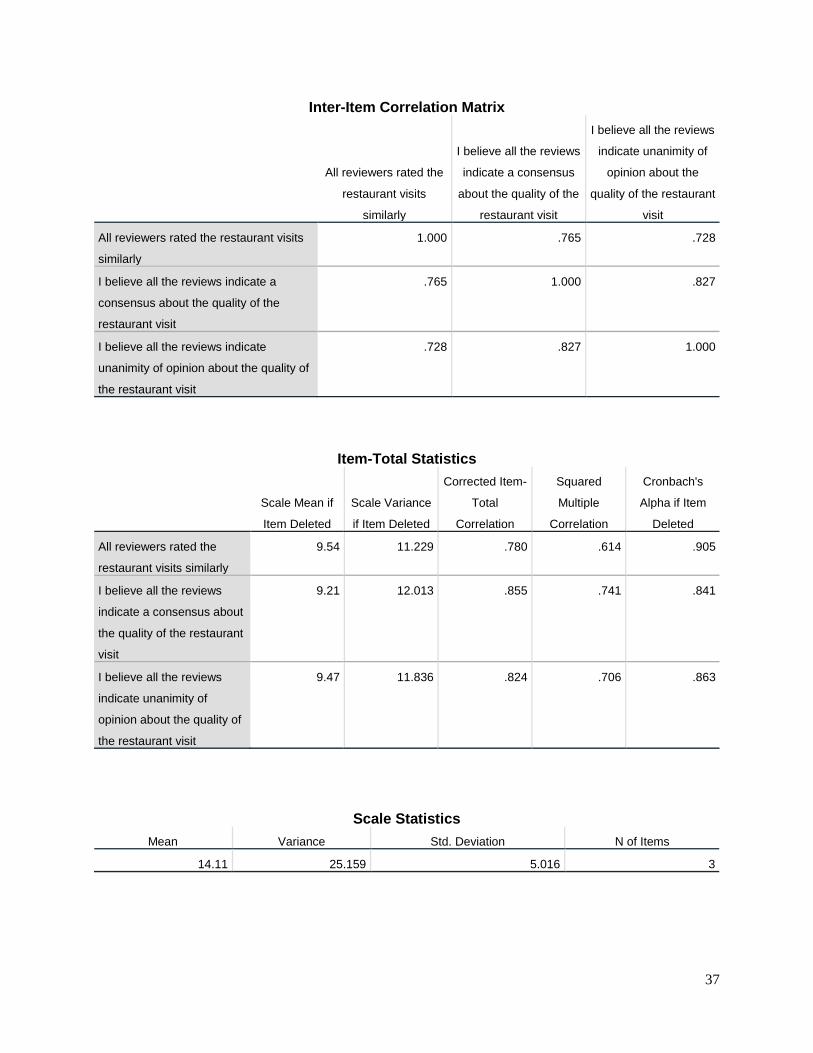
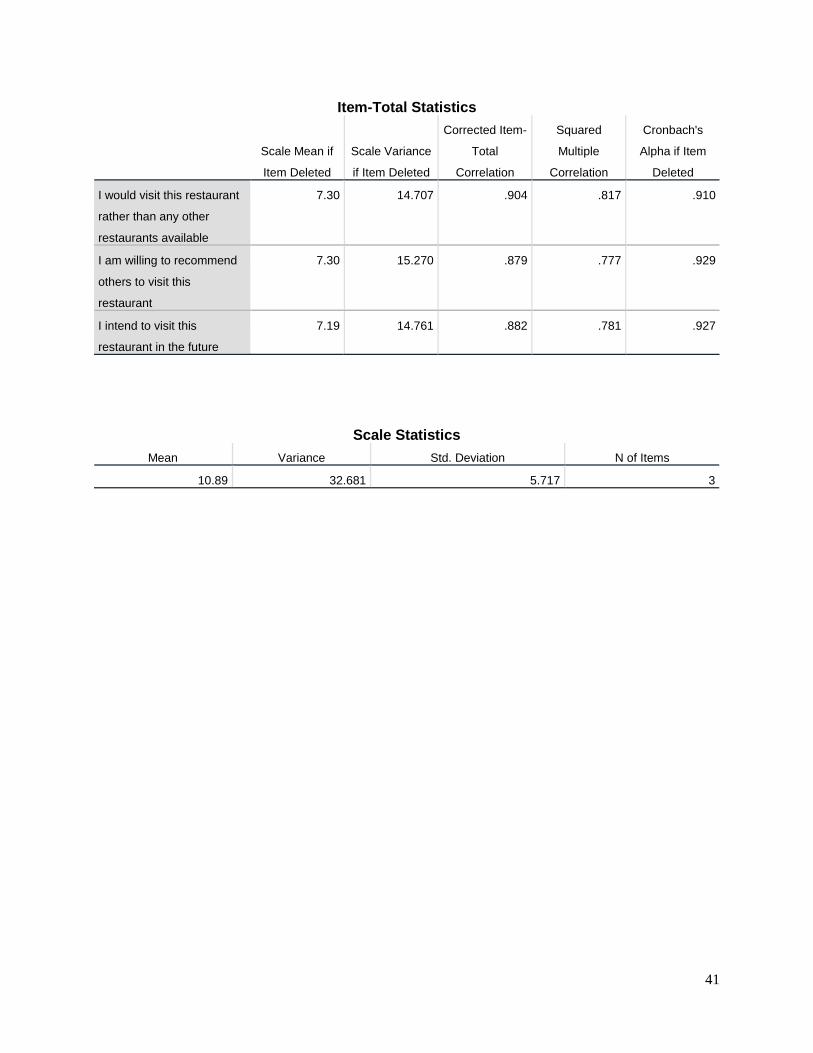
Appendix B – Cronbach’s Alpha...................................................................................................................................................... 36

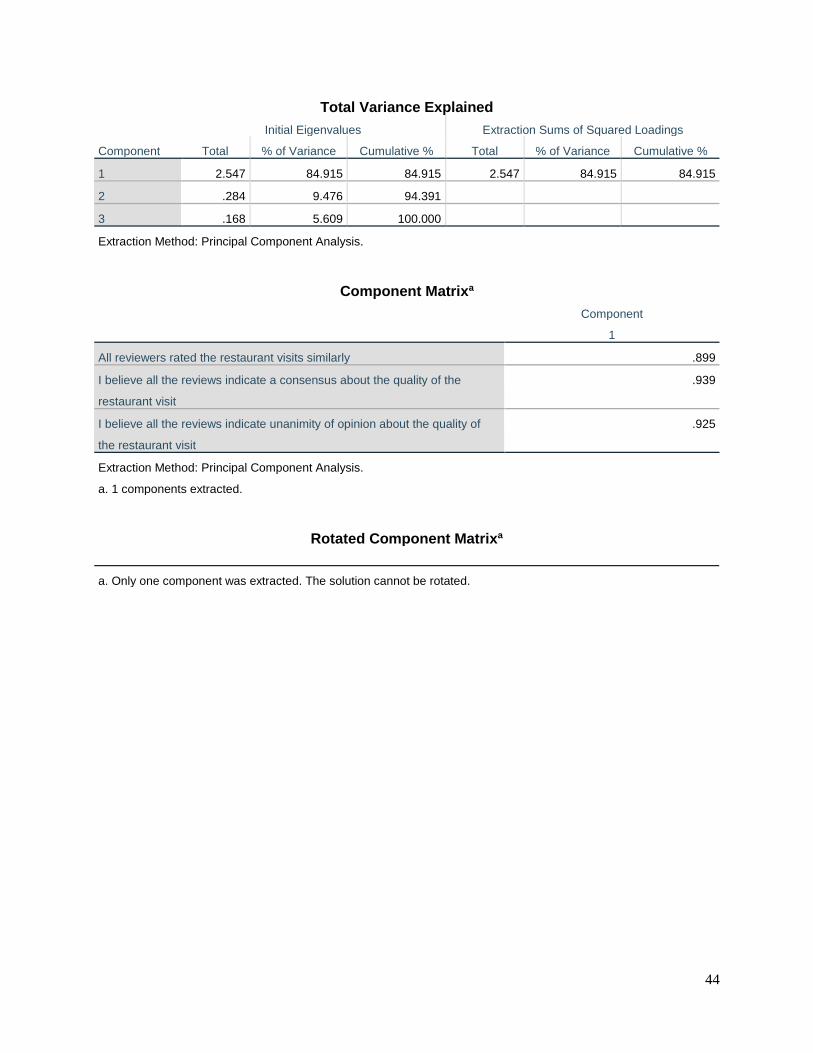
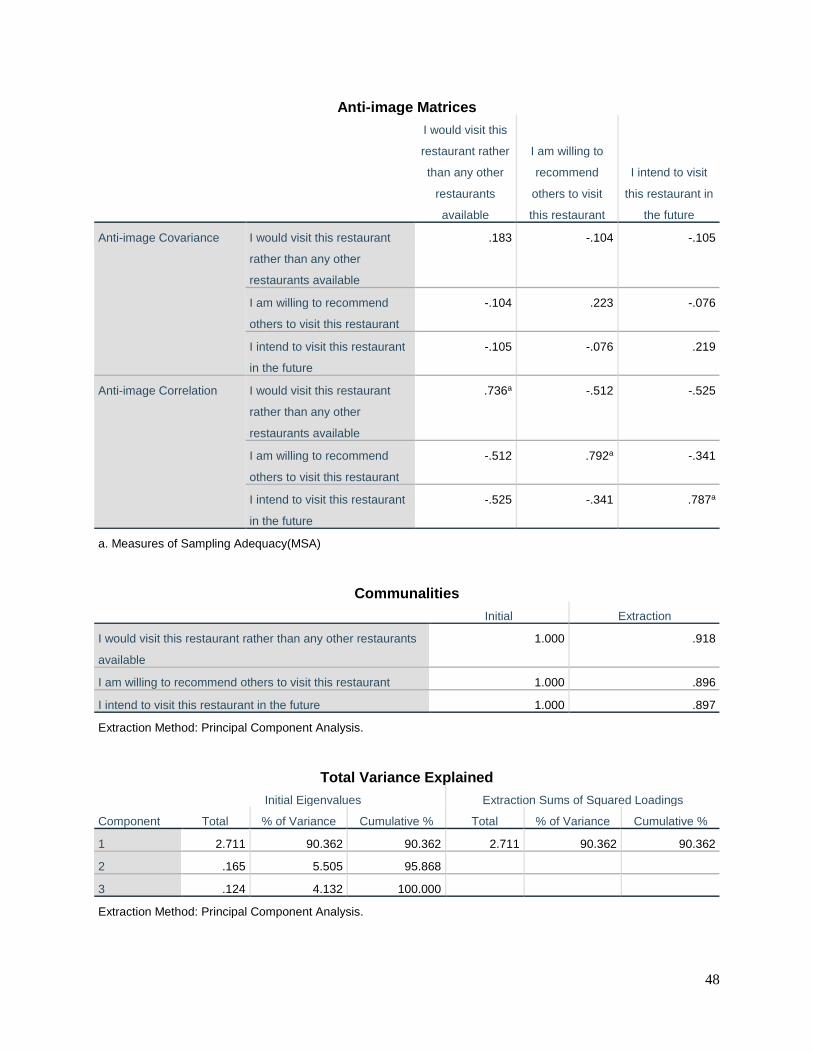
Appendix C – Factor Analysis ......................................................................................................................................................... 42

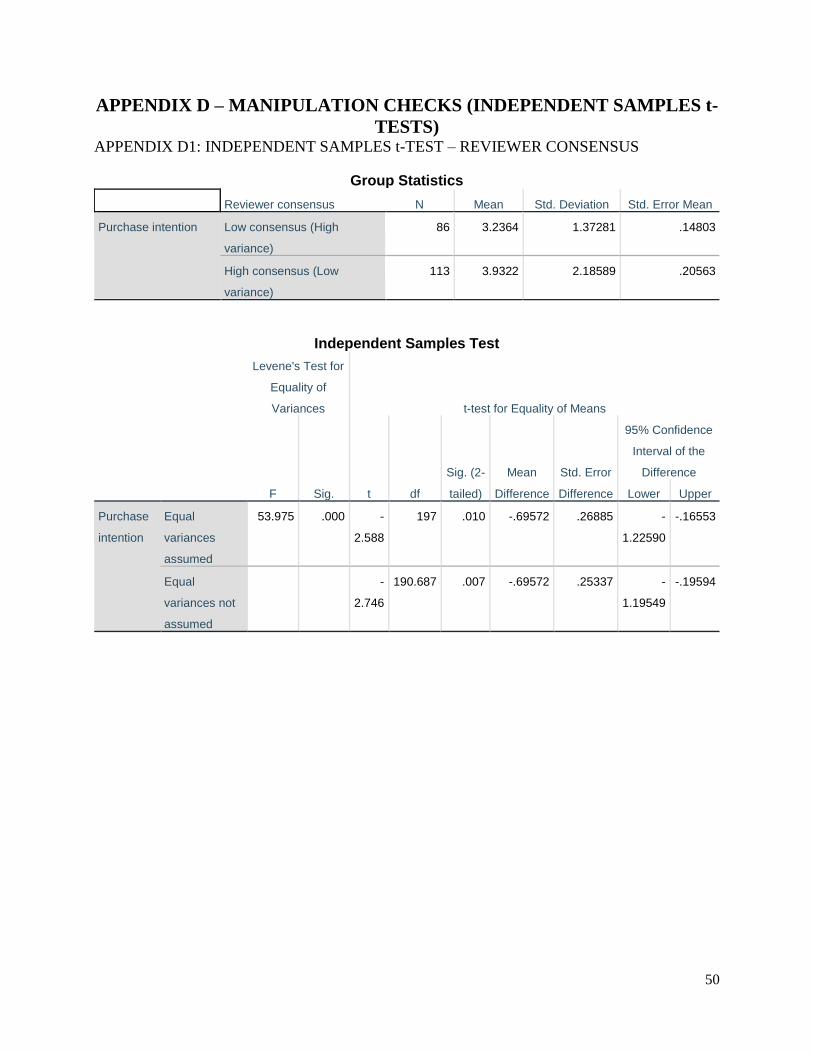
Appendix D – Manipulation Checks (Independent Samples t-Tests) ............................................................................................... 50

Appendix E – Direct Effects: Reviewer Consensus, Valence and Purchase Intention ..................................................................... 52

Appendix F – Interaction Term and Simple Main Effects ................................................................................................................ 57

Appendix G – Full Model (Inclusion of Control Variables) ............................................................................................................. 59

4

1. INTRODUCTION

Increasing advances in technology and popularity of the Internet over the past decades

have allowed consumers to share their feedback on goods and services with others online.

Consumers oftentimes find themselves in doubt before making a purchase, and frequently resort

to online reviews for enlightenment or turn to their peers for advice. This refers to word-of-mouth

(WOM) and one of its many present forms, online consumer reviews. Electronic WOM, or

eWOM for short, has been shown to be an important driver in online consumer behavior (Zhu

and Zhang, 2006). Social influences such as peers and friends may either recommend a product

or advise against it which either leads consumers to do more research on—and potentially

purchase—said product or discourages purchase intention. Past studies reveal that consumers are

influenced by social interactions with others when making purchase decisions, with online

reviews leading to minimized search costs (Brynjolfsson and Smith, 2000; Zhu and Zhang, 2006)

and becoming one of the main determinants in shaping consumers’ purchasing decisions (Ahmad

and Laroche, 2017; Cheung, Sia, and Kuan, 2012; Godes et al., 2005; Zhang et al., 2014).

Additionally, consumers often regard their peers’ opinions to be more trustworthy than the

contents of advertisements designed by businesses (Kardon, 2007), and research has shown that

online consumer reviews are important drivers of establishing trust among consumers (Utz et. al,

2012). In fact, Ellison and Fudenberg (1995) even found that, at times, consumers completely

rely on information they receive from others instead of taking into consideration their personal

preferences. This yet again reinforces the importance of online reviews in marketing strategies,

though determining the impact of eWOM requires a closer look at online reviews: What

characteristics exactly of online reviews affect consumer buying behavior, and in what way? The

specific review elements examined in this study are introduced in the sections below alongside

the main research question of this paper.

Several key elements of online reviews have been investigated by previous studies, and

examples include review valence (e.g., East et al., 2008) and length (Chevalier and Mayzlin,

2006; Pan & Zhang, 2011). Even though there is abundant literature addressing the effects of

many different review elements on purchase intention, studies exploring the relationship between

review variance and purchase intention for the restaurant industry are relatively scarce. Defined

as “a natural measure to capture the heterogeneity in consumer opinions” (Sun, 2012, p. 697),

review variance refers to the extent to which reviews are dispersed in terms of review ratings.

5

Studies such as Lee et al. (2009) and Babić Rosario et al. (2016) show that high variance among

online consumer reviews influences sales negatively. This is in line with the assumption that

consumers tend to avoid products when they perceive said products as a risky investment and are

thus in a state of uncertainty. However, prior and current research yields ambiguous and unclear

findings as to how variance is associated with product sales growth (e.g., Sun, 2012), requiring

additional support and consequently, additional research within this field.

Ergo, this paper aims to assess the extent to which review variance and valence impact

purchase intention for restaurant visits. Moreover, additional analysis investigates the effects of

an interaction between review variance and review valence, whose findings will be used to

address the main research question: To what extent do review variance and valence impact

purchase intention? This paper is structured as follows. First, an insight into various concepts

will be provided to ensure a better understanding of the topic. Second, the methodology, data

collection, and research design are presented. Finally, the following sections cover the analyses

and will discuss the results, after which limitations, future research and conclusions are addressed.

2. ACADEMIC RELEVANCE

As inter-communication among consumers is increasingly shifting to online platforms,

online reviews have become an important factor to take into consideration when making business

decisions. Ample literature examines the effects of various review aspects on purchase intention

and sales. However, as recognized by Langan et al. (2017), little literature covers the effect of

review variance on purchase intention, and if any, many can be classified as inexplicit. These

ambiguous findings not only relate to the effects of online review elements on an independent

variable, but also the industry or type of good (i.e., effects are different for e.g. search goods

compared to experience goods). For instance, looking into the effects of consumer ratings on

video game sales, Zhu and Zhang (2010) indicate that when reviewers do not reach a consensus

of opinion regarding a product, sales are impacted negatively. Other studies contrarily find that

low consensus with regard to product ratings is positively associated with sales (see: Clemons et

al., 2006). At yet another end, examining the relationship between review variance and movie

sales, Zhang (2006) finds no statistically observable evidence for the underlying relationship.

Also, it should be noted that many of the previously mentioned studies have largely covered

search goods as opposed to experience goods. Literature on the effects studied in this paper also

6

seems to be limited with respect to the restaurant industry. As such, this paper intends to provide

a more insightful analysis on the matter at hand. This study aims to contribute to existing

literature by addressing to what extent review variance and valence impact purchase intention in

the context of the restaurant industry, as well as deepening the knowledge and understanding in

this arguably restricted field due to the ambiguity of past and current findings. The objective of

this thesis is thus to further extend current research in this field to experience goods, specifically

restaurant visits, for reasons that will be discussed in later sections.

Principally, the purpose of this paper is to provide hypothetical key findings on the

question at hand. Using an empirical approach, this study aims to test if and how review variance

and valence influence consumer buying behavior and consequently purchase intention, with the

goal of establishing a cause-effect relationship between review variance, valence, and purchase

intention. Since positive valence is expected to increase purchase intention, the implication of a

statistically significant effect is that positive online reviews should boost business performance.

As for variance, it is expected that higher dispersion among review ratings discourages purchase

intention. Results supporting this expectation implicate that restaurant managers could face

adverse impacts on business performance due to low consensus among reviewers. Extending the

reach of the findings of this paper, the aforementioned may prove useful to several disciplines

other than the restaurant industry. The dynamics of the interrelationship between the variables

found in this study may, therefore, show similar patterns in other disciplines and industries

despite the change of context. Marketing managers, psychologists, and IT managers have long

been interested in the relationship between online reviews and consumer behavior, and numerous

studies led by these fields have given rise to various theories that elucidate said relationship (Mo

et al., 2015; Roscoe et al., 2016; Holleschovsky, and Constantinides, 2016). It should be noted

that findings may still be limited. Nonetheless, however small their impact may be, results could

still be of relevance to this field of study.

3. MANAGERIAL RELEVANCE

Nowadays, most online platforms (online stores such as Amazon.com and eBay.com or

review platforms such as Yelp.com) offer consumers the possibility to leave behind a review or

rating in the shape of star ratings and/or written reviews. These tools allow consumers to rate

product features such as quality and share their experiences. Much the same as traditional word-

7

of-mouth, and as recognized by several studies (e.g., Chevalier and Mayzlin, 2006; Davis and

Khazanchi, 2007; Duan et al., 2008), online reviews can (considerably) impact product sales and

consequently, business performance. Effects of review elements such as variance may not be as

apparent as, say, valence, though this is not necessarily reflective of the magnitude of said effects.

As such, if found significant, results may be valuable to restaurant managers who could take

advantage of the different underlying factors of online reviews that affect sales—and factors that

may otherwise be neglected—by incorporating the latter into online business and marketing

strategies. An example of such a strategy could be designing an online review system built

around the influence of online reviews and consequently, eWOM on purchase intention. In

addition, these elements of online reviews could otherwise be defined as essential for the

consumer decision-making process. This suggests that restaurant businesses should closely

monitor online reviews written by their customers in an attempt to unveil eWOM patterns

affecting the business performance of their restaurants, and minimize the adverse effects of

certain review elements (i.e., high variance, which indicates low consensus among the reviewers).

If online review elements are found to have a statistically significant impact on purchase

intention, monitoring said reviews could help managers predict actual consumer buying behavior,

which, in turn, is correlated to purchase intention (Oliver and Bearden, 1985).

4. THEORETICAL FRAMEWORK – LITERATURE REVIEW

To examine the effects of review variance, valence and their interaction on purchase

intention, several concepts will be explored to ensure clear understanding of each concept in the

following sections.

4.1 WOM and eWOM

Defined as “oral, person-to-person communication between a receiver and a

communicator whom the receiver perceives as noncommercial, regarding a brand, a product or a

service” (Arndt, 1967), word-of-mouth (WOM) and its impact have been the topic of many

discussions for a long time. One of the oldest forms of advertising, WOM typically involves

consumers providing other potential consumers with information and personal opinions on

products and services they have formerly used or are currently using. Its online counterpart,

electronic word-of-mouth (eWOM), occurs when “the Internet enables customers to share their

opinions on, and experiences with, goods and services with a multitude of other consumers; that

8

is, to engage in electronic word-of-mouth (eWOM) communication” (Hennig‐Thurau et al., 2004,

p. 38). It often involves “consumer-to-consumer communication with no economic incentives”

(Bughin et al., 2010, p. 2), denoting a cost-free method to share opinions and experiences with

others online. Abundant literature has covered the growing importance of eWOM (see:

Goldenberg et al., 2011; Zhu and Zhang, 2006). This growing relevance has been boosted by

technological advancements and the Internet era, allowing consumers to express and share their

opinions and make it thus more easily accessible to other consumers (Dellarocas, 2003; Ye et al.,

2009). Both WOM and eWOM have long been regarded by many as a trustworthy source of

information (Kardon, 2007), with the objective of curtailing uncertainty prior to making a

purchase. Consumers consider reviews trustworthy when they regard the judgments in the review

to be honest, and the latter has been found to affect purchase intention (Cheng and Zhou, 2010).

Opinions containing such judgments expressed through online reviews could, therefore,

considerably affect consumers’ buying behavior.

eWOM distinguishes itself from traditional WOM in that it is mainly expressed through

writing, and as the name suggests, it takes place on the Internet. This allows a faster exchange of

information, and eWOM typically involves an anonymous audience (Litvin et al., 2008).

Furthermore, due to the accessible nature of eWOM, consumers are able to reach—and have a

more effective impact on—a larger audience as opposed to traditional WOM (Smith et al., 2007).

4.2 Search Goods versus Experience Goods

Before establishing the effects of the review elements examined in this study, it is

imperative to distinguish between types of goods. For instance, products and services can be

classified into two categories, search goods and experience goods, and said goods differ from one

another in many ways. Search goods are usually easy to evaluate before purchasing the product,

such as electronics and games. Experience goods, however, are difficult to evaluate prior to

having experienced the product or service (e.g., travel tours, restaurant visits). The difference in

their nature suggests that online reviews could influence them in different ways. Research

revealed that experience goods are more sensitive for online reviews as consumers find it hard to

assess the quality of experiences prior to the purchase, which makes them more subject to the

effects of online reviews (Weathers et al., 2007; Park and Lee, 2009; Cheung and Thadani 2012).

As a result, consumers are more likely to rely on recommendations from others before purchasing

an experience good (Yang and Mai, 2010).

9

This study emphasizes the effects of online reviews on an experience good: restaurant

visits. Other motives for choosing this product include the nature of the product, as many

consumers can relate to the product or have at least experienced it before. Restaurant visits are

commonly used experience products, which also makes it worthwhile to address the gap in

literature with respect to the influence of online reviews on restaurant visits. In turn, using this

product will help increase familiarity of the research subjects with the product and yield more

realistic results.

4.3 Review Variance

Review variance refers to the dispersion of reviews in

terms of ratings, measuring the extent to which there is a

consensus among a group of consumers on a given product.

High variance indicates more mixed reviews in terms of

valence and low consensus in opinion, whereas low variance

indicates a collective agreement among consumers. While

many consumers consider eWOM a trustworthy source of

information, and though infrequent in reality, online reviews

might potentially lead to an increased state of quandary. This

is because a high degree of dispersion of reviews in terms of positive and negative ratings could

cause a consumer to be even more conflicted. Nowadays, many e-commerce platforms provide

consumers with a brief overview of the average review and rating scores. Several studies have

investigated the impact of review variance on purchase intention and consumer behavior, though,

as mentioned earlier, results remain inconclusive and ambiguous. In addition, literature

examining these effects on specifically restaurant visits is restricted. On the one hand, a large

group of studies found statistically observable evidence that review dispersion does in fact have

explanatory power. Early research suggests that a high rate of dispersion (i.e., a lack of consensus

in opinions among consumers) may lead to increased uncertainty in the decision-making process

(Meyer, 1981; Hogarth, 1989; West and Broniarczyk, 1998). More recent findings supporting the

significant impact of variance include Godes and Mayzlin (2004), who studied the effect of

online conversations as a form of WOM on online TV shows. In addition, Lee et al. (2009) reveal

that extremely negative reviews have a greater impact on consumer attitude toward a brand or

product than less negative and extremely positive reviews, which reinforces the influential

Figure 1 Example of how reviewer

dispersion is displayed on a website.

Source: Amazon.com

10

relevance of extremity (Lee et al., 2009) and consequently, review variance. Increased variance

may therefore decrease helpfulness, which, in turn, leads to the expectation that it ultimately

lowers purchase intention. Finally, Langan et al. (2017) find that higher review variance

decreases purchase intention, suggesting that consumers in dilemma may halt the purchasing

process altogether if reviews are too dispersed.

As stated before, existing findings are ambiguous, and depending on several other review

elements, low-consensus product reviews could either boost of worsen the way products are

evaluated (see: Park and Park, 2013) and potentially, sales. Craft beer sales were revealed to be

negatively affected by reviewer consensus (Clemons et al., 2006), implying that the less

reviewers agree with one another on the evaluation of a product, the higher the sales. Some

effects may also become apparent in unexpected ways. For example, Sun (2012) shows that,

though products with high average ratings and low consensus negatively impact sales, products

with low average ratings and low consensus in fact increase sales.

Though this study does not

introduce any new models, it may

be of the utmost importance to

highlight the dynamics behind

online reviews and in particular,

review variance. Many studies

(e.g., Chatterjee, 2001; Dellarocas

et al., 2004) have used average

product ratings to estimate their

effect on purchase intention and

product sales. These models

typically assume a “unimodal distribution” or “symmetric bimodal distribution” (Hu et al., 2009)

of ratings, with the former also commonly known as the bell curve denoting a normal distribution.

However, review platforms typically exhibit an “asymmetric bimodal distribution,” or a J-shaped

curve/distribution for the sake of simplicity. Hu et al. (2006) highlight said distribution curve,

which indicates the high number of extreme reviews based on a five-star rating. Using the J-

shaped curve as an example, Hu et al. (2006; 2007; 2009) introduce a so-called brag-and-moan

Figure 2 Example of a J-shaped curve.

11

model. According to them, consumers tend to only leave comments when they are extremely

satisfied (brag; five-star rating) or when they are dissatisfied with their purchase (moan; one-star

rating) which explains the shape of the curve. Hyrynsalmi et al. (2015) also suggest the latter, as

their findings contain several indications that users might only leave extremely negative reviews.

Furthermore, Hu et al. (2007) find that consumers with contrasted ratings (i.e., either

positive or negative) are more likely to leave a review, as opposed to consumers who have

average or moderate experiences with the product, and may thus not be bothered to write a

review at all (Hu et al., 2007; 2009). This is also referred to as “underreporting bias” (Hu et al.,

2007).

Taking the aforementioned into account, it is safe to say that more research is required to

attain a better understanding of the effect of review variance on consumer behavior. The

assumption addressed in this study, however, relies on the theory that high variance negatively

influences purchase intention. One major finding is that literature concerned with the effects of

review variance and valence on restaurant visits is limited. Therefore, this study aims to relate the

theories and findings in the previously mentioned studies to restaurant visit to address the gap in

literature. Ergo, the first hypothesis is the following:

H1: Review variance has a negative impact on purchase intention, such that higher

variance/lower consensus leads to decreased purchase intention.

In order to avoid any confusion, it should be noted that review variance will be renamed

and included in the model as “reviewer consensus.” As such, a high level of variance corresponds

to a low level of consensus among reviewers. Conversely, lower levels of review variance

correspond to high levels of consensus.

4.4 Review Valence

In essence, valence determines whether a review is positive or negative (Liu, 2006).

Positive valence can be defined as reviews in which consumers recommend a product or service

sharing positive judgments, whereas those in which consumers dissuade other consumers from

purchasing a product or service can be considered negative valence. As mentioned in previous

sections, the effect of review valence on purchase intention has been addressed by numerous

studies. For instance, valence among other elements has been identified as an important factor of

12

online reviews acknowledging its explanatory power in predicting future sales (Dellarocas, 2007)

and consumer behavior (Cheung and Thadani, 2012). Sparks and Browning (2011) find that

online reviews with a positive valence increase purchase intention as opposed to reviews with a

negative valence, and Sorensen Rasmussen (2004) confirm in their study that positive

information activates a positive consumer attitude and subsequently, increased purchase intention.

It may also be important to assess the relative effects of valence at either level (i.e., the

magnitude of the impact of reviews with a positive valence on consumer behavior or purchase

intention may be greater or smaller than that of negative impact). Yang and Mai (2010), for

instance, find that negative reviews—and thus negative (e)WOM—have a larger significant

impact on consumers than positive reviews. Having identified review valence and its potential

impact on consumer behavior (and consequently, purchase intention), it follows that it should not

be ignored as a factor when assessing the effects of online reviews. Based on the literature

findings, the second assumption states that positive reviews increase purchase intention. Ergo, the

second hypothesis predicts the following:

H2: Review valence has a positive impact on purchase intention.

4.5 Interaction Effect: Variance and Valence

As valence has an effect of its own on purchase intention, its effects may also become

evident in how it influences the relationship between a different review characteristic and

purchase intention. I.e., when review variance alters purchase intention positively or negatively,

review valence could boost this change in consumer attitude by either dissuading them from

purchasing a product or encouraging them further to purchase the product. In fact, Langan et al.

(2017) find that when high variance lowers purchase intention, these effects are intensified for

products associated with a negative valence. Moreover, negative reviews are negatively

associated with the trustworthiness of the original advertising (Huang and Chen, 2006),

suggesting that negative valence could amplify the negative effect of a review with a high

variance. Given that both lower variance and positive valence are associated with an increased

purchase intention (and vice versa), the third hypothesis predicts the following:

H3: Review valence moderates the relationship between review variance and purchase intention.

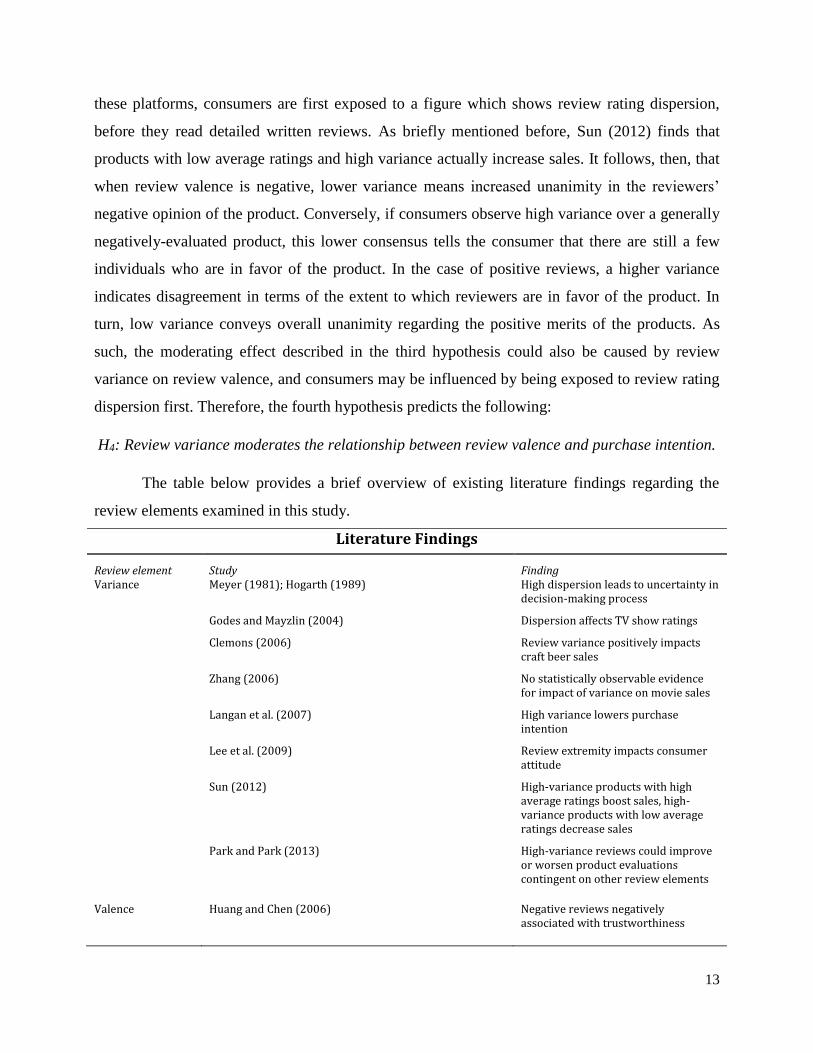
Furthermore, review platforms typically provide consumers with a brief overview of the

dispersion of ratings before consumers glance over the actual written reviews. This means that on

13

these platforms, consumers are first exposed to a figure which shows review rating dispersion,

before they read detailed written reviews. As briefly mentioned before, Sun (2012) finds that

products with low average ratings and high variance actually increase sales. It follows, then, that

when review valence is negative, lower variance means increased unanimity in the reviewers’

negative opinion of the product. Conversely, if consumers observe high variance over a generally

negatively-evaluated product, this lower consensus tells the consumer that there are still a few

individuals who are in favor of the product. In the case of positive reviews, a higher variance

indicates disagreement in terms of the extent to which reviewers are in favor of the product. In

turn, low variance conveys overall unanimity regarding the positive merits of the products. As

such, the moderating effect described in the third hypothesis could also be caused by review

variance on review valence, and consumers may be influenced by being exposed to review rating

dispersion first. Therefore, the fourth hypothesis predicts the following:

H4: Review variance moderates the relationship between review valence and purchase intention.

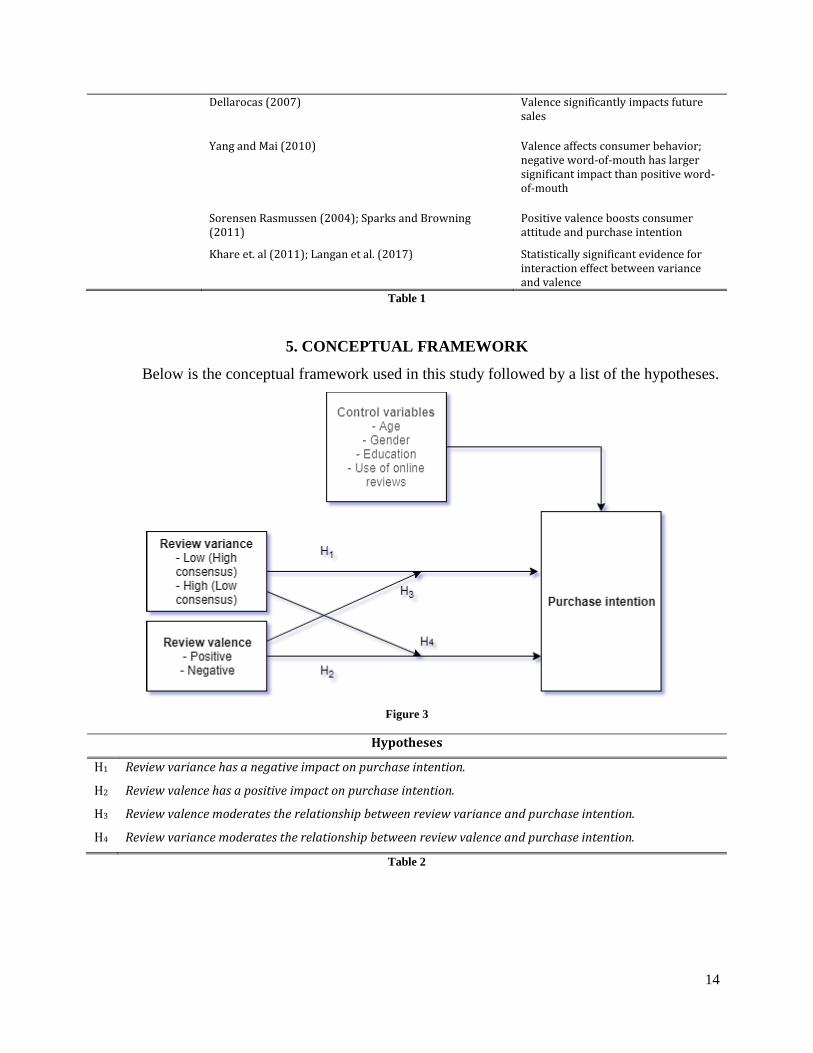
The table below provides a brief overview of existing literature findings regarding the

review elements examined in this study.

Literature Findings

Review element Study Finding Variance Meyer (1981); Hogarth (1989) High dispersion leads to uncertainty in

decision-making process

Godes and Mayzlin (2004) Dispersion affects TV show ratings

Clemons (2006) Review variance positively impacts craft beer sales

Zhang (2006) No statistically observable evidence for impact of variance on movie sales

Langan et al. (2007) High variance lowers purchase intention

Lee et al. (2009) Review extremity impacts consumer attitude

Sun (2012) High-variance products with high average ratings boost sales, high-variance products with low average ratings decrease sales

Park and Park (2013) High-variance reviews could improve or worsen product evaluations contingent on other review elements

Valence Huang and Chen (2006) Negative reviews negatively associated with trustworthiness

14

Dellarocas (2007) Valence significantly impacts future sales

Yang and Mai (2010) Valence affects consumer behavior; negative word-of-mouth has larger significant impact than positive word-of-mouth

Sorensen Rasmussen (2004); Sparks and Browning (2011)

Positive valence boosts consumer attitude and purchase intention

Khare et. al (2011); Langan et al. (2017) Statistically significant evidence for interaction effect between variance and valence

Table 1

5. CONCEPTUAL FRAMEWORK

Below is the conceptual framework used in this study followed by a list of the hypotheses.

Figure 3

Hypotheses

H1 Review variance has a negative impact on purchase intention.

H2 Review valence has a positive impact on purchase intention.

H3 Review valence moderates the relationship between review variance and purchase intention.

H4 Review variance moderates the relationship between review valence and purchase intention.

Table 2

15

6. METHODOLOGY – DATA COLLECTION

6.1 Research Design

In order to assess the extent to which online reviews impact purchase intention, an online

experiment was conducted based on the conceptual framework used in this study. Using an online

survey, respondents were asked to fill out a questionnaire. The survey consisted of four

conditions, each representing an interaction (e.g., reviews with positive valence and high

consensus/low variance). Participants first study a set of online reviews pertaining to a certain

condition, after which they are asked to answer the relating questions. Also, a 2 x 2 between-

subject design was used for this study, which includes randomization of all four conditions to

ensure prevention of carry-over effects and anchoring bias (Field and Hole, 2003). This will help

prevent biased responses as carry-over effects might lead to altered ensuing performance and

respondent behavior due to experiences in previous conditions (Field and Hole, 2003).

6.2 Survey Design

The survey was conducted using the Qualtrics platform. The settings were set in such a

way that respondents were randomly assigned to one of the four conditions when clicking the

survey link. At the beginning of the survey, respondents are informed of the context, purpose, and

topic of the questionnaire. Then, respondents are asked if they check online reviews before

visiting a restaurant, after which they proceed to the next page. The respondents will first

examine the distribution of consumer reviews and then study five online reviews corresponding

to their respective condition. This is followed by a set of questions relating to the online reviews

and conditions, after which respondents are finally required to specify their age, gender and

highest level of education completed. Furthermore, to ensure that the conditions were

manipulated well, 20 individuals of different educational backgrounds were each presented with

only one of the conditions before setting up the survey. The set-up of this qualitative-quantitative

informal pre-test check helps to ensure the prevention of experimental fatigue effects and

consequently skewed results (Field and Hole, 2003) by having respondents participate in one

condition only. They were then asked to assess the condition presented to them and evaluate them

in terms of valence (e.g. Would you classify this review as positive or negative? Do the reviewers

of this restaurant seem to be in favor of the restaurant or dismissive?) and variance (e.g. Is there

a high consensus among the reviewers? Do you distinguish low consensus among the reviewers?).

The conditions used in this survey were then based on the results and answers to the

16

aforementioned questions. Results within this desired sample group indicate that there was a

general consensus of what a positive/negative review meant, as well as if there was high or low

variance among the reviews.

The design of the online reviews is based on the crowd-source review platform Yelp,

famous for its consumer-generated restaurant reviews. The main motive behind choosing this

platform design is to relate the manipulated reviews used in this study as closely as possible to

real online reviews found on Yelp in order to increase respondents’ familiarity with the service.

The name of the restaurants used in the reviews, however, is not specified to prevent any prior

attitude or opinion toward a restaurant. Reviews were taken from the Yelp website in the form of

a screenshot and modified in such a way that the identity of both the reviewer and the restaurant

remains unknown. Appendix A includes an example of the content used in the survey.

6.3 Data Collection

In total, 199 complete responses were collected from the 248 participants that filled out

the questionnaire (49 incomplete responses were discarded). The sample consists of 101 males

(50.8%) and 98 females (49.2%), indicating a nearly equal distribution in terms of gender. The

total age range of the sample is 17-52, though the most frequent age range is 20-25 (79.8%). As

for the highest level of education completed, 57.8% of the sample has obtained either a university

bachelor’s degree (36.2%) or a university master’s degree (21.6%). The table below shows the

distribution of respondents for each condition.

Condition Variance Valence Number of respondents 1 High Variance Positive 51

2 Low Variance Positive 48

3 High Variance Negative 53

4 Low Variance Negative 47

Table 3

7. METHODOLOGY – EMPIRICAL FRAMEWORK

This section presents the model used for this study and discusses how the main variables

were measured and constructed. First, the table below briefly highlights the variables used in this

model.

Variable Name Variable Type Unit of Measurement Purchase Intention DV 7-point Likert scale

Reviewer Consensus IV High Consensus (Low Variance);

17

Low Consensus (High Variance)

Review Valence IV, MOD Positive; Negative

Control Variables IV (CONTROL) (e.g., Age, Education, Gender, Use

of Reviews)

Table 4

This study aims to investigate the extent to which the variables highlighted above are

related to one another. Therefore, the full model through which purchase intention (i.e., intention

to visit a restaurant) is measured is represented by the following equation (1):

𝑃𝑢𝑟𝑐ℎ𝑎𝑠𝑒 𝑖𝑛𝑡𝑒𝑛𝑡𝑖𝑜𝑛𝑖 = 𝛼0 + 𝛽1𝑅𝑒𝑣𝑖𝑒𝑤𝑒𝑟𝐶𝑜𝑛𝑠𝑒𝑛𝑠𝑢𝑠𝑖 + 𝛽2𝑅𝑒𝑣𝑖𝑒𝑤𝑉𝑎𝑙𝑒𝑛𝑐𝑒𝑖 +

𝛽3𝑅𝑒𝑣𝑖𝑒𝑤𝑒𝑟𝐶𝑜𝑛𝑠𝑒𝑛𝑠𝑢𝑠 ∗ 𝑅𝑒𝑣𝑖𝑒𝑤𝑉𝑎𝑙𝑒𝑛𝑐𝑒𝑖 + 𝛽4𝐴𝑔𝑒𝑖 + 𝛽5𝐺𝑒𝑛𝑑𝑒𝑟𝑖 + 𝛽6𝐸𝑑𝑢𝑐𝑎𝑡𝑖𝑜𝑛𝑖 +

𝛽7𝑅𝑒𝑣𝑖𝑒𝑤𝐶ℎ𝑒𝑐𝑘𝑖 + 𝜀𝑖

(1)

7.1 Pre-Analysis Tests

7.1.1 Scale Items and Operationalization

The three scale measures for reviewer consensus (variance) and valence adopted in this

study are based on the study by Langan et al. (2007). The manipulation of variance was measured

on a 7-point Likert scale (1 = strongly disagree and 7 = strongly agree) and participants were

asked to indicate the extent of their agreement with the following three statements:

As for valence, manipulation was measured on a 7-point Likert scale (1 = very negative

and 7 = very positive; 1 = very unfavorable and 7 = very favorable) and participants were asked

to indicate the extent of their agreement with the following statement:

Finally, purchase intention was also measured on a 7-point Likert scale (1 = strongly

disagree and 7 = strongly agree) scale and respondents were asked to indicate the extent of their

agreement with the following three statements:

Review Variance/Reviewer Consensus

“All reviewers rated the restaurant visits similarly”

“I believe all the reviews indicate a consensus about the quality of the restaurant visit”

“I believe all the reviews indicate unanimity of opinion about the quality of the restaurant visit”

Review Valence

“The reviewers’ rating of the restaurant visit were”

18

The table below provides a quick overview of the operational definitions of the

conceptual variables.

Conceptual Variable Operational Definition

Purchase Intention ▪ Willingness to choose restaurant over other alternatives

▪ Willingness to recommend restaurant to friends and peers

▪ Willingness to visit restaurant in the near future

Reviewer

Consensus

▪ Extent to which reviewers rate restaurants similarly

▪ Extent to which reviewers reach consensus about quality of restaurant visit

▪ Extent of unanimity of opinion about the quality of the restaurant visit

Review Valence ▪ Extent to which reviewers’ ratings were positive (or negative)

▪ Extent to which reviewers’ ratings were favorable (or unfavorable)

Table 5 Operational definitions of the Conceptual Variables.

7.1.2 Construct Validity (Reliability and Factor Analysis)

To ensure the validity of the above-stated scale measures, a reliability and factor analysis

were performed to check the internal consistency of the scale items (Appendix B). First, a

reliability test using Cronbach’s alpha (Appendix B2) was conducted. Cronbach’s alpha for all

three factors were over 0.90, far exceeding the acceptable 0.70 minimum.

As for factor analysis (Appendix C), the communalities output table reveals that there is

(relatively) high correlation among the scale items of each construct. According to Fornell and

Larcker (1981), the percentage of (average) variance extracted (AVE) of a valid construct should

be greater than 0.5. The table below shows that each construct shows an AVE of over 0.8, and the

constructs thus meet the requirement for validity.

Factor No. of Scale Items Cronbach’s Alpha % of Variance Extracted (AVE)

Purchase Intention 3 0.947 0.904

Reviewer Consensus 3 0.909 0.849

Review Valence 2 0.952 0.914

Table 6 Reliability analysis results.

Purchase Intention

“I would visit this restaurant rather than any other restaurants available”

“I am willing to recommend others to visit this restaurant”

“I intend to visit this restaurant in the future”

19

7.1.3 Manipulation Check (Independent Samples t-Tests)

To assess whether the conditions were manipulated well, two manipulation checks (i.e.,

independent samples t-test) were performed on reviewer consensus and review valence

(Appendix D).

Reviewer consensus. An independent-samples t-test was conducted to compare purchase

intention in low-consensus (high-variance) and high-consensus (low-variance) conditions. The

analysis reveals that the manipulation was successful, as there was a significant difference in the

scores for low-consensus (M=3.24, SD=1.37) and high-consensus (M=3.93, SD=2.19)

conditions; t(197)=-2.59, p = 0.010.

Valence. An independent-samples t-test was conducted to compare purchase intention in

positive and negative conditions. The analysis reveals that the manipulation was successful, as

there was a significant difference in the scores for positive (M=5.15, SD=1.25) and negative

(M=2.18, SD=1.13) conditions; t(197)=17.58, p = 0.000.

7.1.4 Dichotomization

Lastly, after performing a factor analysis and establishing the variables for reviewer

consensus and valence, the median split of both variables was taken to recode the variables and

transform them into categorical variables (i.e., reviewer consensus and valence are dichotomized).

Although several studies advise against the use of dichotomization due to potential loss of

explanatory power (Altman and Royston, 2006; Royston et al., 2006), research also

acknowledges the merits of dichotomization as it helps to provide the audience with

understandable results (DeCoster, 2009). Also, dichotomization has been shown to yield similar

if not equally reliable results as the use of continuous variables under certain conditions

(DeCoster, 2009). As such, the splitting of review valence and reviewer consensus in this study is

intended to provide a better classification of high/low consensus (low/high variance) and

positive/negative valence. First, an analysis is run to compare the frequencies and median for

both variables. For reviewer consensus, values 1-5 on the 7-point Likert scale were treated as

“low consensus (high variance)” and values 5-7 for “high consensus (low variance),” while for

valence, values 1-4 on the 7-point Likert scale were treated as “negative” and values 5-7 as

“positive.”

20

8. RESULTS

The following section provides an overview of the regression results, which includes the

hypothesis testing. As only the most important results are reported in this section, additional

output results can be found in the appendix (Appendix E).

Descriptive Statistics N Minimum Maximum Mean Std. Deviation

Purchase Intention 199 1.00 7.00 3.6315 1.90557

Reviewer Consensus 199 1.00 2.00 1.5678 .49663

Valence 199 1.00 2.00 1.5126 .50110

Age 199 11 52 23.63 4.338

Gender 199 1 2 1.49 .501

Education 199 1 5 3.47 1.270

Review Check 199 .00 1.00 .8643 .34331 Table 7 Variables used in the regression analysis.

8.1 Direct Effects: Reviewer Consensus and Valence

H1: Review variance has a negative impact on purchase intention, such that higher

variance/lower consensus leads to decreased purchase intention.

A two-way ANOVA test was calculated to predict purchase intention based on reviewer

consensus and review valence. The Levene’s test of equality of error variances yields no

significant results, F(3,195) = 0.74 and p > 0.05, which indicates that the assumption of

homogeneity of variance is not violated. The ANOVA test reveals that reviewer consensus has no

significant impact on purchase intention; F(1,195) = 3.84, p > 0.05, and referring to the pairwise

(multiple) comparison table, there is no significant mean difference for purchase intention at

either level of low consensus/high variance (M = 3.41, SD = 0.12) and high consensus/low

variance (M = 3.71, SD = 0.10). Therefore, review variance does not statistically significantly

impact purchase intention, and H1 rejected.

H2: Review valence has a positive impact on purchase intention.

A two-way ANOVA test was calculated to predict purchase intention based on reviewer

consensus and review valence. The regression analysis reveals that valence has a significant

impact on purchase intention F(1,195) = 325.09; p < 0.05, indicating a significant difference for

purchase intention at either level of positive (M = 4.94, SD = 0.11) and negative reviews (M =

2.18, SD = 0.11). The latter is also confirmed using the pairwise (multiple) comparison table.

21

Therefore, review valence has a statistically significant impact on purchase intention, and H2 is

not rejected.

Test of Between-Subjects Effects: Direct Effects

Dependent Variable df F Significance

Reviewer Consensus 1 4.272 0.052

Valence 1 362.077 0.000

R Squared = 0.698. Adjusted R Squared = 0.693.

Table 8 Regression results of Reviewer Consensus and Review Valence on Purchase Intention.

8.2 Direct Effects and Interaction Effects: Reviewer Consensus * Valence

H3: Review valence moderates the relationship between review variance and purchase intention.

H4: Review variance moderates the relationship between review valence and purchase intention.

The third and fourth hypotheses predict that there is an interaction effect between variance

and valence on purchase intention. A two-way ANOVA test with an interaction term was

conducted to test the simple main effects of reviewer consensus and review valence. As can be

seen in Appendix E, the Levene’s test for equality reveals that there is homogeneity of variances

(F(3,195) = 0.74, p > 0.05) and therefore, there is no violation of the homogeneity of variances

assumption. We observe a statistically significant interaction effect, F(1,195) = 54.28, p < 0.05.

In addition, the difference in the means for purchase intention for high-consensus (low-variance)

and low-consensus (high-variance) reviews at either level of valence was statistically different

(positive valence: F(1,195) = 40.58, p < 0.05 and negative valence: F(1,195) = 15.76, p < 0.05).

Similarly, the difference between positive and negative valence is also statistically different at

either level of reviewer consensus (low consensus/high variance: F(1,195) = 49.39, p < 0.05 and

high consensus/low variance: F(1.195) = 379.92, p < 0.05). Therefore, H3 and H4 are not rejected.

Test of Between-Subjects Effects: Direct and Interaction Effects

Dependent Variable df F Significance

Reviewer Consensus 1 4.272 0.052

Valence 1 362.077 0.000

Reviewer Consensus *

Valence

1 60.452 0.000

R Squared = 0.698. Adjusted R Squared = 0.693.

Table 9 IBM SPSS Regression Results of Reviewer Consensus* Valence (Interaction Term) on Purchase Intention.

22

8.2.1 Simple Main Effects

A simple main effect analysis is performed to assess the simple main effects of reviewer

consensus and valence, applying the Bonferroni adjustment (Appendix F). This includes a two-

fold analysis: first we look at reviewer consensus at each level of review valence, after which we

look at review valence at each level of reviewer consensus. The analysis reveals that there is a

statistically significant mean difference in both levels of reviewer consensus when valence is

positive F(1, 195) = 40.58, p < 0.05 and negative F(1,195) = 15.58, p < 0.05. Similarly, the

difference between the means of positive and negative valence is also statistically significant

when there is low consensus/high variance F(1,195) = 49.39, p < 0.05 and high consensus/low

variance F(1,195) = 379.92.

8.3 Full Model – Inclusion of Control Variables

The previous two models did not take the control variables into account. The conceptual

framework predicts that demographics such as age, gender and education as well as attitude

toward online reviews (i.e., whether the respondents check online reviews before making a

restaurant visit) affect purchase intention concurrently with the independent variables. Therefore,

in order to provide a more accurate analysis of the effect of purchase intention, these control

variables are included in the full model. Below is a brief overview of the descriptive statistics of

these variables.

Descriptive Statistics N Minimum Maximum Mean Std. Deviation Measure

Age 199 17 52 23.63 4.338 Continuous

Gender 199 1 2 1.49 .501 1 = Male; 2 = Female

Education 199 1 5 3.47 1.270 1 = High school;

2 = MBO degree;

3 = HBO degree;

4 = University bachelor’s

degree;

5 = University master’s degree

Review

Check

199 .00 1.00 .8643 .34331 0 = No; 1 = Yes

Table 10

23

An ANCOVA test is conducted to assess whether the control variables influence the

dependent variable by including them as covariates (Appendix G). This full-model regression

analysis is based on Equation 1 shown in section 7. All control variables, with the exception of

age, are categorical. A Levene’s test of equality of error variance yields an insignificant result

(F(3,195) = 0.323 and p > 0.05; Appendix G), indicating that there is no violation of the

homogeneity of variances assumption. The ANCOVA reveals that there are no significant effects

on purchase intention. As before, reviewer consensus (variance) remains insignificant (with a

slight increase in insignificance; p = 0.095 compared to p = 0.052 in the previous section). The

test did yield significant results for valence, F(1, 191) = 334.64, p < 0.05, and the interaction term

between reviewer consensus (variance) and valence, F(1,191) = 57.69, p < 0.05. The output table

below shows the regression results.

Test of Between-Subjects Effects: Full Model

Dependent Variable df F Significance

Age 1 1.747 0.208

Gender 1 1.635 0.223

Education 1 1.690 0.216

Review Check 1 2.824 0.110

Reviewer Consensus 1 4.272 0.095

Valence 1 362.077 0.000

Reviewer Consensus *

Valence

1 60.452 0.000

R Squared = 0.709. Adjusted R Squared = 0.699.

Table 11 IBM SPSS Regression Results of the Full Model.

9. DISCUSSION AND IMPLICATIONS

This section addresses the research question and discusses the results of the analyses,

findings and implications. The discussion is followed by the limitations of this study as well as

suggestions for future research. The main objective of this paper was to examine the effect of

review variance, review valence and their interaction on purchase intention. As stated in previous

sections, literature findings regarding the effects of variance and valence on consumer behavior

are equivocal and yield divided conclusions.

24

This study presents the effects of two review elements at two levels each. The results

reveal no significant effects of review variance on purchase intention. This is in line with a few

previous studies (e.g., Zhang, 2006) but contradicts many others as shown in earlier sections.

However, the ambiguity regarding the statistically insignificant effect of variance on purchase

intention is also an indication that no finding can be considered conclusive. Therefore, despite the

findings of this study, it may still be important to recognize the effects of showing review rating

dispersion on review websites.

Review valence, on the other hand, was found to significantly impact purchase intention

and the findings were in line with the hypothesis, which predicts a positive relationship with

purchase intention. Respondents were more likely to visit a restaurant after reading a positive

review compared to a negative review. Conversely, respondents’ purchase intention decreased

when faced with a negative review. The analysis thus confirms that it is highly important to have

positive reviews in order to ensure higher sales in terms of restaurant visits. To achieve this,

restaurant managers and consequently businesses should closely monitor and study consumer

reviews and ratings and recognize patterns which they can transform into tools used to meet the

customers’ expectations. The latter leads to increased satisfaction which, in turn, leads to more

positive reviews. Similarly, negative reviews could be addressed by providing the consumers

who wrote them with a form of (monetary) compensation, incentivizing them to leave positive

reviews in the future and consequently enhancing the restaurant’s business performance.

Another finding is that valence moderates the relationship between variance and purchase

intention (and vice versa) as the analysis shows a statistically significant interaction effect

between review variance and valence on purchase intention. In terms of impact magnitude,

reviews with a positive valence and high consensus (low variance) had the strongest positive

effect on purchase intention, followed by reviews with positive valence and low consensus (high

variance). Interestingly, negative reviews with high consensus/low variance had a more negative

impact on purchase intention than negative reviews with low consensus/high variance. The latter

finding seems to be in line with the findings of Sun (2012), who found that products with low

average ratings and high variance increased sales, as opposed to products with high average

ratings and high variance that had a negative impact on sales. To provide a graphical illustration

of the aforementioned, reviewer consensus (review variance) and review valence are plotted

25

against each other in the graph below (Figure 4). When looking at the graph on the right, we

distinguish a so-called disordinal interaction. According to Widaman et al. (2012), disordinal

interaction occurs when the “interaction contains a crossover of predicted values within the

observed range of values on X” (Widaman et al., 2012). Put simply, disordinal interaction occurs

when the group means of two factors cross within the observed range, and in the case of this

study, the graph illustrates the disordinal interaction between review valence and reviewer

consensus on purchase intention. As explained by Sun (2012), a negative valence and high

variance could signal to some consumers that the product or service (in this case, a restaurant) is

only right for the right consumer, which in turn leads to increased demand. Though this

phenomenon normally holds for niche products, it might still apply to restaurant visits as not

every individual has the same preference in terms of, say, service or favorite dishes. The higher

variance simply indicates that there are still a few individuals who share a positive opinion on the

restaurant, which makes the restaurant look better relative to when there is unanimity in the

negative opinion about the restaurant.

Furthermore, the inclusion of control variables had no significant impact on purchase

intention. This could suggest that the examined control variables may not necessarily play a role

in the process of visiting a restaurant as it is a common practice regardless of age, gender,

education and review attitude. Nonetheless, other external factors not addressed in this study may

have been overlooked.

Figure 4

26

Finally, the table below (based on Table 1) provides a brief comparison between the

literature findings discussed in previous sections and findings by this study. Please note that

“similar” here means that effects are not necessarily identical but show similar patterns. For

instance, Huang and Chen (2006) find that negative reviews decrease trustworthiness, with the

latter being correlated to purchase intention. This study finds that negative reviews decrease

purchase intention, denoting a similar effect. Alternatively, Meyer’s and Hogarth’s findings

found that high dispersion increases uncertainty in the decision-making process, with the latter

relating to consumer behavior and consequently, purchase intention. However, this effect cannot

be confirmed by this paper as no statistically significant results were found for the effect of

variance on purchase intention. Nonetheless, many findings—especially those related to

valence—were confirmed. Positive reviews were found to significantly increase purchase

intention, and a significant interaction effect was confirmed between variance and valence on

purchase intention.

Literature Findings Confirmed by this paper

Review element

Study Finding Findings similar to findings in this paper?

Variance Meyer (1981); Hogarth (1989)

High dispersion leads to uncertainty in decision-making process

No

Godes and Mayzlin (2004) Dispersion affects TV show ratings

No

Clemons (2006) Review variance positively impacts craft beer sales

Yes

Zhang (2006) No statistically observable evidence for impact of variance on movie sales

Yes

Langan et al. (2007) High variance lowers purchase intention

No

Lee et al. (2009) Review extremity impacts consumer attitude

No

Sun (2012) High-variance products with high average ratings boost sales, high-variance products with low average ratings decrease sales

Yes

Park and Park (2013) High-variance reviews could improve or worsen product

Yes

27

evaluations contingent on other review elements

Valence Huang and Chen (2006) Negative reviews negatively associated with trustworthiness

Yes

Dellarocas (2007) Valence significantly impacts future sales

Yes

Yang and Mai (2010) Valence affects consumer behavior; negative word-of-mouth has larger significant impact than positive word-of-mouth

Yes

Sorensen Rasmussen (2004); Sparks and Browning (2011)

Positive valence boosts consumer attitude and purchase intention

Yes

Khare et. al (2011); Langan et al. (2017)

Statistically significant evidence for interaction effect between variance and valence

Yes

Table 12

10. LIMITATIONS AND FUTURE RESEARCH AVENUES

A few limitations of this study should be acknowledged. The first limitation is concerned

with the design of the experiment. Though the survey consisted of four conditions, no control

groups were included. The inclusion of a control group provides a better insight into the extent to

which a manipulated group differentiates from the unmanipulated groups. Also, as with many

experiments, respondents were aware of the simulated experimental setting, suggesting that they

might have exhibited different behavior in a real setting. This also implies that purchase intention

as examined in this research may not coincide with actual purchase behavior when respondents

make a real restaurant visit. Moreover, despite the anonymous nature of the experiment,

participants may have provided answers affected by social pressure. Dichotomization of variables

may also result in loss of explanatory power (DeCoster, 2009) which could potentially lead to

smaller data variation and biased results. Lastly, despite the inclusion of several control variables,

this study may have overlooked or failed to capture other external influences on purchase

intention. Suggestions for future research will, therefore, be discussed in the following section.

Drawbacks and limitations of this study could open doors for future research. As noted in

previous sections, research can be expanded across restaurant businesses and similar industries to

28

address the gap in literature with respect to the restaurant industry. Also, future research

examining the effects addressed in this study should include a control group to ensure a better

insight into the extent to which manipulated groups differ. Furthermore, past and current studies

have investigated various review elements and their effects on consumer behavior, but factors

that may not be self-evident could be investigated to unveil online review patterns that impact

consumer behavior. Lastly, additional control variables could be considered for future research.

The control variable used for attitude toward online reviews was rather restricted as it only

assesses whether consumers take online reviews into consideration when looking for restaurants

and may thus have failed to capture other effects of attitude toward restaurants and online reviews.

11. CONCLUSION

The emergence and technological advancements of the Internet have allowed consumers

to share their experiences with complete strangers from all over the world. Realizing their

relevance and power, online reviews are a tool that can be used by both consumers and

businesses alike. The purpose of this paper is to provide a detailed insight into the effects of

review variance and valence and their interaction on purchase intention for experience goods:

restaurant visits. Existing literature has yielded ambiguous and unclear results which call for

more research in this field. This study finds no statistically observable evidence for the impact of

review variance on purchase intention (restaurant visits), though additional research is required to

obtain more conclusive results. Furthermore, review valence was found to have a statistically

significant effect on purchase intention, which suggests that positive reviews are essential for a

restaurant’s success. Positive reviews result in increased purchase intention for restaurant visits

and are thus an important factor in shaping the business performance of a restaurant. In addition,

the effect of the interaction between variance and valence on purchase intention was found

statistically significant. Positive reviews boost purchase intention when review variance is low

compared to when reviews are negative, and variance is high. Interestingly, when reviews are

negative, this study reveals that purchase intention is lower in the case of low variance (high

consensus), as opposed to when reviews show low consensus (high variance) among reviewers. A

possible explanation could be that in the case of negative reviews, high variance could signal to

the consumer that some consumers hold a positive attitude toward the product or service and that

the restaurant is only right for the right consumer. Nevertheless, future research could extend this

29

research to address the gaps of this study. All in all, online reviews and their elements have

shown to be powerful tools capable of affecting business performance and are thus a force to be

reckoned with.

12. REFERENCES

Ahmad, S. N., & Laroche, M. (2017). Analyzing electronic word of mouth: A social

commerce construct. International Journal of Information Management, 37(3), 202-213.

Altman, D. G., & Royston, P. (2006). The cost of dichotomising continuous

variables. Bmj, 332(7549), 1080.

Arndt, J. (1967). Word of mouth advertising: A review of the literature. Advertising

Research Foundation.

Babić Rosario, A., Sotgiu, F., De Valck, K., & Bijmolt, T. H. (2016). The effect of

electronic word of mouth on sales: A meta-analytic review of platform, product, and metric

factors. Journal of Marketing Research, 53(3), 297-318.

Brynjolfsson, E., & Smith, M. D. (2000). Frictionless commerce? A comparison of

Internet and conventional retailers. Management science, 46(4), 563-585.

Bughin, J., Doogan, J., & Vetvik, O. J. (2010). A new way to measure word-of-mouth

marketing. McKinsey Quarterly, 2, 113-116.

Chatterjee, P. (2001). Online reviews: do consumers use them?.

Cheng, X., & Zhou, M. (2010, August). Study on effect of ewom: A literature review and

suggestions for future research. In Management and Service Science (MASS), 2010 International

Conference on (pp. 1-4). IEEE.

Cheung, C. M. Y., Sia, C. L., & Kuan, K. K. (2012). Is this review believable? A study of

factors affecting the credibility of online consumer reviews from an ELM perspective. Journal of

the Association for Information Systems, 13(8), 618.

Chevalier, J. A., & Mayzlin, D. (2006). The effect of word of mouth on sales: Online

book reviews. Journal of marketing research, 43(3), 345-354.

30

Chu, W., Roh, M., & Park, K. (2015). The effect of the dispersion of review ratings on

evaluations of hedonic versus utilitarian products. International Journal of Electronic

Commerce, 19(2), 95-125.

Clemons, E. K., Gao, G. G., & Hitt, L. M. (2006). When online reviews meet

hyperdifferentiation: A study of the craft beer industry. Journal of management information

systems, 23(2), 149-171.

Davis, A., & Khazanchi, D. (2007). The influence of online word of mouth on product

sales in retail e-commerce: an empirical investigation. AMCIS 2007 Proceedings, 176.

DeCoster, J., Iselin, A. M. R., & Gallucci, M. (2009). A conceptual and empirical

examination of justifications for dichotomization. Psychological methods, 14(4), 349.

Dellarocas, C., Awad, N., & Zhang, X. (2004). Exploring the value of online reviews to

organizations: Implications for revenue forecasting and planning. ICIS 2004 Proceedings, 30.

Dellarocas, C., Zhang, X., & Awad, N. F. (2007). Exploring the value of online product

reviews in forecasting sales: The case of motion pictures. Journal of Interactive marketing, 21(4),

23-45.

Duan, W., Gu, B., & Whinston, A. B. (2008). The dynamics of online word-of-mouth and

product sales—An empirical investigation of the movie industry. Journal of retailing, 84(2), 233-

242.

East, R., Hammond, K., & Lomax, W. (2008). Measuring the impact of positive and

negative word of mouth on brand purchase probability. International journal of research in

marketing, 25(3), 215-224.

Ellison, G., & Fudenberg, D. (1995). Word-of-mouth communication and social

learning. The Quarterly Journal of Economics, 110(1), 93-125.

Field, A. & Hole, G. (2003). How to design and report experiments, SAGE publications

Ltd.

Fornell, C., & Larcker, D. F. (1981). Evaluating structural equation models with

unobservable variables and measurement error. Journal of marketing research, 39-50.

31

Godes, D., & Mayzlin, D. (2004). Using online conversations to study word-of-mouth

communication. Marketing science, 23(4), 545-560.

Godes, D., Mayzlin, D., Chen, Y., Das, S., Dellarocas, C., Pfeiffer, B., ... & Verlegh, P.

(2005). The firm's management of social interactions. Marketing letters, 16(3-4), 415-428.

Hennig‐Thurau, T., Gwinner, K. P., Walsh, G., & Gremler, D. D. (2004). Electronic

word‐of‐mouth via consumer‐opinion platforms: What motivates consumers to articulate

themselves on the Internet?. Journal of interactive marketing, 18(1), 38-52.

Hogarth, R. M., & Kunreuther, H. (1989). Risk, ambiguity, and insurance. Journal of risk

and uncertainty, 2(1), 5-35.

Holleschovsky, N. I., & Constantinides, E. (2016). Impact of online product reviews on

purchasing decisions. WEBIST.

Hu, N., Pavlou, P. A., & Zhang, J. (2006, June). Can online reviews reveal a product's

true quality?: empirical findings and analytical modeling of Online word-of-mouth

communication. In Proceedings of the 7th ACM conference on Electronic commerce (pp. 324-

330). ACM.

Hu, N., Pavlou, P., & Zhang, J. (2007). Why do online product reviews have a J-shaped

distribution? Overcoming biases in online word-of-mouth communication.

Hu, N., Zhang, J., & Pavlou, P. A. (2009). Overcoming the J-shaped distribution of

product reviews. Communications of the ACM, 52(10), 144-147.

Hyrynsalmi, S., Seppanen, M., Aarikka-Stenroos, L., Suominen, A., Jarvelainen, J., &

Harkke, V. (2015). Busting myths of electronic word of mouth: the relationship between

customer ratings and the sales of mobile applications. Journal of theoretical and applied

electronic commerce research, 10(2), 1-18.

Kardon, B. (2007). They’re saying nasty things. Marketing news, 41(20), 30.

Khare, A., Labrecque, L. I., & Asare, A. K. (2011). The assimilative and contrastive

effects of word-of-mouth volume: An experimental examination of online consumer

ratings. Journal of Retailing, 87(1), 111-126.

32

Langan, R., Besharat, A., & Varki, S. (2017). The effect of review valence and variance

on product evaluations: An examination of intrinsic and extrinsic cues. International Journal of

Research in Marketing, 34(2), 414-429.

Lee, J., & Lee, J. N. (2009). Understanding the product information inference process in

electronic word-of-mouth: An objectivity–subjectivity dichotomy perspective. Information &

Management, 46(5), 302-311.

Lee, M., Rodgers, S., & Kim, M. (2009). Effects of valence and extremity of eWOM on

attitude toward the brand and website. Journal of Current Issues & Research in

Advertising, 31(2), 1-11.

Litvin, S. W., Goldsmith, R. E., & Pan, B. (2008). Electronic word-of-mouth in

hospitality and tourism management. Tourism management, 29(3), 458-468.

Liu, Y. (2006). Word of mouth for movies: Its dynamics and impact on box office

revenue. Journal of marketing, 70(3), 74-89.

Meyer, R. J. (1981). A model of multiattribute judgments under attribute uncertainty and

informational constraint. Journal of Marketing Research, 428-441.

Mo, Z., Li, Y. F., & Fan, P. (2015). Effect of online reviews on consumer purchase

behavior. Journal of Service Science and Management, 8(03), 419.

Muchnik, L., Aral, S., & Taylor, S. J. (2013). Social influence bias: A randomized

experiment. Science, 341(6146), 647-651.

Oliver, R. L., & Bearden, W. O. (1985). Crossover effects in the theory of reasoned

action: A moderating influence attempt. Journal of consumer research, 12(3), 324-340.

Online Shopping for Electronics, Apparel, Computers, Books, DVDs & more. (2018).

Retrieved from https://www.amazon.com/

Pan, Y., & Zhang, J. Q. (2011). Born unequal: a study of the helpfulness of user-

generated product reviews. Journal of Retailing, 87(4), 598-612.

Park, C., & Lee, T. M. (2009). Information direction, website reputation and eWOM

effect: A moderating role of product type. Journal of Business research, 62(1), 61-67.

33

Park, S. B., & Park, D. H. (2013). The effect of low‐versus high‐variance in product

reviews on product evaluation. Psychology & Marketing, 30(7), 543-554.

Roscoe, R.D., Grebitus, C., O’Brian, J., Johnson, A.C. and Kula, I. (2016). Online

information search and decision making: Effects of web search stance, Computers in human

behavior, 103–118.

Royston, P., Altman, D. G., & Sauerbrei, W. (2006). Dichotomizing continuous predictors

in multiple regression: a bad idea. Statistics in medicine, 25(1), 127-141.

Smith T, Coyle JR, Lightfoot E, Scott A (2007) Reconsidering models of influence: the

relationship between consumer social networks and word-of-mouth effectiveness. Journal of

Advertising Research 47(4):387– 397.

Sun, M. (2012). How does the variance of product ratings matter?. Management

Science, 58(4), 696-707.

Utz, S., Kerkhof, P., & Van Den Bos, J. (2012). Consumers rule: How consumer reviews

influence perceived trustworthiness of online stores. Electronic Commerce Research and

Applications, 11(1), 49-58.

Weathers D, Sharma S, Wood SL. Effects of online communication practices on

consumer perceptions of performance uncertainty for search and experience Goods. J Retail

2007;83(4):393–401. West PM, Broniarczyk SM. Int

West, P. M., & Broniarczyk, S. M. (1998). Integrating multiple opinions: The role of

aspiration level on consumer response to critic consensus. Journal of Consumer Research, 25(1),

38-51.

Widaman, K. F., Helm, J. L., Castro-Schilo, L., Pluess, M., Stallings, M. C., & Belsky, J.

(2012). Distinguishing ordinal and disordinal interactions. Psychological Methods, 17(4), 615.

Yang, J., & Mai, E. S. (2010). Experiential goods with network externalities effects: An

empirical study of online rating system. Journal of Business Research, 63(9-10), 1050-1057.

Yelp. (2018). Retrieved from https://www.yelp.com/

34

Zhu, F., & Zhang, X. (2006). The influence of online consumer reviews on the demand

for experience goods: The case of video games. ICIS 2006 Proceedings, 25.

Zhang, X. X. M. (2006). Tapping into the pulse of the market: Essays on marketing

implications of information flows (Doctoral dissertation, Massachusetts Institute of Technology).

Zhang, Z., Zhang, Z., & Law, R. (2014). Positive and negative word of mouth about

restaurants: Exploring the asymmetric impact of the performance of attributes. Asia Pacific

Journal of Tourism Research, 19(2), 162-180.

35

APPENDIX A – SURVEY CONTENT EXAMPLE APPENDIX A1: REVIEW RATING DISPERSION

APPENDIX A2: ONLINE RESTAURANT REVIEWS IN THE YELP FORMAT

36

APPENDIX B – CRONBACH’S ALPHA APPENDIX B1: CRONBACH’S ALPHA – REVIEWER CONSENSUS (REVIEW

VARIANCE)

Case Processing Summary

N %

Cases Valid 199 100.0

Excludeda 0 .0

Total 199 100.0

a. Listwise deletion based on all variables in the procedure.

Reliability Statistics

Cronbach's Alpha

Cronbach's Alpha Based on

Standardized Items N of Items

.909 .911 3

Item Statistics

Mean Std. Deviation N

All reviewers rated the restaurant visits

similarly

4.57 1.942 199

I believe all the reviews indicate a consensus

about the quality of the restaurant visit

4.90 1.719 199

I believe all the reviews indicate unanimity of

opinion about the quality of the restaurant visit

4.64 1.787 199

37

Inter-Item Correlation Matrix

All reviewers rated the

restaurant visits

similarly

I believe all the reviews

indicate a consensus

about the quality of the

restaurant visit

I believe all the reviews

indicate unanimity of

opinion about the

quality of the restaurant

visit

All reviewers rated the restaurant visits

similarly

1.000 .765 .728

I believe all the reviews indicate a

consensus about the quality of the

restaurant visit

.765 1.000 .827

I believe all the reviews indicate

unanimity of opinion about the quality of

the restaurant visit

.728 .827 1.000

Item-Total Statistics

Scale Mean if

Item Deleted

Scale Variance

if Item Deleted

Corrected Item-

Total

Correlation

Squared

Multiple

Correlation

Cronbach's

Alpha if Item

Deleted

All reviewers rated the

restaurant visits similarly

9.54 11.229 .780 .614 .905

I believe all the reviews

indicate a consensus about

the quality of the restaurant

visit

9.21 12.013 .855 .741 .841

I believe all the reviews

indicate unanimity of

opinion about the quality of

the restaurant visit

9.47 11.836 .824 .706 .863

Scale Statistics

Mean Variance Std. Deviation N of Items

14.11 25.159 5.016 3

38

APPENDIX B2: CRONBACH’S ALPHA – REVIEW VALENCE

Case Processing Summary

N %

Cases Valid 199 100.0

Excludeda 0 .0

Total 199 100.0

a. Listwise deletion based on all variables in the procedure.

Reliability Statistics

Cronbach's Alpha

Cronbach's Alpha Based on

Standardized Items N of Items

.952 .952 2

Item Statistics

Mean Std. Deviation N

The reviewers' rating of the restaurant were (1) 3.85 2.350 199

The reviewers' rating of the restaurant were (2) 3.87 2.261 199

Inter-Item Correlation Matrix

The reviewers' rating of the

restaurant were (1)

The reviewers' rating of the

restaurant were (2)

The reviewers' rating of the restaurant were (1) 1.000 .909

The reviewers' rating of the restaurant were (2) .909 1.000

Item-Total Statistics

Scale Mean if

Item Deleted

Scale Variance

if Item Deleted

Corrected Item-

Total

Correlation

Squared

Multiple

Correlation

Cronbach's

Alpha if Item

Deleted

The reviewers' rating of the

restaurant were (1)

3.87 5.110 .909 .826 .

The reviewers' rating of the

restaurant were (2)

3.85 5.523 .909 .826 .

39

Scale Statistics

Mean Variance Std. Deviation N of Items

7.72 20.292 4.505 2

40

APPENDIX B3: CRONBACH’S ALPHA – PURCHASE INTENTION

Case Processing Summary

N %

Cases Valid 199 100.0

Excludeda 0 .0

Total 199 100.0

a. Listwise deletion based on all variables in the procedure.

Reliability Statistics

Cronbach's Alpha

Cronbach's Alpha Based on

Standardized Items N of Items

.947 .947 3

Item Statistics

Mean Std. Deviation N

I would visit this restaurant rather than any

other restaurants available

3.59 2.010 199

I am willing to recommend others to visit this

restaurant

3.60 1.969 199

I intend to visit this restaurant in the future 3.70 2.034 199

Inter-Item Correlation Matrix

I would visit this

restaurant rather than

any other restaurants

available

I am willing to

recommend others to

visit this restaurant

I intend to visit this

restaurant in the future

I would visit this restaurant rather than

any other restaurants available

1.000 .864 .867

I am willing to recommend others to visit

this restaurant

.864 1.000 .835

I intend to visit this restaurant in the

future

.867 .835 1.000

41

Item-Total Statistics

Scale Mean if

Item Deleted

Scale Variance

if Item Deleted

Corrected Item-

Total

Correlation

Squared

Multiple

Correlation

Cronbach's

Alpha if Item

Deleted

I would visit this restaurant

rather than any other

restaurants available

7.30 14.707 .904 .817 .910

I am willing to recommend

others to visit this

restaurant

7.30 15.270 .879 .777 .929

I intend to visit this

restaurant in the future

7.19 14.761 .882 .781 .927

Scale Statistics

Mean Variance Std. Deviation N of Items

10.89 32.681 5.717 3

42

APPENDIX C – FACTOR ANALYSIS APPENDIX C1: FACTOR ANALYSIS – REVIEWER CONSENSUS (REVIEW VARIANCE)

Descriptive Statistics

Mean Std. Deviation Analysis N

All reviewers rated the restaurant visits

similarly

4.57 1.942 199

I believe all the reviews indicate a consensus

about the quality of the restaurant visit

4.90 1.719 199

I believe all the reviews indicate unanimity of

opinion about the quality of the restaurant

visit

4.64 1.787 199

Correlation Matrix

All reviewers rated

the restaurant visits

similarly

I believe all the

reviews indicate a

consensus about

the quality of the

restaurant visit

I believe all the

reviews indicate

unanimity of

opinion about the

quality of the

restaurant visit

Correlation All reviewers rated the restaurant

visits similarly

1.000 .765 .728

I believe all the reviews indicate a

consensus about the quality of the

restaurant visit

.765 1.000 .827

I believe all the reviews indicate

unanimity of opinion about the

quality of the restaurant visit

.728 .827 1.000

KMO and Bartlett's Test

Kaiser-Meyer-Olkin Measure of Sampling Adequacy. .743

Bartlett's Test of Sphericity Approx. Chi-Square 412.908

df 3

Sig. .000

43

Anti-image Matrices

All reviewers

rated the

restaurant visits

similarly

I believe all the

reviews indicate

a consensus

about the quality

of the restaurant

visit

I believe all the

reviews indicate

unanimity of

opinion about the

quality of the

restaurant visit

Anti-image Covariance All reviewers rated the

restaurant visits similarly

.386 -.134 -.088

I believe all the reviews

indicate a consensus about

the quality of the restaurant

visit

-.134 .259 -.169

I believe all the reviews

indicate unanimity of opinion

about the quality of the

restaurant visit

-.088 -.169 .294

Anti-image Correlation All reviewers rated the

restaurant visits similarly

.818a -.423 -.262

I believe all the reviews

indicate a consensus about

the quality of the restaurant

visit

-.423 .696a -.613

I believe all the reviews

indicate unanimity of opinion

about the quality of the

restaurant visit

-.262 -.613 .732a

a. Measures of Sampling Adequacy(MSA)

Communalities

Initial Extraction

All reviewers rated the restaurant visits similarly 1.000 .809

I believe all the reviews indicate a consensus about the

quality of the restaurant visit

1.000 .882

I believe all the reviews indicate unanimity of opinion about

the quality of the restaurant visit

1.000 .856

Extraction Method: Principal Component Analysis.

44

Total Variance Explained

Component

Initial Eigenvalues Extraction Sums of Squared Loadings

Total % of Variance Cumulative % Total % of Variance Cumulative %

1 2.547 84.915 84.915 2.547 84.915 84.915

2 .284 9.476 94.391

3 .168 5.609 100.000

Extraction Method: Principal Component Analysis.

Component Matrixa

Component

1

All reviewers rated the restaurant visits similarly .899

I believe all the reviews indicate a consensus about the quality of the

restaurant visit

.939

I believe all the reviews indicate unanimity of opinion about the quality of

the restaurant visit

.925

Extraction Method: Principal Component Analysis.

a. 1 components extracted.

Rotated Component Matrixa

a. Only one component was extracted. The solution cannot be rotated.

45

APPENDIX C2: FACTOR ANALYSIS – REVIEW VALENCE

Descriptive Statistics

Mean Std. Deviation Analysis N

The reviewers' rating of the restaurant were

(1)

3.85 2.350 199

The reviewers' rating of the restaurant were

(2)

3.87 2.261 199

Correlation Matrix

The reviewers' rating of

the restaurant were (1)

The reviewers' rating of

the restaurant were (2)

Correlation The reviewers' rating of the restaurant

were (1)

1.000 .909

The reviewers' rating of the restaurant

were (2)

.909 1.000

KMO and Bartlett's Test

Kaiser-Meyer-Olkin Measure of Sampling Adequacy. .500

Bartlett's Test of Sphericity Approx. Chi-Square 344.084

df 1

Sig. .000

Anti-image Matrices

The reviewers' rating

of the restaurant

were (1)

The reviewers' rating

of the restaurant

were (2)

Anti-image Covariance The reviewers' rating of the

restaurant were (1)

.174 -.158

The reviewers' rating of the

restaurant were (2)

-.158 .174

Anti-image Correlation The reviewers' rating of the

restaurant were (1)

.500a -.909

The reviewers' rating of the

restaurant were (2)

-.909 .500a

a. Measures of Sampling Adequacy(MSA)

46

Communalities

Initial Extraction

The reviewers' rating of the restaurant were (1) 1.000 .955

The reviewers' rating of the restaurant were (2) 1.000 .955

Extraction Method: Principal Component Analysis.

Total Variance Explained

Component

Initial Eigenvalues Extraction Sums of Squared Loadings

Total % of Variance Cumulative % Total % of Variance Cumulative %

1 1.909 95.454 95.454 1.909 95.454 95.454

2 .091 4.546 100.000

Extraction Method: Principal Component Analysis.

Component Matrixa

Component

1

The reviewers' rating of the restaurant were (1) .977

The reviewers' rating of the restaurant were (2) .977

Extraction Method: Principal Component Analysis.

a. 1 components extracted.

Rotated Component Matrixa

a. Only one component was extracted. The solution cannot be rotated.

47

APPENDIX C3: FACTOR ANALYSIS – PURCHASE INTENTION

Descriptive Statistics

Mean Std. Deviation Analysis N

I would visit this restaurant rather than any

other restaurants available

3.59 2.010 199

I am willing to recommend others to visit this

restaurant

3.60 1.969 199

I intend to visit this restaurant in the future 3.70 2.034 199

Correlation Matrix

I would visit this

restaurant rather

than any other

restaurants

available

I am willing to

recommend others

to visit this

restaurant

I intend to visit this

restaurant in the

future

Correlation I would visit this restaurant rather

than any other restaurants

available

1.000 .864 .867

I am willing to recommend others

to visit this restaurant

.864 1.000 .835

I intend to visit this restaurant in

the future

.867 .835 1.000

KMO and Bartlett's Test

Kaiser-Meyer-Olkin Measure of Sampling Adequacy. .770

Bartlett's Test of Sphericity Approx. Chi-Square 567.176

df 3

Sig. .000

48

Anti-image Matrices

I would visit this

restaurant rather

than any other

restaurants

available

I am willing to

recommend

others to visit

this restaurant

I intend to visit

this restaurant in

the future

Anti-image Covariance I would visit this restaurant

rather than any other

restaurants available

.183 -.104 -.105

I am willing to recommend

others to visit this restaurant

-.104 .223 -.076

I intend to visit this restaurant

in the future

-.105 -.076 .219

Anti-image Correlation I would visit this restaurant

rather than any other

restaurants available

.736a -.512 -.525

I am willing to recommend

others to visit this restaurant

-.512 .792a -.341

I intend to visit this restaurant

in the future

-.525 -.341 .787a

a. Measures of Sampling Adequacy(MSA)

Communalities

Initial Extraction

I would visit this restaurant rather than any other restaurants

available

1.000 .918

I am willing to recommend others to visit this restaurant 1.000 .896

I intend to visit this restaurant in the future 1.000 .897

Extraction Method: Principal Component Analysis.

Total Variance Explained

Component

Initial Eigenvalues Extraction Sums of Squared Loadings

Total % of Variance Cumulative % Total % of Variance Cumulative %

1 2.711 90.362 90.362 2.711 90.362 90.362

2 .165 5.505 95.868

3 .124 4.132 100.000

Extraction Method: Principal Component Analysis.

49

Component Matrixa

Component

1

I would visit this restaurant rather than any other restaurants available .958

I am willing to recommend others to visit this restaurant .946

I intend to visit this restaurant in the future .947

Extraction Method: Principal Component Analysis.

a. 1 components extracted.

Rotated Component Matrixa

a. Only one component was extracted. The solution cannot be rotated.

50

APPENDIX D – MANIPULATION CHECKS (INDEPENDENT SAMPLES t-

TESTS) APPENDIX D1: INDEPENDENT SAMPLES t-TEST – REVIEWER CONSENSUS

Group Statistics

Reviewer consensus N Mean Std. Deviation Std. Error Mean

Purchase intention Low consensus (High

variance)

86 3.2364 1.37281 .14803

High consensus (Low

variance)

113 3.9322 2.18589 .20563

Independent Samples Test

Levene's Test for

Equality of

Variances t-test for Equality of Means

F Sig. t df

Sig. (2-

tailed)

Mean

Difference

Std. Error

Difference

95% Confidence

Interval of the

Difference

Lower Upper

Purchase

intention

Equal

variances

assumed

53.975 .000 -

2.588

197 .010 -.69572 .26885 -

1.22590

-.16553

Equal

variances not

assumed

-

2.746

190.687 .007 -.69572 .25337 -

1.19549

-.19594

51

APPENDIX D2: INDEPENDENT SAMPLES t-TEST – REVIEW VALENCE

Group Statistics

Valence N Mean Std. Deviation Std. Error Mean

Purchase intention Positive 97 5.1546 1.25191 .12711

Negative 102 2.1830 1.13221 .11211

Independent Samples Test

Levene's Test for Equality of

Variances t-test for Equality of Means

F Sig. t df

Sig. (2-

tailed) Mean

Difference Std. Error Difference

95% Confidence Interval of the

Difference

Lower Upper

Purchase intention

Equal variances assumed

.872 .351 17.578 197 .000 2.97163 .16906 2.63824 3.30503

Equal variances not assumed

17.533 192.643 .000 2.97163 .16949 2.63735 3.30592

52

APPENDIX E – DIRECT EFFECTS: REVIEWER CONSENSUS, VALENCE

AND PURCHASE INTENTION APPENDIX E1: TWO-WAY ANOVA REGRESSION RESULTS

Between-Subjects Factors

Value Label N

Reviewer consensus 1.00 Low consensus (High

variance)

86

2.00 High consensus (Low

variance)

113

Valence 1.00 Positive 97

2.00 Negative 102

Descriptive Statistics

Dependent Variable: Purchase intention

Reviewer consensus Valence Mean Std. Deviation N

Low consensus (High variance) Positive 4.2255 1.12433 34

Negative 2.5897 1.11558 52

Total 3.2364 1.37281 86

High consensus (Low variance) Positive 5.6561 1.01241 63

Negative 1.7600 .99441 50

Total 3.9322 2.18589 113

Total Positive 5.1546 1.25191 97

Negative 2.1830 1.13221 102

Total 3.6315 1.90557 199

Levene's Test of Equality of Error Variancesa

Dependent Variable: Purchase intention

F df1 df2 Sig.

.737 3 195 .531

Tests the null hypothesis that the error variance of the dependent variable is equal across groups.

a. Design: Intercept + ReviewerConsensus + Valence + ReviewerConsensus * Valence

53

Tests of Between-Subjects Effects

Dependent Variable: Purchase intention

Source

Type III Sum

of Squares df Mean Square F Sig.

Partial Eta

Squared

Corrected Model 501.788a 3 167.263 150.175 .000 .698

Intercept 2396.369 1 2396.369 2151.559 .000 .917

ReviewerConsensus 4.272 1 4.272 3.835 .052 .019

Valence 362.077 1 362.077 325.088 .000 .625

ReviewerConsensus *

Valence

60.452 1 60.452 54.276 .000 .218

Error 217.188 195 1.114

Total 3343.333 199

Corrected Total 718.976 198

a. R Squared = .698 (Adjusted R Squared = .693)

Custom Hypothesis Tests Index

1 Contrast Coefficients (L' Matrix) Simple Contrast (reference

category = 1) for Reviewer

consensus

Transformation Coefficients (M Matrix) Identity Matrix

Contrast Results (K Matrix) Zero Matrix

2 Contrast Coefficients (L' Matrix) Simple Contrast (reference

category = 1) for Valence

Transformation Coefficients (M Matrix) Identity Matrix

Contrast Results (K Matrix) Zero Matrix

Contrast Results (K Matrix)

Reviewer consensus Simple Contrasta

Dependent Variable

Purchase intention

Level 2 vs. Level 1 Contrast Estimate .300

Hypothesized Value 0

Difference (Estimate - Hypothesized) .300

Std. Error .153

Sig. .052

95% Confidence Interval for

Difference

Lower Bound -.002

Upper Bound .603

a. Reference category = 1

54

Test Results

Dependent Variable: Purchase intention

Source Sum of Squares df Mean Square F Sig.

Partial Eta

Squared

Contrast 4.272 1 4.272 3.835 .052 .019

Error 217.188 195 1.114

Contrast Results (K Matrix)

Valence Simple Contrasta

Dependent Variable

Purchase intention

Level 2 vs. Level 1 Contrast Estimate -2.766

Hypothesized Value 0

Difference (Estimate - Hypothesized) -2.766

Std. Error .153

Sig. .000

95% Confidence Interval for

Difference

Lower Bound -3.068

Upper Bound -2.463

a. Reference category = 1

Test Results

Dependent Variable: Purchase intention

Source Sum of Squares df Mean Square F Sig.

Partial Eta

Squared

Contrast 362.077 1 362.077 325.088 .000 .625

Error 217.188 195 1.114

1. Grand Mean

Dependent Variable: Purchase intention

Mean Std. Error

95% Confidence Interval

Lower Bound Upper Bound

3.558 .077 3.407 3.709

55

APPENDIX E2: UNIVARIATE TESTS – REVIEWER CONSENSUS

Estimates

Dependent Variable: Purchase intention

Reviewer consensus Mean Std. Error

95% Confidence Interval

Lower Bound Upper Bound

Low consensus (High variance) 3.408 .116 3.178 3.637

High consensus (Low variance) 3.708 .100 3.511 3.905

Pairwise Comparisons

Dependent Variable: Purchase intention

(I) Reviewer consensus

(J) Reviewer

consensus

Mean

Difference (I-

J)

Std.

Error Sig.a

95% Confidence Interval for

Differencea

Lower Bound Upper Bound

Low consensus (High

variance)

High consensus (Low

variance)

-.300 .153 .052 -.603 .002

High consensus (Low

variance)

Low consensus (High

variance)

.300 .153 .052 -.002 .603

Based on estimated marginal means

a. Adjustment for multiple comparisons: Bonferroni.

Univariate Tests

Dependent Variable: Purchase intention

Sum of Squares df Mean Square F Sig.

Partial Eta

Squared

Contrast 4.272 1 4.272 3.835 .052 .019

Error 217.188 195 1.114

The F tests the effect of Reviewer consensus. This test is based on the linearly independent pairwise

comparisons among the estimated marginal means.

56

APPENDIX E3: UNIVARIATE TESTS – REVIEW VALENCE

Estimates

Dependent Variable: Purchase intention

Valence Mean Std. Error

95% Confidence Interval

Lower Bound Upper Bound

Positive 4.941 .112 4.719 5.162

Negative 2.175 .105 1.969 2.381

Pairwise Comparisons

Dependent Variable: Purchase intention

(I) Valence (J) Valence

Mean Difference

(I-J) Std. Error Sig.b

95% Confidence Interval for

Differenceb

Lower Bound Upper Bound

Positive Negative 2.766* .153 .000 2.463 3.068

Negative Positive -2.766* .153 .000 -3.068 -2.463

Based on estimated marginal means

*. The mean difference is significant at the .05 level.

b. Adjustment for multiple comparisons: Bonferroni.

Univariate Tests

Dependent Variable: Purchase intention

Sum of Squares df Mean Square F Sig.

Partial Eta

Squared

Contrast 362.077 1 362.077 325.088 .000 .625

Error 217.188 195 1.114

The F tests the effect of Valence. This test is based on the linearly independent pairwise comparisons among the

estimated marginal means.

57

APPENDIX F – INTERACTION TERM AND SIMPLE MAIN EFFECTS

Estimates

Dependent Variable: Purchase intention

Reviewer consensus Valence Mean Std. Error

95% Confidence Interval

Lower Bound Upper Bound

Low consensus (High variance) Positive 4.225 .181 3.869 4.582

Negative 2.590 .146 2.301 2.878

High consensus (Low variance) Positive 5.656 .133 5.394 5.918

Negative 1.760 .149 1.466 2.054

Pairwise Comparisons

Dependent Variable: Purchase intention

Valence

(I) Reviewer

consensus

(J) Reviewer

consensus

Mean

Difference

(I-J)

Std.

Error Sig.b

95% Confidence Interval

for Differenceb

Lower

Bound

Upper

Bound

Positive Low consensus

(High variance)

High consensus

(Low variance)

-1.431* .225 .000 -1.874 -.988

High consensus

(Low variance)

Low consensus

(High variance)

1.431* .225 .000 .988 1.874

Negative Low consensus

(High variance)

High consensus

(Low variance)

.830* .209 .000 .417 1.242

High consensus

(Low variance)

Low consensus

(High variance)

-.830* .209 .000 -1.242 -.417

Based on estimated marginal means

*. The mean difference is significant at the .05 level.

b. Adjustment for multiple comparisons: Bonferroni.

Univariate Tests

Dependent Variable: Purchase intention

Valence Sum of Squares df Mean Square F Sig.

Partial Eta

Squared

Positive Contrast 45.194 1 45.194 40.577 .000 .172

Error 217.188 195 1.114

Negative Contrast 17.549 1 17.549 15.757 .000 .075

Error 217.188 195 1.114

Each F tests the simple effects of Reviewer consensus within each level combination of the other effects shown.

These tests are based on the linearly independent pairwise comparisons among the estimated marginal means.

58

Pairwise Comparisons

Dependent Variable: Purchase intention

Reviewer consensus

(I)

Valence

(J)

Valence

Mean

Difference (I-

J)

Std.

Error Sig.b

95% Confidence Interval for

Differenceb

Lower Bound Upper Bound

Low consensus (High

variance)

Positive Negative 1.636* .233 .000 1.177 2.095

Negative Positive -1.636* .233 .000 -2.095 -1.177

High consensus (Low

variance)

Positive Negative 3.896* .200 .000 3.502 4.290

Negative Positive -3.896* .200 .000 -4.290 -3.502

Based on estimated marginal means

*. The mean difference is significant at the .05 level.

b. Adjustment for multiple comparisons: Bonferroni.

Univariate Tests

Dependent Variable: Purchase intention

Reviewer consensus

Sum of

Squares df

Mean

Square F Sig.

Partial Eta

Squared

Low consensus (High

variance)

Contrast 55.007 1 55.007 49.387 .000 .202

Error 217.188 195 1.114

High consensus (Low

variance)

Contrast 423.145 1 423.145 379.917 .000 .661

Error 217.188 195 1.114

Each F tests the simple effects of Valence within each level combination of the other effects shown. These tests are

based on the linearly independent pairwise comparisons among the estimated marginal means.

59

APPENDIX G – FULL MODEL (INCLUSION OF CONTROL VARIABLES)

Between-Subjects Factors

Value Label N

Reviewer consensus 1.00 Low consensus (High

variance)

86

2.00 High consensus (Low

variance)

113

Valence 1.00 Positive 97

2.00 Negative 102

Descriptive Statistics

Dependent Variable: Purchase intention

Reviewer consensus Valence Mean Std. Deviation N

Low consensus (High variance) Positive 4.2255 1.12433 34

Negative 2.5897 1.11558 52

Total 3.2364 1.37281 86

High consensus (Low variance) Positive 5.6561 1.01241 63

Negative 1.7600 .99441 50

Total 3.9322 2.18589 113

Total Positive 5.1546 1.25191 97

Negative 2.1830 1.13221 102

Total 3.6315 1.90557 199

Levene's Test of Equality of Error Variancesa

Dependent Variable: Purchase intention

F df1 df2 Sig.

.323 3 195 .809

Tests the null hypothesis that the error variance of the dependent variable is equal across groups.

a. Design: Intercept + Age + Gender + Education + ReviewCheck + ReviewerConsensus + Valence +

ReviewerConsensus * Valence

60

Tests of Between-Subjects Effects

Dependent Variable: Purchase intention

Source

Type III Sum of

Squares df Mean Square F Sig.

Partial Eta

Squared

Corrected Model 509.888a 7 72.841 66.540 .000 .709

Intercept 44.314 1 44.314 40.481 .000 .175

Age 1.747 1 1.747 1.596 .208 .008

Gender 1.635 1 1.635 1.493 .223 .008

Education 1.690 1 1.690 1.544 .216 .008

ReviewCheck 2.824 1 2.824 2.580 .110 .013

ReviewerConsensus 3.077 1 3.077 2.811 .095 .015

Valence 366.330 1 366.330 334.639 .000 .637

ReviewerConsensus *

Valence

63.154 1 63.154 57.690 .000 .232

Error 209.088 191 1.095

Total 3343.333 199

Corrected Total 718.976 198

a. R Squared = .709 (Adjusted R Squared = .699)

Custom Hypothesis Tests Index

1 Contrast Coefficients (L' Matrix) Simple Contrast (reference

category = 1) for Reviewer

consensus

Transformation Coefficients (M Matrix) Identity Matrix

Contrast Results (K Matrix) Zero Matrix

2 Contrast Coefficients (L' Matrix) Simple Contrast (reference

category = 1) for Valence

Transformation Coefficients (M Matrix) Identity Matrix

Contrast Results (K Matrix) Zero Matrix

61

Contrast Results (K Matrix)

Reviewer consensus Simple Contrasta

Dependent Variable

Purchase intention

Level 2 vs. Level 1 Contrast Estimate .259

Hypothesized Value 0

Difference (Estimate - Hypothesized) .259

Std. Error .154

Sig. .095

95% Confidence Interval for

Difference

Lower Bound -.046

Upper Bound .563

a. Reference category = 1

Test Results

Dependent Variable: Purchase intention

Source Sum of Squares df Mean Square F Sig.

Partial Eta

Squared

Contrast 3.077 1 3.077 2.811 .095 .015

Error 209.088 191 1.095

Contrast Results (K Matrix)

Valence Simple Contrasta

Dependent Variable

Purchase intention

Level 2 vs. Level 1 Contrast Estimate -2.787

Hypothesized Value 0

Difference (Estimate - Hypothesized) -2.787

Std. Error .152

Sig. .000

95% Confidence Interval for

Difference

Lower Bound -3.088

Upper Bound -2.487

a. Reference category = 1

62

Test Results

Dependent Variable: Purchase intention

Source Sum of Squares df Mean Square F Sig.

Partial Eta

Squared

Contrast 366.330 1 366.330 334.639 .000 .637

Error 209.088 191 1.095

1. Grand Mean

Dependent Variable: Purchase intention

Mean Std. Error

95% Confidence Interval

Lower Bound Upper Bound

3.559a .076 3.409 3.709

a. Covariates appearing in the model are evaluated at the following values: Age = 23.63, Gender = 1.49, Education

= 3.47, Review Check = .8643.

Estimates

Dependent Variable: Purchase intention

Reviewer consensus Mean Std. Error

95% Confidence Interval

Lower Bound Upper Bound

Low consensus (High variance) 3.429a .116 3.200 3.658

High consensus (Low variance) 3.688a .100 3.491 3.885

a. Covariates appearing in the model are evaluated at the following values: Age = 23.63, Gender = 1.49, Education

= 3.47, Review Check = .8643.

Pairwise Comparisons

Dependent Variable: Purchase intention

(I) Reviewer consensus

(J) Reviewer

consensus

Mean

Difference (I-

J)

Std.

Error Sig.a

95% Confidence Interval for

Differencea

Lower Bound Upper Bound

Low consensus (High

variance)

High consensus (Low

variance)

-.259 .154 .095 -.563 .046

High consensus (Low

variance)

Low consensus (High

variance)

.259 .154 .095 -.046 .563

Based on estimated marginal means

a. Adjustment for multiple comparisons: Bonferroni.

63

Univariate Tests

Dependent Variable: Purchase intention

Sum of Squares df Mean Square F Sig.

Partial Eta

Squared

Contrast 3.077 1 3.077 2.811 .095 .015

Error 209.088 191 1.095

The F tests the effect of Reviewer consensus. This test is based on the linearly independent pairwise comparisons

among the estimated marginal means.

Estimates

Dependent Variable: Purchase intention

Valence Mean Std. Error

95% Confidence Interval

Lower Bound Upper Bound

Positive 4.952a .111 4.732 5.172

Negative 2.165a .104 1.960 2.369

a. Covariates appearing in the model are evaluated at the following values: Age = 23.63, Gender = 1.49, Education

= 3.47, Review Check = .8643.

Pairwise Comparisons

Dependent Variable: Purchase intention

(I) Valence (J) Valence

Mean Difference

(I-J) Std. Error Sig.b

95% Confidence Interval for

Differenceb

Lower Bound Upper Bound

Positive Negative 2.787* .152 .000 2.487 3.088

Negative Positive -2.787* .152 .000 -3.088 -2.487

Based on estimated marginal means

*. The mean difference is significant at the .05 level.

b. Adjustment for multiple comparisons: Bonferroni.

Univariate Tests

Dependent Variable: Purchase intention

Sum of Squares df Mean Square F Sig.

Partial Eta

Squared

Contrast 366.330 1 366.330 334.639 .000 .637

Error 209.088 191 1.095

The F tests the effect of Valence. This test is based on the linearly independent pairwise comparisons among the

estimated marginal means.

64

Estimates

Dependent Variable: Purchase intention

Reviewer consensus Valence Mean Std. Error

95% Confidence Interval

Lower Bound Upper Bound

Low consensus (High

variance)

Positive 4.242a .180 3.887 4.597

Negative 2.616a .146 2.328 2.904

High consensus (Low

variance)

Positive 5.662a .132 5.402 5.922

Negative 1.714a .150 1.419 2.009

a. Covariates appearing in the model are evaluated at the following values: Age = 23.63, Gender =

1.49, Education = 3.47, Review Check = .8643.

Pairwise Comparisons

Dependent Variable: Purchase intention

Valence

(I) Reviewer

consensus

(J) Reviewer

consensus

Mean

Difference

(I-J)

Std.

Error Sig.b

95% Confidence Interval

for Differenceb

Lower

Bound

Upper

Bound

Positive Low consensus

(High variance)

High consensus

(Low variance)

-1.420* .223 .000 -1.860 -.979

High consensus

(Low variance)

Low consensus

(High variance)

1.420* .223 .000 .979 1.860

Negative Low consensus

(High variance)

High consensus

(Low variance)

.902* .211 .000 .486 1.318

High consensus

(Low variance)

Low consensus

(High variance)

-.902* .211 .000 -1.318 -.486

Based on estimated marginal means

*. The mean difference is significant at the .05 level.

b. Adjustment for multiple comparisons: Bonferroni.

Univariate Tests

Dependent Variable: Purchase intention

Valence Sum of Squares df Mean Square F Sig.

Partial Eta

Squared

Positive Contrast 44.218 1 44.218 40.393 .000 .175

Error 209.088 191 1.095

Negative Contrast 20.022 1 20.022 18.290 .000 .087

Error 209.088 191 1.095

Each F tests the simple effects of Reviewer consensus within each level combination of the other effects shown.

These tests are based on the linearly independent pairwise comparisons among the estimated marginal means.

65

Pairwise Comparisons

Dependent Variable: Purchase intention

Reviewer consensus

(I)

Valence

(J)

Valence

Mean

Difference (I-

J)

Std.

Error Sig.b

95% Confidence Interval for

Differenceb

Lower Bound Upper Bound

Low consensus (High

variance)

Positive Negative 1.626* .231 .000 1.171 2.082

Negative Positive -1.626* .231 .000 -2.082 -1.171

High consensus (Low

variance)

Positive Negative 3.948* .199 .000 3.555 4.341

Negative Positive -3.948* .199 .000 -4.341 -3.555

Based on estimated marginal means

*. The mean difference is significant at the .05 level.

b. Adjustment for multiple comparisons: Bonferroni.

Univariate Tests

Dependent Variable: Purchase intention

Reviewer consensus

Sum of

Squares df

Mean

Square F Sig.

Partial Eta

Squared

Low consensus (High

variance)

Contrast 54.242 1 54.242 49.549 .000 .206

Error 209.088 191 1.095

High consensus (Low

variance)

Contrast 429.245 1 429.245 392.112 .000 .672

Error 209.088 191 1.095

Each F tests the simple effects of Valence within each level combination of the other effects shown. These tests are

based on the linearly independent pairwise comparisons among the estimated marginal means.


Recommended