THE RELATION BETWEEN INTENSITY OF FLUORESCENCE AND CONCENTRATION IN SOLID SOLUTIONS BY ERNESTMERRITT Solid luminescent materials are usually compounds in which a small amount of some active material is intimately associated with a relatively large amount of an inert substance which acts as a solvent or flux. Such compounds are prepared artificially by evaporating to dryness a mixed solution of the two components, or by mixing the components in powder form and then subjecting the mixture to suitable heat treatment. While we have no means of knowing the form in which the active material exists in these preparations it is generally thought that luminescent materials are to be regarded as solid solutions rather than as chemical compounds. The variation of brightness with concentration has been studied quantitatively in only a few cases;but it is known that luminescence of considerable intensity may be produced by very minute traces of a suitable active material and that if the concentration is increased be- yond a few per cent the brightness is greatly reduced. Maximum bright- ness is often reached with one part of active material to ten thousand of solvent and the optimum concentration is rarely as great as one part in one hundred. Broadly speaking the behavior of fluorescent solutions is similar to that of solid luminescent preparations. Fluorescein, for example, which is brilliantly fluorescent in dilute solutions, is almost completely inactive when the solution is concentrated. The existence of an optimum concentration has been explained by Brtininghausl as the result of absorption. It is assumed that the active material in the surface layers has for some reason lost its ability to radiate, but retains its power of absorbing the fluorescent light that comes from the interior of the mass. Increase in concentration causes an increase in the fluorescence excited in the interior, presumably in proportion to the number of molecules of the active material; but it also brings about increased absorption of this fluorescent light by the I BrUninghaus, L., Comptes Rendus de 'Acad. des Sciences., 149, p. 1375; 1909. 613
Transcript
THE RELATION BETWEEN INTENSITY OF FLUORESCENCEAND CONCENTRATION IN SOLID
SOLUTIONS
BY ERNEST MERRITT
Solid luminescent materials are usually compounds in which a smallamount of some active material is intimately associated with a relativelylarge amount of an inert substance which acts as a solvent or flux. Suchcompounds are prepared artificially by evaporating to dryness a mixedsolution of the two components, or by mixing the components in powderform and then subjecting the mixture to suitable heat treatment. Whilewe have no means of knowing the form in which the active materialexists in these preparations it is generally thought that luminescentmaterials are to be regarded as solid solutions rather than as chemicalcompounds.
The variation of brightness with concentration has been studiedquantitatively in only a few cases;but it is known that luminescence ofconsiderable intensity may be produced by very minute traces of asuitable active material and that if the concentration is increased be-yond a few per cent the brightness is greatly reduced. Maximum bright-ness is often reached with one part of active material to ten thousand ofsolvent and the optimum concentration is rarely as great as one partin one hundred.
Broadly speaking the behavior of fluorescent solutions is similar tothat of solid luminescent preparations. Fluorescein, for example, whichis brilliantly fluorescent in dilute solutions, is almost completely inactivewhen the solution is concentrated.
The existence of an optimum concentration has been explained byBrtininghausl as the result of absorption. It is assumed that the activematerial in the surface layers has for some reason lost its ability toradiate, but retains its power of absorbing the fluorescent light thatcomes from the interior of the mass. Increase in concentration causesan increase in the fluorescence excited in the interior, presumably inproportion to the number of molecules of the active material; but italso brings about increased absorption of this fluorescent light by the
I BrUninghaus, L., Comptes Rendus de 'Acad. des Sciences., 149, p. 1375; 1909.
613
[J.O.S.A. & R.S.I., 12
surface layer. The intensity of the light that escapes and is observedis therefore given by an equation of the form
I=Cxe-kx (1)
where x is the concentration of the active material.BrUninghaus finds that this equation represents with considerable
exactness measurements made on the cathodo-luminescence of man-ganese in calcium phosphate.
Doubt is thrown on the correctness of the BrUninghaus theory bythe fact that the hypothesis on which it is based, which is certainly nottrue in the case of fluorescent liquids, has received no experimentalverification in the case of solids. The equation developed by BrUning-haus fails also to represent the results of the more recent experimentalwork.
Perrin2 has suggested two alternative reasons for the decrease inluminescence at higher concentrations:
(1) The exciting light is in the form of quanta of small cross section,and if two active molecules are so close together that they are struck bythe same quant, the energy is divided between the two and is less likelyto cause excitation; or (2) when two active molecules are sufficientlyclose together, their fields overlap and they are coupled in such a wayas to diminish their power of responding to excitation.
If the first explanation suggested by Perrin is correct we should expectthe optimum concentration to depend primarily upon the cross-sectionof the light quant. It would appear likely, therefore, that the optimumconcentration would depend upon the wave length of the exciting lightor upon the nature of the solvent. No experimental evidence on thesepoints is available. Several-observers have pointed out, however, thatthe optimum is reached at smaller concentration when light is the excit-ing agent than when the substance is excited by cathode rays. If weaccept Perrin's first suggestion it seems clear therefore that the cross-section of a light quant must be greater than the effective cross-sectionof the electrons in the cathode ray. It appears to me not unlikely that asatisfactory theory based upon the assumption of light quanta of defi-nite cross-section could be developed. Yet the difficulties and uncer-tainties are considerable, and it seems preferable to attempt first tomake Perrin's second suggestion the basis of a quantitative theory.
2 Perrin, J., Ann. de Phys., 11, p. 5; 1919.
614 ERNEST MERRITT
FLUORESCENCE AND CONCENTRATION
In the case of liquids the relation between fluorescence and con-centration has been investigated by F. Perrin3 and by Wawilow,4 eachof whom based his theoretical discussion upon the general assumptionthat fluorescing power is destroyed when two active molecules areclose together. For a thin layer of the liquid and large values of theconcentration both Perrin and Wawilow find that the intensity offluorescence is given by an expression of the same form as that proposedby Briininghaus for solids, and this conclusion is confirmed by theexperimental results. But for small concentrations there is completelack of agreement, both as to the form of the theoretical expressionfor the fluorescence and as to the results of experiment. Both Perrinand Wawilow assume that diffusion of the active material during theperiod between excitation and reemission is an important factor; inWawilow's discussion it is the essential factor. In a solid it would seemthat the displacement resulting from diffusion, in the extremely shorttime during which the molecule remains in the excited state, would beso small as to be negligible. In the discussion that follows I haveassumed that this is true.
If the optimum concentration is as small as one molecule of activematerial to 1000 molecules of solvent-and maximum brightness hasfrequently been found for still smaller concentrations-we must con-clude that on the average each active molecule is separated from itsnearest neighbor by about ten molecules of the solvent. It is hard tobelieve that under such circumstances the two molecules could influenceone another to such an extent as to interfere seriously with their excita-tion. But if the active molecules are distributed at random there willbe some whose distance apart is much less than the average distance.And it is clear that the number of molecules that are separated by agiven small distance from their nearest neighbor will increase both abso-lutely and relatively as the concentration is increased.
To put the Perrin suggestion into quantitative form let us assumetherefore that if two active molecules are at a distance apart that isless than some distance p their luminescence is either completely de-stroyed or greatly reduced. If we direct our attention to some one mole-cule A, the probability that another molecule B will not lie within thesphere of radius p is (V-v)/V where V is the total volume and v thethe volume of the sphere of radius p The probability that all of the
I Perrin, F., Comptes Rendus de F'Acad. des Sciences, 178, p. 1978; 1924.4 Wawilow, S. J., Zsch. fur Physik, 31, p. 750; 1925.
June, 1926] 615
[J.O.S.A. & R.S.I., 12
other molecules will lie outside v is (1 -v/V)7 where n is the total num-
ber of active molecules. The number of active molecules that are sofar apart as to be free to radiate is therefore n(1 -v/V)n. If subjectedto some exciting agency each of these undisturbed molecules will radiate
and, neglecting absorption, the intensity of luminescence will be
I = Fn(1-v/V)n
It is convenient to take V = 1 cc and = the number of active moleculesper cc. If this change is made
I= Fu(1 -v)n = Fnern (2)
wheream -loge (1-V)
With a suitable change in r and F the concentration may be expressedin any convenient form.
It will be noticed that this expression for I has the same form as thatproposed by BrUninghaus.
The expression requires modification, however, because of absorption.The exciting light suffers absorption, so that excitation is less intense atpoints in the interior than at the surface; and the emitted light is inpart absorbed on its way out. In each case the absorption is partly duetd the solvent and partly to the active material. The latter part of theabsorption may be assumed to increase in proportion to the concentra-tion. We must therefore make use of two absorption coefficients, a+bnfor the exciting light and p+qn for the emitted light.
In a layer of thickness dy and unit area at a depth y below the surfacethere are n(1-v)ndy active molecules free to radiate and these aresubjected to exciting light of intensity Ioe(a+p")Y. If the fluorescence is
proportional to the intensity of the exciting light--and such propor-tionality is confirmed by experiment in all cases where tests have beenmade-the light emitted by the layer dy is Fn(1 -V)ne-(a +')Ydy, of whichthe fraction e-(p+q")Y reaches the surface.
The intensity of the light issuing from the surface is therefore
I = a FIoiz(- v)ne-(a+n)ye-(p+qn)ydy.
U U=Flo -(I1-v~ F ean(3)
a+fln a+#n
where
r= -log (1-v)
ERNEST MERRITT616
,B=b+q
FLUORESCENCE AND CONCENTRATION
It is assumed that the specimen is so thick that the exciting lightis completely absorbed.
Since the concentration is usually given as the ratio of n to N, whereN is the number of solvent molecules per cc, and since the form of thecurve depends only on the ratio of a to , it is convenient to write theequation in the form
xI=K e-kx (4)
c+xwhere
x=n/N k=rN=-N log (1-v), c= a/3
Equation (4) may be shown to be consistent with all of the peculi-arities in the relation between I and it to which different observershave called attention. For example:
1. It has been pointed out by Urbain5 that when the luminescencespectrum consists of several bands the optimum concentration is ingeneral different for each. Since the bands occur in different parts ofthe spectrum, and since in general each band has its own region of exci-tation, the absorbing power of the mass, both for the exciting light andfor the emitted light, will vary from band to band. In consequence theconstant c will have different values and the concentration for maxi-mum I will change.
2. If k is small the exponential term in equation (4) will remain nearlyequal to unity until relatively large values of x are reached and forsmall concentrations the form of the curve will depend chiefly on thevalue of c. For c small the intensity will therefore rise rapidly to a largevalue and will then remain nearly independent of x until the exponen-tial factor becomes of importance. Several cases of this kind are onrecord.
3. Kowalsky and Garnier6 have found that for a given sub-stance the optimum concentration is smaller for light excitation thanfor excitation by cathode rays. Samarium in CaS, for example, gavemaximum brightness with ultraviolet excitation when the concen-tration was one molecule of samarium to 3000 molecules of Ca. Thesame phosphors with cathode ray excitation showed maximum bright-ness for the preparations containing one molecule of samarium to 400of calcium. This is doubtless the result of the fact that the cathode
5 Urbain, G., Comptes Rendus de 'Acad. des Sciences, 147, p. 1472; 1908.6 Kowalsky, J., and Garnier, G., Comptes Rendus de 'Acad. des. Sciences, 145, p. 391;
1907.
617June, 1926]
[J.O.S.A. & R.S.I., 12
rays penetrate only a short distance and that their absorption is duealmost entirely to collisions with the solvent molecules. For cathodo-luminescence the constant c is therefore large. On the other hand thesolvent is relatively transparent to light. For photo-luminescence c istherefore likely to be small and I reaches its maximum for small valuesof x. It will be noticed that when c is large equation (4) becomes prac-tically identical with the expression proposed by BrUninghaus.
An excellent opportunity for a quantitative test of equation (4) isafforded by the work of Nichols and Slattery7 who have recently de-termined the intensity of fluorescence as a function of concentration in
TABLE 1
Phosphor K c k s
Uranyl fluorid in sodium fluorid 170 .000005 1 .30 3.1Uranyl fluorid in calcium fluorid 202 .00025 .91 2.8Uranyl phosphate in sodium phosphate 165 .0008 .25 1.8
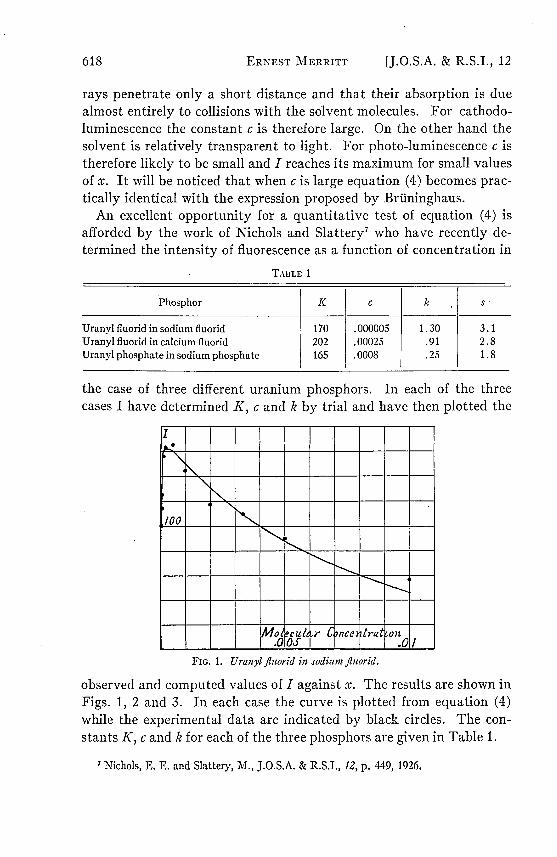
the case of three different uranium phosphors. In each of the threecases I have determined K, c and k by trial and have then plotted the
10 ___
fr
Mo czd r ice tra on
FIc. 1. Uranyl iluorid in sodium fluorid.
observed and computed values of I against x. The results are shown inFigs. 1, 2 and 3. In each case the curve is plotted from equation (4)while the experimental data are indicated by black circles. The con-stants K, c and k for each of the three phosphors are given in Table 1.
I Nichols, E. E. and Slattery, M., J.O.S.A. & R.S.I., 12, p. 449, 1926.
618 ERNEST MIERRITT
FLUORESCENCE AND CONCENTRATION
In the case of uranyl fluorid in sodium fluorid (Fig. 1) the optimumconcentration, about .0002, is smaller than for either of the otherphosphors studied. For concentrations lying between .00001 and .01the agreement between the observed and computed values of I is as closeas could be expected, since the location of the observed points indicatesthat the experimental errors are of the order of 5 per cent. For con-centrations less than 10-5 the agreement is less satisfactory. Thus forn = 10-6 the observed value of I is 100, while the computed value is 29.For n = 10-v the two values are 39 and 4 respectively.
In the curve for uranyl fluorid in calcium fluorid (Fig. 2) the com-puted and observed values of I do not in any case differ by more than
06
00
IMol cu/ Co yen rat n
FIG. 2. Uranyl fluorid in calcium florid. For Curve B the horizontal scale isindicated at the top.
the experimental errors. In the case of this phosphor the concentrationwas varied from .00012 to .0133. In curve B the data for small con-centrations have been plotted to a larger scale in order to show the formof the curve in this region more clearly.
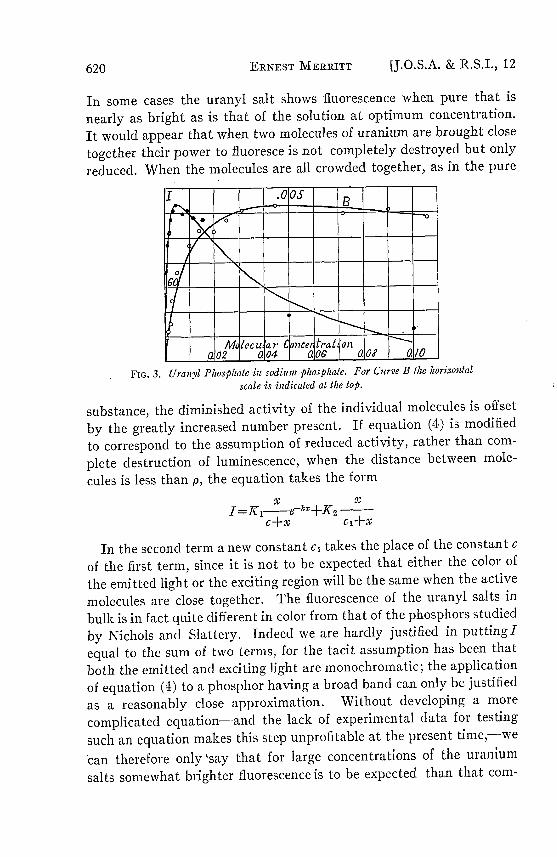
Fig. 3 shows the computed curve and the observational data in thecase of uranyl phosphate in sodium phosphate. Here also the data forsmall concentrations have been replotted in Curve B to a larger scale.
In view of the great difficulty of preparing a suitable series of phos-phors, which arises both from the difficulty of obtaining pure materialsand from the fact that the heat treatment must be identical for thedifferent mixtures, the agreement between the computed and observedcurves seems in all three cases as satisfactory as could be expected.
The phosphors investigated by Nichols and Slattery are unusual inthe fact that the active material is one which is luminescent when pure.
June, 1926] 619
In some cases the uranyl salt shows fluorescence when pure that is
nearly as bright as is that of the solution at optimum concentration.
It would appear that when two molecules of uranium are brought close
together their power to fluoresce is not completely destroyed but only
reduced. When the molecules are all crowded together, as in the pure
Al0 lecu Far Cacet trat on0.2 0.04 AO Oe F_0.10
FIG. 3. Uranyl Phosphate in sodium phosphate. For Curve B the horizontal
scale is indicated at the top.
substance, the diminished activity of the individual molecules is offset
by the greatly increased number present. If equation (4) is modified
to correspond to the assumption of reduced activity, rather than com-
plete destruction of luminescence, when the distance between mole-
cules is less than p, the equation takes the form
x xI=Ki-e-kx+K2
C+X c1+X
In the second term a new constant c, takes the place of the constant c
of the first term, since it is not to be expected that either the color of
the emitted light or the exciting region will be the same when the active
molecules are close together. The fluorescence of the uranyl salts in
bulk is in fact quite different in color from that of the phosphors studied
by Nichols and Slattery. Indeed we are hardly justified in puttingI
equal to the sum of two terms, for the tacit assumption has been that
both the emitted and exciting light are monochromatic; the application
of equation (4) to a phosphor having a broad band can only be justified
as a reasonably close approximation. Without developing a more
complicated equation-and the lack of experimental data for testing
such an equation makes this step unprofitable at the present time,-we
can therefore only'say that for large concentrations of the uranium
salts somewhat brighter fluorescenceis to be expected than that com-
[J.O.S.A. & R.S.I. 12ERNEST MERRITT620
FLUORESCENCE AND CONCENTRATION
puted from equation (4). Inspection of Figs. 1, 2 and 3 shows that theexperimental results are in agreement with this conclusion.
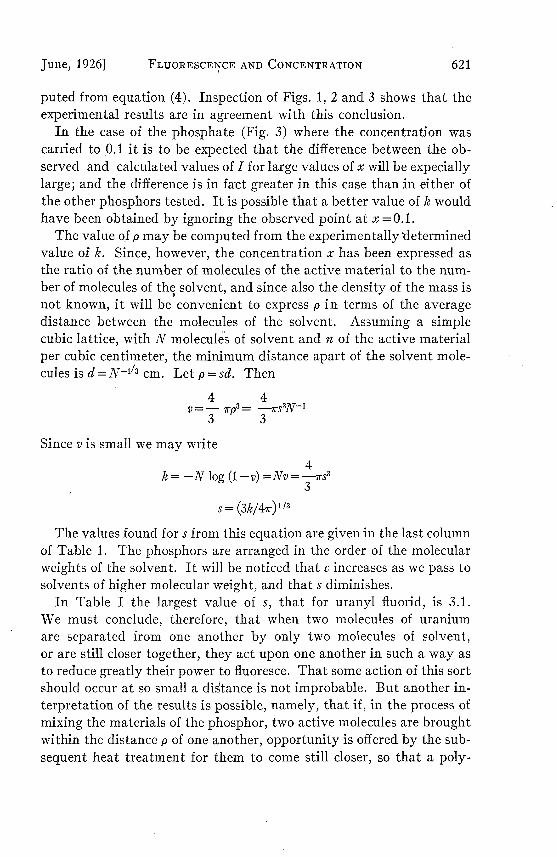
In the case of the phosphate (Fig. 3) where the concentration wascarried to 0.1 it is to be expected that the difference between the ob-served and calculated values of I for large values of x will be expeciallylarge; and the difference is in fact greater in this case than in either ofthe other phosphors tested. It is possible that a better value of k wouldhave been obtained by ignoring the observed point at x = 0.1.
The value of p may be computed from the experimentally determinedvalue of k. Since, however, the concentration x has been expressed asthe ratio of the number of molecules of the active material to the num-ber of molecules of the solvent, and since also the density of the mass isnot known, it will be convenient to express p in terms of the averagedistance between the molecules of the solvent. Assuming a simplecubic lattice, with N molecules of solvent and n of the active materialper cubic centimeter, the minimum distance apart of the solvent mole-cules is d = N- 11 cm. Let p = sd. Then
4 4v- rp3= -ws3 N-
3 3
Since v is small we may write
4k=-N log (1-v)=Nv= rs3
3
s = (3kl47r) 13
The values found for s from this equation are given in the last columnof Table 1. The phosphors are arranged in the order of the molecularweights of the solvent. It will be noticed that c increases as we pass tosolvents of higher molecular weight, and that s diminishes.
In Table I the largest value of s, that for uranyl fluorid, is 3.1.We must conclude, therefore, that when two molecules of uraniumare separated from one another by only two molecules of solvent,or are still closer together, they act upon one another in such a way asto reduce greatly their power to fluoresce. That some action of this sortshould occur at so small a distance is not improbable. But another in-terpretation of the results is possible, namely, that if, in the process ofmixing the materials of the phosphor, two active molecules are broughtwithin the distance p of one another, opportunity is offered by the sub-sequent heat treatment for them to come still closer, so that a poly-
June, 1926] 621
[J.O.S.A. & R.S.I., 12.
merized molecule may be formed, or possibly some chemical combina-
tion in which two molecules attach themselves to a single solvent mole-
cule. If this interpretation is correct we should expect that prolongedheat treatment would lead to larger values of p and k.
CORNELL UNIVERSITY,ITHACA, N. Y
Depolarization of resonance Radiation by alternating mag-netic Field-Suppose that resonance radiation is produced in theclassical manner; i.e. that a light-beam with its electric vectorparallel to the z axis causes oscillations of a free (or isotropicallybound) electron. If a magnetic field is applied along. the y axis, theline of vibration of the electron will rotate around the y axis with thefrequency of the Larmor procession; if this is great compared withthe frequency of the light, the radiation emitted by theelectron alongthe y direction will appear unpolarized;dif however the field is alter-nating instead of constant, the direction of rotation will be reversedin every half-period of the field, and the higher the frequency of alter-nation of the field the more nearly will perfect polarization of thelight be restored. Experiments with fields alternating at frequenciesof 1.2 to 5 millions, and X2536, showed that when the amplitude of thefield is 1.14 gauss, the polarization increases with the frequency; whenthe amplitude is 1.66 gauss it increases with frequency perceptiblyfrom 3.106 onward; with the amplitude 2.13 gauss it remains sensiblyconstant. The theory, which is not reproduced, apparently involvesan assumption that the damping of the oscillating electron is relatedin some way to the observed "life," 10-7 second, of the mercury atomin the excited state. The authors think that the accuracy of theirdata is sufficient to show, by comparison with their theory, that theprecession occurs at 3/2 the Larmor rate.-[E. Fermi and F. Rasetti,University of Florence; ZS., f. Phys., 33, pp. 246-50; 1925.]
KARL K. DARROW
Attempt to determine the ionizing-potential of phosphorus.-The method consisted in determining striking and breaking potentialsof a low-voltage arc in a two-electrode tube containing P vapor; thesepotentials varied rapidly with vapor-pressure, having minimum valuesboth near 10.3 volts when the tube was maintained near 3330C. Furtherexperiments at this vapor pressure with the anode in the form of a boxenclosing the cathode (so that it might grow very hot and the vaporwithin be highly dissociated) yielded current-voltage curves bendingsharply upward near 10.3 volts. (These numerical values appear toinvolve large and uncertain corrections to actual voltage readings).The value 10.3 is therefore proposed for the ionizing-potential of PaLoiiis.-[O. S. Duffiendack and TI. IuflisLifier (Gell. El. Co.); Pilys.Rev., (2), 25, pp. 501-08; 1925.]