DISCUSSION PAPER SERIES Forschungsinstitut zur Zukunft der Arbeit Institute for the Study of Labor The Relation between Maternal Work Hours and Cognitive Outcomes of Young School-Aged Children IZA DP No. 7310 March 2013 Annemarie Künn-Nelen Andries de Grip Didier Fouarge
Transcript
DI
SC
US
SI
ON
P
AP
ER
S
ER
IE
S
Forschungsinstitut zur Zukunft der ArbeitInstitute for the Study of Labor
The Relation between Maternal Work Hours and Cognitive Outcomes of Young School-Aged Children
IZA DP No. 7310
March 2013
Annemarie Künn-NelenAndries de GripDidier Fouarge
The Relation between Maternal Work Hours and Cognitive Outcomes of
Any opinions expressed here are those of the author(s) and not those of IZA. Research published in this series may include views on policy, but the institute itself takes no institutional policy positions. The IZA research network is committed to the IZA Guiding Principles of Research Integrity. The Institute for the Study of Labor (IZA) in Bonn is a local and virtual international research center and a place of communication between science, politics and business. IZA is an independent nonprofit organization supported by Deutsche Post Foundation. The center is associated with the University of Bonn and offers a stimulating research environment through its international network, workshops and conferences, data service, project support, research visits and doctoral program. IZA engages in (i) original and internationally competitive research in all fields of labor economics, (ii) development of policy concepts, and (iii) dissemination of research results and concepts to the interested public. IZA Discussion Papers often represent preliminary work and are circulated to encourage discussion. Citation of such a paper should account for its provisional character. A revised version may be available directly from the author.
The Relation between Maternal Work Hours and Cognitive Outcomes of Young School-Aged Children*
This paper is the first that analyzes the relation between maternal work hours and the cognitive outcomes of young school-going children. When children attend school, the potential time working mothers miss out with their children, is smaller than when children do not yet attend school. At the same time, working might benefit children through, for example, greater family income. Our study is highly relevant for public policy as in most countries maternal employment rates rise when children enter school. We find no negative relation between maternal working hours and child outcomes as is often found for pre-school aged children. Instead, we find that children’s sorting test score is higher when their mothers work part-time (girls) or full-time (boys). Furthermore, we find that planned parent-child activities are positively related to children’s language test scores. Nevertheless, we do not find that a richer home environment in terms of the number of parent-child activities provided to the child explain the relation between maternal work hours and children’s test scores. JEL Classification: D10, J13, J22 Keywords: intergenerational human capital investments, (non)cognitive skills,
maternal labor supply, home environment Corresponding author: Annemarie Künn-Nelen ROA, Maastricht University Tongersestraat 53 6211LM Maastricht The Netherlands E-mail: [email protected]
* We thank Lex Borghans, Thomas Dohmen, Trudie Schils, Maria Zumbühl, Thomas Zwick and participants of the 2010 Verein für Socialpolitik and the DUHR seminar for useful comments and suggestions. Moreover, we thank the research institute KAANS for providing the Moelejaan data, and Paul Jungbluth and Elma Nap-Kolhoff for data support.
Several studies deal with the relation between maternal employment and
child outcomes (e.g., Ermisch and Francesconi 2002; Harvey 1999; Vandell
and Ramanan 1992; Desai et al. 1989). However, most studies have con-
centrated on maternal work status before children go to school. Although
various studies have provided contradictory evidence, most studies found a
negative relation between maternal employment and child outcomes (e.g.,
Ruhm 2004; Baum 2003; Ermisch and Francesconi 2000).
Also public policies related to parental leave schemes focus on preschool-
aged children. Therefore, most mothers with children below the age of four
often do not participate in the labor market or they choose to work part-
time. Whereas there is great heterogeneity in the generosity of parental
leave schemes, in most European countries these schemes end before chil-
dren go to school.1 Nevertheless, working full-time may have adverse effects
on children’s development when children go to school as well, since, in gen-
eral, a child’s school week is shorter than a full-time work week. Mothers of
school-aged children may therefore choose not to work or to work part-time.
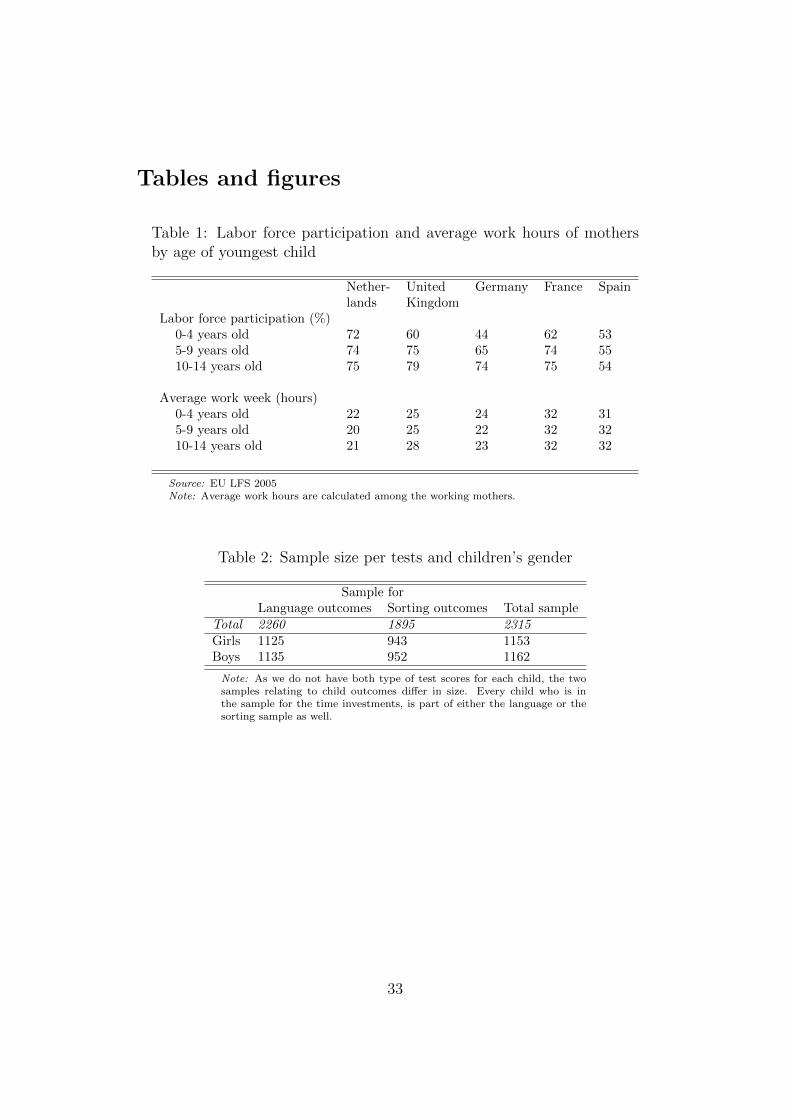
This is what Table 1 shows. For five European countries, data on maternal
1There is great variation in parental leave schemes across countries. The United Statesis the only Western country in which parents do not get any paid leave: Each parenthas the right to take 12 unpaid weeks. In other Western countries, leave schemes aremore generous. In the United Kingdom, for example, mothers get 52 weeks of paid leaveand both parents get 13 weeks of unpaid leave. In Germany, mothers get 14 weeks fullypaid; thereafter parents get 12 or 14 months, during which they are paid 65% of theirprevious wage with a certain maximum, depending on whether both parents decide forparental paid leave. Moreover, both parents together have the right to receive three yearsof unpaid leave before the child turns five years old. In the Netherlands, mothers get 16weeks of fully paid maternity leave; thereafter both parents get 26 weeks of unpaid leave.This parental leave can be taken discontinuously and before the child turns eight yearsold.
1
reflect children’s initial abilities and parental influences, but not the cognitive
input from school. Although our focus is on the correlation between the work
status of mothers and child outcomes, our focus on young children who are
not yet graded in school lowers the risk of reverse causality that occurs when
mothers have adapted their work hours to children’s grades in school.
We estimate a value-added model of production of cognition (cf. Todd
and Wolpin 2007) with school fixed-effects, in which we regress children’s
second year’s test scores on their first year’s score, their cognitive skills,
maternal work hours, home environment and other variables. We find that
whereas children’s language test score is not related to maternal work status,
their sorting test score does depend on maternal work status. We find that
this relation is different for girls than for boys. Girls perform best when their
mothers have a part-time job of at least 12 and at most 32 hours per week,
whereas boys perform best when their mothers work full-time. However, we
do not find any evidence that a rich home environment plays a role in the
relation between maternal employment status and child outcomes in their
second year at school (approximately at the age of five).
The structure of this paper is as follows: The next section briefly reviews
the related literature. Section 3 describes the data and provides sample
statistics. Section 4 presents the empirical strategy. Section 5 reports the
results. Section 6 discusses the results and concludes the study.
4
2 Related literature
In their seminal paper, Todd and Wolpin (2007) investigated the theory
and empirical implications of the production of cognition in children with
a specific focus on family inputs and school inputs. They conclude that a
value-added model best fits the notion that a child’s cognitive development
is a cumulative process that builds on own endowments and inputs from the
family and school. We build forth on this framework in Section 4. Although
Todd and Wolpin (2007) do not explicitly deal with the relation between
maternal employment and child outcomes, there is an extensive literature
that does so. This literature questions whether children profit more from
a non-working mother who takes care of her child herself or from a mother
who works, thereby contributing to family income, but sends her child – at
least for some days per week – to formal or informal child care. Only a few
studies have distinguished between part-time and full-time maternal employ-
ment. The literature provides contradictory evidence on the effect of parents’
work time on their children’s school performance. Harvey (1999), Greenstein
(1995), and Parcel and Menaghan (1994) found no detrimental effects of early
maternal employment on child development.4 However, other studies have
provided evidence of a negative effect of early maternal employment on child
outcomes.
Baum (2003) found that maternal paid work in a child’s first year
has detrimental effects on the child’s cognitive development. Additionally,
the author found that working during the first quarter after childbirth de-
4These studies include children from the age 3 to 12.
5
creases child outcomes (as measured by the Peabody Picture Vocabulary
Test). Moreover, his results suggested that increased family income from
maternal work partially offsets the negative effects of maternal employment.
Ruhm (2004) showed that maternal employment during the first three years
of a child’s life has a negative effect on the cognitive abilities of children
aged five and six years old. The effects found are greater for reading and
mathematics than for verbal abilities. Evidence shows more favorable out-
comes when mothers work part-time than full-time when the child is two
or three years old. Using the British Household Panel Study, Ermisch and
Francesconi (2000) found a negative effect of mothers’ full-time employment
during the time the child is zero to five years old on the child’s educational
attainment as a young adult. The effect of mothers’ part-time employment
status is also negative, but lesser and insignificant. Similarly, the effect of fa-
thers’ employment is small and negative but not always significant. Vandell
and Ramanan (1992) showed that early maternal employment has a positive
effect on reading and math scores for disadvantaged children.
Contradictory findings may not just result from differences in the time
periods analyzed, data sets used, and methodologies applied, but may also be
due to the difficulty of analyzing the relation between maternal work hours
and child outcomes.5 Ruhm (2004) suggested that the labor supply decision
of parents seems to involve a trade-off between time and goods investments
in children. Since there is no data set that includes information on parental
5All studies address the endogenous character of maternal employment in some way orthe other. This ranges from including a large set of confounding factors to reduce unob-served heterogeneity (e.g., Ruhm 2004) to dynamic sibling fixed effect models (Ermischand Francesconi 2000) and instrumental variables analyses in which local labor marketconditions are used to estimate maternal employment (Baum 2003).
6
work hours, parental time investments, family income, and child outcomes,
it is difficult to analyze whether and how parental work hours affect child
outcomes. However, there have been studies examining parental work hours,
on the one hand, and time or goods investments, on the other.
First, parental work hours affect the time parents have available for
spending with their child, but this relation does not have to be one to one.
Using US time use data, Bianchi (2000) showed that, compared to non-
working mothers, working mothers selectively reduce their own leisure time,
sleeping time, and time devoted to home production other than child care. As
a result, mothers with paid employment spend, on average, nearly as many
hours in direct child interactions as non-employed mothers. However, other
studies found that working parents spend less time with their children than
non-working parents. For example, Fox, Han, Ruhm, and Waldfogel (2013)
found that employed mothers spend significantly less time in primary child-
care than their non-employed counterparts. Cawley and Liu (2007) analyzed
whether working mothers spend less time on specific parent-child activities
than non-working mothers and found that employed women spend signifi-
cantly less time reading to their children, helping with homework, and in
educational activities in general. The authors found no evidence that these
decreases in the time spent with children were offset by increases in the time
husbands spent with children. Thereby, the authors suggested that lower
parental time investments may explain the frequently (but not always) found
negative association between maternal employment and children’s cognitive
development in the United States.
7
Second, parental work hours affect family income. This, in turn, may
affect child outcomes through good nutrition and a home environment that
focuses on child development (e.g., Aughinbaugh and Gittleman 2003; Blau
1999). For example, Fox, Han, Ruhm, and Waldfogel (2013) found that the
increase in market work during the last centuries is accompanied by a rise in
family income in the typical US two-parent family. Moreover, Kornrich and
Furstenberg (2013) found a gap in child expenditures between rich and poor
parents. Ruhm (2008) analyzed more precisely whether home environment
is the driving force in the relation between early maternal employment and
later child outcomes (aged 10-11). The author’s analyses on child outcomes
included a variable measuring the home environment that consists of a mix of
observational and parent-reported items assessing the emotional support and
cognitive stimulation received by children through their home environment,
planned events, and family surroundings. Ruhm found that a better home
environment benefits child outcomes. Negative, though not always signifi-
cant, signs of the interaction terms with maternal work hours suggest that
this positive effect of home environment is smaller when mothers work more
hours.
3 Data and descriptive statistics
3.1 Dutch early school system
In the Netherlands, parents are free to choose a primary school for their
children. Attending school is obligatory from the age of five on. However,
8
98% children enter primary school at the age of four (CBS 2003).6 The
first two years of primary school in the Netherlands are comparable with
kindergarten, though obligatory from the age of five. At this age, children
merely have preparatory activities. Only from the third school year onward
do children have classes in reading, writing, and arithmetic. During the first
two school years, children have to go to school for about 900 hours per year,
which boils down to about 30 hours per week.7
Nevertheless, in most schools, children are tested on their language and
sorting skills halfway through the first and second school years. These tests
are developed and validated by the national testing institute Cito to deter-
mine possible cognitive problems at an early age. Although schools are not
obliged to test children, about 62% of all schools test their pupils in the first
school year, with this percentage increasing to 76% in the second school year
(Jungbluth and Rodigas 2011).
3.2 Data
This paper uses the Moelejaan data from research institute KAANS at Maas-
tricht University. The Moelejaan project focuses on preschool and early-
school education in the southern part of the Dutch province of Limburg.
The data set builds on two sources: test scores provided by schools and
survey information from parents.
6The age of children at the time they perform the tests is included in the analyses totake into account their age when entering school.
7By law, schools must provide at least 880 hours and at most 940 hours of educationper year. Most children have Wednesday afternoon off, but schools are free to institutetheir own schedules (source: http://www.rijksoverheid.nl/onderwerpen/schooltijden-en-onderwijstijd).
9
Information from schools Test scores are provided from schools. Chil-
dren were tested twice, halfway the first and second school years, by which
98% of the children are aged four to five. Children are tested on their sorting
and language skills. We have information on these tests from two cohorts
of children: Cohorts 1 and 2 took the tests in the first school year around
January 2007 and January 2008, respectively, and in the second school year
around January 2008 and January 2009, respectively.8
Parental questionnaire All parents of children attending the first two
school years of all primary schools in the southern part of Limburg received
a questionnaire via the school in September 2008.9 Parents could return
the questionnaire to the school in a sealed envelope. The survey data con-
tains information on parental work time, as well as information on activities
parents undertake with their childr. Moreover, the survey data includes de-
tailed information on the child (e.g., various behavior characteristics and
non-cognitive skills), the parents (e.g., educational level, parental views, and
parenting goals), and the household (e.g., the number of children and the
presence of other adults).
About 60% of all children attending the second year of primary school
were tested both in the first and second school years. Although the response
rate of the parental questionnaire was almost 70%, only 45% of the parents
completed the full survey. Therefore, our sample contains complete informa-
8There are some exceptions: 2% of the children attended the first year of primaryschool twice. For these children, we use their first test scores to make sure the test scoresare comparable to those children who did not attend the first year of school twice.
9One questionnaire per child, with the child’s name, address, date of birth, and genderat the top.
10
tion on 2,315 children. Since some children only completed one type of test,
our sample sizes for the analyses on child outcomes differ. Our sample for
the language test includes 2,260 children, whereas that for the sorting test
includes 1,895 children.10 Table 2, reports the sample sizes for boys and girls,
as the various analyses are performed separately by gender.
[Table 2 around here]
Human capital outcomes We use two test scores for children’s cognitive
skills: language and sorting. During the tests, the children worked in their
own assignment books. The teacher read the assignment out loud and the
children had to mark what they believed was the correct answer. The tests
consisted of two parts, both taking about 20 to 30 minutes. The tests were
similar in the first and second years and for both cohorts of children. The
test scores are the number of good answers.
The language test deals with passive vocabulary and critical listening,
and involves 56 assignments. The sorting test involves 42 assignments that
focus on three sorting principles: classifying subjects (placing them next to
each other), ranking subjects, and comparing and counting them.
[Table 3 around here]
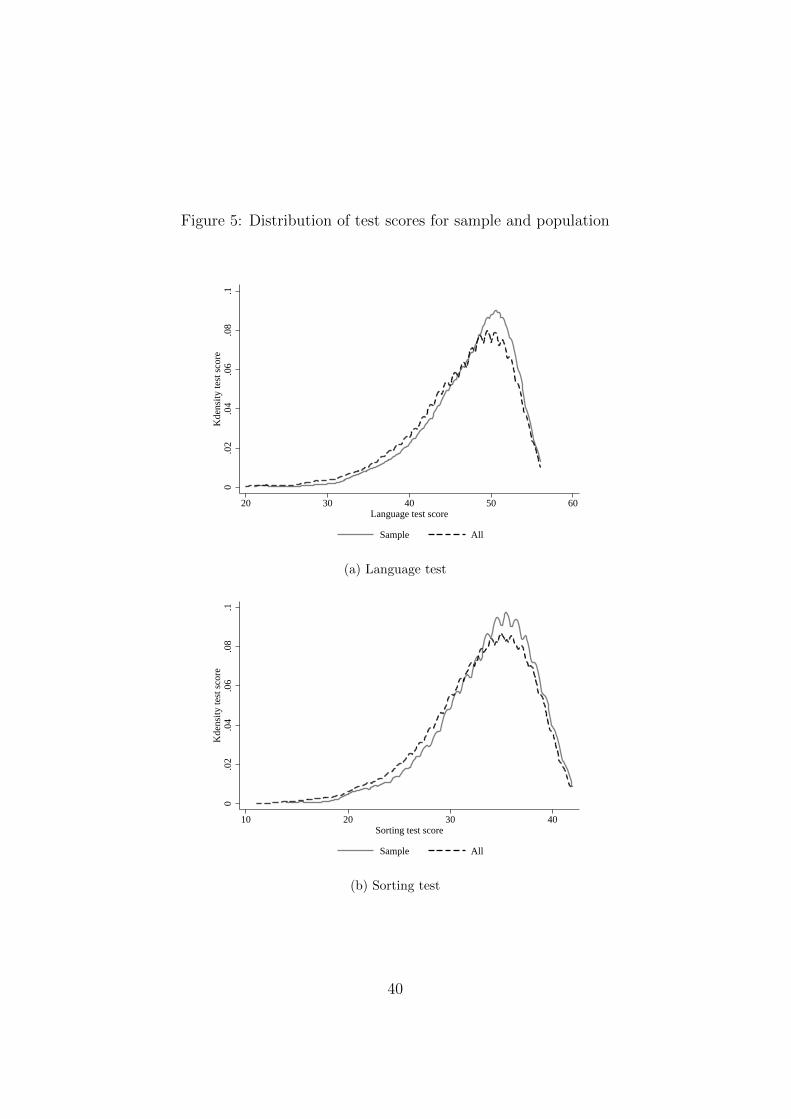
10The sample of children included seems to be slightly positively selected. Childrenin our sample score on average one point per test higher than children from whom theparents did not complete the survey. For the distribution of test scores of the sample andthe population, see Figure 5 in the appendix.
11
Table 3 reports the raw test scores.11 On average, the children have 47
out of 56 questions right on the language test. With respect to the sorting
test, the children have on average, about 34 out of 42 questions right. Group
mean comparison tests show that girls perform significantly better in both
tests than boys.12
Maternal work status The questionnaire provides information on parental
work time. The responding parent is asked to report whether she/he and
her/his partner worked and, if so, how many hours a week in the following
ways: not working, working in a small part-time job (fewer than 12 hours a
week), a large part-time job (12 to 32 hours a week), or working in a full-
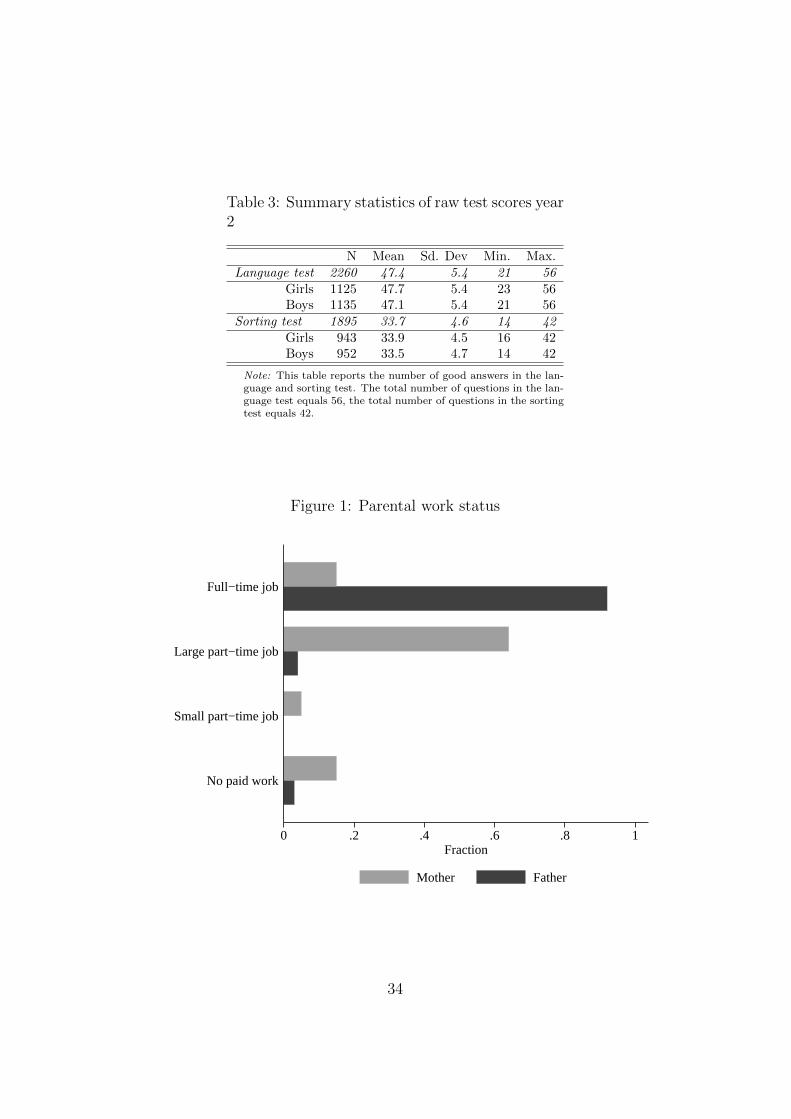
time job (more than 32 hours a week). Figure 1 reports the distribution of
maternal and paternal work status. Most children (64%) have a mother with
a large part-time job, 15% of the children has a mother who works full-time,
and 5% has a mother with a small part-time job. The remaining 16% of the
children has a mother without a paid job. We use the latter as the refer-
ence category in the analyses. Since almost all fathers in the sample work
full-time, we control for paternal work status but do not focus on the role
it plays on child outcomes. About 4.5% of the fathers have a part-time job,
and 3% of the children has a father without a paid job.The distribution of
parental work hours is identical for boys and girls.
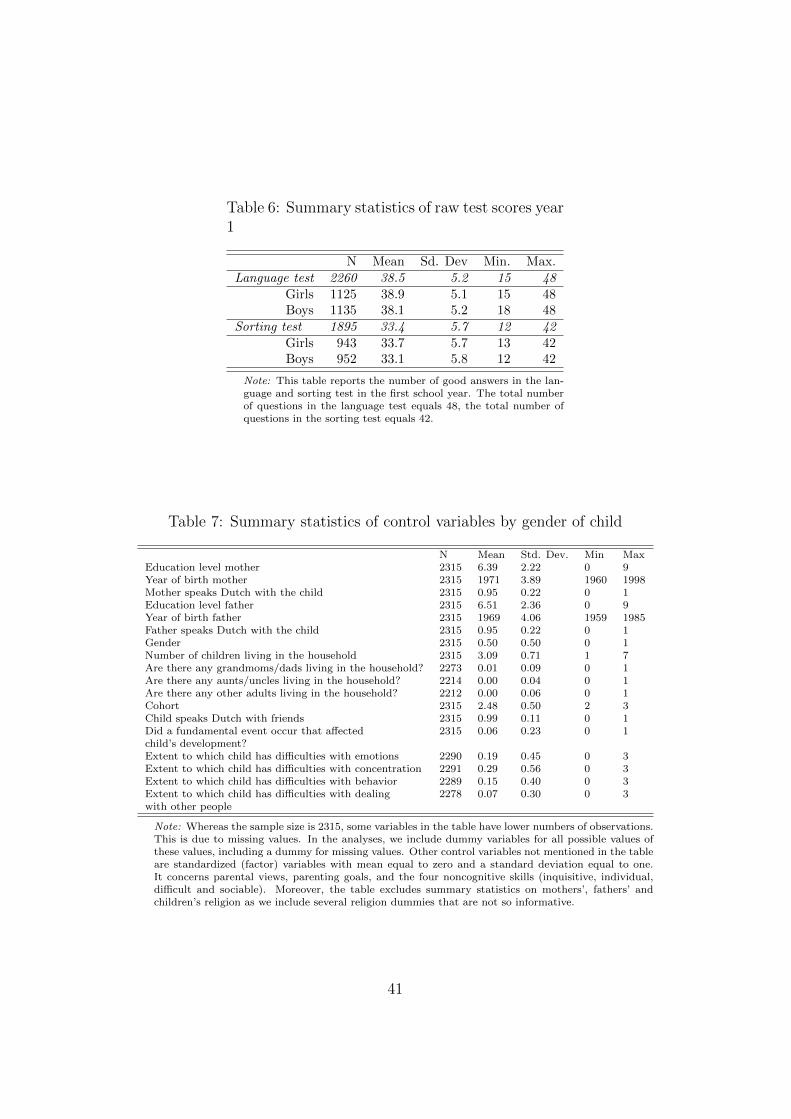
11These test scores are from the test in children’s second year of school. In the Appendix,Table 6, one finds the descriptive statistics on the test scores in school year one.
12Since the girls are not significantly older (in days) than the boys, this finding does notseem be due to differences in age.
12
[Figure 1 around here]
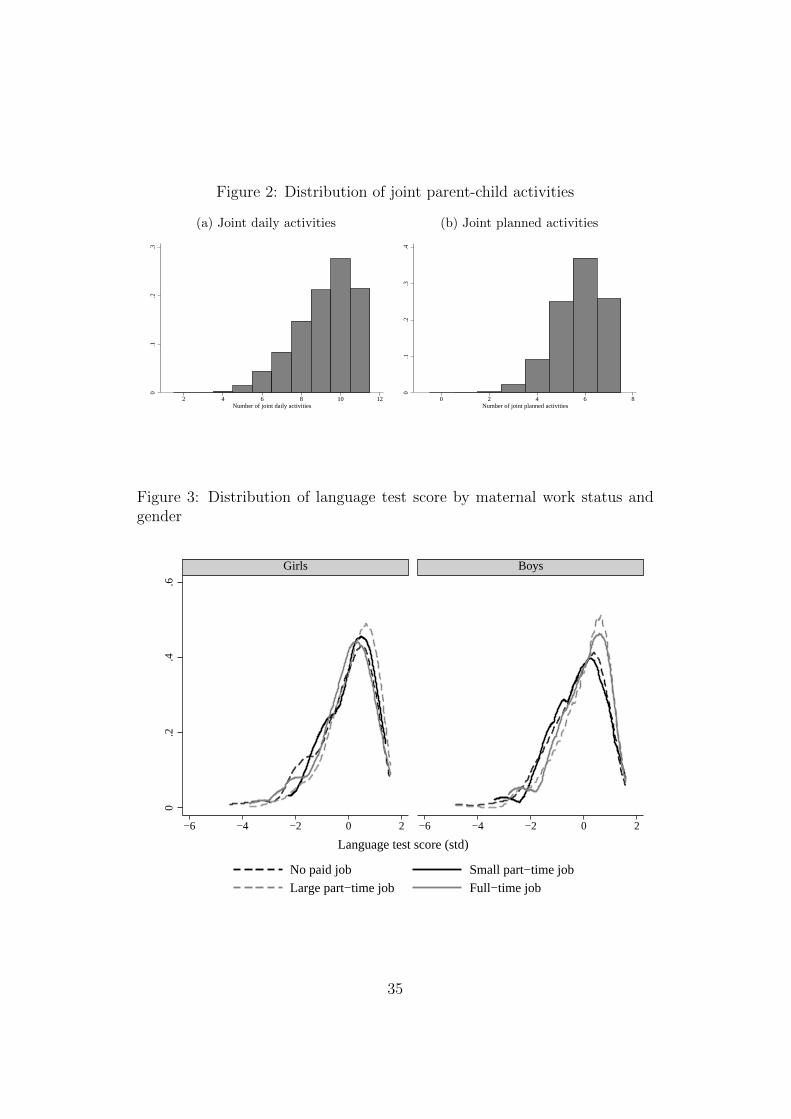
Rich home environment By a rich home environment, we mean that a
child has access to a large variety of home inputs. We measure this by two
sets of survey questions on joint parent-child activities: daily activities and
planned activities.13 We include the number of activities parents undertake
with their child in the analyses on child outcomes. Thereby, we analyze
whether the relation between maternal work status and child outcomes is
driven by children’s home environment, that is, the number of parent-child
activities provided at home.
Questions related to joint daily activities are asked in the following
way: In their joint daily activities, children do lots of things together with
their parents. What applies to your child? The activities referred to are the
following:
• Watching children’s programson TV with your child
• Watching TV/video (other pro-grams) with your child
• Playing with toys inside withyour child
• Playing outside with your child
• Playing on a computer withyour child
• Drawing/painting with yourchild
• Making up stories with yourchild
• Going to the sports club orswimming pool with your child
• Reading stories to your child
• Reading stories focused on de-velopment to your child
• Talking about school with yourchild
13Our focus is on the richness of a child’s environment in terms of the quantity of jointactivities provided. Of course, the quality of the home environment provided is importantfor the richness as well.
13
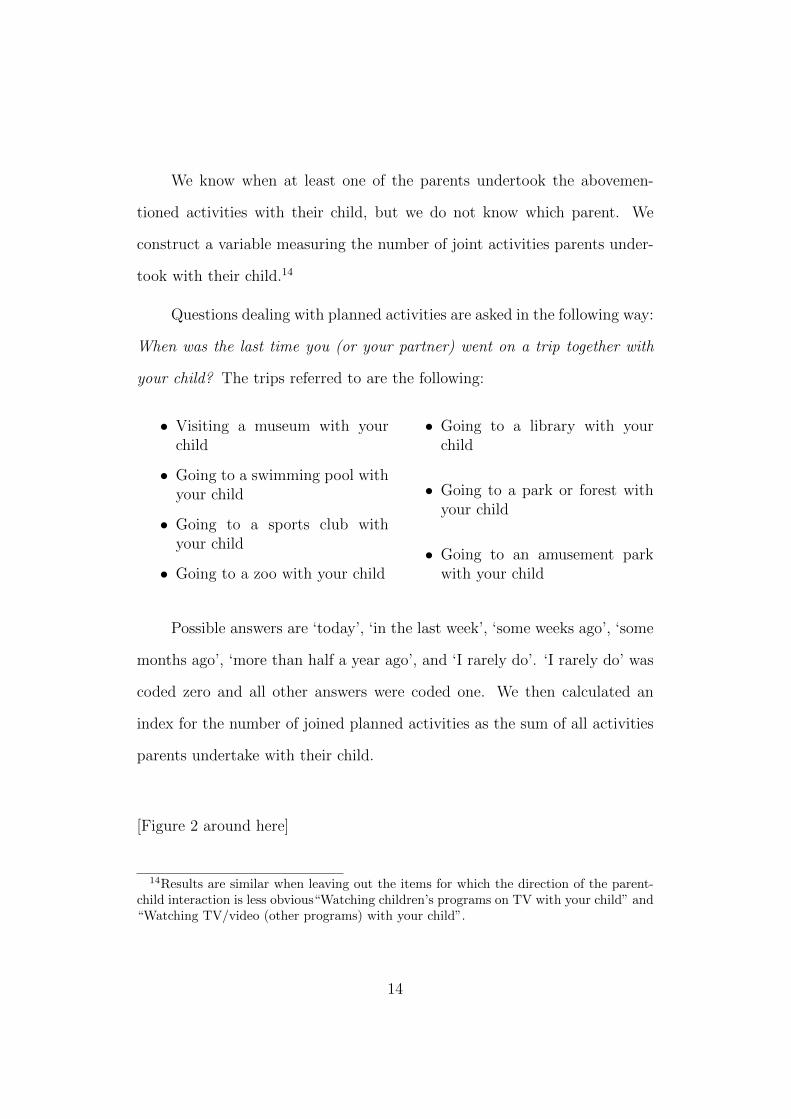
We know when at least one of the parents undertook the abovemen-
tioned activities with their child, but we do not know which parent. We
construct a variable measuring the number of joint activities parents under-
took with their child.14
Questions dealing with planned activities are asked in the following way:
When was the last time you (or your partner) went on a trip together with
your child? The trips referred to are the following:
• Visiting a museum with yourchild
• Going to a swimming pool withyour child
• Going to a sports club withyour child
• Going to a zoo with your child
• Going to a library with yourchild
• Going to a park or forest withyour child
• Going to an amusement parkwith your child
Possible answers are ‘today’, ‘in the last week’, ‘some weeks ago’, ‘some
months ago’, ‘more than half a year ago’, and ‘I rarely do’. ‘I rarely do’ was
coded zero and all other answers were coded one. We then calculated an
index for the number of joined planned activities as the sum of all activities
parents undertake with their child.
[Figure 2 around here]
14Results are similar when leaving out the items for which the direction of the parent-child interaction is less obvious“Watching children’s programs on TV with your child” and“Watching TV/video (other programs) with your child”.
14
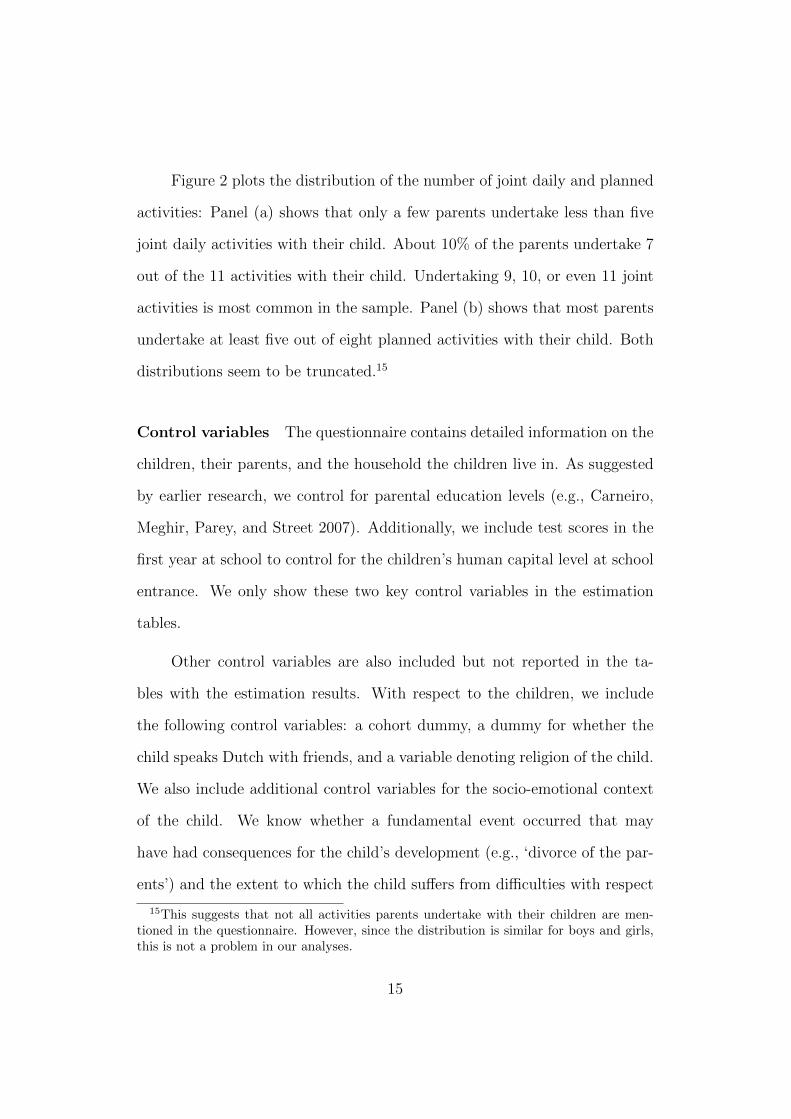
Figure 2 plots the distribution of the number of joint daily and planned
activities: Panel (a) shows that only a few parents undertake less than five
joint daily activities with their child. About 10% of the parents undertake 7
out of the 11 activities with their child. Undertaking 9, 10, or even 11 joint
activities is most common in the sample. Panel (b) shows that most parents
undertake at least five out of eight planned activities with their child. Both
distributions seem to be truncated.15
Control variables The questionnaire contains detailed information on the
children, their parents, and the household the children live in. As suggested
by earlier research, we control for parental education levels (e.g., Carneiro,
Meghir, Parey, and Street 2007). Additionally, we include test scores in the
first year at school to control for the children’s human capital level at school
entrance. We only show these two key control variables in the estimation
tables.
Other control variables are also included but not reported in the ta-
bles with the estimation results. With respect to the children, we include
the following control variables: a cohort dummy, a dummy for whether the
child speaks Dutch with friends, and a variable denoting religion of the child.
We also include additional control variables for the socio-emotional context
of the child. We know whether a fundamental event occurred that may
have had consequences for the child’s development (e.g., ‘divorce of the par-
ents’) and the extent to which the child suffers from difficulties with respect
15This suggests that not all activities parents undertake with their children are men-tioned in the questionnaire. However, since the distribution is similar for boys and girls,this is not a problem in our analyses.
15
to emotions, concentration, behavior, and relationships with other people.
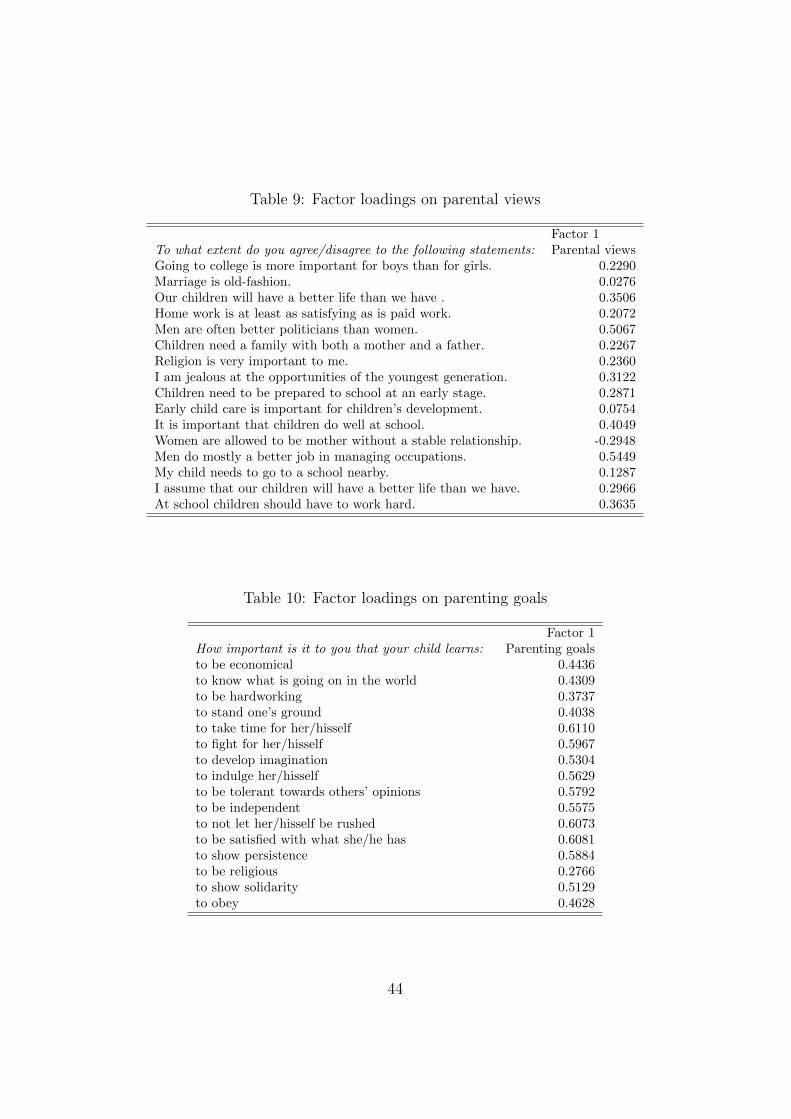
Moreover, the parental questionnaire includes 50 items on the child’s non-
cognitive skills. Factor analyses show that we can distinguish four factors,
related to the following characteristics: inquisitive (e.g., ‘interested’), indi-
vidual (e.g., ‘independent’), difficult (e.g., ‘bothersome’), and sociable (e.g.,
‘oriented toward other children’). The standardized values of these factors
are included in all estimations on children’s outcomes.16
Regarding the parents, we include in addition to their educational level
their age, religion, and whether they speak Dutch with their child. We also
have information on various parental views and parenting goals. These vari-
ables may convey information on heterogeneity in parenting style. Parental
views are measured by the extent to which they agree to 16 statements (e.g.,
‘child care is important for children’s development’) on a five-point Likert
scale. With respect to parenting goals, parents were asked to state how they
view the importance of 12 goals for their children (e.g., ‘developing imagina-
tion’) on a five-point Likert scale. The analyses include parental values and
parenting goals measured by two standardized factors constructed by factor
analysis. At the household level, we include the number of children living in
the household and whether or not there are grandparents, uncles or aunts,
or other adults living in the household. Summary statistics of the control
variables are reported in Table 7 in the appendix.17
16The factor loadings for this factor analysis and the upcoming ones can be found inTable 8 to 10 in the appendix.
17We do not have data on parental income. We do have information on the number ofchild books available in the household. This is often used as a proxy for parental income.In our dataset, this variable is not related to child outcomes and inclusion of this variablethereby does not affect our results.
16
Because we have school identifiers, we include school fixed effects to
control for differences in school performance and school environment. Since
the average distance between home and school for children attending primary
school in Limburg is 0.7 km, we thereby indirectly control for differences in
neighborhood characteristics as well, which is important as shown by for
example Sastry and Pebley (2010).18
3.3 Descriptive evidence
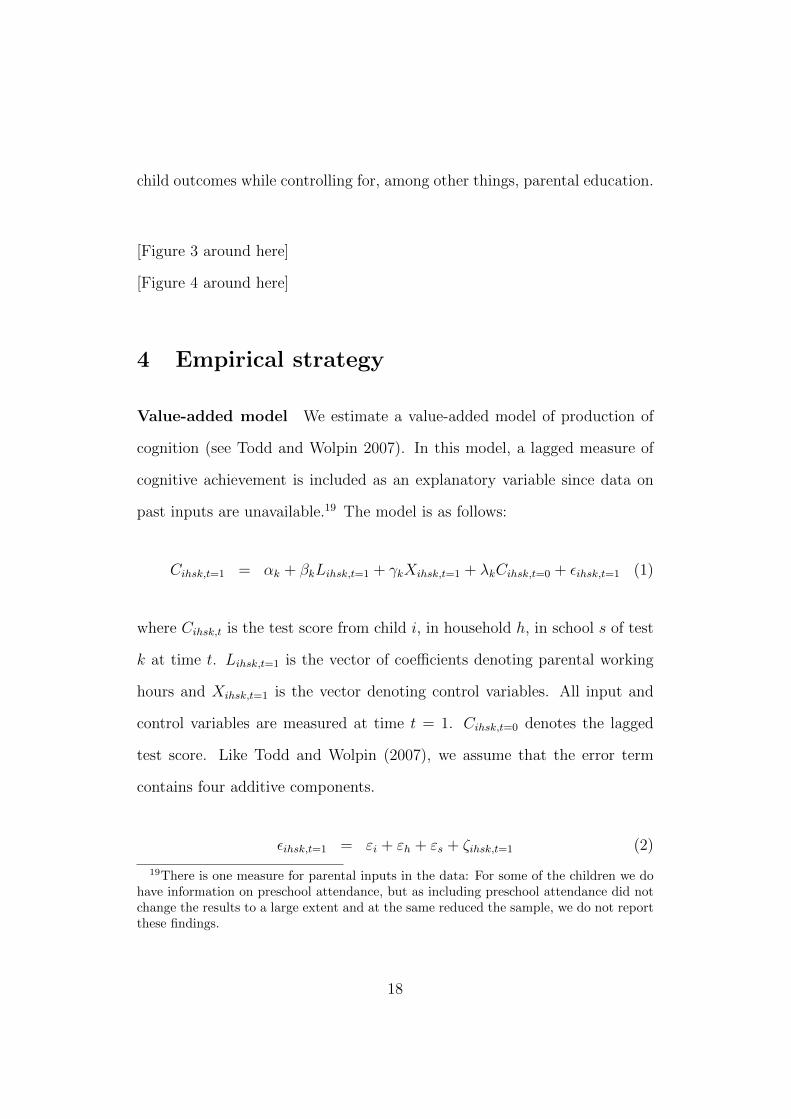
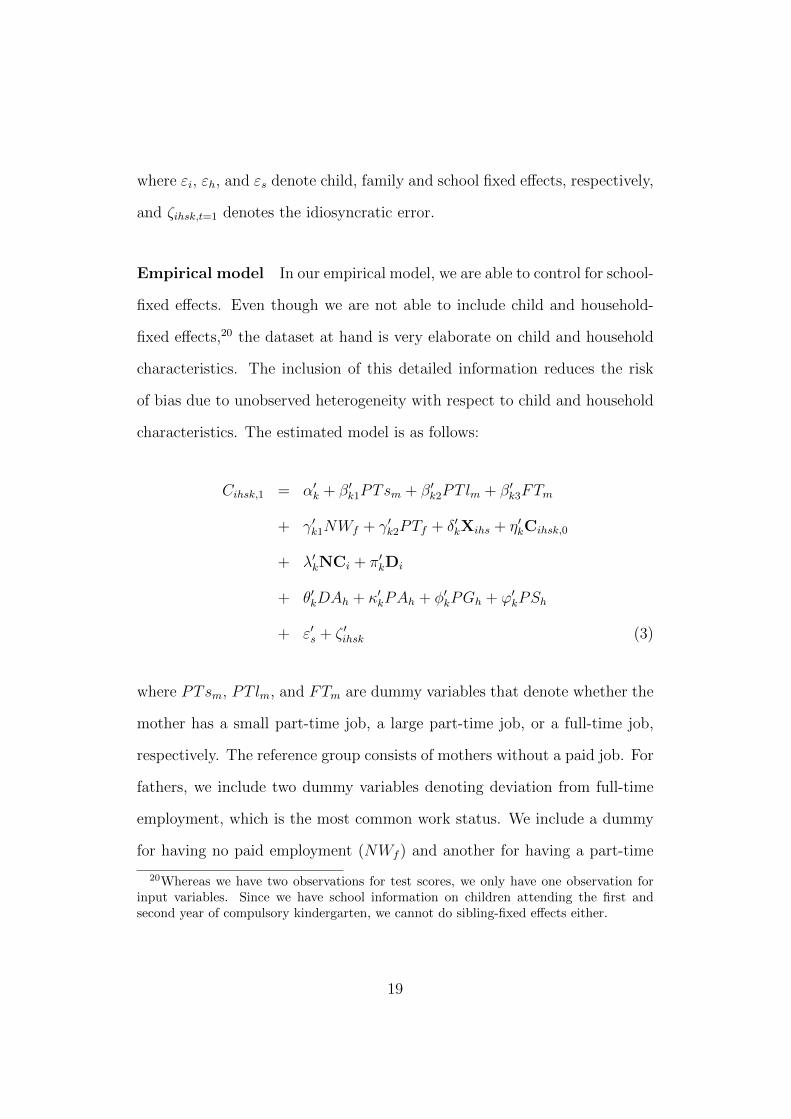
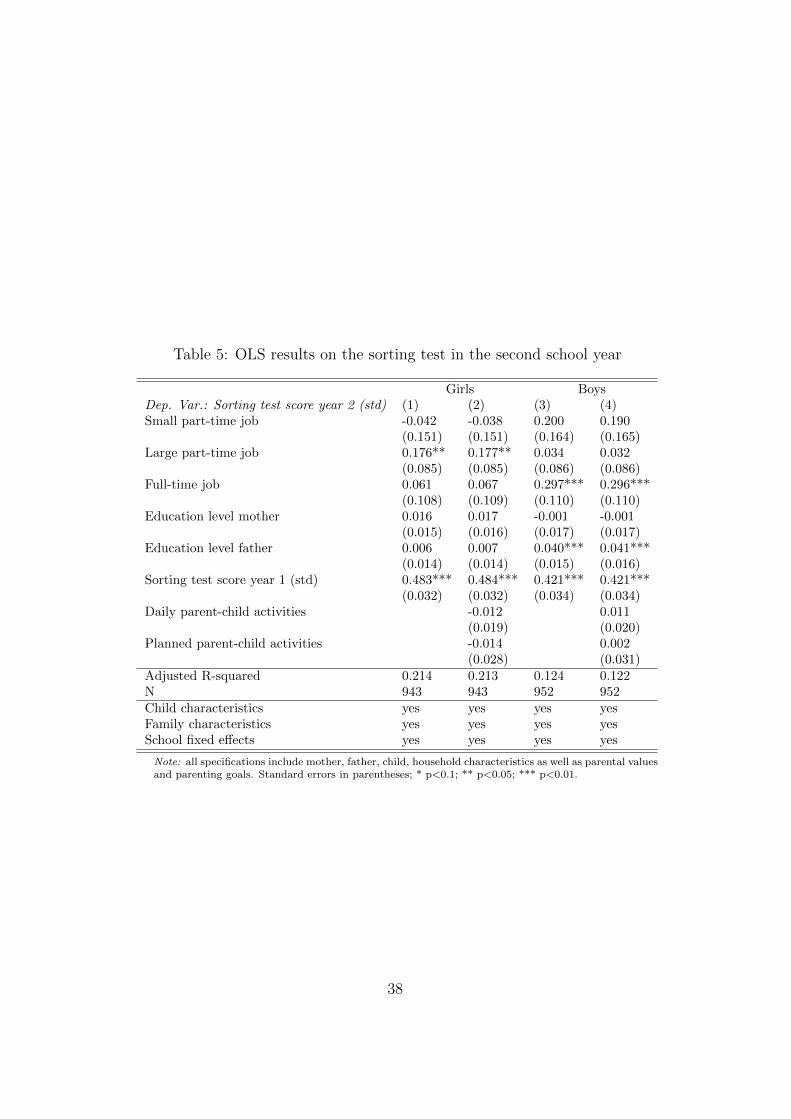
Figures 3 and 4 plot the distributions of the two test scores by maternal
work status and gender. Figure 3 does not show a significant difference in
either the mean or the distribution of the language test score for children
with working and non-working mothers. Moreover, whether a mother works
part-time or full-time does not seem to matter. This is in sharp contrast to
Figure 4, where for both girls and boys the distributions of sorting test scores
seem to be shifted to the right and more compressed when the mother has
a large part-time or full-time job, compared to the distributions for children
with a mother with a small part-time job or without a paid job. While the
mean standardized test scores for girls are highest when their mothers had
a large part-time job, those for boys were highest when their mothers had
a full-time job. This difference is small and may be caused by other factors
driving both maternal work hours and child outcomes, such as maternal edu-
cation. Section 5 analyzes whether maternal work status indeed matters for
18Source: CBS Statline. Regional information: Limburg: years 2006, 2007, 2008.
17
child outcomes while controlling for, among other things, parental education.
[Figure 3 around here]
[Figure 4 around here]
4 Empirical strategy
Value-added model We estimate a value-added model of production of
cognition (see Todd and Wolpin 2007). In this model, a lagged measure of
cognitive achievement is included as an explanatory variable since data on
past inputs are unavailable.19 The model is as follows:
where Cihsk,t is the test score from child i, in household h, in school s of test
k at time t. Lihsk,t=1 is the vector of coefficients denoting parental working
hours and Xihsk,t=1 is the vector denoting control variables. All input and
control variables are measured at time t = 1. Cihsk,t=0 denotes the lagged
test score. Like Todd and Wolpin (2007), we assume that the error term
contains four additive components.
εihsk,t=1 = εi + εh + εs + ζihsk,t=1 (2)
19There is one measure for parental inputs in the data: For some of the children we dohave information on preschool attendance, but as including preschool attendance did notchange the results to a large extent and at the same reduced the sample, we do not reportthese findings.
18
where εi, εh, and εs denote child, family and school fixed effects, respectively,
and ζihsk,t=1 denotes the idiosyncratic error.
Empirical model In our empirical model, we are able to control for school-
fixed effects. Even though we are not able to include child and household-
fixed effects,20 the dataset at hand is very elaborate on child and household
characteristics. The inclusion of this detailed information reduces the risk
of bias due to unobserved heterogeneity with respect to child and household
characteristics. The estimated model is as follows:
Cihsk,1 = α′k + β′k1PTsm + β′k2PT lm + β′k3FTm
+ γ′k1NWf + γ′k2PTf + δ′kXihs + η′kCihsk,0
+ λ′kNCi + π′kDi
+ θ′kDAh + κ′kPAh + φ′kPGh + ϕ′kPSh
+ ε′s + ζ ′ihsk (3)
where PTsm, PT lm, and FTm are dummy variables that denote whether the
mother has a small part-time job, a large part-time job, or a full-time job,
respectively. The reference group consists of mothers without a paid job. For
fathers, we include two dummy variables denoting deviation from full-time
employment, which is the most common work status. We include a dummy
for having no paid employment (NWf ) and another for having a part-time
20Whereas we have two observations for test scores, we only have one observation forinput variables. Since we have school information on children attending the first andsecond year of compulsory kindergarten, we cannot do sibling-fixed effects either.
19
job (PTf ). Because the number of fathers belonging to either of these two
categories is very small, we do not report these coefficients.
The vector X denotes usual control variables as described in Section 3.
It includes for example the education level of the parents and the number of
siblings. The variable Cihsk,0 denotes children’s test scores in their first year
at primary school.21
We proxy for child fixed effects (εi) by including a large set of vari-
ables measuring children’s personality traits. The vector NC consists of four
standardized factors related to children’s non-cognitive skills (see Section 3
for details). This vector takes out a large part of the normally unobserved
heterogeneity across children. Moreover, we include a vector with dummy
variables (NC) whether the child suffers from difficulties with respect to
emotions, concentration, behavior, and relationships with other people.
To reduce unobserved heterogeneity across households (εh), we include
the number of joint daily (DAh) and planned activities (PAh) parents un-
dertake with their children. Next to these proxies for home environment, we
moreover include two standardized factors relating to parenting goals (PG)
and parental styles (PS). So even without panel data, we are able to re-
duce the unobserved heterogeneity with respect to both child and household
characteristics to a large extent.22
21When the test scores from the first year are omitted, the education level of the motherbecomes more important. The role of maternal employment is robust to omitting earliertest scores in all analyses.
22Unfortunately, our data are cross-sectional, with the exception that test scores aremeasured in two successive years. Therefore, our estimations do not warrant a causalinterpretation. However, since the children in our data are very young and have notyet started learning how to read, write, or do arithmetic at school, it is likely that bothparental work hours and the number of joint parent-child activities are exogenous with
20
We estimate Equation (3) separately for boys and girls, since it turns
out that maternal work status affects child outcomes differently for boys
and girls. To see whether the relation between maternal work status and
child outcome is affected by the inclusion of joint activities, in other words,
whether the relation between maternal work status and child outcomes is
(partly) driven by the richness of the children’s home environment, we report
regression results without and with the two variables measuring parent-child
activities.
5 Results
Table 4 reports the ordinary least squares (OLS) results of Equation (3) for
girls (Columns (1) and (2)) and boys (Columns (3) and (4)) separately.23 The
estimation results show that maternal work status is not related to children’s
language test score. Instead, the educational level of the mother seems to
be important for children’s language test score. The more educated a child’s
mother, the better the child performs at the language test in the second school
respect to child outcomes, because at preschool ages the child endowments we analyze arenot revealed to parents (cf. Ermisch and Francesconi 2000; Rosenzweig and Wolpin 1995).Due to the unique control variables included in the estimations, such as non-cognitiveskills, parental views, and parenting goals, unobserved heterogeneity and the associatedlikelihood of spurious effects is not likely to be a serious issue. There might be anothersource for endogeneity as well: Parents who are less productive in raising their childrencould also be less productive in the labor market. This could lead to an upward bias ofour findings. Nevertheless, as we include parental education in the analyses to control forthis possible source of unobserved heterogeneity, the bias is likely to be small. However,our findings should not be interpreted in a causal way.
23Since Figures 3 and 4, show that the distribution of the test scores is truncated (mostchildren perform well on the test), we performed Tobit analyses when estimating therelation between maternal work status and child outcomes. Since these Tobit estimatesare similar to the OLS estimates, we report the OLS estimations in this paper.
21
year. Because we control for children’s test scores in the first year at school,
this finding suggest that children from highly educated mothers experience
larger increases in their human capital than those from less educated mothers.
The relation between maternal work status and child outcomes does
not change after including the joint parent-child activities in the regression.
Nevertheless, we do find that the richness of the home environment as mea-
sured by the number of joint planned activities is positively and significantly
related to girls’ as well as boys’ language test scores, although this relation is
only weakly significant for girls.24 The number of joint daily activities does
not seem to relate to children’s language test scores. This is somewhat sur-
prising, and suggests that not the quantity of joint daily activities matters for
child outcomes is important but rather the quality of joint daily activities, or
even parent-child interaction in general. The clear positive relation between
maternal education and children’s language test score is in line with this idea.
[Table 4 around here]
[Table 5 around here]
Table 5 shows the results from the analyses on the sorting test scores
for both girls (Columns (1) and (2)) and boys (Columns (3) and (4)). In
contrast to the language test scores, children’s sorting test scores appear to
relate to maternal work hours. Girls whose mothers have a large part-time
24The positive relation between joint planned activities and children’s language test scoreis driven by higher educated parents. If we estimate the regressions separately for highand low educated parents, the positive significant relation between joint planned activitiesand children’s language test score is only found for children from highly educated parents.
22
job perform better than girls whose mothers who do not a paid job.25 We
also find that maternal work status plays a role in explaining boys’ scores on
the sorting test. However, in contrast to girls, boys perform best when their
mothers have a full-time job.26 Additionally, we observe a significant relation
between boys’ sorting test scores and their fathers’ level of education.
Table 5, shows that joint parent-child activities are not significantly
related to children’s sorting test scores. It comes therefore as no surprise that
the relation between test scores and maternal work status is not affected by
the inclusion of the number of joint parent-child activities.
Overall, the richness of the home environment does not seem to play a
large role for children’s test scores. Whereas the number of planned parent-
child activities is, at least to some degree, related to children’s language test
scores, the number of daily parent-child activities are not related to either
of the test scores. However, the absence of a clear relation between home
environment and child outcomes could imply that not the quantity but the
quality of parent-child activities is important for child outcomes.27
Our findings show that a distinction between the determinants of the
test scores of boys and girls is valuable, since boys’ and girls’ test scores
seem to be differently related to maternal work status. Whereas girls with
mothers with a large part-time job perform significantly better at the sorting
25However, the coefficient for full-time working mothers is not statistically different fromthat of mothers with a large part-time job.
26If we perform the analyses jointly for girls and boys, we find a weak positive relationbetween maternal work hours and children’s sorting test score.
27The measure of home environment used in Ruhm (2008), includes both quantity andquality measures and is indeed significantly related to child outcomes.
23
test than girls with mothers without a paid job, boys perform significantly
better when their mothers work full-time.28
With respect to the sorting test scores, we find that children benefit
when their mothers work. This is probably related to the fact that the
children in our sample all attend school about 30 hours a week. The possible
difference in the time spent with children between a non-working mother
and a mother with a large part-time, or even a full-time job, is therefore
much less than when children do not yet attend school. In our sample of
young school-aged children, part-time working mothers might be working
during school hours. Even in the case where mothers have to work when
the children are not at school, the difference in the number of joint parent-
child activities between working and non-working mothers seems to be of less
importance than the advantages maternal employment can bring. The most
straightforward advantage is a higher family income. In our sample, where
almost all fathers work full-time, families with a mother with a large part-
time or full-time job probably have a higher family income than families in
which the mother does not work. This additional income may benefit children
by better nutrition and access to goods or services that benefit children’s
cognitive development. However, we do not find any significant evidence for
28We are not aware of studies differentiating between boys and girls when it comes tomaternal employment an outcomes of young school-aged children. Literature focusing onthe relation between maternal employment (and child care) in the first years of a child’slife and child outcomes often do not find differences between boys and girls (Ruhm 2004;Han, Waldfogel, and Brooks-Gunn 2001; Hill, Waldfogel, Brooks-Gunn, and Han 2005).Nevertheless, when differences are found, the relation between maternal employment andchild outcomes seems to be more negative for boys than for girls (Brooks-Gunn, Han, andWaldfogel 2002; Desai, Chase-Lansdale, and Michael 1989). This is often attributed tothe findings of Zaslow and Hayes (1986) and Rutter (1985) which suggest that boys aremore vulnerable than girls in their early childhood.
24
a richer environment in terms of the number of joint parent-child activities to
explain the better cognitive outcomes of children with a mother who works
at least 12 hours per week.
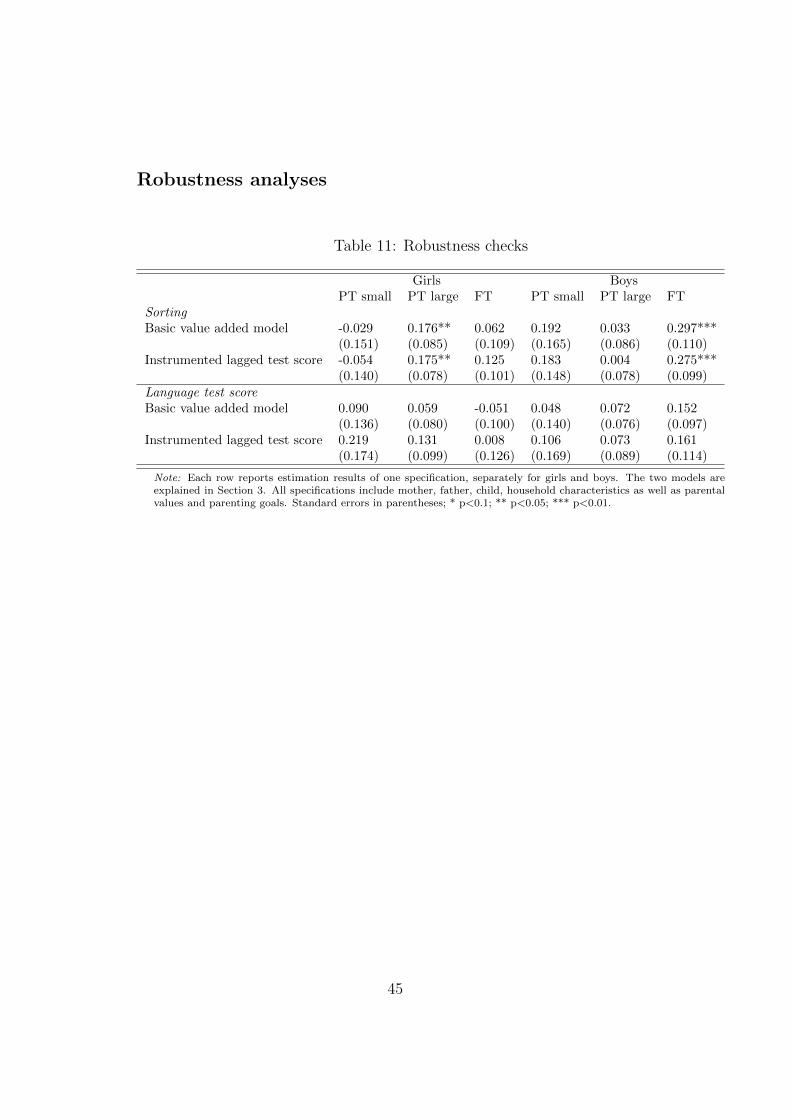
In a robustness check, we test the sensitivity of our model to mea-
surement error in the lagged test score. This measurement error might
attenuate the coefficient on lagged test scores in value-added estimations
and might bias the input coefficients such as maternal employment or the
richness of the home environment. To account for this, we follow Andrabi,
Das, Khwaja, and Zajonc (2011) and instrument the lagged test score in
one subject (Cihsk=1,t=0) by the lagged test score in an alternative subject
(Cihsk=2,t=0). This approach is valid under the assumption that the measure-
ment in both test scores are uncorrelated. We do not find that such bias
affects our results (see appendix).
6 Conclusion and discussion
In this paper, we analyze the relation between maternal work status and child
outcomes. In contrast to most earlier research, our analyses focus on the
work status of mothers of young school-aged children. When children attend
school, the potential time working mothers miss out spending with their
children is much less than when children do not yet attend school. Mothers
who work part-time especially may work entirely during school hours. At
the same time, working can benefit children, for example, through greater
family income.
25
We estimate a value-added model of production of cognition and do not
find a negative relation between maternal employment and child outcomes
as is often found for preschool aged children. Instead, we find that boys’ and
girls’ sorting test scores are higher when their mothers have a large part-
time or full-time job, respectively. In contrast to our expectations, part-time
employment – allowing for working during school hours – does not seem to
be most beneficial for all children, since boys with full-time working mothers
perform better than boys of mothers with a part-time job. Since the test
scores for girls with a full-time working mother are as good as those for girls
with mothers with another employment status, our findings suggest that
full-time employment may be most beneficial for the cognitive outcomes of
young school-aged children.29 This finding, that working mothers benefit
school-aged children, is in line with the findings of O’Brien and Jones (1999),
who found that children aged 13 to 15 perform best when their mother is
employed, although these gains are not as strong when both parents work
full-time.
We also show that maternal employment benefits children in a way that
cannot be explained by a richer home environment in terms of joint parent-
child activities. Instead, greater monetary resources might play a role in the
relation found. Several studies indeed show a positive although small effect
of parental income on child development (e.g., Aughinbaugh and Gittleman
2003; Blau 1999). In Brooks-Gunn, Han, and Waldfogel (2010) it is shown
29Since we do not find a significant difference between the test scores for girls with full-time working mothers and girls with mothers with a large part-time job, a larger samplesize would probably result in a significant coefficient for full-time maternal employmentas well.
26
that maternal employment is positively associated with mothers’ earnings
and that this offsets the negative direct association between early maternal
employment and child outcomes at age 4.5 in the United States.
Another channel through which maternal work hours and child out-
comes may be related, is the quality of the home environment. At work,
mothers may exchange information and experience regarding time allocation,
good child care centers, and child-raising activities with their colleagues. So,
whereas joint parent-child activities do not explain the relation between ma-
ternal work status and child outcomes, the quality of parent-child interactions
may be important. The quality of parent-child activities may also be higher,
because mothers who work are happier and reflect this in their parenting.
Especially for the generation of mothers analyzed in this study, women may
be happier when they are able to combine family life with a paid (part-time)
job. However, while several studies have addressed the question of whether
partnered women in the Netherlands prefer part-time jobs over full-time jobs
(e.g., Booth and Van Ours 2010; Bosch, Deelen, and Euwals 2010; Porte-
gijs, Cloın, Ooms, and Eggink 2006), we are not aware of any studies that
have analyzed whether working mothers are indeed happier than non-working
mothers in the Netherlands. Recently, Berger (2012) showed that in Germany
full-time working mothers are more satisfied with their lives than mothers
who are not working due to family reasons and mothers in short part-time
jobs (less than 20 hours per week). On the other hand, Johnson et al. (2012)
found that maternal work accompanied by job stability versus instability and
jobs that do or do not require cognitive skills have differentiated effects for
children’s cognitive and non-cognitive skills.
27
Our findings suggest that a high rate of labor market participation
among mothers of school-aged children is positively related to the cogni-
tive development, provided that mothers work for a substantial number of
hours (at least in a large part-time job). This is an important conclusion,
since research (e.g., Currie and Thomas 2001) has shown that early child
outcomes are good predictors of economic outcomes at later ages.
Moreover, our findings suggest that governments may encourage moth-
ers of school-aged children to re-enter the labor market or increase their
work hours, since maternal employment is positively associated with child
outcomes. Especially in the Netherlands, but also in Germany, mothers do
not usually return to their pre-maternity work hours, even after their chil-
dren are older and start school (Bosch, Deelen, and Euwals 2010; Paull 2008).
From the point of view of children’s cognition, the average work week among
Dutch mothers with school-aged children could be extended like it is in other
European countries.
28
References
Andrabi, T., J. Das, A. Khwaja, and T. Zajonc (2011): “Do value-Added estimates add value? Accounting for learning dynamics,” AmericanEconomic Journal: Applied Economics, 3(3), 29–54.
Aughinbaugh, A., and M. Gittleman (2003): “Does Money Matter? AComparison of the Effect of Income on Child Development in the UnitedStates and Great Britain,” The Journal of Human Resources, 38(2), 416–440.
Baum, C. L. (2003): “Does Early Maternal Employment Harm Child Devel-opment? An Analysis of the Potential Benefits of Leave Taking,” Journalof Labor Economics, 21(2), 381–408.
Berger, E. (2012): “Happy Working Mothers? Investigating the Effect ofMaternal Employment on Life Satisfaction,” Economica.
Bianchi, S. (2000): “Maternal Employment and Time with Children: Dra-matic Change or Surprising Continuity?,” Demography, 37(4), 401–414.
Blau, D. (1999): “The Effect of Income on Child Development,” Review ofEconomics and Statistics, 81(2), 261–276.
Booth, A., and J. Van Ours (2010): “Part-Time Jobs: What WomenWant?,” IZA Discussion Paper 4686.
Bosch, N., A. Deelen, and R. Euwals (2010): “Is Part-time Employ-ment Here to Stay? Working Hours of Dutch Women over SuccessiveGenerations,” Labour, 24(1), 35–54.
Brooks-Gunn, J., W. Han, and J. Waldfogel (2002): “Maternal em-ployment and child cognitive outcomes in the first three years of life: TheNICHD study of early child care,” Child Development, 73(4), 1052–1072.
Brooks-Gunn, J., W.-J. Han, and J. Waldfogel (2010): “VII. Struc-tural equation modeling analyses of the links between 1st-year maternalemployment and child development,” Monographs of the Society for Re-search in Child Development, 75(2), 83–95.
Carneiro, P., C. Meghir, M. Parey, and G. Street (2007): “Ma-ternal education, home environments and the development of children andadolescents,” IZA Discussion Paper 3072, forthcoming in Journal of Euro-pean Economic Association 2012.
29
Cawley, J., and F. Liu (2007): “Mechanisms for the Association betweenMaternal Employment and Child Cognitive Development,” NBER Work-ing Paper 13609.
CBS (2003): Jeugd 2003, cijfers en feiten. CBS.
Currie, J., and D. Thomas (2001): “Early Test Scores, SocioeconomicStatus, School Quality and Future Outcomes,” Research in Labor Eco-nomics, 20, 103–132.
Desai, S., P. Chase-Lansdale, and R. Michael (1989): “Mother ormarket? Effects of maternal employment on the intellectual ability of 4-year-old children,” Demography, 26(4), 545–561.
Ermisch, J., and M. Francesconi (2000): “The Effect of Parents’ Em-ployment on Children’s Educational Attainment,” IZA Discussion Paper215, forthcoming in Journal of Applied Econometrics 2012.
Fouarge, D., and R. Muffels (2008): “Part-Time Work and Childbirthin Europe: Scarring the Career or Meeting Working-Time Preferences?,” inFlexibility and Employment Security in Europe: Labour Markets in Tran-sition, ed. by R. Muffels, pp. 223–254. Edward Elgar, UK: Cheltenham.
Fox, L., W.-J. Han, C. Ruhm, and J. Waldfogel (2013): “Time forChildren: Trends in the Employment Patterns of Parents, 1967-2009.,”Demography, 50, 25–49.
Greenstein, T. N. (1995): “Are the “Most Advantaged” Children TrulyDisadvantaged by Early Maternal Employment?: Effects on Child Cogni-tive Outcomes,” Journal of Family Issues, 16(2), 149–169.
Han, W., J. Waldfogel, and J. Brooks-Gunn (2001): “The effects ofearly maternal employment on later cognitive and behavioral outcomes,”Journal of Marriage and Family, 63(2), 336–354.
Harvey, E. (1999): “Short-Term and Long-Term Effects of Early ParentalEmployment on Children of the National Longitudinal Survey of Youth,”Development Psychology, 35(2), 445–459.
Hill, J., J. Waldfogel, J. Brooks-Gunn, and W. Han (2005): “To-wards a Better Estimate of the Causal Links in Child Policy: the Caseof Maternal Employment and Child Outcomes,” Development Psychology,41(6), 833–850.
30
Johnson, R. C., A. Kalil, and R. E. Dunifon (2012): “EmploymentPatterns of Less-Skilled Workers: Links to Children’s Behavior and Aca-demic Progress,” Demography, pp. 1–26.
Jungbluth, P., and R. Rodigas (2011): “Kleuter in Zuid-Limburg: HoeStaan de Kansen? Regiobrede ‘Nulmeting’ bij de Start van de Zuid-Limburgse Pilot voor Voorschoolse Educatie ‘Moelejaan’,” Discussion pa-per, Maastricht University.
Kornrich, S., and F. Furstenberg (2013): “Investing in Children:Changes in Parental Spending on Children, 1972-2007,” Demography, 50,1–23.
O’Brien, M., and D. Jones (1999): “Children, Parental Employment andEducational Attainment: An English Case Study,” Cambridge Journal ofEconomics, 23(5), 599–621.
Parcel, T., and E. Menaghan (1994): Parents’ Jobs and Children’sLives. Adline de Gruyter, USA: New York.
Paull, G. (2008): “Children and Women’s Hours of Work,” The EconomicJournal, 118(526), F8–F27.
Portegijs, W., M. Cloın, I. Ooms, and E. Eggink (2006): “Hoe hetWerkt met Kinderen. Moeders over Kinderopvang en Werk,” SCP Publi-cation 2006/5.
Rosenzweig, M., and K. Wolpin (1995): “Sisters, Siblings, and Mothers:The Effect of Teen-Age Childbearing on Birth Outcomes in a DynamicFamily Context,” Econometrica, 63(2), 303–326.
Ruhm, C. (2008): “Maternal Employment and Adolescent Development,”Labour Economics, 15(5), 958–983.
Ruhm, C. J. (2004): “Parental Employment and Child Cognitive Develop-ment,” Journal of Human Resources, 39(1), 155–192.
Rutter, M. (1985): “Family and school influences on cognitive develop-ment,” Journal of Child Psychology and Psychiatry, 26(5), 683–704.
Sastry, N., and A. R. Pebley (2010): “Family and neighborhood sourcesof socioeconomic inequality in children’s achievement,” Demography, 47(3),777–800.
31
Todd, P., and K. Wolpin (2007): “The production of cognitive achieve-ment in children: Home, school, and racial test score gaps,” Journal ofHuman capital, 1(1), 91–136.
Vandell, D., and J. Ramanan (1992): “Effects of Early and RecentMaternal Employment on Children from Low-Income Families,” Child De-velopment, 63(4), 938–949.
Zaslow, M., and C. Hayes (1986): “Sex differences in children’s responseto psychosocial stress: Toward a cross-context analysis,” in Advances indevelopmental psychology, ed. by M. Lamb, A. Brown, and B. Rogoff, vol. 4,pp. 285–337. Lawrence Erlbaum, Hillsdale, N.J.
32
Tables and figures
Table 1: Labor force participation and average work hours of mothersby age of youngest child
Nether- United Germany France Spainlands Kingdom
Labor force participation (%)0-4 years old 72 60 44 62 535-9 years old 74 75 65 74 5510-14 years old 75 79 74 75 54
Average work week (hours)0-4 years old 22 25 24 32 315-9 years old 20 25 22 32 3210-14 years old 21 28 23 32 32
Source: EU LFS 2005Note: Average work hours are calculated among the working mothers.
Table 2: Sample size per tests and children’s gender
Sample forLanguage outcomes Sorting outcomes Total sample
Total 2260 1895 2315Girls 1125 943 1153Boys 1135 952 1162
Note: As we do not have both type of test scores for each child, the twosamples relating to child outcomes differ in size. Every child who is inthe sample for the time investments, is part of either the language or thesorting sample as well.
33
Table 3: Summary statistics of raw test scores year2
N Mean Sd. Dev Min. Max.Language test 2260 47.4 5.4 21 56
Note: This table reports the number of good answers in the lan-guage and sorting test. The total number of questions in the lan-guage test equals 56, the total number of questions in the sortingtest equals 42.
Figure 1: Parental work status
0 .2 .4 .6 .8 1Fraction
No paid work
Small part−time job
Large part−time job
Full−time job
Mother Father
34
Figure 2: Distribution of joint parent-child activities
(a) Joint daily activities
0.1
.2.3
2 4 6 8 10 12Number of joint daily activities
(b) Joint planned activities
0.1
.2.3
.40 2 4 6 8
Number of joint planned activities
Figure 3: Distribution of language test score by maternal work status andgender
0.2
.4.6
−6 −4 −2 0 2 −6 −4 −2 0 2
Girls Boys
No paid job Small part−time job
Large part−time job Full−time job
Language test score (std)
35
Figure 4: Distribution of sorting test score by maternal work status andgender
0.5
−4 −2 0 2 −4 −2 0 2
Girls Boys
No paid job Small part−time job
Large part−time job Full−time job
Sorting test score (std)
36
Table 4: OLS results on the language test in the second school year
Girls BoysDep. Var.: Language test score year 2 (std) (1) (2) (3) (4)Small part-time job 0.104 0.090 0.052 0.049
Note: all specifications include mother, father, child, household characteristics as well as parental valuesand parenting goals. Standard errors in parentheses; * p<0.1; ** p<0.05; *** p<0.01.
37
Table 5: OLS results on the sorting test in the second school year
Girls BoysDep. Var.: Sorting test score year 2 (std) (1) (2) (3) (4)Small part-time job -0.042 -0.038 0.200 0.190
Note: all specifications include mother, father, child, household characteristics as well as parental valuesand parenting goals. Standard errors in parentheses; * p<0.1; ** p<0.05; *** p<0.01.
38
Appendix
Descriptives
39
Figure 5: Distribution of test scores for sample and population0
.02
.04
.06
.08
.1K
dens
ity te
st s
core
20 30 40 50 60Language test score
Sample All
(a) Language test
0.0
2.0
4.0
6.0
8.1
Kde
nsity
test
sco
re
10 20 30 40Sorting test score
Sample All
(b) Sorting test
40
Table 6: Summary statistics of raw test scores year1
N Mean Sd. Dev Min. Max.Language test 2260 38.5 5.2 15 48
Note: This table reports the number of good answers in the lan-guage and sorting test in the first school year. The total numberof questions in the language test equals 48, the total number ofquestions in the sorting test equals 42.
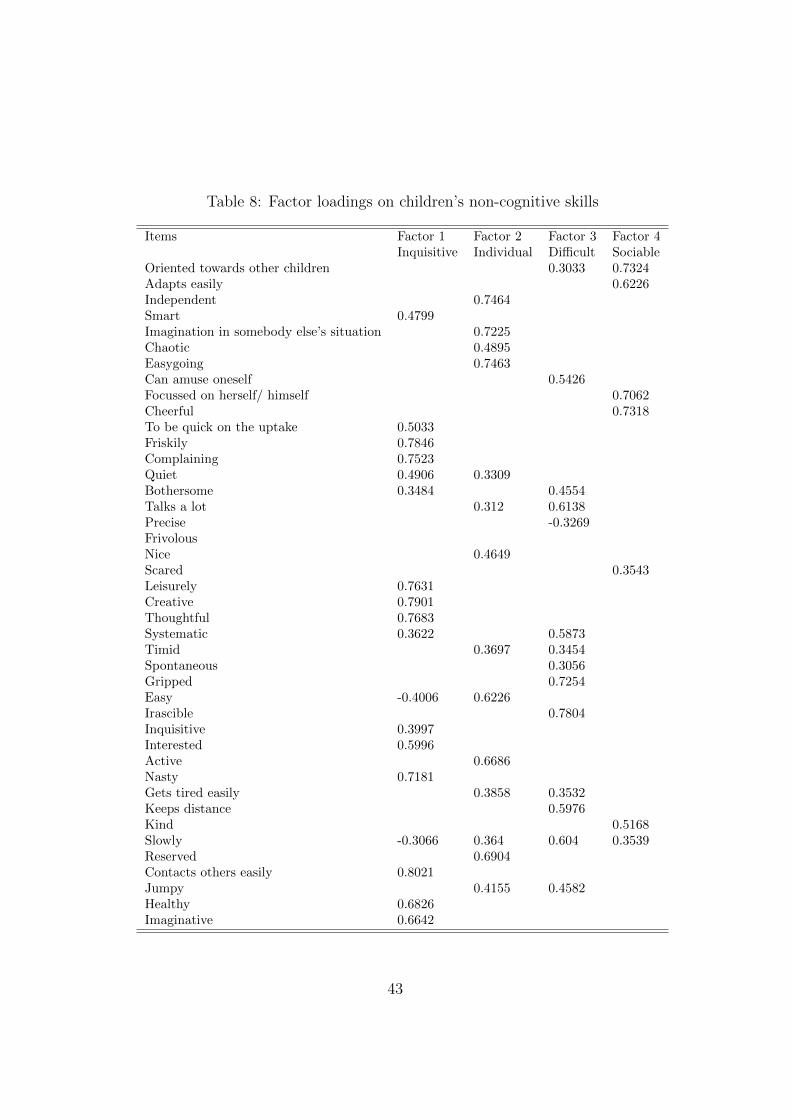
Table 7: Summary statistics of control variables by gender of child
N Mean Std. Dev. Min MaxEducation level mother 2315 6.39 2.22 0 9Year of birth mother 2315 1971 3.89 1960 1998Mother speaks Dutch with the child 2315 0.95 0.22 0 1Education level father 2315 6.51 2.36 0 9Year of birth father 2315 1969 4.06 1959 1985Father speaks Dutch with the child 2315 0.95 0.22 0 1Gender 2315 0.50 0.50 0 1Number of children living in the household 2315 3.09 0.71 1 7Are there any grandmoms/dads living in the household? 2273 0.01 0.09 0 1Are there any aunts/uncles living in the household? 2214 0.00 0.04 0 1Are there any other adults living in the household? 2212 0.00 0.06 0 1Cohort 2315 2.48 0.50 2 3Child speaks Dutch with friends 2315 0.99 0.11 0 1Did a fundamental event occur that affected 2315 0.06 0.23 0 1child’s development?Extent to which child has difficulties with emotions 2290 0.19 0.45 0 3Extent to which child has difficulties with concentration 2291 0.29 0.56 0 3Extent to which child has difficulties with behavior 2289 0.15 0.40 0 3Extent to which child has difficulties with dealing 2278 0.07 0.30 0 3with other people
Note: Whereas the sample size is 2315, some variables in the table have lower numbers of observations.This is due to missing values. In the analyses, we include dummy variables for all possible values ofthese values, including a dummy for missing values. Other control variables not mentioned in the tableare standardized (factor) variables with mean equal to zero and a standard deviation equal to one.It concerns parental views, parenting goals, and the four noncognitive skills (inquisitive, individual,difficult and sociable). Moreover, the table excludes summary statistics on mothers’, fathers’ andchildren’s religion as we include several religion dummies that are not so informative.
41
Factor analyses
42
Table 8: Factor loadings on children’s non-cognitive skills
Oriented towards other children 0.3033 0.7324Adapts easily 0.6226Independent 0.7464Smart 0.4799Imagination in somebody else’s situation 0.7225Chaotic 0.4895Easygoing 0.7463Can amuse oneself 0.5426Focussed on herself/ himself 0.7062Cheerful 0.7318To be quick on the uptake 0.5033Friskily 0.7846Complaining 0.7523Quiet 0.4906 0.3309Bothersome 0.3484 0.4554Talks a lot 0.312 0.6138Precise -0.3269FrivolousNice 0.4649Scared 0.3543Leisurely 0.7631Creative 0.7901Thoughtful 0.7683Systematic 0.3622 0.5873Timid 0.3697 0.3454Spontaneous 0.3056Gripped 0.7254Easy -0.4006 0.6226Irascible 0.7804Inquisitive 0.3997Interested 0.5996Active 0.6686Nasty 0.7181Gets tired easily 0.3858 0.3532Keeps distance 0.5976Kind 0.5168Slowly -0.3066 0.364 0.604 0.3539Reserved 0.6904Contacts others easily 0.8021Jumpy 0.4155 0.4582Healthy 0.6826Imaginative 0.6642
43
Table 9: Factor loadings on parental views
Factor 1To what extent do you agree/disagree to the following statements: Parental viewsGoing to college is more important for boys than for girls. 0.2290Marriage is old-fashion. 0.0276Our children will have a better life than we have . 0.3506Home work is at least as satisfying as is paid work. 0.2072Men are often better politicians than women. 0.5067Children need a family with both a mother and a father. 0.2267Religion is very important to me. 0.2360I am jealous at the opportunities of the youngest generation. 0.3122Children need to be prepared to school at an early stage. 0.2871Early child care is important for children’s development. 0.0754It is important that children do well at school. 0.4049Women are allowed to be mother without a stable relationship. -0.2948Men do mostly a better job in managing occupations. 0.5449My child needs to go to a school nearby. 0.1287I assume that our children will have a better life than we have. 0.2966At school children should have to work hard. 0.3635
Table 10: Factor loadings on parenting goals
Factor 1How important is it to you that your child learns: Parenting goalsto be economical 0.4436to know what is going on in the world 0.4309to be hardworking 0.3737to stand one’s ground 0.4038to take time for her/hisself 0.6110to fight for her/hisself 0.5967to develop imagination 0.5304to indulge her/hisself 0.5629to be tolerant towards others’ opinions 0.5792to be independent 0.5575to not let her/hisself be rushed 0.6073to be satisfied with what she/he has 0.6081to show persistence 0.5884to be religious 0.2766to show solidarity 0.5129to obey 0.4628
44
Robustness analyses
Table 11: Robustness checks
Girls BoysPT small PT large FT PT small PT large FT
SortingBasic value added model -0.029 0.176** 0.062 0.192 0.033 0.297***
Note: Each row reports estimation results of one specification, separately for girls and boys. The two models areexplained in Section 3. All specifications include mother, father, child, household characteristics as well as parentalvalues and parenting goals. Standard errors in parentheses; * p<0.1; ** p<0.05; *** p<0.01.