This discussion paper is/has been under review for the journal The Cryosphere (TC).Please refer to the corresponding final paper in TC if available.
The relation between sea ice thicknessand freeboard in the ArcticV. Alexandrov1,2, S. Sandven2,3, J. Wahlin2, and O. M. Johannessen2
1Nansen International Environmental and Remote Sensing Center (NIERSC),14th Line of Vasilevsky Island, 7, office 49, 199034, St. Petersburg, Russia2Nansen Environmental and Remote Sensing Center (NERSC), Thormoehlensgate 47,5006, Bergen, Norway3Department of Arctic Geophysics, University of Svalbard (UNIS), 9171,Longyearbyen, Norway
Received: 30 March 2010 – Accepted: 14 April 2010 – Published: 22 April 2010
Retrieval of Arctic sea ice thickness from radar altimeter freeboard data, to be pro-vided by CryoSat-2, requires observational data to verify the relation between the twovariables. In this study in-situ ice and snow data from 689 observation sites obtainedduring the Sever expeditions in the 1980s have been used to establish an empirical re-5
lation between ice thickness and freeboard. Estimates of mean and variability of snowdepth, snow density and ice density were produced based on many field observations,and have been used in the isostatic equilibrium equation to estimate ice thickness asa function of ice freeboard, snow depth and snow/ice density. The accuracy of the icethickness retrieval has been calculated from the estimated variability in ice and snow10
parameters and error of ice freeboard measurements. It is found that uncertainties ofice density and freeboard are the major sources of error in ice thickness calculation.For FY ice, retrieval of ≈1.0 m (2.0 m) thickness has an uncertainty of 60% (41%). ForMY ice the main uncertainty is ice density error, since the freeboard error is relativelysmaller than for FY ice. Retrieval of 2.4 m (3.0 m) thick MY ice has an error of 24%15
(21%). The freeboard error is ±0.05 m for both the FY and MY ice. If the freeboarderror can be reduced to 0.01 m by averaging a large number of measurements fromCryoSat, the error in thickness retrieval is reduced to about 32% for a 1.0 m thick FYfloe and to about 18% for a 2.3 m thick MY floe. The remaining error is dominated byuncertainty in ice density. Provision of improved ice density data is therefore important20
for accurate retrieval of ice thickness from CryoSat data.
1 Introduction
Satellite altimeter data can provide extensive spatial and temporal measurements ofsea ice thickness through converting the ice freeboard measurements to thickness byassuming isostatic equilibrium (Laxon, 1994; Laxon et al., 2003; Giles et al., 2008;25
Kwok et al., 2009). Analysis of ERS and Envisat radar altimeter (RA) data from 1992to present have resulted in a unique data set on ice thickness south of 81.5◦ N, showing
a significant thinning of the ice cover from 2007 to 2008 (Giles et al., 2008). The icethickness estimates represent monthly mean values in typically 100×100-km grid withan expected error of 0.04–0.06 m (Miller et al., 2006). These ERS/Envisat sea-icethickness time series will be extended by CryoSat-2, whose major objectives includemeasuring ice thickness over most of the Arctic over a period of five years. CryoSat-25
was launched in March 2010 and carries a beam-limited radar altimeter (RA) operatingin Synthetic Aperture Radar mode over sea ice, providing freeboard measurementswith 250 m resolution along the satellite track (ESA, 2003).
Snow depth, snow density and ice density have a strong impact on the sea icebuoyancy and the ice freeboard. Since the ice freeboard has to be multiplied by a factor10
that can be up to 10 for calculation of thickness, small errors in the input data lead tolarge errors in the ice thickness estimates (Rothrock, 1986). Another uncertainty is theassumption that radar echo originates from the snow/ice interface (Beaven, 1995), andpossible effects of layers in the snow cover and temperature variations are not takeninto account (Giles and Hvidegaard, 2006). Recent studies by Connor et al. (2009),15
where coincident laser altimeter (LA) and RA measurements of sea ice are available,show that the radar signals are reflected from ice/snow interface, while the laser signalsare reflected from the top of the snow cover.
Studies have been done to estimate ice thickness from the IceSat LA data, showingthat the ice thickness has decreased significantly from 2007 to 2008, which is in agree-20
ment with analysis of RA data from Envisat (Kwok et al., 2009). Ideally, LA and RAdata should be collected simultaneously in order to obtain direct estimates of the snowdepth, as demonstrated in airborne campaigns (Leuschen and Raney, 2005; Connoret al., 2009). Simultaneous LA and RA satellite sensors are not planned during theCryoSat mission, thus snow data on Arctic sea ice need to be obtained from climato-25
logical estimates as well as from new field observations.Use of the isostatic equilibrium equation to estimate ice thickness from freeboard
data requires data on snow and ice density as well as snow depth, which exhibitregional and season variability. Climatological snow cover data from Russian North
Pole drifting stations have been provided by Warren et al. (1999), but there are few datasets available that provide statistics on snow and ice density, snow depth, ice freeboardand thickness over large parts of the Arctic ice cover. Therefore, the main objective ofthis paper is to investigate the relation between ice freeboard and ice thickness usingextensive in-situ measurements from Arctic field expeditions. First, an empirical re-5
lation between the ice thickness and freeboard is derived from direct measurementsduring the Sever expeditions in the 1980s. Furthermore, data on snow and ice densi-ties from literature are reviewed and error estimates are derived. These data are usedin the isostatic equilibrium equation to assess the dependencies between thicknessand freeboard for first-year (FY) and multiyear (MY) ice. Finally, the error sources in10
ice thickness retrieval from freeboard measurements are discussed and recommenda-tions for in-situ observations in forthcoming CryoSat post-launch calibration-validationexperiments are provided.
2 Ice thickness and freeboard data from the Sever expeditions
In-situ measurements of Arctic sea ice from the airborne Sever expeditions provide one15
of the most extensive data sets of sea ice and snow parameters collected over manyyears including 1928, 1937, 1941, 1948–1952, and 1954–1993 (Romanov, 1995). Thetotal data set includes 3771 landings, here obtained from the World Data Center forGlaciology/National Snow and Ice Data Center (NSIDC), Boulder, Colorado. In thisstudy co-located observations of ice thickness, ice freeboard and snow depth are ex-20
tracted from this data set and used to establish an empirical relation between theseparameters. The Sever expeditions took place mainly from mid March to early May,when landing on ice floes was possible, such that all data represent late winter condi-tions before melting starts. At each landing point ice and snow thickness were mea-sured by drilling holes at 3–5 locations 150–200 m apart on the level ice where the25
runway was located. In addition, measurements were made at 10–20 sites on adjacentice floes which included deformed ice (Romanov, 1995). Ice freeboard measurementswere obtained only in a subset of the total data set from the Sever expeditions. In this
study data from 689 landings in the period February–May of 1980–1982, 1984–1986,and 1988 have been used where freeboard measurements were included.
The data from the 689 landings were divided in two groups, the so-called runwaydata and the off-runway data. The former represents level ice and the latter can in-clude ridges and various types of deformed and level ice located around the level ice.5
The freeboard data were obtained only on the level ice, so data from the surroundingice could not be used to study the ice thickness-freeboard relation. The data span theentire Eurasian Russian Arctic (Fig. 1a), where FY ice is prevalent. The yardstick mea-surement accuracy of the ice thickness, freeboard and snow depth is 0.01 m. Compar-ison of ice thickness and snow depth between runway and off-runway data shows that10
the former has thinner ice with less snow cover than the latter. The modal ice thick-ness for the runway data is about 0.7 m, while it is more than 1 m for the off-runwaydata. Maximum thickness is about 2.60 m for the runway data and about 3.50 m for theoff-runway data (Fig. 1b).
A scatterplot of ice thickness versus freeboard height is presented in Fig. 1c, show-15
ing a linear increase in thickness vs. freeboard. There is however significant spread inthe ice thickness for each freeboard value, with mean standard deviation of ±0.20 m.For freeboard below 0.15 m there are more than 30 data points (N) for each freeboardinterval. From 0.15 to 0.20 m, N decreases to less than 10 per interval. A few free-board measurements above 0.20 m were collected, but these data were not included20
because there were only 2–3 data points in each interval. A linear regression equation,specifying the empirical relation between freeboard (Fi ) and average thickness (Hi ), isthe following:
Hi =8.13Fi +0.37. (1)
A modal freeboard of 0.1 m corresponds to ice thickness of 1.18±0.20 m, using the25
mean standard deviation as the uncertainty estimate. This relation is based on FY icein the period March–May. The snow depth on the runway is less than 0.20 m in morethan 95% of cases, while it can be up to 0.40 m in the off-runway data. The difference in
snow depth between FY and MY ice will have impact on the relation between freeboardand thickness. Equation (1) is applicable for level FY ice, and need to be modified fordeformed FY and MY ice.
3 Snow and ice data
3.1 Snow depth and density5
Snow depth on the Arctic sea ice increases from a minimum in July–August to a maxi-mum in April–May before the onset of summer melt (Radionov et al., 1996; Warren etal., 1999). On MY ice in the Central Arctic the snow depth is 0.35 m in May with anuncertainty of 0.06 m (Loshchilov, 1964; Warren et al., 1999). The snow depth on levelFY ice is much smaller, typically between 0.05 m for ice thinner than 1.60 m and 0.08 m10
for thicker ice (Romanov, 1995). Data from the Sever expeditions show a median snowdepth on runways of 0.05 m. The uncertainty of the snow depth is also 0.05 m. Thedensity of snow on MY ice in March–May is in the range of 310–320 kg m−3 (Romanov,1995; Warren et al., 1999). The average and standard deviation of snow density onFY ice, calculated from the Sever data, is 324±50 kg m−3. The difference in snow15
properties between MY and FY ice is therefore related to snow depth and not to snowdensity.
3.2 Ice density
The density of gas-free sea ice can vary from 919 to 974 kg m−3 depending on thesalinity (Cox and Weeks, 1982). The most important factor determining the ice density20
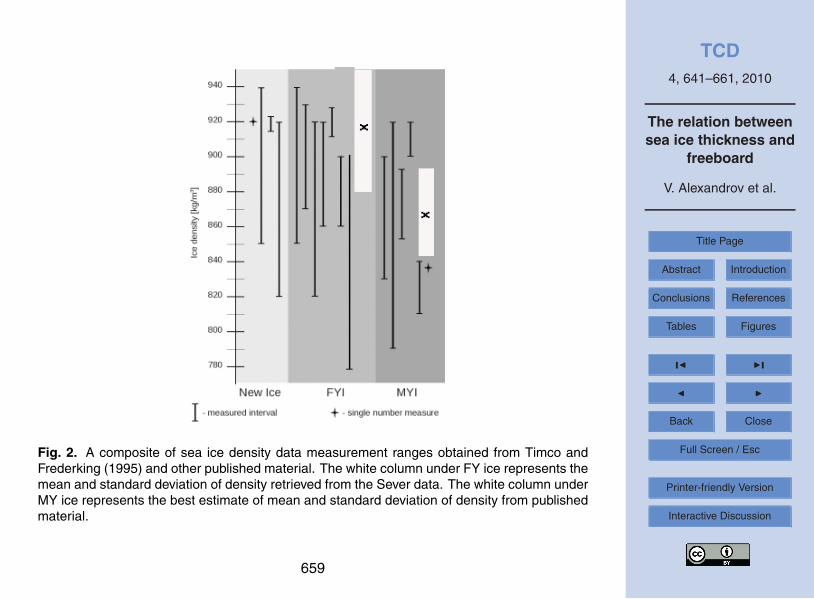
is the content of air bubbles (Schwerdtfeger, 1963; Wadhams, 2000), which can re-duce the density to 840 kg m−3 in normal sea ice and to 770 kg m−3 in infiltrated snowice (Weeks, 1976). Figure 2 shows a composite of ice density values for thin, FY andMY ice (Malmgren, 1927; Mobley et al., 1998; Kubishkin and Skutina, 2004; Schul-son et al., 2006). The density values can vary significantly, and the methods used25
to estimate the densities have impact on the results. The following four methods canbe used to estimate ice density: (i) measurement of mass and volume of a given icebody, (ii) displacement (submersion) technique, (iii) specific gravity technique and, (iv)freeboard-thickness technique (Timco and Frederking, 1996). Each of the methods hasadvantages and limitations. The freeboard-thickness method used in this study to cal-5
culate density is based on the isostatic equilibrium equation, where input data are icethickness (Hi ), ice freeboard (Fi ) snow depth (Hsn) and snow density (ρsn=324 kg m−3)from the Sever data. Water density ρw is set to 1025 kg m−3:
ρi =ρw−ρwFi +ρsnHsn
Hi. (2)
The mean of the estimated ice density for FY ice is 916.7±35.7 kg m−3. This technique10
is based on the assumption that the ice is in isostatic equilibrium. By averaging manymeasurements over a large area, the isostatic assumption should be valid, but on alocal scale this may not be the case.
Timco and Frederking (1996) reported that FY ice density is typically between 840and 910 kg m−3, while MY ice density is between 720 and 910 kg m−3. Densities of15
MY and FY ice samples taken below the waterline are not significantly different, andboth ice types have typical values between 900 and 940 kg m−3. For samples takenabove the waterline, the MY ice has significantly lower density than FY ice. However,data reported by Khohlov (1978) show that the average density of the MY ice abovethe waterline is typically between 500–600 kg m−3. This difference is mainly due to the20
higher volume of air-filled pores in MY ice compared to FY ice (Onstott, 1992; Eickenet al., 1995). In this study we use a density of 550 kg m−3 for the upper layer (ρu)using the data from Khohlov (1978) and a value of 920 kg m−3 for the lower layer (ρl)to calculate an averaged weighed value for the MY ice density:
ρmy =ρl(1−Fi/Hi
)+ρuFi
/Hi . (3)25
By inserting density values for the upper and lower layers, using typical freeboard
(0.3 m) and thickness data (2.9 m) for MY ice, the bulk density of MY ice becomes882±23 kg m−3. The uncertainty was calculated from uncertainties of the density in theupper and lower layers. During winter, seawater density in the major part of the ArcticOcean varies from 1024 to 1027 kg m−3 (Gorshkov, 1980; Timokhov and Tanis, 1997;Pavlov, 1998). In our calculations seawater density is 1025±0.5 kg m−3.5
4 Error estimates in ice thickness retrieval under isostatic equilibriumassumption
Assuming that sea ice is in isostatic equilibrium with water, ice thickness can be calcu-lated from the following equation where all variables on the right side have prescribedvalues:10
Hi =ρw
(ρw−ρi )Fi +
ρsn
(ρw−ρi )Hsn . (4)
The values of ρw, ρi , ρsn, and Hsn are based on statistics from many observations,while freeboard (Fi ) is a variable with values between 0.01 and 0.20 m for FY ice andfrom 0.21 to 0.50 m for MY ice. Under the assumption that the uncertainties are uncor-related, the error of ice thickness estimates (ε2
r ) calculated from RA measurements of15
ice freeboard is given by (Giles et al., 2007):
ε2r =ε2
F i
(ρw
(ρw−ρi )
)2
+ε2Hsn
(ρsn
(ρw−ρi )
)2
+ε2ρsn
(Hsn
(ρw−ρi )
)2
+ε2ρw
(Fi
(ρw−ρi )−
Fiρw
(ρw−ρi )2−
Hsnρsn
(ρw−ρi )2
)2
+ε2ρi
(Fiρw
(ρw−ρi )2+
Hsnρsn
(ρw−ρi )2
)2
, (5)
where ερi, ερw
, ερsnare the uncertainties in the density of ice, water and snow, εHsn
is the uncertainty in the snow height, and εFi is the uncertainty in the ice freeboard,20
assumed to be measured by RA. Typical values and uncertainties of ice freeboard648
(Tonboe et al., 2009), seawater, snow and snow and sea ice parameters, estimated inSect. 3, are presented in Table 1.
After substituting the typical values of snow, ice, and water parameters in the isostaticequilibrium equation, ice thickness is given as a linear function of freeboard for FY iceby:5
Hi =9.46Fi +0.15, (6)
and for MY ice by:
Hi =6.24Fi +1.07. (7)
The uncertainty values in Table 1 are inserted in the error Eq. (5), and the resultsare presented in Fig. 3, where the error in ice thickness retrieval is plotted as a func-10
tion of freeboard. It is found that uncertainties of ice density and freeboard measure-ment are the major sources of error in the ice thickness calculation, while the errorin snow depth is small. The influence of changes in snow and seawater densities isinsignificant. For FY ice the error in thickness retrieval is dominated by the freeboarderror for thin ice, while the effect of the ice density uncertainty increases as the free-15
board increases. The thickness of FY ice with a freeboard of 0.10 m is 1.10±0.61 m(error≈55%), whereas a freeboard of 0.20 m gives a thickness of 2.04±0.84 m (er-ror≈40%). For MY ice, freeboards of 0.21 and 0.30 m give thicknesses of 2.38±0.56 m(error≈24%) and 2.94±0.61 m (error≈21%), respectively. The calculations are basedon a freeboard error of 0.05 m. As the freeboard increases, the ice density error be-20
comes the dominant error term in the thickness retrieval.The error in thickness retrieval is smaller for MY ice compared to FY ice for two
reasons: (1) the relative error in freeboard measurement is smaller for MY ice thanFY ice, and (2) the uncertainty in ice density is smaller for MY ice compared to FY icebased on the data in Table 1. However, the error in MY density is not well documented.25
As discussed in Fig. 2, the FY ice density used in the error analysis is assumed to bein the upper range of typical values. If we include both level and deformed ice the FYdensity is expected to become lower.
The error estimates shown in Fig. 3 are valid for the late winter period (March–May).The snow depth and ice density have strong seasonal variability, so the error estimateswill be different for the other seasons.
5 Comparison with other relations between ice thickness and freeboard
The relation between ice thickness and freeboard has been investigated by Mironov5
and Sen’ko (1995), who analyzed measurements of ice thickness, ice draft, snow depthand density from the North Pole-29 drifting station collecting data across the ArcticOcean from June 1987 to August 1988. They established the following relations:
Hi =11.0Fi −0.12 (8)
for FY ice in the period from October to May, and10
Hi =15.29Fi −0.657, (9)
for MY ice in the period December to May.By analyzing airborne lidar data and submarine sonar data, Wadhams (1992, 2000)
has found an empirical relation between the freeboard and draft of thick MY ice northof Greenland, which corresponds to the following relation between thickness and free-15
board:
Hi =9.04Fi . (10)
The relation used by Laxon et al. (2003) and Giles et al. (2007, 2008), is based onprescribed values of water and ice densities and snow loading climatology from Warrenet al. (1999) and is given by:20
Hi =9.42Fi +0.88. (11)
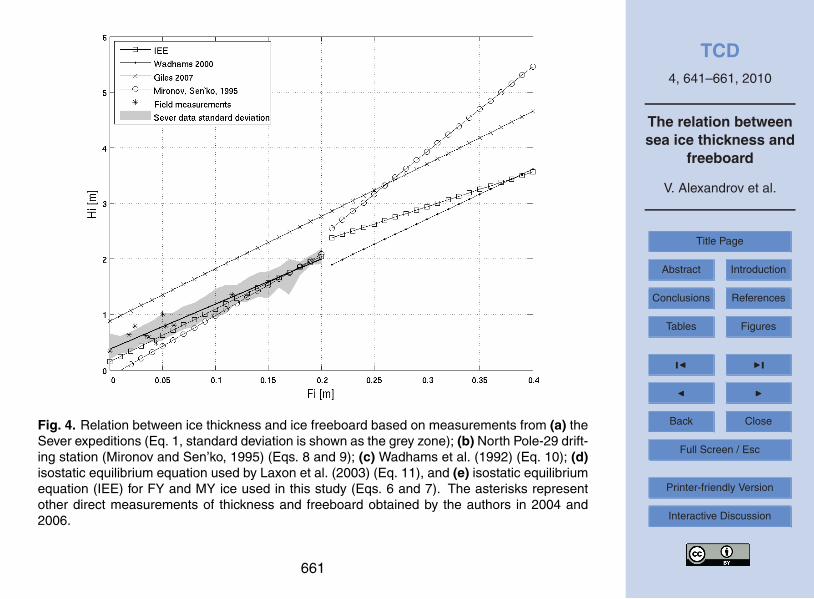
The relations in Eqs. (1), (6)–(11), combined with direct measurements of thicknessand freeboard from some recent expeditions, are presented in Fig. 4. The curves
show calculated ice thickness for given freeboard values up to 0.5 m. The Sever dataare marked by the black line representing the linear regression Eq. (1) as well as agrey zone corresponding to ±1 standard deviation. The asterisks indicate individualmeasurements during the expeditions in the Barents Sea area onboard R/V Lance in2004 and R/V M. Somov in 2006.5
There is significant spread in the relations, implying that the calculation of ice thick-ness from freeboard data depends on which relation is used and on errors in the dataused to establish the relations. For FY ice there is reasonable agreement between allthe data sets and empirical relations, except the relation used by Giles et al. (2007).For example, a freeboard measurement of 0.10 m corresponds to a thickness estimate10
of 1.18±0.2 m, using mean and standard deviation of the Sever data. When the effectof uncertainty in freeboard measurement is included, say ±0.05 m, the overall error inthickness retrieval will be about ±0.5 m. This is in agreement with the error analysisbased on Eq. (5).
For MY ice there is more spread between the relations. Since there is no data anal-15
ysis behind the comparison, it is difficult to assess the validity of the various relations.The relation by Wadhams et al. (1992) is based on data north of Greenland where theMY ice is heavily deformed, while the relation by Mironov and Sen’ko (1995) is basedon data from the Central Arctic where ice is less deformed. Estimation of thicknessfrom a freeboard of 0.3 m gives 3.93 m according to Eq. (9). This estimate seems to20
be in the upper range of expected values. If Eq. (7) is assumed to be more realisticand the effect of an uncertainty in freeboard measurement of ±0.05 m is included, thethickness retrieval will be 2.94±0.61 m.
6 Conclusions
In this study the technique of ice thickness retrieval from freeboard measurements,25
which will be provided by the CryoSat RA, has been validated and developed usingin-situ data from field expeditions and other published results. The empirical relation,
derived from measurements on 689 sites in the period March–May, allows calculatingFY ice thickness from freeboard values in the range of 0.01–0.20 m. Analysis of theSever data revealed that the average snow depth on the FY ice is 0.05 m, which issignificantly less than that on MY ice. Snow density was 324±50 kg m−3, which is ingood agreement with other studies including both FY and MY ice.5
Data on snow and ice density have been reviewed in order to estimate mean valuesand typical variability for assessment of errors in thickness retrieval from freeboarddata. The density of level FY ice was estimated to be 916.7±35.7 kg m−3, using theisostatic equilibrium equation and the Sever data. This estimate is in the upper partof the density range for FY ice according to the published results. The density of10
MY ice, calculated as the weighted average of its upper and lower layers, decreasesfrom 887 to 876 kg m−3 with increase of its thickness from 2.4 to 4.2 m. Results fromprevious studies show that FY ice density has realistic values between 840 kg m−3 and910 kg m−3, while MY ice covers a wider range from 720 kg m−3 to 910 kg m−3 (Timcoand Frederking, 1995).15
The mean values and uncertainties of snow depth, and ice and snow densities, de-termined for FY ice and MY ice, were used to calculate the total error in ice thicknessretrievals from freeboard measurements using the isostatic equilibrium equation. Theuncertainties in snow depth have much less impact on the thickness retrieval thanthose in ice density and freeboard, using estimates representing late winter conditions20
(March–May). The ice density error increases with increasing freeboard, while the errorin freeboard is nearly constant. Uncertainties of thickness retrieval amount to ≈60% for≈1.0 m thick FY ice and to ≈24% for ≈2.4 m thick MY ice. If the MY thickness increasesto ≈3.0 m the error is reduced to ≈21%. These estimates are based on a ±0.05 m errorin the freeboard data. The error in freeboard measurements is the main uncertainty25
factor for FY ice thinner than 1.5 m, while ice density becomes the main error sourcefor thicker FY ice and all MY ice. If the freeboard error can be reduced to 0.01 m, theerror in thickness retrieval is reduced to about 32% for a 1.0 m thick FY floe and toabout 18% for a 2.3 m thick MY floe.
A synthesis of investigated relations between ice freeboard and thickness has beenestablished based on direct measurements from several field campaigns. There is ageneral linear increase in thickness as function of freeboard, but the spread of therelations is significant. For FY ice the relations are fairly consistent, whereas for MYice there are inconsistencies among several of them. These relations are based on5
data obtained in different parts of the Arctic, where the amount and size of ridgessignificantly vary. Further studies are needed to clarify the freeboard-thickness relationfor MY ice, which implies that more data on freeboard, thickness, density and snowcover need to be collected.
The results of the error analysis of the freeboard-thickness relation are directly ap-10
plicable to the retrieval of ice thickness from IceSat and CryoSat altimeter data. Thepresent analysis is based on data for the winter months only, and similar analysesshould be conducted for the other seasons. There is general lack of in-situ snow andice measurements in the Arctic, and new observing systems are therefore needed toprovide data for validation of the ice thickness retrievals from CryoSat, expected to be15
in operation for five years from 2010.
Acknowledgements. This work was supported by the EU FP6 project DAMOCLES (DevelopingArctic Modelling and Observing Capabilities for Long-term Environment Studies, no. 018509),the Research Council of Norway (project No. 178916/S30 Ice-ocean-atmosphere research inSvalbard using satellite and field data – promotion of Russian and Norwegian PhD cooper-20
ation), and the ESA Prodex project “CryoSat sea ice validation and process studies in theEuropean Arctic” (contract No. C90318). The Sever data are provided by World Data Centerfor Glaciology/National Snow and Ice Data Center, University of Colorado, Boulder, Colorado.
References
Beaven, S. G., Lockhart, G. L., Gogineni, S. P., Hosseinmostafa, A. R., Jezek, K., Gow, A. J.,25
Perovich, D. K., Fung, A. K., and Tjuatja, S.: Laboratory measurements of radar backscatterfrom bare and snow-covered saline ice sheets, Int. J. Remote Sens., 16(5), 851–876, 1995.
Connor, L. N., Laxon, S. W., Ridout, A. L., Krabill, W. B., and McAdoo, D. C.: Comparison ofEnvisat radar and airborne laser altimeter measurements over Arctic sea ice, Remote Sens.Environ., 113, 563–570, 2009.
Cox, G. F. N. and Weeks, W. F.: Equations for determining the gas and brine volumes in seaice samples, CRREL Report 82–30, Hanover, NH, 1982.5
Eicken, H., Lensu, M., Lepparanta, M., Tucker, W. B., Gow, A. J., and Salmela, O.: Thickness,structure and properties of level summer multiyear ice in the Eurasian sector of the ArcticOcean, J. Geophys. Res., 100, 22697–22710, 1995.
ESA: CryoSat Science Report, ESA SP-1272, 56 pp., 2003.Giles, K. A. and Hvidegaard, S. M.: Comparison of spaceborne radar altimetry and airborne10
laser altimetry over sea ice in the Fram Strait, Int. J. Remote Sens., 27(15), 3105–3113,2006.
Giles, K. A., Laxon, S. W., Wingham, D. J., Wallis, D. W., Krabill, W. B., Leuschen, C. J.,McAdoo, D., Manizade, S. S., and Raney, R. K.: Combined airborne laser and radar altimetermeasurements over the Fram Strait in May 2002, Remote Sens. Environ., 111, 182–194,15
2007.Giles, K. A., Laxon, S. W., and Ridout, A. L.: Circumpolar thinning of Arctic sea
ice following the 2007 record ice extent minimum, Geophys. Res. Lett., 35, L22502,doi:10.1029/2008GL035710, 2008.
Gorshkov, S. G. (Ed.): Atlas of the oceans. The Arctic Ocean, USSR Navy Publishing House,20
1980 (in Russian).Khohlov, G. P.: Physico-chemical characteristics of the upper layers of different sea ice types
in the area near of “NP-22” drifting station, Trudy Arkticheskogo i Antarkticheskogo Instituta,359, 4–12, 1978 (in Russian).
Kubishkin, N. V. and Skutina, Y. A.: Changes of temperature, salinity, and density of level sea25
ice in spring period according to expedition studies in the Pechora Sea, Trudy Arkticheskogoi Antarkticheskogo Instituta, 449, 104–123, 2004 (in Russian).
Kwok, R., Cunningham, G. F., Wensnahan, M., Rigor, I., Zwally, H. J.. and Yi, D.: Thinning andvolume loss of the Arctic Ocean sea ice cover: 2003–2008, J. Geophys. Res., 114, C07005,doi:10.1029/2009JC005312, 2009.30
Laxon, S. W.: Sea ice altimeter processing scheme at the EODC, Int. J. Remote Sens., 15(4),915–924, 1994.
Laxon, S. W., Peacock, N., and Smith, D.: High interannual variability of sea ice thickness inthe Arctic region, Nature, 425, 947–949, 2003.
Leuschen, C. J. and Raney, R. K.: Initial results of data collection by the APL D2P Radar5
Altimeter over land and sea ice, J. Hopkins APL Tech. D., 26, 114–122, 2005.Loshchilov, V. S.: Snow cover on the ice of the central Arctic, Problemy Arktiki i Antarktiki, 17,
36–45, 1964 (in Russian).Malmgren, F.: On the properties of sea-ice, in: The Norwegian North polar expedition with
the “Maud” 1918–1925, A/s John Griegs Boktrykkeri, Bergen, Scientific results, 1(5), 1–67,10
1927.Miller, P. A., Laxon, S. W., Feltham, D. L., and Cresswell, D. J.: Optimization of sea ice model;
using basinwide observations of Arctic sea ice thickness, extent and velocity, J. Climate, 19,1089–1108, 2006.
Mironov, Y. U. and Sen’ko, N. P.: About relation between ice thickness and ice draft, Trudy15
Arkticheskogo I Antarkticheskogo Instituta, 435, 47–54, 1995 (in Russian).Mobley, C. D., Cota, G. F., Grenfell, T. C., Maffione, R. A., Scott Pegau, W., and Perovich, D. K.:
Modeling light propagation in sea ice, IEEE T. Geosci. Remote, 36(5), 1743–1749, 1998.Onstott, R. G.: SAR and scatterometer signatures of sea ice, in: Microwave Remote Sensing
of Sea Ice, Geophysical Monograph No. 68, American Geophysical Union, Washington DC,20
73–104, 1992.Pavlov, V. K.: Circulation in ice-covered waters, in: Physics of ice-covered waters, vol. 2,
Helsinki University Printing House, Helsinki, 447–482, 1998.Radionov, V. F., Bryazgin, N. N., and Aleksandrov, Y. I.: The snow cover of the Arctic Basin,
Gidrometeoizdat, St. Petersburg, 1996 (in Russian).25
Romanov, I. P.: Atlas of ice and snow of the Arctic Basin and Siberian Shelf seas, BackbonePublishing Company, 1995.
Rothrock, D. A.: Ice thickness distribution – measurement and theory, in: The Geophysics ofSea Ice, Plenum Press, New York and London, 551–576, 1986.
Schulson, E. M., Fortt, A. L., Iliescu, D., and Renshaw, C. E.: Failure envelope of first-year30
Arctic sea ice: The role of friction in compressive fracture, J. Geophys. Res., 111, C11S25,doi:10.1029/2005JC003235, 2006.
Schwerdtfeger, P.: The thermal properties of sea ice, J. Glaciol., 4, 789–907, 1963.Timco, G. W. and Frederking, R. M. W.: A review of sea ice density, Cold Reg. Sci. Technol.,
24, 1–6, 1996.Timokhov, L. and Tanis, F. (Eds.): Arctic Climatology Project, Environmental Working Group
Joint U.S.-Russian Atlas of the Arctic Ocean – winter period, Environmental Research Insti-5
tute of Michigan in association with the National Snow and Ice Data Center, Ann Arbor, MI,CD-ROM, 1997.
Tonboe, R. T., Pedersen, L. T., and Haas, C.: Simulation of the satellite radar altimeter sea icethickness retrieval uncertainty, The Cryosphere Discuss., 3, 513–559, 2009,http://www.the-cryosphere.net/3/513/2009/.10
Wadhams, P., Tucker III, W. B., Krabill, W. B., Swift, R. N., Comiso, J. C., and Davis, R. N.:Relationship between sea ice freeboard and draft in the Arctic Basin, and implication for icethickness monitoring, J. Geophys. Res., 97(C12), 20325–20334, 1992.
Wadhams, P.: Ice in the Ocean, Gordon and Breach Science Publishers, 2000.Warren, S. G., Rigor, I. G., Untersteiner, N., Radionov, V. F., Bryazgin, N. N., Aleksandrov, Y. I.,15
and Colony, R.: Snow depth on Arctic Sea Ice, J. Climate, 12, 1814–1829, 1999.Weeks, W. F.: Sea ice properties and geometry, AIDJEX Bulletin, 34, 137–172, 1976.
Table 1. Typical values and uncertainties of snow and ice density and snow depth for late winterconditions. The freeboard data are prescribed input to the isostatic equilibrium equation.
Parameter Ice type
FY ice MY iceTypical value Uncertainty Typical value Uncertainty
Ice freeboard, m 0.01–0.2∗ 0.05∗∗ 0.3 0.05∗∗
Snow depth, m 0.05 0.05 0.35 0.06Ice density, kg m−3 916.7∗∗∗ 35.7∗∗∗ 882∗∗∗∗ 23∗∗∗∗
Snow density, kg m−3 324 50 320 20
∗ The freeboard varies with thickness and age of the FY ice,∗∗ freeboard is a free variable and the uncertainty estimates are used as exampleof realistic numbers,∗∗∗ analysis of level FY ice from the Sever data,∗∗∗∗ based on data from literature.
Fig. 1. (a) Location of 689 ice thickness and freeboard measurements during the Sever air-craft landings on the Arctic sea ice in 1980s, where colours indicate thickness of level ice onrunways; (b) histogram of ice thickness on level ice (on runway) and on characteristic ice typesaround the landing sites (off runway), and (c) a scatterplot of ice thickness versus ice freeboardmeasurements on level ice.
Fig. 2. A composite of sea ice density data measurement ranges obtained from Timco andFrederking (1995) and other published material. The white column under FY ice represents themean and standard deviation of density retrieved from the Sever data. The white column underMY ice represents the best estimate of mean and standard deviation of density from publishedmaterial.
Fig. 3. Error terms contributing to uncertainty in ice thickness retrieval from freeboard mea-surements for first-year (left) and multiyear (right) ice. The prescribed error of ice freeboard is0.05 m.
Fig. 4. Relation between ice thickness and ice freeboard based on measurements from (a) theSever expeditions (Eq. 1, standard deviation is shown as the grey zone); (b) North Pole-29 drift-ing station (Mironov and Sen’ko, 1995) (Eqs. 8 and 9); (c) Wadhams et al. (1992) (Eq. 10); (d)isostatic equilibrium equation used by Laxon et al. (2003) (Eq. 11), and (e) isostatic equilibriumequation (IEE) for FY and MY ice used in this study (Eqs. 6 and 7). The asterisks representother direct measurements of thickness and freeboard obtained by the authors in 2004 and2006.