THE RELATIONSHIP BETWEEN DIVERSITY MANAGEMENT AND ORGANISATIONAL CLIMATE by TSEDILE ETHEL TJALE submitted in partial fulfillment of the requirements for the degree of MASTER OF ADMINISTRATION in the subject INDUSTRIAL AND ORGANISATIONAL PSYCHOLOGY at the UNIVERSITY OF SOUTH AFRICA SUPERVISORS: PROF N MARTINS AND MR H VON DER OHE JUNE 2005
Transcript
THE RELATIONSHIP BETWEEN DIVERSITY MANAGEMENT AND
ORGANISATIONAL CLIMATE
by
TSEDILE ETHEL TJALE
submitted in partial fulfillment of the requirements for
the degree of
MASTER OF ADMINISTRATION
in the subject
INDUSTRIAL AND ORGANISATIONAL PSYCHOLOGY
at the
UNIVERSITY OF SOUTH AFRICA
SUPERVISORS: PROF N MARTINS AND MR H VON DER OHE
JUNE 2005
ACKNOWLEDGEMENTS
The completion of this study would not have been possible without the support of my
family, particularly my parents, partner, and my friends. I would like to thank them for
their encouragement.
The assistance, support, time and patience, which my supervisors (Prof Nico Martins
and Mr Hartmut Von der Ohe) have dedicated to this dissertation. I am humbled by their
dedication.
I would also like to thank the Centre for Industrial and Organisational Psychology at
UNISA for allowing me to use their data, Mr Andries Masinge for the statistical
assistance he rendered, the editor (Lauma Cooper) for the critical reading and language
editing, and the Lord my savior, without whom this wouldn’t have come to pass.
■ 1! 1! I- it: il . i !
0 0 0 1 9 1 6 4 9 8
DECLARATION
I, the undersigned, hereby declare that this dissertation entitled, ‘The relationship
between diversity management and organisational climate”, is my own work, and that all
the sources that I have used or quoted have been indicated and acknowledged by
means of complete references.
Tsedile E. Tjale Date
iii
TABLE OF CONTENTS
Acknowledgements i
Declaration ii
List of figures x
List of tables xi
Summary xiii
Key terms xiv
CHAPTER 1: INTRODUCTIOM TO THE STUDY
1.1 Introduction 1
1.2 Background to and motivation for the study 1
1.3 Problem statement 3
1.4 Objectives of the study 4
1.4.1 General objective 4
1.4.2 Specific objectives 4
1.5 The paradigm perspective 5
1.5.1 Assumptions 5
1.5.1.1 Humanistic assumptions 5
1.5.2 Research hypotheses 6
1.6 Research design 7
1.7 Empirical research 8
1.8 Outline of the study 8
1.9 Chapter summary 9
iv
CHAPTER 2: ORGANISATIONAL CLIMATE
2.1 Introduction 10
2.2 Conceptualisation of organisational climate 10
2.3 Defining organisational climate 12
2.4 The relationship between organisational climate
organisational culture 13
2.4.1 A comparison between organisational climate and
organisational culture 14
2.4.1.1 Conceptual considerations 14
2.4.1.2 Methodological considerations 16
2.5 The relationship between organisational climate
and job satisfaction 19
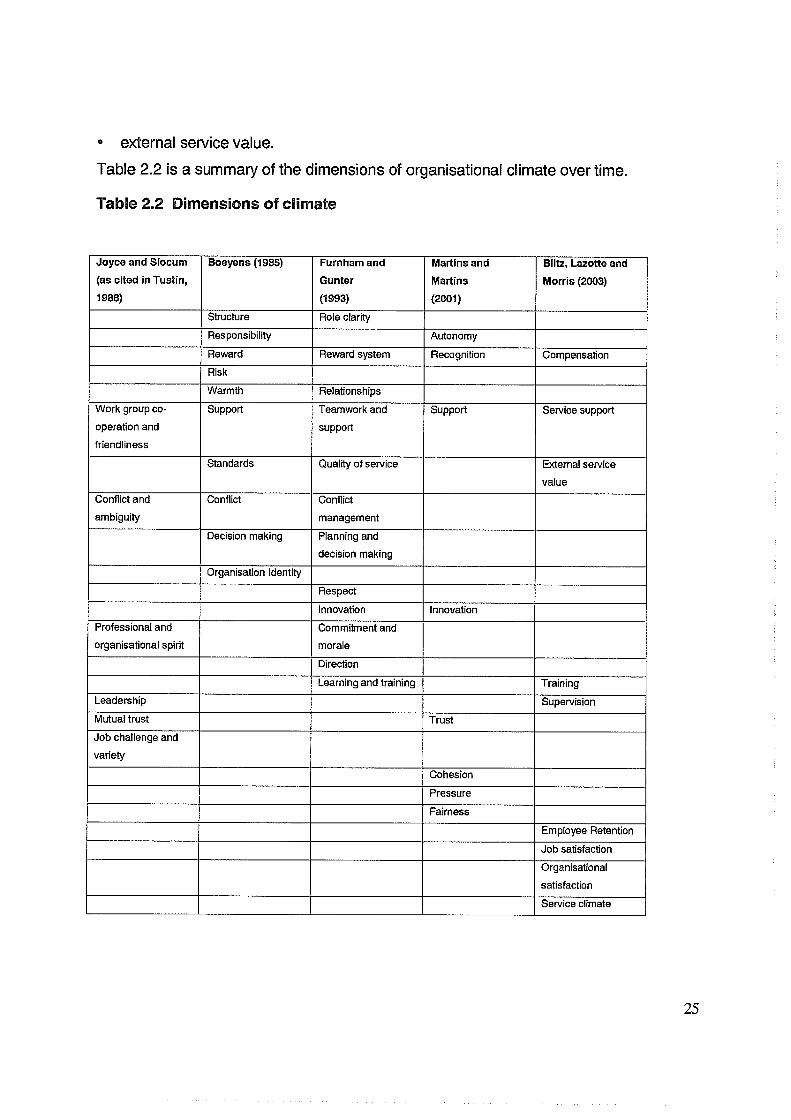
2.6 Dimensions of organisational climate 21
2.7 Elements in the organisation contributing to a positive
organisational climate 26
2.8 Chapter summary 27
CHAPTER 3: DIVERSITY MANAGEMENT
3.1 Introduction 28
3.2 Defining diversity management 28
3.3 Approaches to diversity management 30
3.3.1 Approaches identified by Svehla (1994) 30
3.3.1.1 Affirmative action 30
3.3.1.2 Valuing differences 31
3.3.1.3 Diversity management 31
3.3.2 The integrated approach to diversity 31
3.3.3 Perspectives identified by Lorbiecki (2001) 33
33
33
33
34
35
36
37
37
37
37
38
38
38
39
39
39
40
40
40
41
41
41
43
45
45
47
47
49
v
Resistance
Discrimination and fairness
Access and legitimacy
Learning and effectiveness
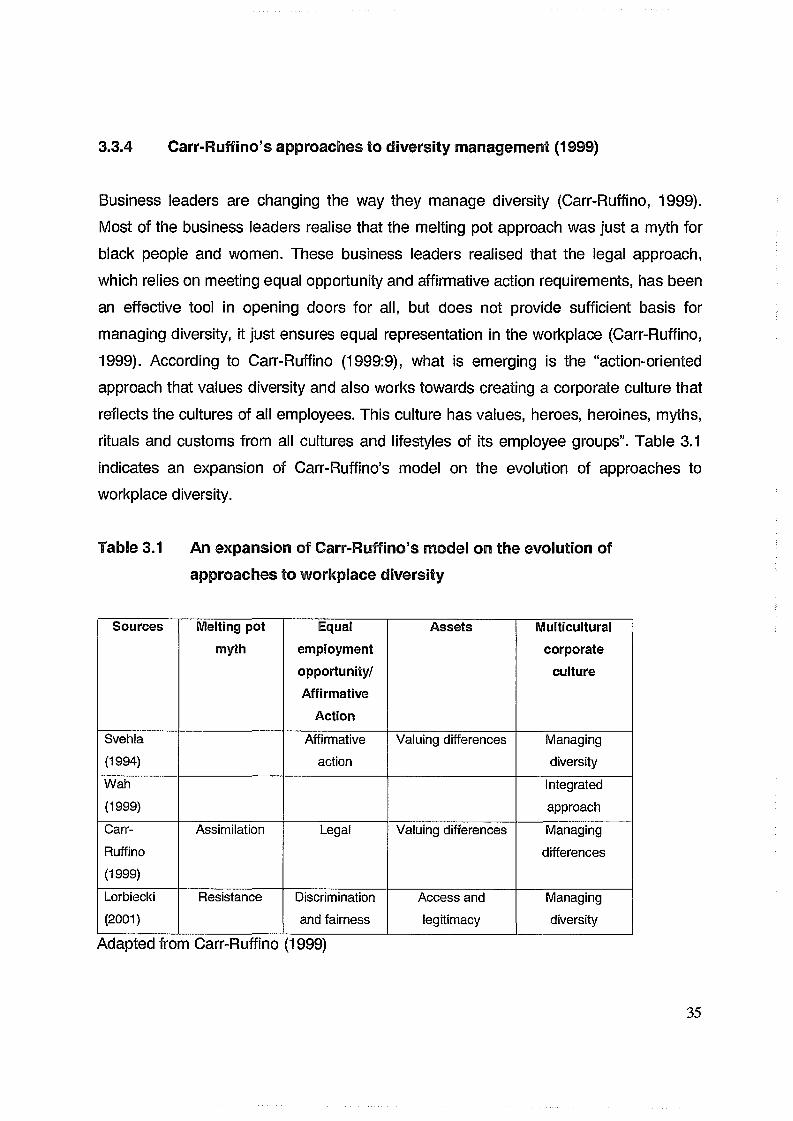
Carr-Ruffino’s approaches to diversity management (1999)
Approach utilised in South Africa
Positive and negative effects of managing diversity
Positive effects of managing diversity
Problem-solving and decision-making
Creativity and innovation
Organisational flexibility
Human talent
Marketing strategy
Reducing costs
Perceived negative effects of managing diversity
Devaluation of employees
Diversity impairs organisational effectiveness
Women lack commitment to employment
The disabled drive up employment costs
Older workers have little potential for payback
The relationship between diversity management,
employment equity and affirmative action
Clarification of concepts
Comparison between diversity management,
employment equity and affirmative action
Models of diversity management
Managing cultural diversity: a proactive approach
An integrative model of effective diversity management
CEO initiation and continuation
Transformation of the human resources function
vi
3.6.2.3 Individual level outcomes and attitudes towards diversity 49
3.6.2.4 Organisational outcomes and public recognition 50
3,6.2.5 Ethical outcomes 50
3.6.3 A model for managing culturally diverse organisations 50
3.6.3.1 Motivational process 52
3.6.3.2 The interaction process 52
3.6.3.3 The visioning process 52
3.6.3.4 The learning process 53
3.6.4 Change model for work on diversity 53
3.6.4.1 Leadership 55
3.6.4.2 Research and measurement 55
3.6.4.S Education 55
3.6.4.4 Alignment of management systems 55
3.6.4.5 Follow up 56
3.7 Organisational climate and diversity management 56
3.7.1 Positive climate for diversity model, Hicks-Clarke
and lies (2000) 60
3.8 Chapter summary 62
CHAPTER 4: EMPIRICAL RESEARCH
4.1 Introduction 63
4.2 Objectives of the study 63
4.3 Sample identified 63
4.3.1 Race composition of the sample 64
4.3.2 Composition of the gender group in the sample 65
4.3.3 Composition of the age group in the sample 65
4.3.4 Composition of the years of service in the sample 66
4.3.5 Composition of the employment status groups in the sample 67
4.4 The research instrument 67
4.4.1 Rationale and background 68
4.4.2
vii
Objective of the research instrument 68
4.4.3 Contents of the questionnaire 68
4.4.4 Dimensions measured 69
4.4.5 Validity and reliability of the questionnaire 70
4.4.5.1 Validity 70
4.4.S.2 Reliability 71
4.4.6 Justification for using the instrument 73
4.5 Data collection 73
4.6 Data analysis and statistical analysis method 73
4.6.1 Factor analysis 74
4.6.2 Item analysis 75
4.6.3 Correlation 75
4.6.4 T-tests 75
4.6.5 One-way ANOVA 76
4.6.6 Effect size and power of a test 76
4.6 Chapter summary 77
CHAPTER 5: DATA ANALYSIS AND iNTERPRETATSOM
5.1 Introduction 78
5.2 Factor analysis 78
5.2.1 Naming of factors 80
5.2.2 Naming of the second order factors for factor 1 83
5.2.3 Discussion of results: factor analysis 84
5.3 Reliability 85
5.3.1 Discussion of the results: reliability analysis 86
5.4 Correlation 87
5.4.1 Correlation between diversity management
and all organisational climate dimensions 87
5.4,2 Correlation between diversity management
and the individual organisational climate dimensions 89
viii
5.5 T-tests 93
5.5.1 Effect size and power of the t-test 93
5.5.2 Difference between males and females on their view of
diversity 93
5.6 One-way ANOVA 94
5.6.1 One-way ANOVA between diversity management
and the age groups 95
5.6.2 One-way ANOVA between diversity management
and years of service 96
5.6.3 One-way ANOVA between diversity management
and race 98
5.6.4 One-way ANOVA between diversity management
and employment status 101
5.7 Integration and interpretation of the results 105
5.8 Chapter summary 107
CHAPTER 6:'CONCLUSIONS, LIMITATIONS AND RECOMMENDATIONS
6.1 Introduction 108
6.2 Conclusions 108
6.2.1 Conceptualisation of organisational climate 108
6.2.2 Conceptualisation of diversity management 109
6.2.3 Integration of the concepts organisational
climate and diversity management 110
6.2.4 The relationship between organisational climate
and diversity management 111
6.3 Limitations 112
6.4 Recommendations 113
6.5 Chapter summary 115
REFERENCE LIST 116
ix
LIST OF FIGURES
Figure 2.1 The overlap between climate and culture 15
Figure 3.1 Managing cultural diversity a suggested model 46
Figure 3.2 An integrative model of effective diversity
management 48
Figure 3.3 Influences of cultural diversity on management 51
Figure 3.4 Change model for work on diversity 54
Figure 4.1 Pie chart of the race split of the sample 64
Figure 5.1 Scree plot: Factor analysis 79
Figure 5.2 Scattergraph of correlation between diversity
management and organisational climate 89
Figure 5.3 Graphical representation of the responses of the
race groups with regard to diversity management 100
24
25
35
44
64
65
66
66
67
72
80
85
86
88
90
94
x
LIST OF TABLES
Universal dimensions of climate
Dimensions of climate
An expansion of Carr-Ruffino’s model
on the evolution of approaches to workplace diversity
An expansion of Ivancevich and Gilbert (2000),
A comparison of the differences between affirmative
action, diversity management and employment
equity
Distribution of the race groups in the sample
Distribution of the gender groups in the sample
Distribution of the age groups in the sample
Distribution of the years of service groups in the
sample
Distribution of the employment status groups in
the sample
Results of the item analysis for the second order
factors 1 “4
Total variance explained
Reliability of the climate dimensions
Reliability of the second order factors for
factor 1
Correlations between diversity management
and organisational climate dimensions
Correlations between diversity management
and individual organisational climate
dimensions
Group statistic and independent t-test
One-way ANOVA of diversity management and
xi
the age groups 95
Table 5.8 Mean scores of age groups 96
Table 5.9 One-way ANOVA between diversity management
and years of service 97
Table 5.10 Mean scores of years of service groups 98
Table 5.11 One-way ANOVA between diversity management
and race 98
Table 5.12 One-way ANOVA post -hoc tests: race 99
Table 5.13 One-way ANOVA between diversity management
and employment status 101
Table 5.14 One-way ANOVA post -hoc tests for
employment status 102
SUMMARY
TITLE: The relationship between diversity management and organisational
climate
CAMDiDATE: Tsedile E, Tjale
This study is within the field of Industrial and Organisational Psychology. It focuses on
the relationship between diversity management and organisational climate dimensions.
The literature review indicates that most of the research conducted on these two
concepts, diversity management and organisational climate investigated the concept
diversity, not diversity management (Cox, 1993; Hicks-Clarke & Hies, 2003). This study
specifically explores diversity management in a retail organisation.
The empirical component of the study includes confirmatory factor analysis, reliability
analysis and a correlational study investigating the relationship between diversity
management and organisational climate. It was found that there is a positive and strong
relationship between diversity management and organisational climate. Diversity
management seems to correlate highly with the following climate dimensions: policies
and procedures, discrimination, gender issues, equality in conditions of employment
and employment equity. The results indicate that younger employees have more
positive views regarding diversity management, and middle aged employees have less
There are people who believe that a minority workforce offers very little to the
organisation as a whole in terms of increased knowledge, skills and activities. They
believe that making the organisation look different adds little to organisational
effectiveness. Diversity due to race will create interpersonal dynamics among workers
and thus threaten their productivity, and employees of colour are believed not to
contribute meaningfully to productivity (Thomas, Mack & Montagliani, 2004).
3A.2.3 Women lack commitment to employment
Female employees are still viewed with a degree of suspicion. Women of childbearing
age are often regarded as more likely to leave their jobs than their male counterparts.
Women are regarded as an economic risk because they are ill more often than men and
they tend to quit their jobs once they marry and/ or have children. It is believed that
women face more work-family conflict than men (Thomas et a!., 2004).
3.4.2A The disabled drive up employment costs
There is a belief that disabled employees’ physical limitations cause them to miss work
more than non-disabled workers, produce poorer quality of work and drive up the costs
of healthcare premiums (Thomas et al., 2004). Employers have traditionally resisted
40
hiring persons with disabilities partly because of the belief that they pose safety risks,
increase health costs, have higher absence and lower productive capacity than non
disabled workers (Thomas et al., 2004).
3.4.2.5 Older workers have little potential for payback
Thomas et al. (2004) state that the cost associated with hiring and training older
workers will outweigh the benefits of their employment. The arguments are, older
employees are perceived as producing lower quality of work and they will not be in their
jobs long enough to make a substantial impact or contribution to the organisation.
3.5 THE RELATIONSHIP BETWEEN DIVERSITY MANAGEMENT,
EMPLOYMENT EQUITY AND AFFIRMATIVE ACTION
The concept diversity management is often equalled, confused or incorrectly related
with affirmative action and employment equity (Cox, 2001; Jenner, 1994; Maier, 2002;
Thomas, 1996; Yakura, 1996).
3.5.1 Clarification of concepts
Diversity management is a corporate managerially initiated strategy. It can be proactive
and is based on operational reality to optimise the use and contributions of an
increasingly diverse national workforce (Ivancevich & Gilbert, 2000). Cox (1993)
describes an organisational continuum in terms of diversity initiative implementation
compromising of three types: monolithic, plural and multicultural.
In monolithic organisations, the extent of commitment to affirmative action is the
existence of an affirmative action plan. In plural organisations, minorities may be more
aggressively recruited and promoted but they are ultimately expected to assimilate into
the dominant culture. The plural organisation supports affirmative action to the exclusion
of initiatives that promote true employee integration.
41
The multicultural organisation represents the ideal, a place where differences are
appreciated and used to gain competitive advantage. Multicultural organisations are
believed to promote both attitudinal and structural integration of minorities and to
effectively manage corporate diversity.
Affirmative action is a reactive process and is based on governmental law and moral
imperatives in order to right the wrongs of the past in the workplace. According to Agocs
and Burr (1996), affirmative action is a policy that deals directly with de facto or
systematic discrimination and focuses on increasing the representation of designated
groups through targeted hiring. Affirmative action puts interventions in place that involve
preferential treatment of members of target groups in appointments, development and
promotions.
Employment equity creates an environment of equal opportunity in the workplace. The
purpose of the Employment Equity Act 55 of 1998 (Republic of South Africa) is to attain
equality in the workplace through the elimination of unfair discrimination and through
affirmative action strategies. Agocs and Burr (1996) state that employment equity can
be seen as a two-fold response to inequality, designed not only to improve numerical
representation of formerly disadvantaged groups in all occupational categories and
levels, but also to provide fair employment systems free of unfair bias and
discrimination.
Diversity management is regarded as a strategic process that an organisation
undertakes to create an environment where differences and similarities are
acknowledged, valued and utilised to reach organisational goals, using integration
rather that assimilation to create a multicultural organisation. This includes culture,
working methods or styles, age, gender, work experience, race, values, norms, religious
affiliations and number of years in the organisation.
42
3.5.2 Comparison between diversity management, employment equity and
affirmative action
According to Yakura (1996), in contrast to affirmative action and employment equity,
diversity management bears less legal and moral connotations and is regarded as a
business initiative addressing diversity in the workplace. Thomas and Robertshaw
(1999) state that diversity management is not opposed to the concepts affirmative
action or employment equity, but rather as a voluntary organisational change
programme that helps to implement employment equity in the workplace. The goal of
affirmative action and employment equity is to help create a diverse workforce; diversity
management is needed in order to achieve upward mobility, healthy integration among
the workforce and ultimately lead to greater organisational performance (Thomas &
Robertshaw, 1999).
Riccucci (2002) regards equal employment opportunity as policies aimed at preventing
employment discrimination. Equal Employment Opportunity policies and laws were
developed in response to discriminatory practices against persons based on race,
gender, religion, national origin, disability, age and so forth. Equal Employment
Opportunity law is regarded as passive in a sense that it only requires employers to
refrain from discriminating against protected-class members. On the other hand,
affirmative action requires employers to take positive steps towards employing,
promoting, and retaining qualified women, people of other races and other protected
class people (Riccucci, 2002). Affirmative action continues to be an important tool for
the promotion of the disadvantaged to upper-level positions in the workplace. Diversity
measures go beyond entry-level hiring to ensuring that every section of the
organisational hierarchy is diversified and that the workplace is free from hostilities and
harassment that often arise in a highly diverse workforce. Table 3.2 displays a
comparison of these three concepts as discussed above.
43
Table 3.2 An expansion of Ivancevich and Gilbert (2000). A comparison of the
differences between affirmative action, diversity management and
employment equityAffirmative Action Diversity Management Employment EquityLinked to the strategic use of the human resources plan
Not tied to strategic human resources plan. Proactive
Linked to the strategic use of the human resources plan
Reactive and based on law and moral imperatives
Focuses on building diverse teams
Reactive and based on law and morai imperatives
Not linked to any formal manner to team building
Race, ethnicity, age, religion, sexual orientation, physical limitations are considered
Not linked to any formal manner to team building
Focuses primarily on women, people of colour and the disabled
Considers diversity of external constituency, more in diversity of employees and recruitment pool, and a more diverse stakeholder pool
Focuses primarily on women, people of colour and disabled
Emphasis is primarily with employees and not external constituents
Celebrates and respects differences in values, customs and norms
Emphasis is primarily with employees and not external constituents.
Works at making individuals conform to organisational customs, norms and values
Addresses the bias of people towards others who are different
Ensures that disadvantaged employees are promoted to all hierarchical levels in the organisation
Ensures that once the employees are hired and promoted to ali the hierarchical levels of the organisation, they are free from harassment and hostilitiesHelps implement the employment equity in the workplace
Assimilation model. Assumes new people who come into the organisation will adapt to existing organisation norms
Synergy model. Seeks change in organisation culture to accommodate diverse groups
Access model. Assumes that protected-class persons will be able the access the organisation
Qualitative/quantitative. Emphasis on redressing past discrimination and achieving a representative workforce
Behavioural, Emphasis on building specific skills and creating a productive work environment.
Qualitative/quantitative. Emphasis on preventing or ending discrimination.
Opens doors. Seeks to affect hiring and promotion decisions in organisations
Opens the system. Seeks to affect managerial practices and policies
Levels the playing field. It seeks to ensure equal opportunity and access
Adapted from: Ivancevich and Gilbert (2000)
44
3.6 MODELS OF DIVERSITY MANAGEMENT
3.6.1 Managing cultural diversity: a proactive approach
Motwani, Harper, Subramanian and Douglas (1992) developed a model for managing
cultural diversity depicted in figure 3.1. This model explains how a manager can
successfully implement a program of recruiting and managing a diversified workforce.
The first phase of the model, a manager must develop a complete understanding of the
labour resources available in the labour market and the labour pool that exists within the
organisation. In the second phase the manager should understand the short-term and
long-term operational goals of the company and what types of jobs and skills will be
required in the future to achieve organisational goals. In the third phase, referred to as
the programming phase, diversity management focuses on setting both short-term and
long-term goals to achieve a more responsive environment to the changes that are
taking place. In the short term the manager may only be able to achieve minimum
affirmative action goals, create awareness among employees of the stereotypes they
may possess and the harm this may cause to the organisation, and may also start at
this stage to affirmatively recruit minorities, women and others. In the long run the
culture of the organisation must be changed to create a management system and
employee group, which goes beyond tolerance to appreciation of cultural differences.
The fourth phase of this model involves making specific assignment of responsibilities,
setting quarterly deadlines and review dates, making managers accountable with “no
excuses” and tying the goals to performance evaluation of managers. The final phase of
the model involves evaluating the human resources department’s management of the
overall diversity management program. This is done to determine if the programme is
achieving its specified goals and if it is not achieving specified goals the department
must redesign its programme to make it more effective (Motwani et al., 1992).
45
Figure 3.1 Managing cultural diversity a suggested model
Source: Motwani, Harper, Subramanian and Douglas (1992)
46
3.6.2 An integrative model of effective diversity management
Gilbert et al. (1999) developed an integrative model of diversity management. This
model integrates components of existing models with interview data and anecdotes
from actual business practice.
The model depicted in figure 3.2 suggests that specific factors are responsible for
positive diversity results. According to the model, Chief Executive Officer (CEO)
initiation and continuation leads to transformation of the human resource function,
positive individual level outcomes for minority and majority individuals, and positive
attitudes towards diversity. Benefits of effectively managed diversity, in turn, affect
important organisational outcomes.
3.6.2.1 CEO initiation and continuation
Gilbert et al. (1999) regard organisations that view valuing differences as a total cultural
change rather than an isolated component of organisational policy designed to satisfy
governmental mandates as diversity leaders in the industry. CEO’s of these
organisations believe that diversity management makes sense both from a perspective
of justice and a perspective of improving bottom line. The diversity programme at Xerox
was initiated at the top and managerial attention to increased workforce diversity was
mandated. The transformational leadership skills of the CEO’s of J.C. Penny’s and
Xerox acted as catalysts to organisational change. J.C. Penrfy’s and Xerox changed
their mission statements and strategic plans to incorporate diversity related goals, and
subsequently demonstrated their commitment to diversity through initiating
organisational cultural change. Other CEO’s who now advocate valuing diversity as a
corporate goal came to that realisation as a result of legal battles (Gilbert et al., 1999).
Lawsuits need not be the motivating factor for firms to act. The then CEO of Procter and
Gamble, John Pepper was committed to increasing organisational diversity as a means
of attracting,the best talent and serving diverse markets (Gilbert et al., 1999).
47
Figure 3.2 An integrative model of effective diversity management
INITIATION
ANDCONTINUATION
CEO
Continuinginvolvement
• Moral
persuasion
• Mission state
ment and strategic plan
TRANSFORMATION OF H R FUNCTION
• Career planning
• Mentoring
• Recruitment
• Compensation
• Accountability through
appraisals
• Education /Awareness
• Family friendly policies
• Diversity councils
INDIVIDUAL LEV EL OUTCOMES
• Penetration of glass ceiling
• Integration
• Organisational attachment
• Psychological Dissonance
ATTITUDES TOWARDS DIVERSITY
• Acceptance
• Appreciation of differences
• Multiculturalism
ORGANISATIONAL
BENEFITS
• Better decision making
• Representation of qualified minorities
• Retention of qualified minorities
• Business with diverse & multicultural customer base
• Product line
development
ORGANISATIONALOUTCOMES
• Profit
• Market share
• Stock price
PUBLICRECOGNITION
OFCC award
• Glass ceiling Commission
award
• Regional and
local awards
Source: Gilbert, Stead and Ivancevich (1999)
3.6.2.2 Transformation of the human resource function
According to figure 3.2, diversity as a strategic imperative will result in structural
organisational changes, specifically in augmentation of the human resource function. A
study in which in-depth interviews with managerial personnel from sixteen organisations
uncovered 52 diversity practices and twenty-three accountability practices used in the
organisation, which were trying to promote a culture of valuing differences. These
initiatives suggest that a one or two-day diversity training programme is insufficient to
create the cultural change necessary for minority individuals to feel fully integrated in
the workplace (Gilbert et al., 1999). Under the umbrella of diversity management, the
entire personnel or human resources systems are modified to promote employee
inclusion (e.g. compensation, performance appraisal, mentoring, and career pathing)
(Gilbert etal., 1999).
3.6.2.3 individual level outcomes and attitudes toward diversity
The intent of diversity management is to foster enhanced employee integration. Jackson
and Ruderman (1995) argue that integration is based on valuing differences, as
opposed to assimilation, which results from organisational compliance. Integration,
according to Jackson and Ruderman (1995) will become a sought after organisational
strategy for the following reasons:
° Employees are less willing to assimilate into a dominant organisational culture.
• Some factors may be beyond assimilation.
Jackson and Ruderman (1995) further suggest that assimilation of diverse employees
may actually be dysfunctional, resulting in an inability to attract and retain qualified
people. Taking care of all people in a way that values them as individuals and values
the special contributions that they make is integral to engaging all people as valued and
contributing members of the business team.
49
3.6.2A Organisational outcomes and public recognition
Wright, Ferris, Hiller and Kroll (1995) examined the impact on corporate stock returns of
Office of Federal Compliance Programmes (OFCCP) award winners versus those sued
for discrimination. Findings indicated that labour awards were positively associated with
stock returns. The visionary stance of CEO’s committed to diversity has manifested
itself in award winning programs and in national recognition of diversity leaders. Xerox
is the first recipient of the Glass Ceiling Commission award, officially named the
Perkins-Dole National Award for Diversity and Excellence in American Executive
Management. Pfeffer (1995) indicated that it might have been too early to assess long
term benefits of these awards and honours, as widespread positive public recognition
will likely be associated with increased sales, and a perception that winners have
obtained a source of competitive advantage.
3.6.2.5 Ethical outcomes
A process of ethical decision making and an ethical decision-making checklist both
provide a consistent strategy that includes taking ethical principles (an ethics screen)
into consideration. These decision models provide ways to include diversity
management in business decisions. Both the corporate mission statement and the code
of ethics can be a valuable source for building an ethics screen, management needs to
make a conscious effort to use ethical decision making, as words without action will not
bring about diversity management (Gilbert et al., 1999).
3.6.3 A model for managing culturally diverse organisations
Rijamampianina (as cited in Rijamampianina & Maxwell, 2002) developed a model for
managing culturally diverse organisations. Rijamampianina indicates that managers
have attempted to initiate organisational changes in the structures and policies of the
organisation, but it suggests that managers could be more effective were they to focus
their efforts on organic processes.
50
Organisational processes are said to be dynamic, changing all the time, shaping the
organisation and influencing performance, sometimes in keeping with in opposition to
the stated policies and establishes structures. The practical impact of cultural diversity
on management practices would most importantly be identified in organic processes
that constitute an organisation. Rijamampianina (as cited in Rijamampianina & Maxwell,
2002) states that the majority of organisational activities can be described by the
following four interrelated activities: interaction process, motivational process, visioning
process and learning process (see figure 3.3).
Figure 3.3 Influences of cultural diversity on management.
Source: Rijamampianina and Maxwell (2002)
51
3.6.3.1 Motivational process
Employees are impacted upon by a variety of internal and external motivating forces,
which predispose those employees to think and act as they do under various
circumstances. People’s motivational patterns differ. This is more the case in
multicultural organisations where motivational forces are likely to differ more than in
homogeneous contexts.
3.6.3.2 The interaction process
Employees are said to have predetermined assumptions about the world, roles within
the organisation and a set of values by which they judge all their experiences. The
interaction process is said to be a process by which employees have their views of the
world, by which they generate an understanding of their colleague’s assumptions,
attitudes and values and their mental models. Such sharing generates the basis of
mutual respect, constructive conflict and trust. Employees in a homogenous work
context cannot be said to share a common set of mental models, and this is more the
case in multicultural work context, where employees have vastly different mental
models.
3.6.3.3 The visioning process
Even though an organisation has a vision and mission, this does not necessarily mean
that employees in the organisation will share a common understanding of the vision of
the organisation nor will they necessarily support the vision. The visioning process is
one that involves all employees in defining and redefining the essential purpose of the
organisation in such a way that it generates a level of understanding of the vision and a
level of commitment in pursuing the vision. The visioning process can only be effective if
the motivation and interaction process are effective. It requires a minimum level of
52
shared understanding about the organisation and a minimum level of alignment of the
motivational forces acting on employees.
3.6.3.4 The learning process
Learning in this context refers to learning that is specifically related to the empowerment
of employees in a manner critical to their success in meeting the challenges they face at
work. The learning can be formal or informal, specific to a work task or related more
generally to the work environment or based on verbal or written communication. The
learning process focuses on empowering employees with the skills that are critical to
their success in meeting the challenges they face at work. A healthy learning process is
largely dependent on the healthy motivation and interaction processes. Rijamampianina
(as cited in Rijamampianina & Maxwell, 2002) states that the above processes are
interrelated and that successful management of these processes leads to high levels of
organisational performance. In order to achieve high performance in any organisation,
managers need to create organisations that:
• share business successes and failures with employees (the motivation process)
• welcome and encourage mental model sharing (interaction process)
• support vision creation with employees (visioning process), and
• encourage core competence development Rijamampianina (as cited in
Rijamampianina & Maxwell, 2002).
3.6.4 CHANGE MODEL FOR WORK ON DIVERSITY
Cox (2001) developed a model for organisational change as a response to the
challenge of diversity (see figure 3.4). According to Cox (2001), an effective change
effort should include all elements depicted in figure 3.4. Change effort cycles through all
the elements and is continually assessed and refined over time in a process of
continued loop learning.
53
Figure 3.4 Change model for work on diversity
Adapted from Cox (2001).
54
3.6.4.1 Leadership
Cox (2001:18) regards leadership as “behavior that establishes direction or a goal for
change (a vision), provides a sense of urgency and the importance of the vision
facilitates the motivation of others and cultivates necessary conditions for the
achievement of the vision”. Leadership is regarded as central to any change effort,
without it the organisation lacks direction.
3.6A.2 Research and measurement
Cox (2001:20) regards research as a purposeful collection of data by which we can
answer questions about some environmental element or phenomenon. In the context of
organisational change, measurement means the use of research to keep record of the
progress of a change initiative. According to this model, successful organisational
change work must be well informed by relevant data, with results being systematically
measured at intervals during the process.
3.6.4.3 Education
Any change effort brings with it an element of learning. Education helps people to learn
new information and skills in order to survive in the changing world of work (Cox, 2001).
3.6.4.4 Alignment of management systems
Cox (2001:21) describes management systems as “any organisational policy, practice,
rule or procedure”. This also addresses the major human resources activities like
recruitment, promotion and development. AH these systems must be aligned with the
goals of leveraging diversity. In order to achieve this alignment of systems there is a
need for a fairly deep understanding of diversity and its effects.
55
3.6.4.5 Follow up
This component involves implementing action, establishing accountability for results and
capturing and recycling the learning so that the action steps become more precise. This
component overlaps with the other four components, but is linked more to the research
and measurement component (see figure 3.4) (Cox, 2001). This model by Cox (2001)
can be used in organisations that intend implementing diversity management strategies.
It indicates that it all starts with the leadership of the organisation for the diversity
initiative to work. Then the focus has to be on assessment of the current state of the
organisation, an intervention involving education about the change taking place
becomes necessary. Following this intervention there needs to be an alignment of
systems to the intervention and finally a foilow up or monitoring system needs to be in
place to monitor the change.
The model by Motwani, Harper, Subramanian and Douglas (1992), emphasises the role
of manager in managing diversity, and the human resources division carries all the
responsibility for the success of the programme. Models by Cox (2001), Gilbert, Stead
and Ivancevich (1999) and Rijamapianina and Maxwell (2002), denote that in recent
years organisations attempting to manage diversity recognise the importance of
leadership in the whole endeavour. Hence leadership initiates diversity management
programmes and their consistent support programme is emphasised.
3.7 ORGANISATIONAL CLIMATE AND DIVERSITY MANAGEMENT
This study investigates the relationship between organisational climate and diversity
management; therefore the literature explored these two concepts. Subsequently a
literature integration of the concepts diversity management and organisational climate is
discussed.
56
Hayes, Bartle and Major (2002) suggest that in order to create organisations that are
effective with diverse employee base, the organisational climate must be appropriate.
Hayes et al. (2002) indicate that diversity management moves beyond the isolated
implementation programs (e.g. diversity and sensitivity training) to the development of a
system-wide approach that involves alignment of organisational culture, reward systems
and policies and procedures. This view is also shared by Cox (2001).
Hayes et al. (2002) indicates that it is difficult to alter climate. Firstly climate for
opportunity can differ across individuals making it complicated to understand and
manage. The complexity of cognitive biases makes the task of managing perceptions a
challenge, while differences in values across individuals can make the establishment of
“fair” policies and procedures impossible.
Secondly, this theory supports the idea that an individual’s immediate work group is
important in the development of a climate for opportunity. For example behavior of
superior or co-worker will have a disproportionate influence on work group member’s
perceptions about the organisation. Levinson (1965) suggests that employees view
actions by agents of the organisation as actions of the organisation itself. For example,
an organisation may adopt an official policy against discrimination within the
organisation and the actions of a racist or a sexist supervisor will clearly undermine this
policy.
Diversity management efforts should be based on the principles of the systems theory.
According to Cox (2001) organisations are social systems. The following are the three
main categories of climate that must be examined when aligning systems in order to
manage diversity: time, space and people as listed below.
Time Factors
• Length of typical workday
9 Days of work per week
• Use of overtime
57
® Time-off policies (vacation, leave, personal days)
• Retirement policies
• Level of work schedule flexibility
Space Factors
• Cleanliness of workspace
• Extent to which physical barriers separate people at work
• Presence of class distinctions in specifications of physical spaces at work
People Process Factors
• Recruiting practices
• Promotion practices
e Compensation policies
• Performance appraisal practices
• Career development and succession planning practices.
Only a few factors within these categories will be discussed:
• Time-off policies
Time-off policies specify that employees are able to take paid and unpaid time off from
work. There is an increasing presence of participation of women in the workforce and
dual career couples. The most fundamental implication of these trends is that if your
organisation has more liberal time-off policies it would be a better position to attract,
retain and motivate a diverse workforce (Cox, 2001).
• Presence of class distinctions
A principle that is virtually universal in human systems is the tendency to organise social
groups into status hierarchies. In most societies we find clearly identifiable hierarchies
of gender, socio-economic class, work specialisation and race. An organisation’s
58
climate becomes more diversity friendly when it avoids or removes policies and
practices that tend to reinforce the existence of such hierarchies (Cox, 2001).
• Recruiting practices
The hiring practices of organisations’ need to reflect or foster diversity. New entrants in
the organisation must align better with diversity management. By reflecting diversity in
selection tools, this allows for the selection of recruits that deal easily with diversity
issues (Cox, 2001).
• Performance management
In addition to the elements of the performance management process, the diversity
management competency must be added, evaluated and rated. To include this,
competency specific behaviours should be indicated, that the organisation wants to
encourage from employees in order to foster a climate that is supportive of diversity
(Cox, 2001).
• Career development factors
This can be achieved by addressing the following issues:
• Job posting: advertising jobs so that people from all walks of life can see them and
apply. Also ensure that the screening process is fair which increases the diligent
consideration of all job applicants.
® Annual Development Planning: Personal development plans can be used for
development towards current jobs and it can also be used to a pool of qualified
members of unrepresentative employees for the development of future expected job
vacancies.
59
. Succession planning
It involves identifying individuals in an organisation who are potential replacements for
people occupying key jobs and ensuring that they get the development they need to fill
these jobs. Diversity can be brought into this process by ensuring that the profile of
succession planning candidates are representative of diversity dimensions like gender,
race and work specialisation. Secondly the organisation needs to ensure that possible
successors for key jobs are diversity competent (Cox, 2001).
3.7.1 Positive climate for diversity model, Hicks-Clarke and lies (2000)
The positive climate for diversity model (PCFD) was developed by Hicks-Clarke and lies
(2000). This model is based on the works of Kossek and Zonia (1993) and Cox (1993),
who developed a model of diversity based on the argument that, in order to have a
positive climate for diversity, then there must be a demographic mix of people at
management level in an organisation.
Kossek and Zonia (1993) propose that there is a relationship between climate and
diversity. They argue that in organisations, power is still held by white males and this
has created a homogeneous culture. Organisational climate seems to be influenced by
the power each group has. Kossek and Zonia (1993) postulate that removing the
barriers between the groups in the organisations would help remove prejudices. Kossek
and Zonia (1993) maintain that climates of organisations are affected by equal
opportunity policies, access to resources and opportunities in the organisation and by
how individuals and groups view these policies. Cox (1993) proposed a model of
creating a climate that is conducive to diversity, the interactional model of cultural
diversity. This model links human resources diversity to climate. In his model Cox
(1993) argues that an organisation which develops a climate which encourages and
supports all employees and in which all employees have equal opportunities will be
better positioned than their competitors, as their employees will be more motivated and
creative.
60
According to the positive climate for diversity (PCFD) model the following climate factors
are relevant to creating a positive climate for diversity. Firstly, individual characteristics
such as gender and managerial level, secondly, elements such as organisational
policies and thirdly the outcomes of the PCFD including job satisfaction and career
commitment at individual level, and at organisational level outcomes such as greater
efficiency, productivity and customer service may then flow from these positive
individual outcomes (Hicks-Clarke & lies, 2000). This model hypothesises that diversity
climate will affect a variety of individual level outcomes especially individual career and
organisational attitudes and perceptions. According to Hicks-Clarke and lies (2000),
diversity climate is said to include policy support for diversity and the perception of
organisational commitment, job satisfaction, career future satisfaction and satisfaction
with the manager. These factors are moderated by a variety of variables, such as
gender, ethnicity, age, marital status, care responsibilities, ability/disability and
management level. The primary aim of Hicks-Clarke and lies’s study was to explore the
impacts of diversity climate (as assessed by policy support for diversity and recognition
of equity i.e. organisational justice, support for diversity and recognition of need for
diversity) on a variety of individual career and organisational attitudes and perceptions,
such as organisational commitment, career satisfaction and satisfaction with manager
and career planning.
The secondary aim was to explore whether these impacts were moderated by age,
gender, ethnicity, managerial level, marital status, care responsibilities, disability/ability
and management level. The result of the study showed that the managerial attitudes
and perceptions towards a positive climate for diversity became more positive as
management level increased. The need for diversity at management levels in the
organisation also showed a significant difference with women believing that it was more
needed than men, but men believed the organisation supported diversity initiatives. In
general, the results of this study showed that a positive climate for diversity is strongly
related to the presence of positive organisational, job and career attitudes. The study by
Hicks-Clarke and flies (2000) recommends that in order for organisations to create a
61
positive climate for diversity they should consider elements such as diversity policies
and procedures. Hicks-Clarke and llles’s model highlights those elements of climate that
impact positively on diversity. Hicks-Clarke and files (2000) indicate that there is a
relationship between organisational climate and diversity.
3.8 CHAPTER SUMMARY
The concept diversity management was clarified and defined and the different
approaches to diversity management discussed. Various concepts and models were
also discussed and the relationship between diversity management and organisational
climate was addressed. Chapter 4 deals with the empirical research.
62
CHAPTER 4
EMPIRICAL RESEARCH
4.1 INTRODUCTION
Organisational climate and diversity management were discussed in chapters two and
three, respectively. This chapter will empirically examine the relationship between
organisational climate and diversity management.
4.2 OBJECTIVES OF THE STUDY
The primary objective of this study was to explore the relationship between
organisational climate and diversity management. The empirical objectives of this study
were to:
• determine the relationship between organisational climate and diversity
management.
• determine whether there are any differences between the different biographical
groups such as gender, race, age, years of service and employment status with
regards to their views of diversity management in their organisation.
4.3 SAMPLE IDENTIFIED
A sample of 4 549 employees of one South African retail company was used. This data
was made available by the Centre of Industrial and Organisational Psychology at the
University of South Africa (Unisa). The participants ranged from top management to
operational employees, covering all the biographical subgroups such as race, age,
years of service, employment status/level, gender and disability groups.
63
4.3.1 Race composition of the sample
Of the respondents, 28,6% were Black, 31% were Coloured, 12,7% were Indian, 20,1%
were White and. According to table 4.1, 7,5% of the respondents did not indicate their
race. An assumption might be made that these respondents feared being identified.
Table 4.1 Distribution of the race groups in the sample
Race Black Coloured Indian White No
responses
Number of
participants
1302 1411 579 916 341
Percentage
of total
sample
28,6% 31,0% 12,7% 20,1% 7,5%
Figure 4.1 Pie chart of the race split of the sample
□ Black■ Coloured H Indian□ White
From the composition of the sample in figure 4.1, it can be assumed that this sample is
biased towards the Western Cape.
64
4.3.2 Composition of the gender groups in the sample
Of the respondents, 29,6% were male, 50,9% were female and 19,5% did not indicate
their gender, Again, it can be assumed that these respondents feared to be identified
(see table 4.2).
Table 4.2 Distribution of the gender groups in the sample
Gender Male Female No responses
Number of
participants
1348 2 315 886
Percentage of total
sample
29,6% 50,9% 19,5%
4.3.3 Composition of the age group in the sample
Of the respondents, 13,3% as under 25 years old ,35,9% indicated their age as
between 25-34; 27,2% as between 35-44,15% as between 45-54, 3,6% as 55 or older
and 5% did not indicate their age, (see table 4.3).
65
Table 4.3 Distribution of the age groups in the sample
Age Under 25 years old
25-34
years old35-44
years old45-54
years old55 years or older
Noresponse
Number of
participants
604 1634 1237 681 166 227
Percentage
of total
sample
13,3% 35,9% 27,2% 15,0% 3,6% 5,0%
4.3.4 Composition of the years of service in the sample
According to table 4.4, of the respondents, 7,2% have less than 1 year of service,
21,6% have more than 1 but less than 5 years of service , 20,1% have more than 5 but
less than 10 years of service , 23,5% have more than 10 but less than 20 years of
service , 7,3% have 20 years or more of service and 20,2% did not indicate their years
of service. Based on this, an assumption can be made that this organisation seems to
be recruiting school-leavers at a slow pace.
Table 4.4 Distribution of the years of service groups in the sample
Years of service
Less
than 1 year
More than
1 but less than 5
years
More than 5 but iess
than 10
years
More than
10 but less
than 20
years
20 years ormore
Noresponses
No ofparticipants
329 981 914 1071 333 921
Percentage of total sample
7,2% 21,6% 20,1% 23,5% 7,3% 20,2%
66
4.3.5 Composition of the employment status groups in the sample
Of the respondents, 1,7% were in top management, 14,9% were in senior management
13,2% were professionally qualified, experienced specialists in middle management,
13,6% were technically and academically qualified, 31,2% had semi-limited and 5,1%
had limited skill requirement and defined decision making, and discretionary decision
making, Of the respondents and 20,3% did not respond to this question (see table 4.5).
An assumption can be made that by indicating their employment status, their identity
would be known.
Table 4.5 Distribution of the employment status groups in the sample
Employmentstatus
Topmanage
ment
Seniormanage
ment
Professional Skilledtechnical
Semiskilled
Limited
skillNo
response
Numberofparticipants
77 677 602 620 1419 230 924
Percentage of Total sample 1,7% 14,9% 13,2% 13,6% 31,2% 5,1% 20,3%
4.4 THE RESEARCH INSTRUMENT
The data was collected using a questionnaire containing 223 items to measure various
constructs relating to organisational climate and diversity.
67
4.4.1 Rationale and background
In the years 2000/2001 the Centre for Industrial and Organisational Psychology at
UNISA conducted research to assist an organisation to identify its climate.
A sample of 4549 employees from a listed retail organisation consisting of seven
subsidiary companies with branches all over South Africa participated in the survey.
This questionnaire was developed and validated in a study in 2003. Kays and Cotiis (as
cited in Martins & Von der Ohe, 2003) categorised various dimensions labels and
through this process, eight dimensions of the universe of psychological climate
perceptions were identified, namely autonomy, cohesion, trust, pressure, support,
recognition, fairness and innovation. Of the thirteen dimensions that emerged from the
factor analysis in Martins and Von der Ohe’s study, diversity items were found under
policies and procedures, fairness of organisational practices and employment equity
(Martins & Von der Ohe, 2003).
4.4.2 Objective of the research instrument
The overall objective of the research instrument was to validate an organisational
climate questionnaire that was adapted and used during a phase of organisational and
environmental change (Martins & Von der Ohe, 2003).
4.4.3 Contents of the questionnaire
The questionnaire consisted of two sections. Section 1 focused on organisational
climate dimensions. These dimensions were measured on a scale of 1 to 5, ranging
from 1 strongly disagree, 2 disagree, 3 unsure, 4 agree to 5 strongly agree. Section 2
focused on the biographical information of the participants, such as age, years of
service with the organisation, employment status, business unit/branch, gender, race
and disability.
68
4.4.4 Dimensions measured
Martins and Von der Ohe’s (2003) questionnaire measured thirteen dimensions of
climate which are discussed below.
• Management and leadership style: This dimension includes managerial
functions, such as coaching, role of senior management, means to achieve
objectives and information sharing.
e Policies and procedures: This dimension focuses on the fairness of a number of
policies and procedures, such as recruitment, selection, promotions, succession
planning, diversity, HIV/AIDS and retention. All these procedures can influence
perception of fairness and equality in an organisation.
9 Attracting and retaining: This dimension grouped all the aspects of the reasons
why people join a company and why they stay, such as equal opportunities,
management quality, job security, advancement opportunities and work/life
balance.
• Fairness of organisational practices: This dimension focuses on different issues
that may be perceived as fair/unfair in an organisation, such as equality, gender,
racism, affirmative action, discipline and grievances.
• Training and development: This dimension focuses on elements of training and
development, such as providing training programmes, career development and
the application of training.
• Organisational values: This dimension focuses on the values of the organisation.
• Work environment: This dimension focuses on working conditions and set-up of
work environment that may influence employees5 job satisfaction or
effectiveness.
9 Recognition and rewards: This dimension focuses on rewards for and recognition
of good performance.
69
• Teamwork: This dimension focuses on aspects that impact on effective
teamwork, such as team trust, co-operation and motivation.
• Strategic focus: This dimension focuses on the overall satisfaction with
organisational vision and mission and their alignment with departmental and
individual objectives.
• Performance management: This dimension measures satisfaction with all
aspects of performance management, such as the performance agreement,
understanding of the process of, and training in performance management.
• Employment equity: This dimension focuses on the expectations and implication
of employment equity and processes needed to support it, such as diversity
management.
• Discrimination concerning promotions: This dimension focuses on discrimination
relating to promotions of the different races, gender, disability and age groups.
4,4.5 Validity and reliability of the questionnaire
4.4.5.1 Validity
Whiston (2000:68) describes validity as “concern with what the instrument measures
and how well it does the task”. Harriman (1980: 211) describes validity as “the degree to
which a psychological test or measure actually predicts the criterion or whatever it is
intended to measure”. Validation is the process of improving the predictive values of a
test or measure (Harriman, 1980).
Factor analysis was conducted to assess whether the instrument/measurement
measures substantive constructs. The principal component analysis (PCA) was used
with the aim of identifying minimal set of factors that accounted for a major portion of the
total variance of the original items, and the intercorrelations matrix was rotated
according to the varimax methods (Martins & Von der Ohe, 2003). The results of the
principal components analysis (PCA) showed that only seven items of the 223 items
had factor loadings of lower than 0,30 (Martins & Von der Ohe, 2003). A second order
70
factor analysis was conducted on factor 1, and four sub-factors were identified with
eigenvalues of greater than 1,00 (Martins & Von der Ohe, 2003).
According to Hair, Anderson, Tathem and Black (1995), all factors with eigenvalues of
1,00 or greater should be retained. This was applied in the current study. The above
results indicate that the factors identified in this measurement are valid.
4A.5.2 Reliability
Whiston (2000) explains reliability as the degree to which an instrument’s scores are
free from errors of measurement. Harriman (1980) describes reliability as the extent to
which a test or series of observations is dependable, self-consistent and stable. The
reliability of this questionnaire was determined by means of item analysis, using
Cronbach’s Alpha coefficient (Martins & Von der Ohe, 2003). The reliability score
ranges from (0,00 to 1,00) and 1,00 being a perfect reliability (Whiston, 2000).
The internal consistency of the thirteen dimensions varies from 0,8566 to 0,9723 (see
table 4.6).
71
Table 4.6 Results of the item analysis for the second-order factors 1-4
Factor Sub-factor No of
questions
Cronbach’s
Alphacoefficient
Management 0 Leadership style 12 0,9424
and leadership 0 Trust 12 0,9382
style (factor 1) o Role of senior management 5 0,8307