The Relationship between Macroeconomic Factors and The Performance of Stock Market in Malaysia: The Case of Malaysia Industrial Product and Services Sector
To Link this Article: http://dx.doi.org/10.6007/IJARBSS/v11-i8/10581 DOI:10.6007/IJARBSS/v11-i8/10581
Received: 19 June 2021, Revised: 23 July 2021, Accepted: 04 August 2021
Published Online: 21 August 2021
In-Text Citation: (Ya’acob et al., 2021) To Cite this Article: Ya’acob, F. F., Akbar, A., Ghul, Z. H., Isamail, M. Z., & Mokhtar, N. A. (2021). The
Relationship between Macroeconomic Factors and The Performance of Stock Market in Malaysia: The Case of Malaysia Industrial Product and Services Sector. International Journal of Academic Research in Business and Social Sciences, 11(8), 1102-1116.
Published by Human Resource Management Academic Research Society (www.hrmars.com) This article is published under the Creative Commons Attribution (CC BY 4.0) license. Anyone may reproduce, distribute, translate and create derivative works of this article (for both commercial and non-commercial purposes), subject to full attribution to the original publication and authors. The full terms of this license may be seen at: http://creativecommons.org/licences/by/4.0/legalcode
Abstract For years, researchers have been studying the factors that influence stock market performance. Typically, it concentrates on Malaysia's macroeconomic conditions. The goal of this study is to close the gap by examining the elements that influence the stock market's production in Malaysia. More precisely, it includes real exchange rate, money supply, inflation rate inflation rate and US stock market in measuring their relationships with the performance of the Malaysian stock market price. This analysis attempts to expand the existing literature. It will focus on the industrial products and services sector and will collect Bursa Malaysia data as a dependent variable sample. World Bank Data were collected for independent variable data on monthly basis from 2016 until 2020. Based on the results, three out of four variables were found to be significant. Real exchange rate, money supply, and the performance of the US stock market were either substantially negative or positive in comparison to the performance of the Kuala Lumpur Industrial Product (KLIP) stock market. On the other hand, there was an insignificant relationship between the Kuala Lumpur Industrial Product (KLIP) stock market and inflation rate (CPI). Keywords: Stock Market, Cointegration Analysis, Macroeconomics.
International Journal of Academic Research in Business and Social Sciences
Introduction In recent decades, stock market research has remained one of the most important areas of study. The reason is that the stock market remains important not only for investors who want to accumulate money over time, but also for a country's economy, as it can serve as one of the primary indicators of a country's current and future economic state. The stock market is a critical role in promoting the development of a country's economy. Therefore, several analysts have highlighted that a country's stock market can act as an indicator to assess that country's economic growth. Many policymakers and investors conclude that a substantial fall in the stock market would lead to a potential recession (Farmer, R. E, 2015), while a drastic rise in the stock index represents potential growth in the economy. Recently, research has drawn attention to the volatility of the Kuala Lumpur Industrial Product (KLIP). The determinants of stock market performance are a subject on which empirical research has yet to agree. In other words, the extant empirical research does not agree on a list of elements that influence stock market performance. It is for this reason that understanding what factors influence stock market return is critical, as it has an impact on economic growth. Investors generally believed that macroeconomic events have a significant impact on stock price volatility. Macroeconomic determinants can be used by investors as a benchmark for predicting the stock market's performance, as well as a great way to learn more about the stock market's behaviour. This is related to the nature of ASEAN stock markets, which are susceptible to events such as the level of economic activity in transition. The type of macroeconomic forces has a considerable positive and negative impact on stock market performance, as evidenced by the behaviour of the variable itself. Some scholars, on the other hand, argue that macroeconomic changes have no effect on return, particularly in efficient markets. A recurring question among analysts and investors alike is the correlation between money supply and stock performance. There is a substantial body of research that explains monetary policy and stock market dynamics. Because stock prices are driven by predicted dividends and interest rates, any surprises in monetary policy are likely to affect stock prices (Laopodis, 2013). This is in sharp contrast to Friedman's (1956) argument that a rise in money supply does not always imply an increase in stock prices, because instability in the money market might be compensated by conditions in the real economy. On the other hand, the US occupies a significant role in the global economy. This may be attributed to the fact that the main foreign reserve currency among most central banks and governments around the world is the US dollar (Costigan & Keys, 2017). In light of this, investors around the globe are nervous about any news impacting the US stock market. Indeed, the world economy was critically impacted by the financial shock following the fall of the Lehman Brothers in 2008 as well as the COVID-19 pandemic. Although KLIP is not as liquid as the foreign exchange market, the downturn in the US stock market is still rampant in Malaysia's stock market. This means that the US stock market will have a huge effect on the success of the Malaysian stock market. The exchange rates became more volatile with the floating exchange rate and can be a source of destabilizing shocks rate following the fall of the Bretton Woods regime (Bergin et al, 2017) Currency risk has also risen due to the high uncertainty associated with floating exchange rates, and this is something that global investors need to take into consideration while investing in Malaysia. In addition, the exchange rate is one of the determinants of the
International Journal of Academic Research in Business and Social Sciences
performance of the Malaysian stock market since it could have a significant impact on the decision of foreign investment in Malaysia. The inflation rate expressed by the Consumer Price Index (CPI) reflects, in financial theory, an overall upward price trend of goods and services. Inflation occurs either as costs increase or when it takes more money to purchase the same goods. The rate of inflation would affect the volatility and risk of the stock market. While empirical study into what drives stock market performance has recently gotten a lot of attention, theoretical research on the topic is still in its infancy. The dynamics driving stock market success are difficult to capture since reality is complex. However, in order to conduct fruitful and well-focused future research, a framework for analysing those dynamics and developing a financial theory of stock market performance would be required. Because of the aforementioned reasons, the objective of this study is to determine the long-term link between macroeconomic factors and Kuala Lumpur Industrial Product stock performance. By understanding these elements, it will help the investors to predict the future movement of the stock. Furthermore, it will give the investors a certain income and increase their lifestyle. Indirectly, will give positive impact to the future economy. The success of the stock market may reflect Malaysia's expectations of the future economy. This indicates that it is significant for the state and policy makers to have a more detailed image in defining the interactions between selective criteria with stock market outcomes as they play an important role in managing the country's economic policies. To that end, it will increase the possibility that the stock market's actions can be accurately expected, and this will allow growth. Literature Review The stock market provides openings for long term investment by raising new capital. As a result, it provides investors with a variety of venture options in which to spend their excess capital. The market is viewed as a facilitator in achieving government objectives and encourages saving. The market is concerned about monetary policies that will aid in the reduction of inflation and other macroeconomic problems (Onyejiaku,. et al.,2020). Levine and Zervos (1998) claimed that stock market volatility and development played an important role in forecasting potential economic growth. There are many studies explaining the use of a macro-economic indicator to estimate stock market volatility. In the early days (Chen, Roll & Ross, 1986), research started on the relationship between economic forces and the effects of the stock market. They observed that inflation, economic production and return on shares provided the framework for a long-term balance due to their effect on current wages and interest rates. Moreover, the study by Corradi et al, (2013) found that Malaysia's stock market was the fifth largest market in Asia in terms of capitalization prior to the Asian financial crisis. In their study, the macroeconomic conditions could explain almost 75% of the swings in the stock market. Rahman et al. (2009), on the other hand, reported that the monetary policy variables had a major long-term impact on the stock market in Malaysia. Exchange Rate According to Dahir (2018), there is a positive relationship between exchange rates and stock returns in Brazil, Russia, India, China, and South Africa (BRICS). The results reveal that relationships between exchange rates and stock returns are positive in the medium and long term, indicating that exchange rates lead stock returns in Brazil and Russia. Moreover, exchange rate fluctuations are recognized to have effects on stock prices in either a positive or negative direction. Many events such as the US subprime crisis in 2007, the global financial
International Journal of Academic Research in Business and Social Sciences
crisis in 2008, and the European debt crisis in 2010, which affected exchange rates had an adverse impact on financial markets. Financial markets in most developed countries suffered substantial losses during those periods (Zolfaghari & Sahabi, 2017), which led to bankruptcies at several financial institutions after bank lending and liquidity collapsed (Caporale, Hunter, & Ali, 2014). There was a strong and important association between the exchange rate and the results of the stock market Kibria et al, (2014). If exchange rates were to increase, stock prices would likely rise. This result is consistent with the study undertaken by Mutuku and Ng'eny (2015). According to Reboredo et al (2016), the analysis has shown that stock markets and currency rates have a favourable relationship with the USD and the EUR, where home currencies appreciate as stock prices grow. This indicates favourable relationship between stock values and the value of the dollar and the euro. However, Moore & Wang (2014) found a negative relationship between the stock and foreign exchange markets. This is in line with research conduct by Ouma & Muriu, (2014); Laichena and Obwogi (2015); and Okech, & Mugambi, (2016) where they also observed that the effect of exchange rate on stock returns was significant and negative. According to Rosalynn (2018), the result of the study shows that rupiah exchange rate has positive and significant effect to CSPI (Consumer Stock Price Index). Similarly, an earlier study by Nurwani (2010) also establishes that the exchange rate of rupiah has a positive and significant impact on the movement of CSPI. Conversely, changes in stock prices may also affect exchange rates through the stock-oriented model of exchange rates. In the case of the stock-oriented model, there are two versions, namely the monetary model and portfolio balance model. The monetary model supports a positive relationship and also argues that the relationship is a monetary phenomenon. Hence, countries with higher stock returns are more likely to experience exchange rate depreciation while countries with lower stock returns may be susceptible to exchange rate appreciation. Under the assumption of the portfolio balance model, stock prices are expected to lead exchange rates and to be negatively correlated to them (Mustapha, et al, 2017) Money Supply (M2) In the case of India, Naik & Padhi (2012) looked into the relationship between the stock market index, money supply, an exchange rate. According to the findings, the variables had a long-run equilibrium relationship. The findings revealed that MS and the stock market index have a positive association. However, the study found no evidence of relationship between the stock market index and ER. In a separate study, Vejzagic & Zarafat (2013) looked at the impact of macroeconomic factors on the stock market index in Malaysia. Money supply has a considerable impact on the stock market index and has a beneficial influence on dependent stock market indexes. Meanwhile, Jamaludin et al (2017) discovered a positive but statistically insignificant relationship between stock market returns and money supply. As a result, money supply has no bearing on stock returns. In addition, Talla (2013) observed that the stock market returns of the Stockholm Stock Exchange were favourably connected to the money supply, but that the relationship was not significant. In Korea, Lee and Brahmasrene (2018) assess a study of the dynamical link between macroeconomic variables and stock prices. The study examines monthly data on the currency rate, money supply, industrial production, and inflation from January 1986 to October 2016. The Johansen co-integration and vector error correction model (VECM) was used in this study.
International Journal of Academic Research in Business and Social Sciences
The results indicate no significant long-run relationship between money supply and stock prices of Korea. In Germany, Abed and Zardoub (2019) investigate the relationship between macroeconomic variables and stock market values. From 1990 to 2016, the study uses an exchange rate, M3 aggregates, interest rate, and oil price on the stock market index. The Autoregressive Distributed Lag model is used in this investigation. The findings show a favourable but not statistically significant link between money supply and the stock market. Inflation Rate Following that, some analysts claim that the stock market and inflation rate have a negative relationship. The Limer test was used by Asayesh & Gharavi (2015) to show that there was a definite negative relationship between inflation and stock market performance over a ten-year period using panel data from ten firms. Some scholar, on the other hand, decided that the negative correlation between inflation and stock market performance was simply poor. There has been a minor negative correlation between the Consumer Price Index (CPI) and the success of China's stock market as a result of government involvement (Bai, 2014). Uwubanmwen & Eghosa, (2015) support this claim, claiming that inflation is negatively and weakly related to stock prices. To put it another way, the rate of inflation was not a reliable predictor of Nigeria's stock return. In the long run, according to Chia & Lim (2015), money supply and interest rates have a beneficial impact on Malaysian business share prices, however inflation has a negative impact. Kaur, (2015) and Subramanian, (2015), on the other hand, found a positive association between the rate of inflation and the success of the stock market. The finding is in line with Arouri et al (2015). They came to the conclusion that inflation would not have a long-term impact on Pakistan's asset prices. The assertion was valid when the CPI was taken into account and without expecting the consumer price index. In addition, the researchers looked into the relationship between macroeconomic issues and the stock market in the United States. By comparing the CPI to the Dow Jones Index, they discovered that inflation has a positive impact on US stock market performance (Jareo & Negrut, 2016). By examining the Dow Jones Index CPI, they discovered that inflation had a positive impact on US stock market output. According to Rosalynn (2018), the analysis demonstrates that rupiah inflation has a negative and minor effect on the CSPI. This is in line with the findings of Taufiq and Kefi (2015), who found that inflation had a negative and significant impact on the CSPI. In short, inflation has a significant impact on the economy. According to Marunung (2016), inflation is a tendency to raise prices persistently or can be understood as a fall in the overall worth of money; the higher the price increases, the lower the overall value of money. Putri (2016) discovered that inflation in the period of 2011-2013 had a negative and minor effect on the CSPI (Composite Stock Price Index). This is because rising inflation sends a negative signal to investors, who are less likely to participate in capital markets and are more likely to release shares in favour of safer investments such as savings or deposits. As a result, transferring investments to other forms will force investors to sell, decreasing stock prices and the CSPI. US Stock Market Several studies have been conducted to investigate the relationship between a country's financial exchange and the stock market in the United States (Graham et al., 2012; Azizan & Sulong, 2011; Sharma, 2011; Chan et al., 2010). Overall, this research unsuccessful to reach
International Journal of Academic Research in Business and Social Sciences
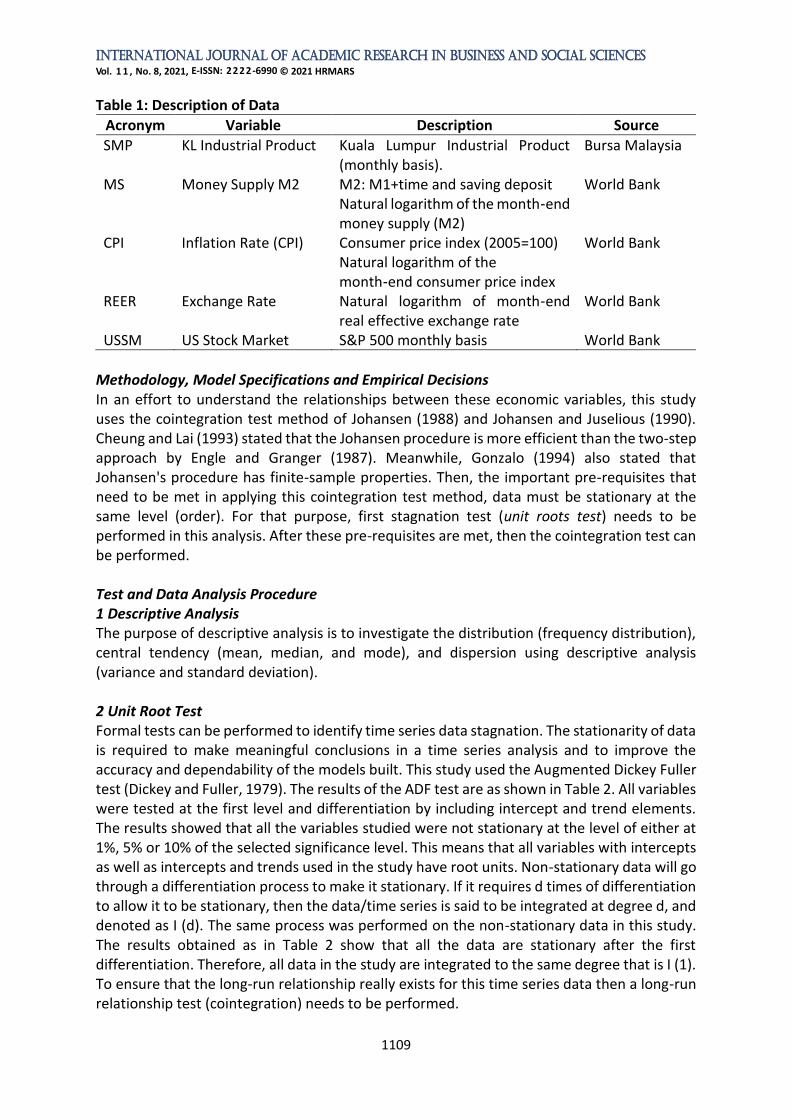
an agreement on the country's stock market's relationship with the US stock market. There are many different perspectives on this relationship. Firstly, research has shown that the Malaysian stock market is linked to the US stock market. After examining the macroeconomic variables of Asian countries and the United States on the Malaysian stock market, Azizan & Sulong (2011) discovered that only the stock price and exchange rate of other countries had a relationship with the Malaysian stock price. The Malaysian stock market, in fact, was more resilient to changes in the Chinese stock market than the US stock market. In addition, Teng et al (2013) found that the ASEAN-5 stock market was closely integrated with the US and Japanese stock markets in terms of finance, by utilising monthly data from January 1991 to June 2010. Indeed, an upward trend in financial convergence between ASEAN-5 and developing and developed countries has been noted. Chan et al (2010) endorse their analysis. However, Chan et al (2010) suggested that the US stock market had more impact on the ASEAN-5 stock market than Japan, using daily data from March 1991 to December 2007. In addition, the Pearson Correlation-based analysis found a substantial association at a value of 0.01 between the emerging Asian and U.S. stock markets (Sharma, 2011). Based upon the literature reviewed, the current study develops the following hypotheses: H1: There is a significant association between ER and stock market performance H2: There is a significant association between MS and stock market performance H3: There is a significant association between CPI and stock market performance H4: There is a significant association between USSM and stock market performance Methodology and Empirical Results Data This study adopts time series data over a period of five years across the Kuala Lumpur Industrial Product (SMP). The main data sources include World Bank data and Bursa Malaysia. In this research paper, 60 observations and monthly data based on January 2016 to December 2020 were used after adjustment by using Eviews. The study is conducted in the context of Kuala Lumpur Industrial Product (SMP). In this study, stock price indices are used as a proxy for stock market returns and are considered as the dependent variable. Since it is impossible to analyse every plausible macroeconomic driver to explain stock market return variation, three macroeconomic determinants, namely money supply (MS), real exchange rate (REER), inflation rate where this study used Consume Price Index (CPI) as a proxy for inflation rate, and US stock market (USSM) have been chosen as independent variables in this study. All of these variables are adjusted in logarithmic form. The data for this study which are obtained from World Bank data and Bursa Malaysia. The data description and its sources are outlined in Table 1.
International Journal of Academic Research in Business and Social Sciences
SMP KL Industrial Product Kuala Lumpur Industrial Product (monthly basis).
Bursa Malaysia
MS Money Supply M2 M2: M1+time and saving deposit Natural logarithm of the month‑end money supply (M2)
World Bank
CPI Inflation Rate (CPI) Consumer price index (2005=100) Natural logarithm of the month‑end consumer price index
World Bank
REER Exchange Rate Natural logarithm of month‑end real effective exchange rate
World Bank
USSM US Stock Market S&P 500 monthly basis World Bank
Methodology, Model Specifications and Empirical Decisions In an effort to understand the relationships between these economic variables, this study uses the cointegration test method of Johansen (1988) and Johansen and Juselious (1990). Cheung and Lai (1993) stated that the Johansen procedure is more efficient than the two-step approach by Engle and Granger (1987). Meanwhile, Gonzalo (1994) also stated that Johansen's procedure has finite-sample properties. Then, the important pre-requisites that need to be met in applying this cointegration test method, data must be stationary at the same level (order). For that purpose, first stagnation test (unit roots test) needs to be performed in this analysis. After these pre-requisites are met, then the cointegration test can be performed. Test and Data Analysis Procedure 1 Descriptive Analysis The purpose of descriptive analysis is to investigate the distribution (frequency distribution), central tendency (mean, median, and mode), and dispersion using descriptive analysis (variance and standard deviation). 2 Unit Root Test Formal tests can be performed to identify time series data stagnation. The stationarity of data is required to make meaningful conclusions in a time series analysis and to improve the accuracy and dependability of the models built. This study used the Augmented Dickey Fuller test (Dickey and Fuller, 1979). The results of the ADF test are as shown in Table 2. All variables were tested at the first level and differentiation by including intercept and trend elements. The results showed that all the variables studied were not stationary at the level of either at 1%, 5% or 10% of the selected significance level. This means that all variables with intercepts as well as intercepts and trends used in the study have root units. Non-stationary data will go through a differentiation process to make it stationary. If it requires d times of differentiation to allow it to be stationary, then the data/time series is said to be integrated at degree d, and denoted as I (d). The same process was performed on the non-stationary data in this study. The results obtained as in Table 2 show that all the data are stationary after the first differentiation. Therefore, all data in the study are integrated to the same degree that is I (1). To ensure that the long-run relationship really exists for this time series data then a long-run relationship test (cointegration) needs to be performed.
International Journal of Academic Research in Business and Social Sciences
Note: ***, ** and * were significant at 1%, 5% and 10%. Note: SMP = KL Industrial Product, MS = Money Supply, CPI = Inflation Rate, REER = Exchange Rate, USSM = US Stock Market. Cointegration Test The cointegration test pioneered by Johansen (1988) and Johansen and Juselious (1990) was used in this study. From this test, the number/cointegration vector obtained means that there is a long -run relationship between the variables selected in the study. This number/vector is based on two Likelihood Ratio tests, namely statistical trace (λtrace) and maximal eigenvalue (λmax). Before the cointegration test is performed it is important to first determine the optimal latency used. This study adopted the AIC criteria. Based on the AIC criteria, the optimal latency for the cointegration test for each variable LSMP (1), LREER (2), LMS (3), LCPI (4), LUSSM (5). From Table 3, both the trace and maximum tests recognize one cointegration equation at 0.05 level. That is, their values are higher than their critical values at the null hypothesis of no cointegration. As a result, the null hypothesis of no cointegration is rejected, and the alternative hypothesis of one cointegration equation is preferred.
Table 3: Johansen dan Juselious Trace λtrace, maximum eigenvalue λmax λtrace
No. of CE(S) Trace Statistic (λtrace)
0.05 Critical Value (Trace)
Max-Statistic (λmax)
0.05 Critical Value (Max)
None * 85.9740 95.7537 41.3588 40.0776 At Most 1 44.6153 95.7537 19.0281 33.8769 At Most 2 25.5872 47.8561 13.6209 27.5843 At Most 3 11.9663 29.7971 7.1205 21.1316 At Most 4 4.8458 15.4947 3.7346 14.2646 At Most 5 1.1112 3.8415 1.1112 3.8415
Note: λtrace indicates the number (rank) of cointegration among the variables. λmax indicates the number (rank) of cointegration among the variables.
Trace and Max tests identified the existence of 1 cointegration equation at the 5% degree of significance level.
Multiple Linear Regression (MLR) The time series analysis was carried out using a multiple regression model. It was able to analyse the impact of macroeconomic factors on stock returns in Malaysia using time series analysis. The following are the specification models used in this study:
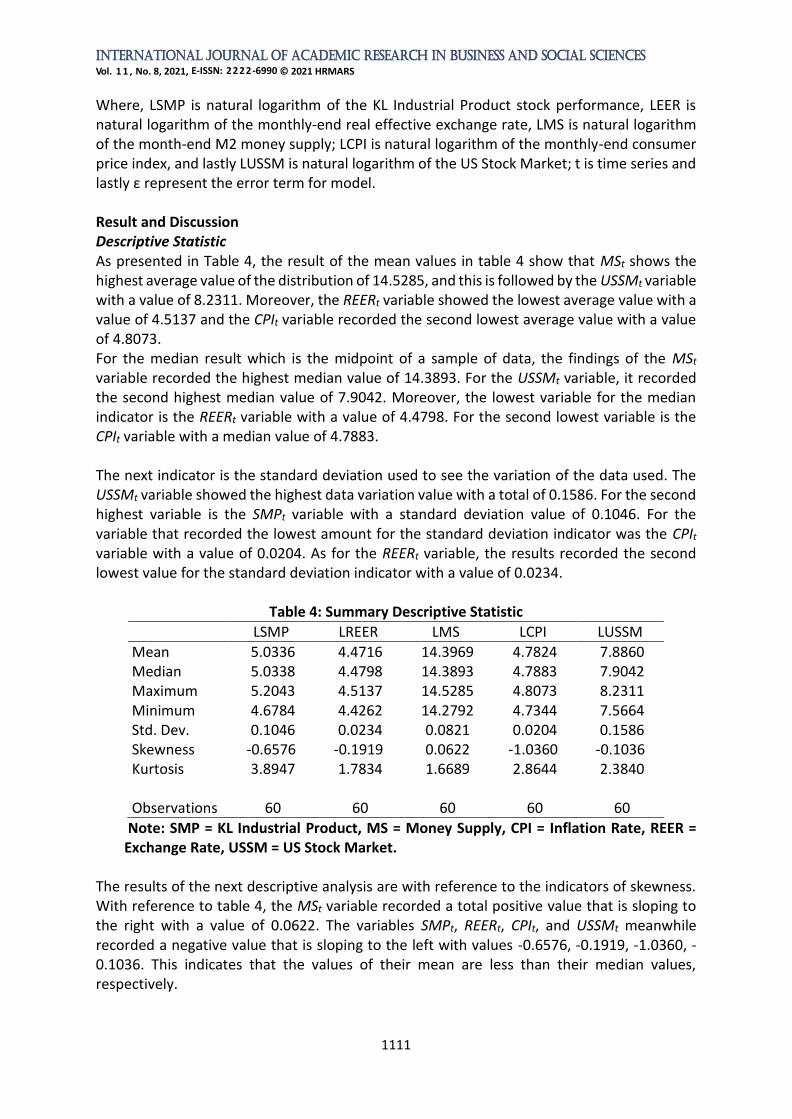
Where, LSMP is natural logarithm of the KL Industrial Product stock performance, LEER is natural logarithm of the monthly-end real effective exchange rate, LMS is natural logarithm of the month-end M2 money supply; LCPI is natural logarithm of the monthly-end consumer price index, and lastly LUSSM is natural logarithm of the US Stock Market; t is time series and lastly ε represent the error term for model. Result and Discussion Descriptive Statistic As presented in Table 4, the result of the mean values in table 4 show that MSt shows the highest average value of the distribution of 14.5285, and this is followed by the USSMt variable with a value of 8.2311. Moreover, the REERt variable showed the lowest average value with a value of 4.5137 and the CPIt variable recorded the second lowest average value with a value of 4.8073. For the median result which is the midpoint of a sample of data, the findings of the MSt variable recorded the highest median value of 14.3893. For the USSMt variable, it recorded the second highest median value of 7.9042. Moreover, the lowest variable for the median indicator is the REERt variable with a value of 4.4798. For the second lowest variable is the CPIt variable with a median value of 4.7883. The next indicator is the standard deviation used to see the variation of the data used. The USSMt variable showed the highest data variation value with a total of 0.1586. For the second highest variable is the SMPt variable with a standard deviation value of 0.1046. For the variable that recorded the lowest amount for the standard deviation indicator was the CPIt variable with a value of 0.0204. As for the REERt variable, the results recorded the second lowest value for the standard deviation indicator with a value of 0.0234.
Note: SMP = KL Industrial Product, MS = Money Supply, CPI = Inflation Rate, REER = Exchange Rate, USSM = US Stock Market.
The results of the next descriptive analysis are with reference to the indicators of skewness. With reference to table 4, the MSt variable recorded a total positive value that is sloping to the right with a value of 0.0622. The variables SMPt, REERt, CPIt, and USSMt meanwhile recorded a negative value that is sloping to the left with values -0.6576, -0.1919, -1.0360, -0.1036. This indicates that the values of their mean are less than their median values, respectively.
International Journal of Academic Research in Business and Social Sciences
For the peak indicator (kurtosis), the CPIt variable shows a horizontal distribution relative to the normal distribution because its value is close to three. Meanwhile, the variables SMPt, REERt, MSt and USSMt have distributions far from the value of three, so the data are not normally distributed. Long Run Relationship Table 5 summarized the results from fitting model as described in equation above. The results indicated that the value of R2 is equal to 0.8737 which means that 87.37 percent variation of conventional stock market returns can be explained by total variation in selected explanatory variables. Additionally, the presented models are free from the presence of autocorrelation after doing the remedies to remove the problem by lagged the dependent variable. Thus, the specification models for KL Industrial Product stock performance employed in this study should be written as follows: LSMPt = 21.1771 – 0.4367LREERt – 1.0772LMSt – 0.8058LCPIt + 0.5620LUSSMt + ε To study the relationship between macroeconomic determinants and stock market performance, six hypotheses have been developed. Table 5 shows the long run relationship coefficient for all variables in this study.
Note: ***, ** and * were significant at 1%, 5% and 10%, respectively. Note: SMP = KL Industrial Product, MS = Money Supply, CPI = Inflation Rate, REER = Exchange Rate, USSM = US Stock Market. As presented in Table 5, the hypothesis testing analysis of H1 revealed that the relationship between LREER and stock market returns is negatively and statistically significant at 10% level of significance. As a result, the alternate hypothesis H1 is accepted. This finding is cons istent with the findings of Gul & Khan (2013) and Khodaparasti (2014), who discovered a positive significant relationship between ER and stock market returns. The reason for this is because when the currency appreciates, the price of imported inputs, which make up a substantial portion of the country's factor inputs, decreases. It also results in an increase in reserve, money supply, and a decrease in interest rates. This decreases production costs, resulting in more company activity and, as a result, higher stock returns. The hypothesis testing analysis of H2 indicated that the relationship of stock market returns and MS is negatively and statistically significant at 1% level of significance. Therefore, the
International Journal of Academic Research in Business and Social Sciences
alternate hypothesis, H1 is accepted even though money supply impacts negatively on stock performance. Several studies such as Cornell (1983), Pearce & Roley (1985), Sellin (2001), and Frimpong (2009) have found an inverse relationship between stock return and money supply in earlier research. Cornell (1983) used the risk premium as a factor in explaining the relationship between money supply and equities return. As a result, a rise in money demand signals greater risk, prompting investors to demand a larger risk premium for equities, resulting in a drop in stock prices. Furthermore, an increase in the money supply causes inflation and the discount rate to rise, causing stock prices to decline. The hypothesis testing analysis of H3 showed that there is an insignificant association between LCPI and stock market performance in industrial product and services sector. The result revealed that there was an insignificant negative relationship between CPI as a proxy for inflation rate toward the stock market performance. Thus, the alternate hypothesis H3 is rejected. This means that LCPI does not give any influence on the stock performance. The hypothesis testing analysis of H4 showed that there is a positive and statistically significant association between USSM and stock market performance in Kuala Lumpur industrial product and services sector. Thus, the alternate hypothesis, H4 is accepted. This is supported by Azizan & Sulong, (2011) who found that after investigating the macroeconomic variables of Asian countries and the U.S. with the Malaysian stock market, only the stock price and exchange rate of other countries had a relationship with the Malaysian stock price. Conclusion and Recommendation The main objective of this study is to examine the relationship between the selective variables of macroeconomics namely real exchange rate, money supply, inflation rate (CPI) and US stock market towards Kuala Lumpur Industrial Product (KLIP). It showed from the outcome that three variables were significant, while only one variable was not. More precisely, real exchange rate, money supply, and the performance of the US stock market were substantially negative or positive in comparison to the performance of the KLIP stock market. On the other hand, there was an insignificant relationship between the Malaysian stock market output and inflation rate (CPI). The experience and thorough comprehension of selective variables is one of the main accomplishments for investors to achieve their optimal returns on their investments. This is partially due to stock market volatility, as the market frequently reacts, often for illogical reasons, to shifts in selective determinants. Thus, before investing in the stock market, it is important for investors to take note of the selective factors involved in this analysis. Furthermore, there is no consensus, based on the empirical results of previous researchers, on how selective variables can affect the performance of the stock market. However, by introducing the performance of the US stock market as one of the variables in the model, this research will provide another prospective outcome. In other words, this research could further play a role as a guide for future researchers investigating the determinants of Malaysia's stock market performance. Numerous suggestions for further research have been made. First, including numerous other aspects and studying for a longer length of time may improve the study's outcomes. It is advised to add more macroeconomic determinants, such as the index of industrial production, interest rate, bank credit, and crude palm oil price to the analysis.
International Journal of Academic Research in Business and Social Sciences
References Arouri, M. E. H., Lahiani, A., & Nguyen, D. K. (2015). World Gold Prices and Stock Returns in
China: Insights for Hedging and Diversification Strategies. Economic Modelling, 44, 273-282.
Asayesh, H., & Gharavi, M. Z. (2015). The Impact of Inflation on Stock Prices with Panel Data (Case Study: Tehran Stock Exchange). International Journal of Administration and Governance., 1(9), 6-11.
Azizan, N. A., & Sulong, H. (2011). The Preparation Towards ASEAN Exchange Link Between Malaysia Stock Market and Asia Countries Macroeconomics Variables Interdependency. International Journal of Business and Social Science, 2(5), 127-134.
Bergin, P. R., Glick, R., & Wu, J. L. (2017). “Conditional PPP” and Real Exchange Rate Convergence in The Euro Area. Journal of International Money and Finance, 73, 78-92.
Cheung, Y. W., & Lai, K. S. (1993). Finite-Sample Size of Johansen’s Likelihood Ratio Test for Cointegration. Oxford Bulletin of Economics and Statistics 55, 313-328.
Chia, R. C. J., & Lim, S. Y. (2015). Malaysian Stock Price and Macroeconomic Variables: Autoregressive Distributed Lag (ARDL) Bounds Test. Kajian Malaysia: Journal of Malaysian Studies, 33.
Corradi, V., Distaso, W., & Mele, A. (2013). Macroeconomic Determinants of Stock Volatility and Volatility Premiums. Journal of Monetary Economics, 60(2), 203-220.
Cornell, B. (1983). The Money Supply Announcements Puzzle: Review and Interpretation. The American Economic Review, 73(4), 644-657.
Costigan, T., Cottle, D., & Keys, A. (2017). The US Dollar as The Global Reserve Currency: Implications for US Hegemony. World Review of Political Economy, 8(1), 104-122.
Dahir, A. M., Mahat, F., Ab Razak, N. H., & Bany-Ariffin, A. N. (2018). Revisiting The Dynamic Relationship Between Exchange Rates and Stock Prices in BRICS Countries: A Wavelet Analysis. Borsa Istanbul Review, 18(2), 101-113.
Du, J., Wang, J. N., Hsu, Y. T., & Lai, K. K. (2018). The Importance of Hedging Currency Risk: Evidence from CNY and CNH. Economic Modelling, 75, 81-92.
Engle, R. F., & Granger, C. W. J. (1987). Cointegration And Error Correction: Representation, Estimation and Testing. Econometrica 55, 251-276.
Farmer, R. E. (2015). The Stock Market Crash Really Did Cause the Great Recession. Oxford Bulletin of Economics and Statistics, 77(5), 617-633.
Friedman. (1956). M. Friedman. The Quantity Theory of Money–A Restatement, Reprinted from Studies in the Quantity Theory of Money University of Chicago Press (1956)
Friedman, M. (1988). Money and the stock market. Journal of Political Economy, 96(2), 221-245.
Frimpong, J. M. (2009). Economic Forces and The Stock Market in A Developing Economy: Cointegration Evidence from Ghana. European Journal of Economics, Finance and Administrative Sciences, 16: 123-135.
Gonzalo, J. (1994). Comparison of Five Alternative Methods of Estimating Long Run Equilibrium Relationship. Journal of Econometrics 60, 203-233.
Gul, S., Khan, M. T., Saif, N., Rehman, S. U., & Roohullah, S. (2013). Stock market reaction to political events (Evidence from Pakistan). Journal of Economics and Sustainable Development, 4(1), 165-174.
Jamaludin, N., Ismail, S., & Ab Manaf, S. (2017). Macroeconomic Variables and Stock Market Returns: Panel Analysis from Selected ASEAN Countries. International Journal of Economics and Financial Issues, 7(1).
International Journal of Academic Research in Business and Social Sciences
Jareño, F., & Negrut, L. (2016). US Stock Market and Macroeconomic Factors. Journal of Applied Business Research (JABR), 32(1), 325-340.
Johansen, A., & Juselious. (1990). Maximum Likelihood Estimation and Inference on Cointegration with Application to The Demand for Money. Oxford Bulletion of Economics and Statistics 52, 169-209.
Johansen, S. (1988). Statistical Analysis of Cointegration Vectors. Journal of Economic Dynamics and Control 12, 231-254.
Khodaparasti, R. B. (2014). The Role of Macroeconomic Variables in The Stock Market in Iran. Polish Journal of Management Studies, 10.
Kibria, U., Mehmood, Y., Kamran, M., Arshad, M. U., Perveen, R., & Sajid, M. (2014). The Impact of Macroeconomic Variables on Stock Market Returns: A Case of Pakistan. Research Journal of Management Sciences. ISSN, 2319, 1171.
Laopodis, N. T. (2013). Monetary Policy and Stock Market Dynamics Across Monetary Regimes. Journal of International Money and Finance, 33, 381-406.
Laichena, K. E., & Obwogi, T. N. (2015). Effects of Macroeconomic Variables on Stock Returns in the East African Community Stock Exchange Market. International Journal of Education and Research, 3(10).
Levine, R., & Zervos, S. (1998). Stock Markets, Banks, and Economic Growth. American Economic Review, 537-558.
Moore, T., & Wang, P. (2014). Dynamic Linkage Between Real Exchange Rates and Stock Prices: Evidence from Developed and Emerging Asian Markets. International Review of Economics & Finance, 29, 1-11.
Mutuku, C., & Ng’eny, K. L. (2015). Macroeconomic variables and the Kenyan equity market: A Time Series Analysis. Business and Economic Research, 5(1), 1-10.
Mustapha, I. M., and Masih, M. (2017). Dynamics Of Islamic Stock Market Returns and Exchange Rate Movements in the ASEAN Countries in a Regime-Switching Environment: Implications for the Islamic Investors and Risk Hedgers.
Naik, P. K., & Padhi, P. (2012). Interaction of Macroeconomic Factors and Stock Market Index: Empirical Evidence from Indian Data. Available at SSRN 2150208.
Okech, T. C., & Mugambi, M. (2016). Effect of Macroeconomic Variables on Stock Returns of Listed Commercial Banks in Kenya
Ouma, W. N., & Muriu, P. (2014). The Impact of Macroeconomic Variables on Stock Market Returns in Kenya. International Journal of Business and Commerce, 3(11), 1-31.
Igoni, S., Onyejiaku, C. C., Egbo, P. O., Ifediora, C., Njoku, O. B., & Onwumere, J. U. J. (2020). Critical Evaluation of Stock Market Capitalization Response to Money Supply Management in The Nigerian Economy. International Journal of Advanced Science and Technology, 26(12s), 2433-2454.
Rahman, A. A., Sidek, N. Z. M., & Tafri, F. H. (2009). Macroeconomic Determinants of Malaysian Stock Market. African Journal of Business Management, 3(3), 095-106.
Reboredo, J. C., Rivera-Castro, M. A., & Ugolini, A. (2016). Downside and Upside Risk Spillovers Between Exchange Rates and Stock Prices. Journal of Banking & Finance, 62, 76-96.
Rosalyn, A. M. (2018). The Effect of Rupiah Exchange Rate and Inflation Rate Towards Composite Stock Price Index in Indonesia Stock Exchange,6(78)
Sellin, P. (2001). Monetary Policy and the Stock Market: Theory and Empirical Evidence. Journal of Economics Surveys, 15, 4, 491-541.
Sharma, V. (2011). Stock Returns and Product Market Competition: Beyond Industry Concentration. Review of Quantitative Finance and Accounting, 37(3), 283-299.
International Journal of Academic Research in Business and Social Sciences
Talla, J. T. (2013). Impact Of Macroeconomic Variables on The Stock Market Prices of The Stockholm Stock Exchange (OMXS30). Jonkoping International Business School, 01-48.
Teng, K. T., Yen, S. H., & Chua, S. Y. (2013). The Synchronisation of ASEAN-5 Stock Markets with The Growth Rate Cycles of Selected Emerging and Developed Economies. Margin: The Journal of Applied Economic Research, 7(1), 1-28.
Tiwary, A. R. (2019). Study Of Currency Risk and The Hedging Strategies. Journal of Advanced Studies in Finance (JASF), 10(19), 45-55.
Uwubanmwen, A., & Eghosa, I. L. (2015). Inflation Rate and Stock Returns: Evidence from the Nigerian stock market. International journal of business and social science, 6(11), 155-167.
Vejzagic, M., & Zarafat, H. (2013). Relationship Between Macroeconomic Variables and Stock Market Index: Cointegration Evidence from FTSE Bursa Malaysia Hijrah Shariah Index. Asian Journal of Management Sciences & Education, 2(4).